


Características


¿Tienes alguna pregunta?
Recomendar


5 diapositivas
SEO and Funnel Tactics in Marketing Presentation
Showcase your digital strategy step-by-step with the SEO and Funnel Tactics in Marketing Presentation. Designed with a layered visual layout, this template helps you highlight up to five key stages of your marketing funnel—from awareness to conversion. Fully customizable in PowerPoint, Canva, Keynote, and Google Slides.


5 diapositivas
Business Investment in Africa Map Presentation
Explore promising markets with the "Business Investment in Africa Map" template, designed to provide a visual overview of investment opportunities across the continent. It features a map with marked regions, each linked to specific data points about business prospects. Ideal for investors or companies looking at market penetration or expansion within Africa, this layout helps in making data-driven decisions by providing a clear, concise visual representation of key information.


7 diapositivas
RAPID Profit Matrix Infographic
Delve into the systematic world of decision-making with our RAPID Matrix infographic. Cloaked in the trustworthiness of blue tones and complemented by the proactive energy of green, our template elucidates the RAPID framework—Recommend, Agree, Perform, Input, Decide—in an engaging and comprehensible manner. Adorned with exact infographics, distinct icons, and tailored image placeholders, it demystifies roles and responsibilities within decision-making processes. Perfectly calibrated for Powerpoint, Keynote, or Google Slides. An invaluable tool for project managers, business leaders, or any team seeking clarity in its decision-making process. Engage, clarify, and execute with precision.


21 diapositivas
Fahrenheit Scientific Research Presentation
Present your findings with clarity using this scientific research presentation template. Designed for researchers, it includes sections for objectives, methodology, data analysis, results, and recommendations. Perfect for academic and professional use, this template ensures a polished, organized presentation and is fully compatible with PowerPoint, Keynote, and Google Slides.


23 diapositivas
Naiad Qualitative Research Findings Presentation
Dive into your data with this refreshing, Naiad-inspired presentation template, perfect for sharing qualitative research findings! Designed to showcase insights, trends, and key conclusions with clarity, this visually appealing layout ensures your research captivates and informs. Make your data flow effortlessly. Compatible with PowerPoint, Keynote, and Google Slides for easy customization.


8 diapositivas
TAM SAM SOM Market Analysis Presentation
Define Your Market Potential Clearly with this TAM SAM SOM Market Analysis Presentation template. Designed to break down Total Addressable Market (TAM), Serviceable Available Market (SAM), and Serviceable Obtainable Market (SOM), this structured layout helps startups, investors, and business analysts showcase market opportunities and growth potential. Fully customizable and compatible with PowerPoint, Keynote, and Google Slides, this template is perfect for fundraising pitches, strategic planning, and competitive analysis.


4 diapositivas
Team Performance Improvement Plan Presentation
Bring strategy to life with a clean, focused layout that makes team growth easy to follow. This template helps visualize performance gaps, goals, and action steps in a simple format, perfect for outlining improvement plans and productivity initiatives. Fully editable in PowerPoint, Keynote, and Google Slides for seamless team collaboration.


4 diapositivas
4-Quadrant RACI Chart Slide Presentation
Bring structure and clarity to your workflow with a bold, pyramid-style layout that makes responsibilities instantly understandable. This presentation helps teams outline who leads, supports, approves, and informs across key tasks, turning complex processes into a clean visual map. Fully editable and compatible with PowerPoint, Keynote, and Google Slides.


5 diapositivas
Timeline-Based Year-End Recap Presentation
Summarize milestones with the Timeline-Based Year-End Recap Presentation. This structured, column-based layout allows you to compare achievements across multiple years in a clear, organized format. Each year is color-coded and paired with icons and editable label sections to highlight key points. Ideal for annual reports, strategic reviews, and progress tracking. Fully editable in PowerPoint, Google Slides, and Canva.


8 diapositivas
Business Lifecycle Circle Format Presentation
Present your business stages with clarity using this lifecycle circle diagram. Ideal for showcasing four key phases—planning, execution, growth, and review—in a circular format that emphasizes continuity. Each section includes icons and editable text. Fully customizable in PowerPoint, Keynote, or Google Slides for strategy meetings, reports, or progress updates.


23 diapositivas
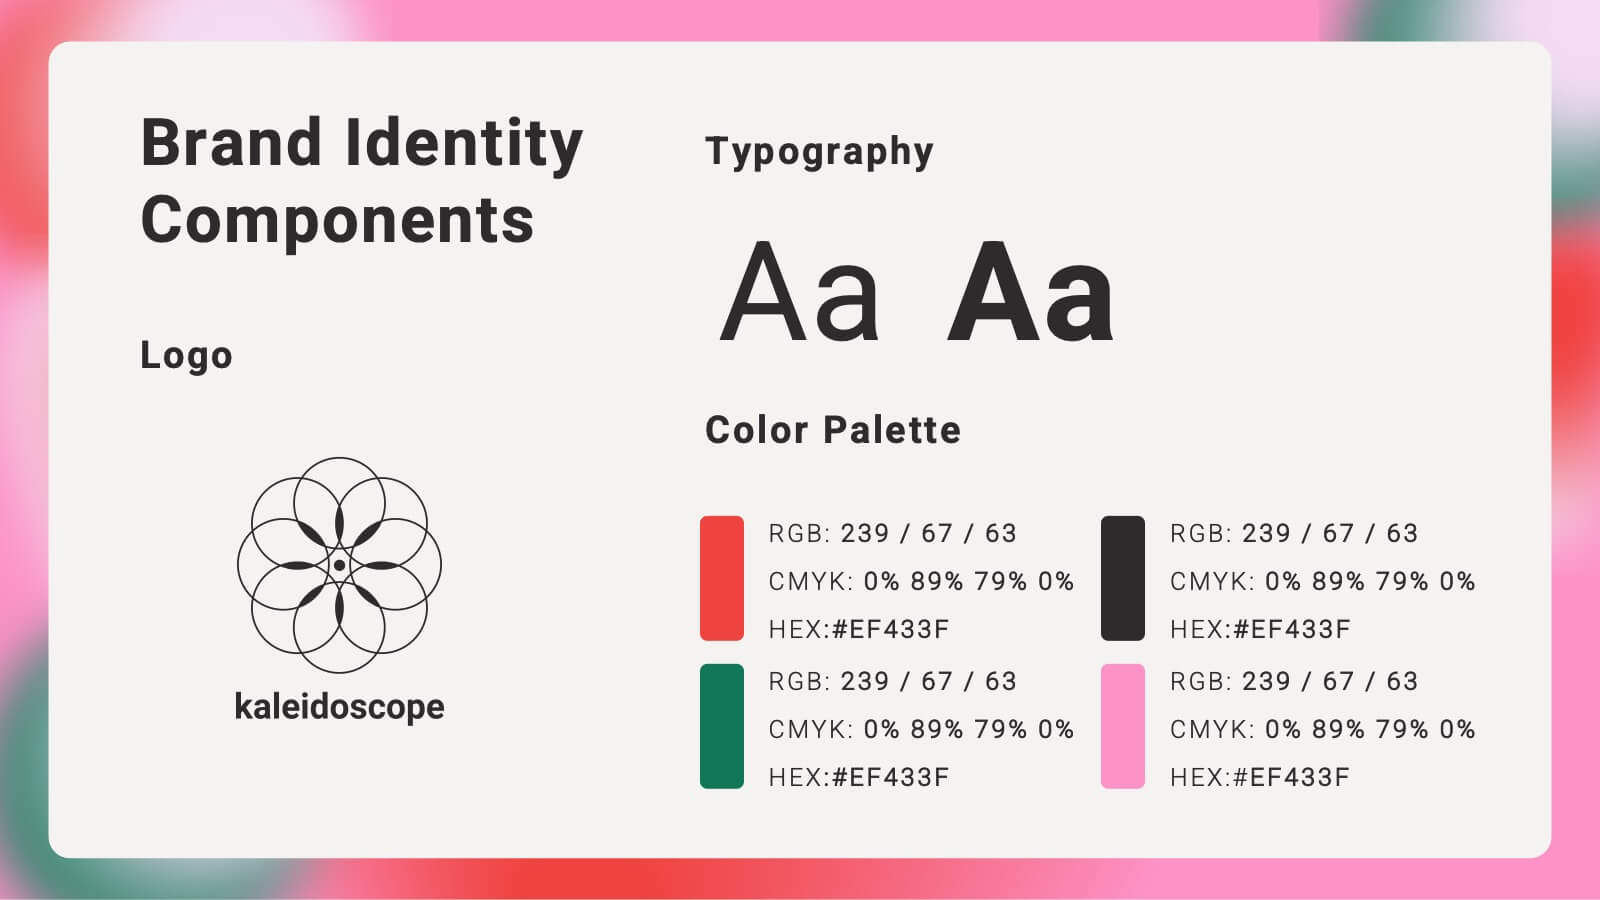
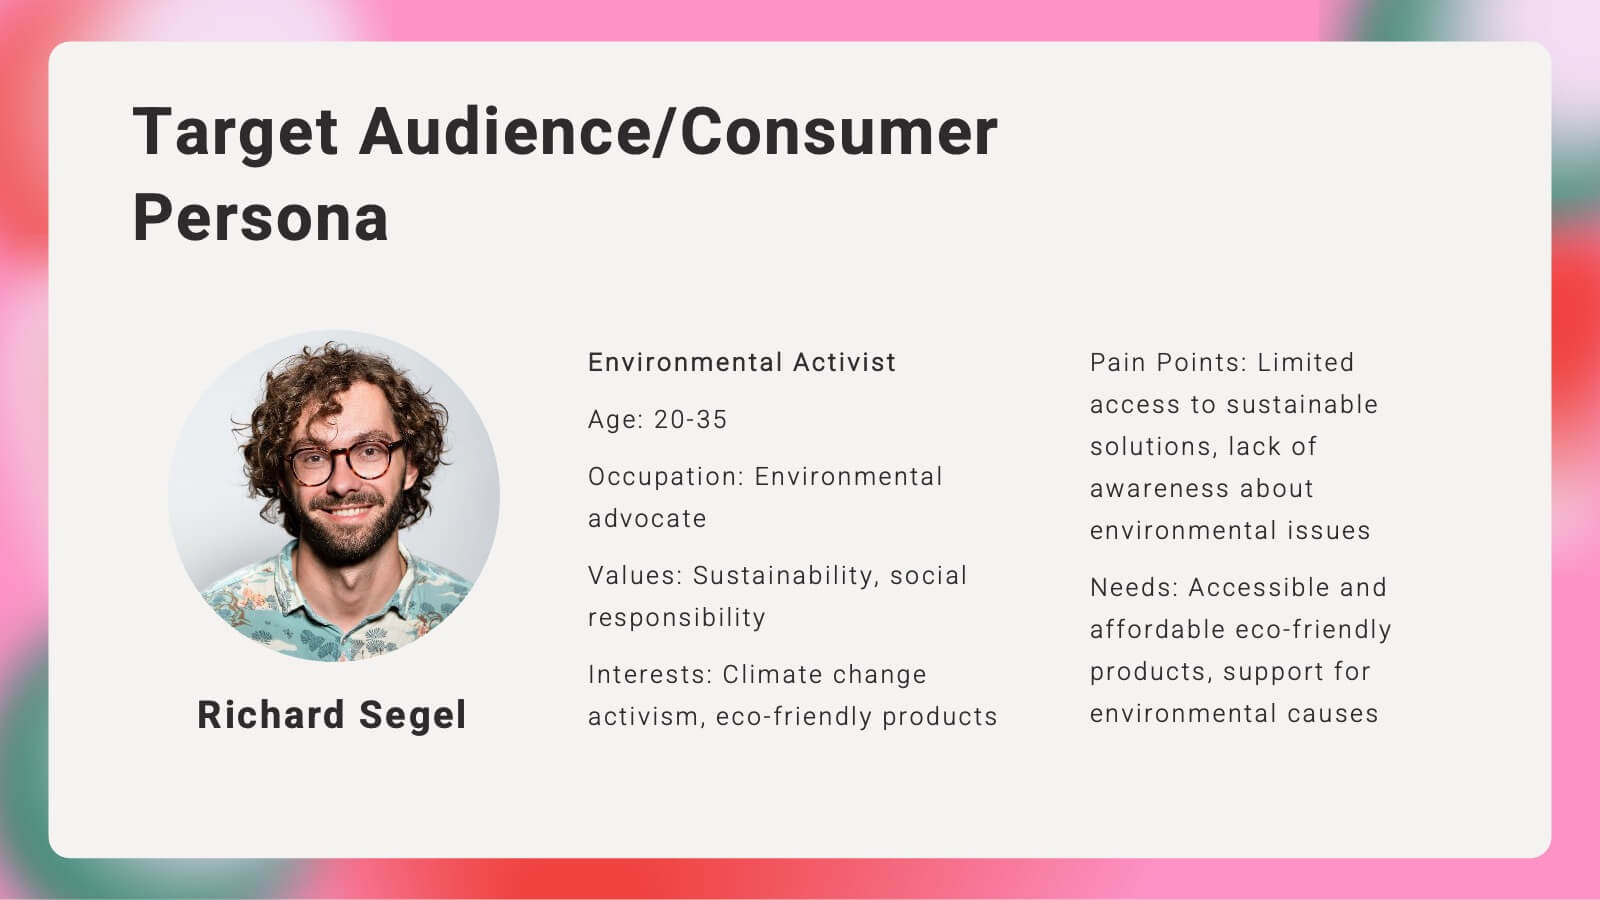
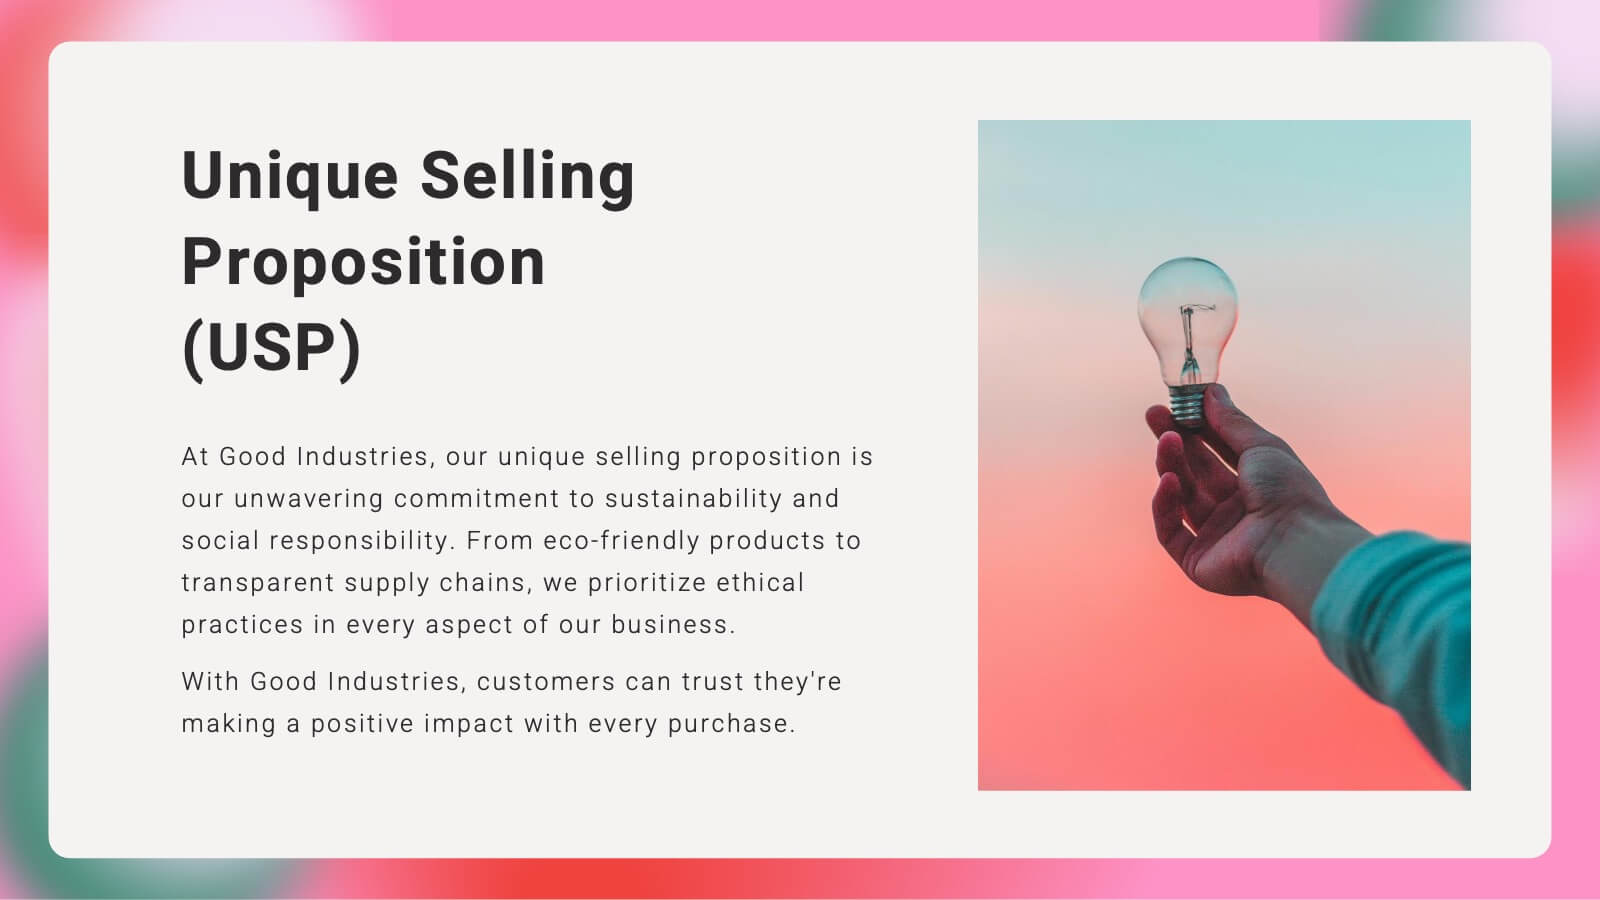
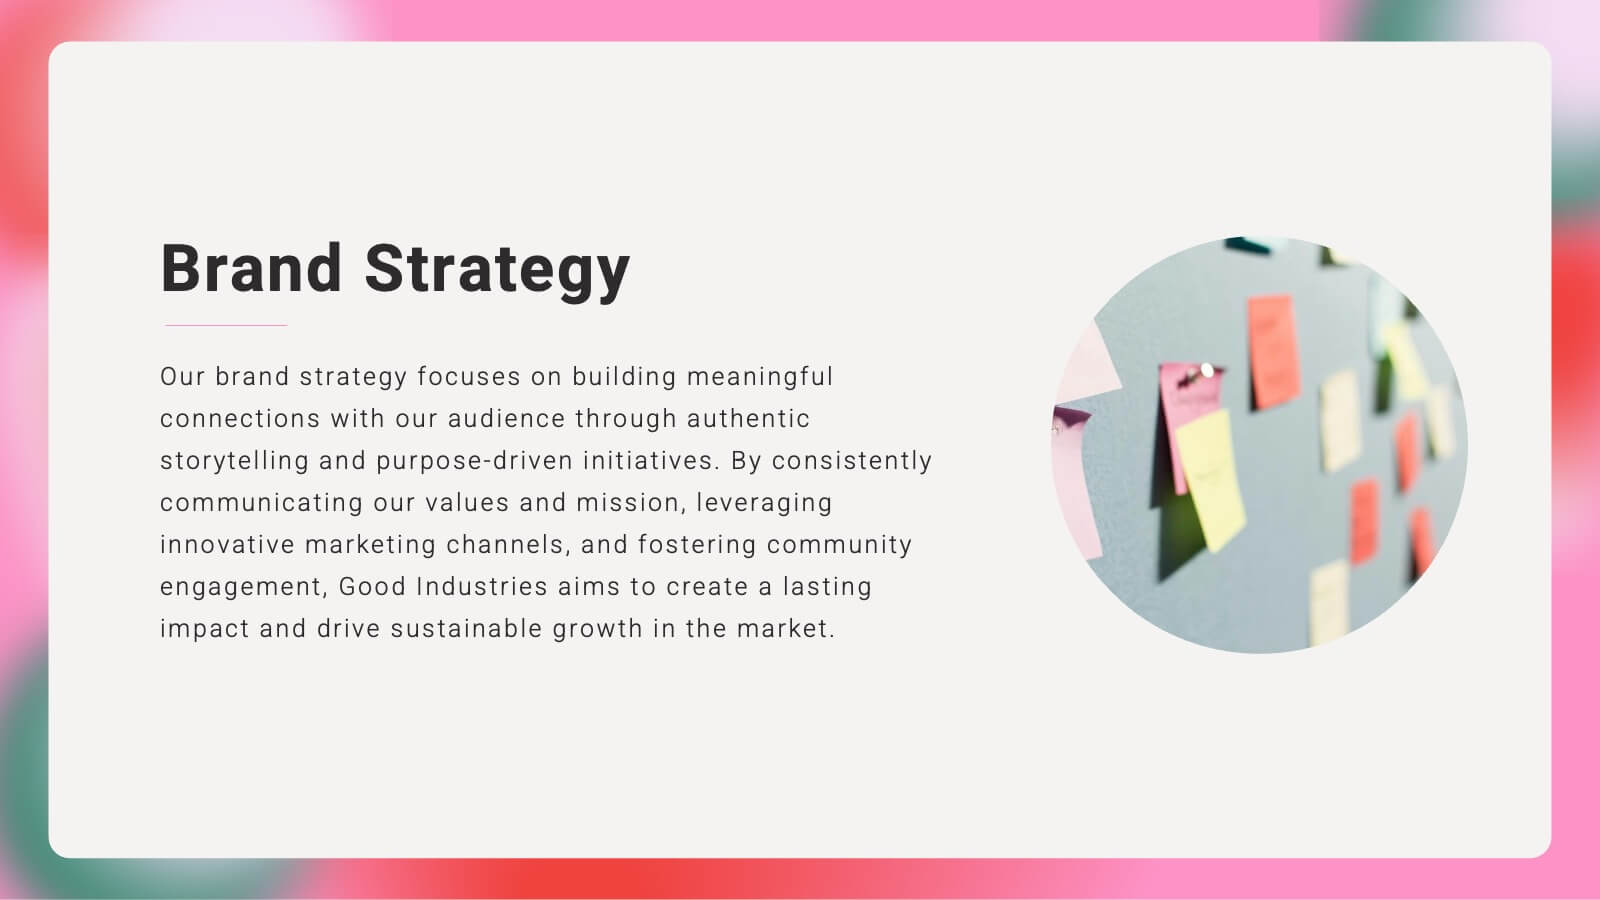
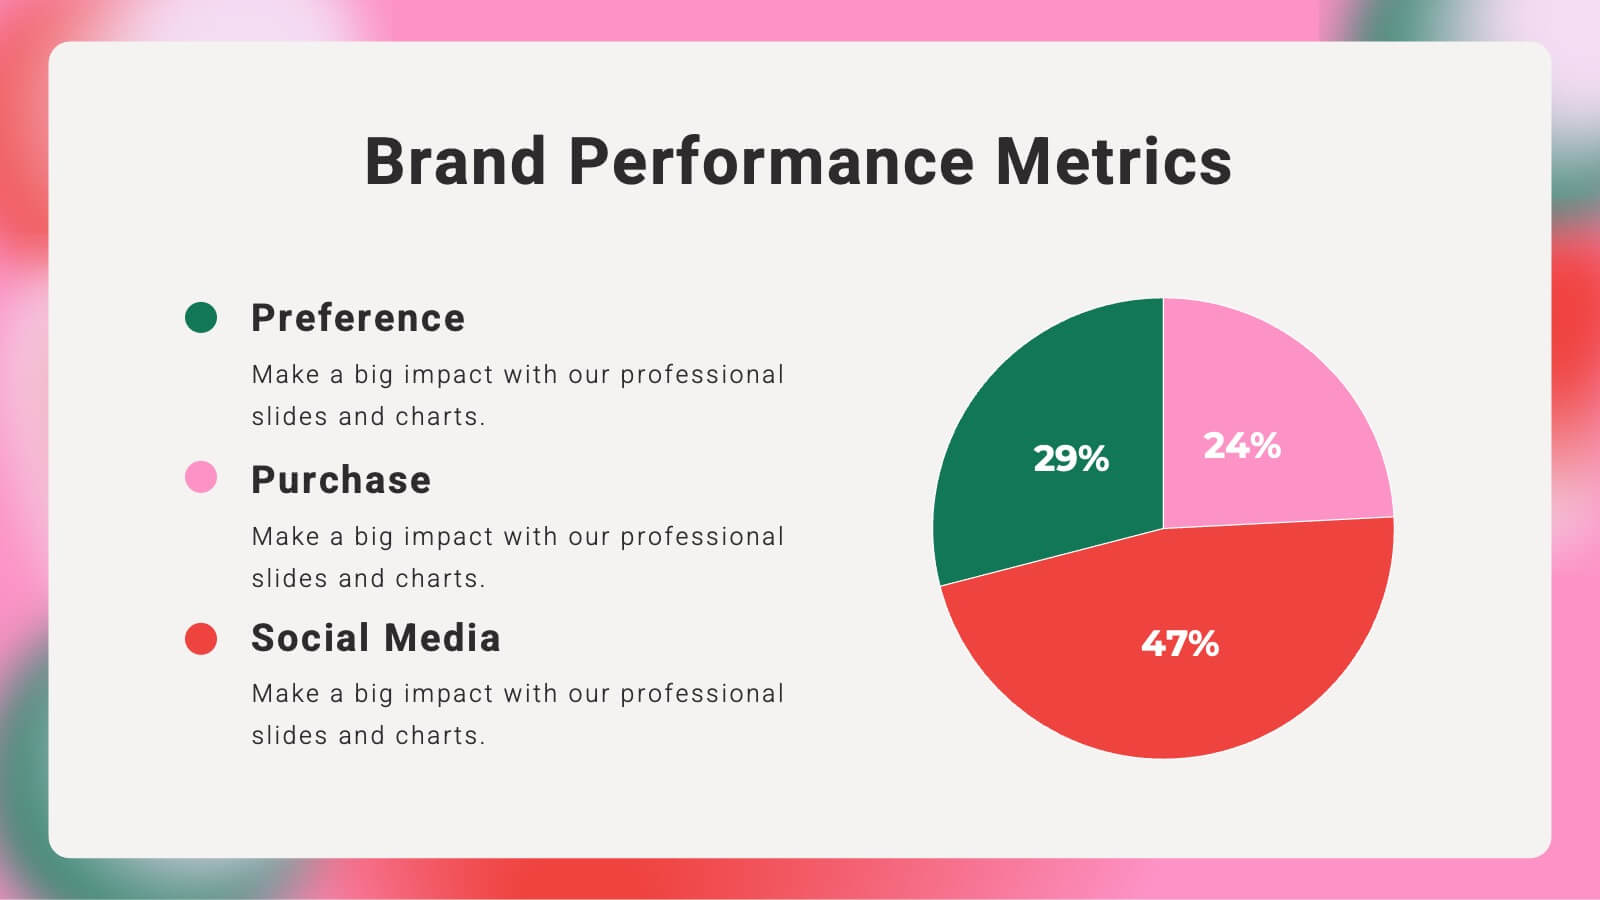
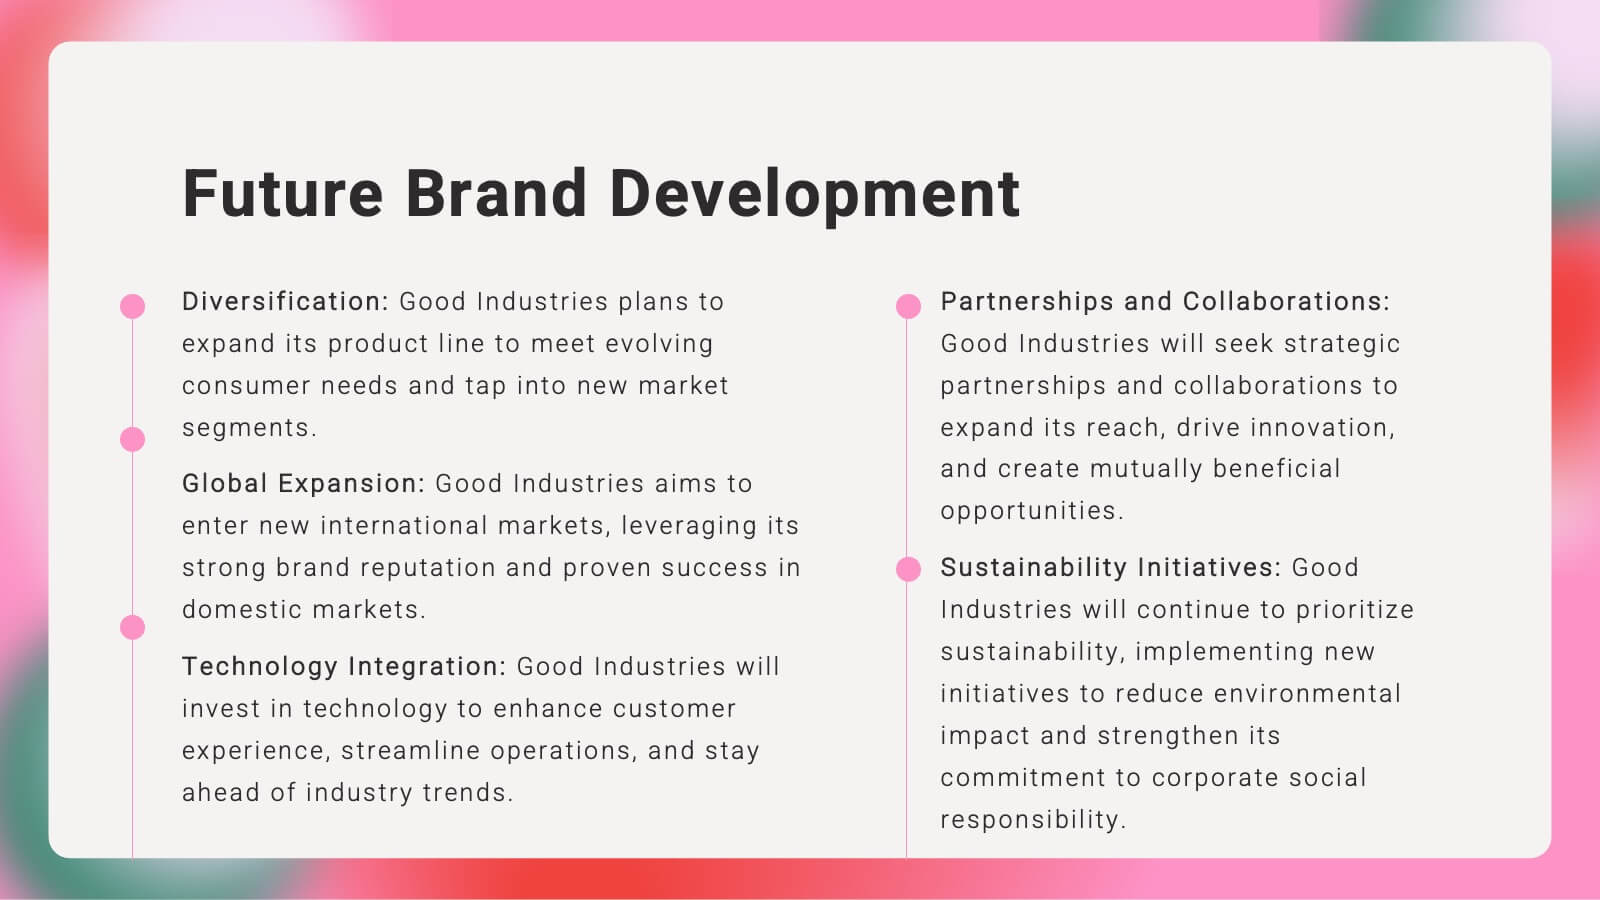
Kaleidoscope Brand Strategy Report Presentation
Craft a compelling narrative for your brand with this vibrant brand strategy presentation template. Designed to cover every facet of brand development, from vision and mission to market analysis and consumer personas, this template is an essential tool for businesses looking to establish a strong brand identity. It incorporates visually engaging slides that outline brand voice, values, and touchpoints, facilitating a thorough understanding of strategic branding. Compatible with platforms like PowerPoint, Google Slides, and Keynote, it is accessible across various devices, making it perfect for collaborative planning and presentations.


7 diapositivas
Training Infographic Presentation Template
Training is the foundation of a successful business. It gives everyone a great understanding of their responsibilities and the knowledge and skills they need to do that job. Training is essential for your new employees. The purpose of this template is to promote effective communication and understanding on the importance of training. Training is an essential part of growing your company. This presentation will allow you to show how training is an opportunity to learn new skills and improve on existing ones. This template provides a fun and professional layout that your employees will love.


7 diapositivas
Construction Infographics Presentation Template
Featuring our construction template this is a great way to show off your next project. It features a construction background with illustrations and the slide icons include all your progress steps. It is the perfect choice to present your work or to showcase a product, it has a beautiful design and informative data that will be sure to increases sales for you. This template is part of our construction category and features a construction infographic design. It is an engaging and colorful way to present your message in a clean and bright format. Perfect for any presentation you can imagine!


8 diapositivas
Data-Driven KPI Slide Presentation
Bring your data to life with a sharp, modern layout that turns complex metrics into clear, compelling visuals. This presentation helps you showcase performance insights, compare trends, and highlight key takeaways with ease. Fully customizable and compatible with PowerPoint, Keynote, and Google Slides.


5 diapositivas
Linear and Looping Process Flow Design Presentation
Visualize your workflow with clarity using the Linear and Looping Process Flow Design Presentation. This diagram blends linear steps and repeating loops, making it ideal for showcasing ongoing processes, development cycles, or multi-phase strategies. Each segment includes an icon and title to support your message. Editable in PowerPoint, Google Slides, and Canva.


6 diapositivas
Overlapping Venn Diagram Comparison Presentation
Highlight similarities and distinctions with the Overlapping Venn Diagram Comparison Presentation. This template is perfect for showcasing three interconnected concepts, ideas, or departments in a clean and professional layout. Each circle is color-coded and labeled, with the intersections visually emphasizing shared elements. Ideal for project planning, business analysis, or strategic presentations. Fully editable in PowerPoint, Keynote, and Google Slides.


8 diapositivas
Asia Geographics and Business Analysis Map Presentation
Visualize regional insights with this Asia map template. Highlight business data, performance indicators, or strategic regions using callouts and color-coded zones. Perfect for market analysis, logistics, or geographic reporting. Fully customizable in PowerPoint, Keynote, or Google Slides to match your branding and presentation goals with clear, location-based storytelling.