


Características


¿Tienes alguna pregunta?
Recomendar


6 diapositivas
Phased Implementation Timeline Presentation
Visualize your project rollout in clear, progressive stages using this curved, multi-phase timeline. Perfect for strategic plans, implementation roadmaps, or development cycles. Includes 6 customizable points with labels, icons, and years. Ideal for business teams and consultants. Fully editable in PowerPoint, Keynote, and Google Slides. Clean, modern, and easy to adapt.


6 diapositivas
Corporate Training Plan Layout Presentation
Bring structure and clarity to your business training process with this clean and professional layout. Each gear-shaped section highlights a key stage in your program, allowing you to present goals, skills, and milestones with precision. Ideal for planning sessions or executive briefings, this template is fully compatible with PowerPoint, Keynote, and Google Slides.


6 diapositivas
Evolution of an Industry Through Time Presentation
Visualize industry transformation with the Evolution of an Industry Through Time Presentation. This timeline-style layout is perfect for highlighting key milestones, technological shifts, or growth stages across decades. Ideal for consultants, educators, or corporate strategists. Fully editable in Canva, PowerPoint, Keynote, and Google Slides for easy adaptation.


24 diapositivas
Silver Product Launch Presentation
Unleash the potential of your product launch with this vibrant and engaging presentation template! Designed to showcase your product's unique features, market positioning, and competitive edge, this template helps you tell a compelling story from start to finish. It’s perfect for grabbing attention and driving impact. Compatible with PowerPoint, Keynote, and Google Slides.


6 diapositivas
Best Solution Proposal Presentation
Present your ideas with clarity and confidence using this modern, structured layout that highlights problems, opportunities, and proposed solutions step by step. Ideal for showcasing strategies or business improvements, it keeps information organized and persuasive. Fully compatible with PowerPoint, Keynote, and Google Slides for effortless customization and presentation.
22 diapositivas
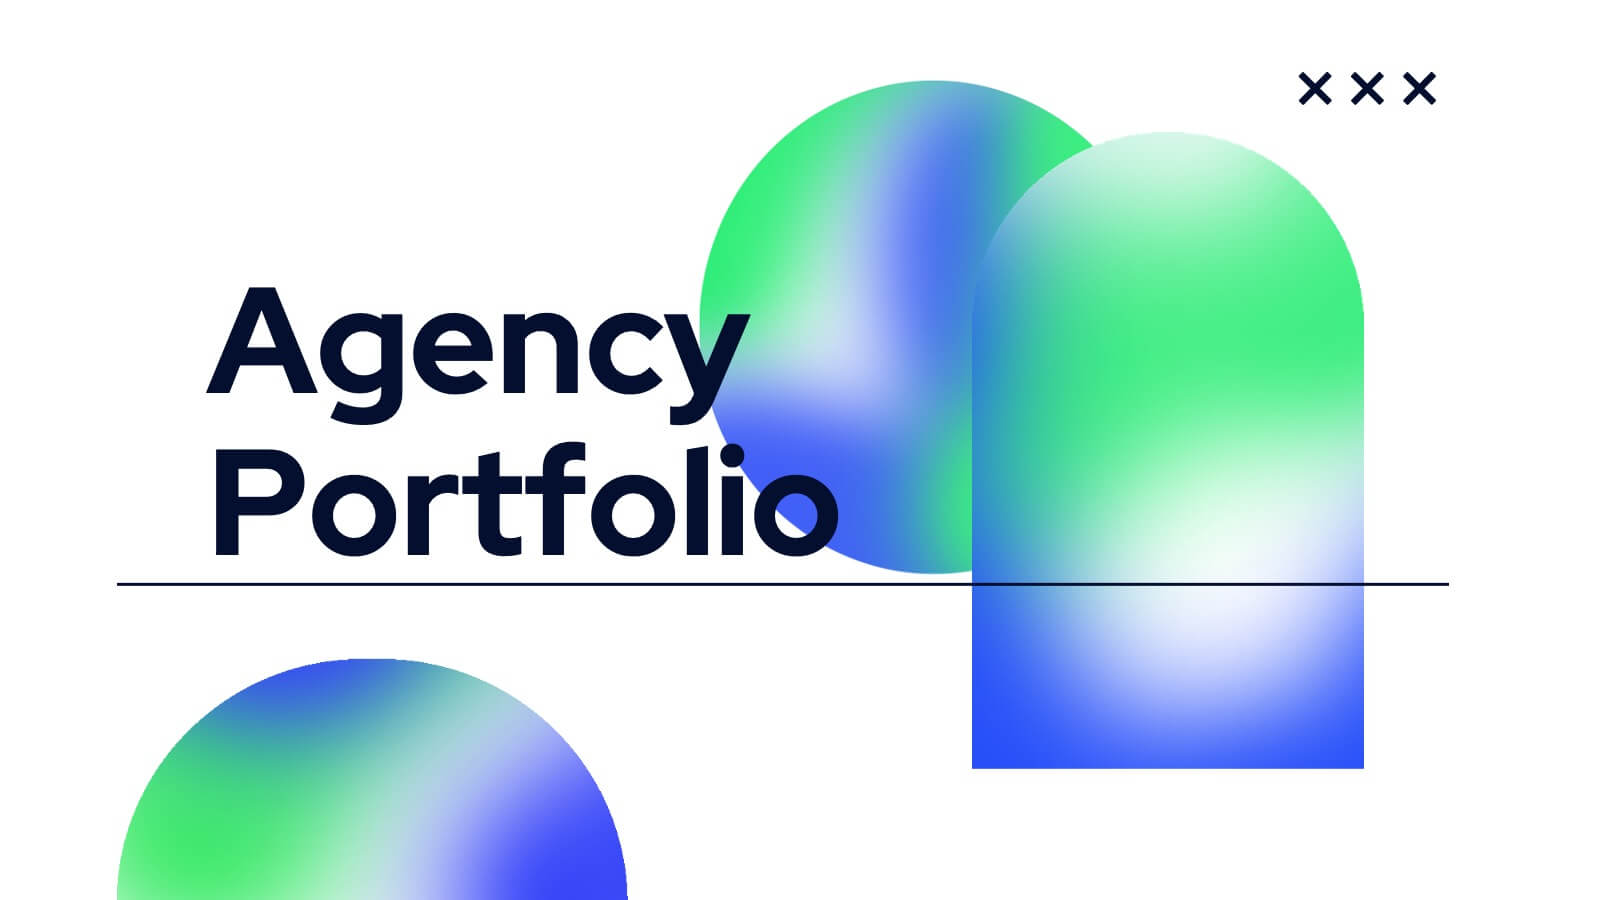
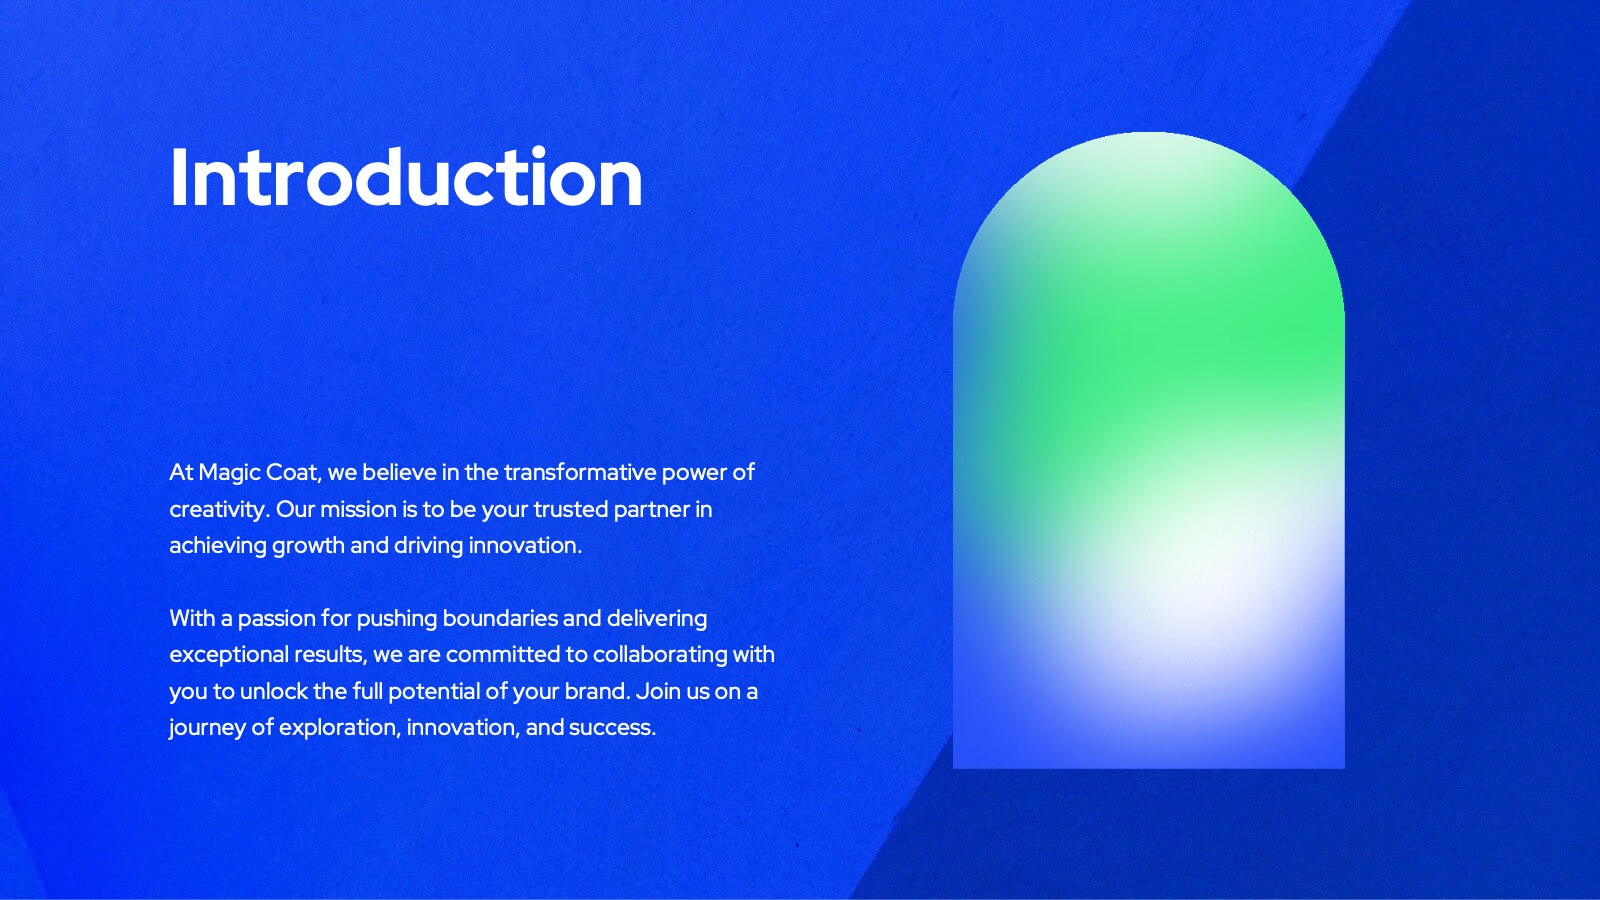
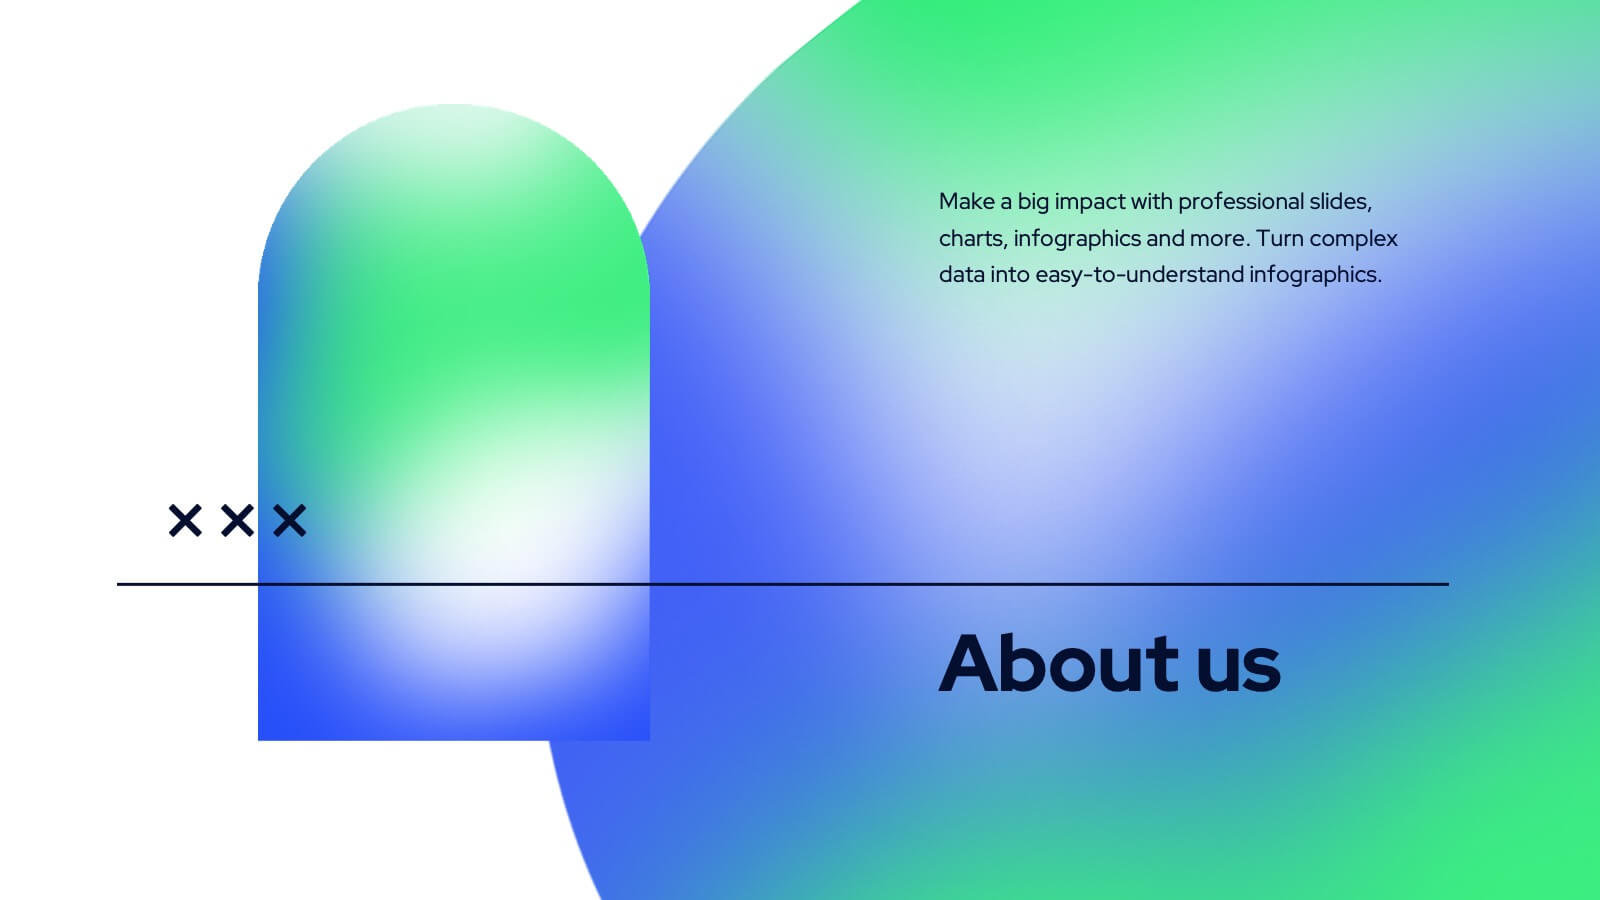
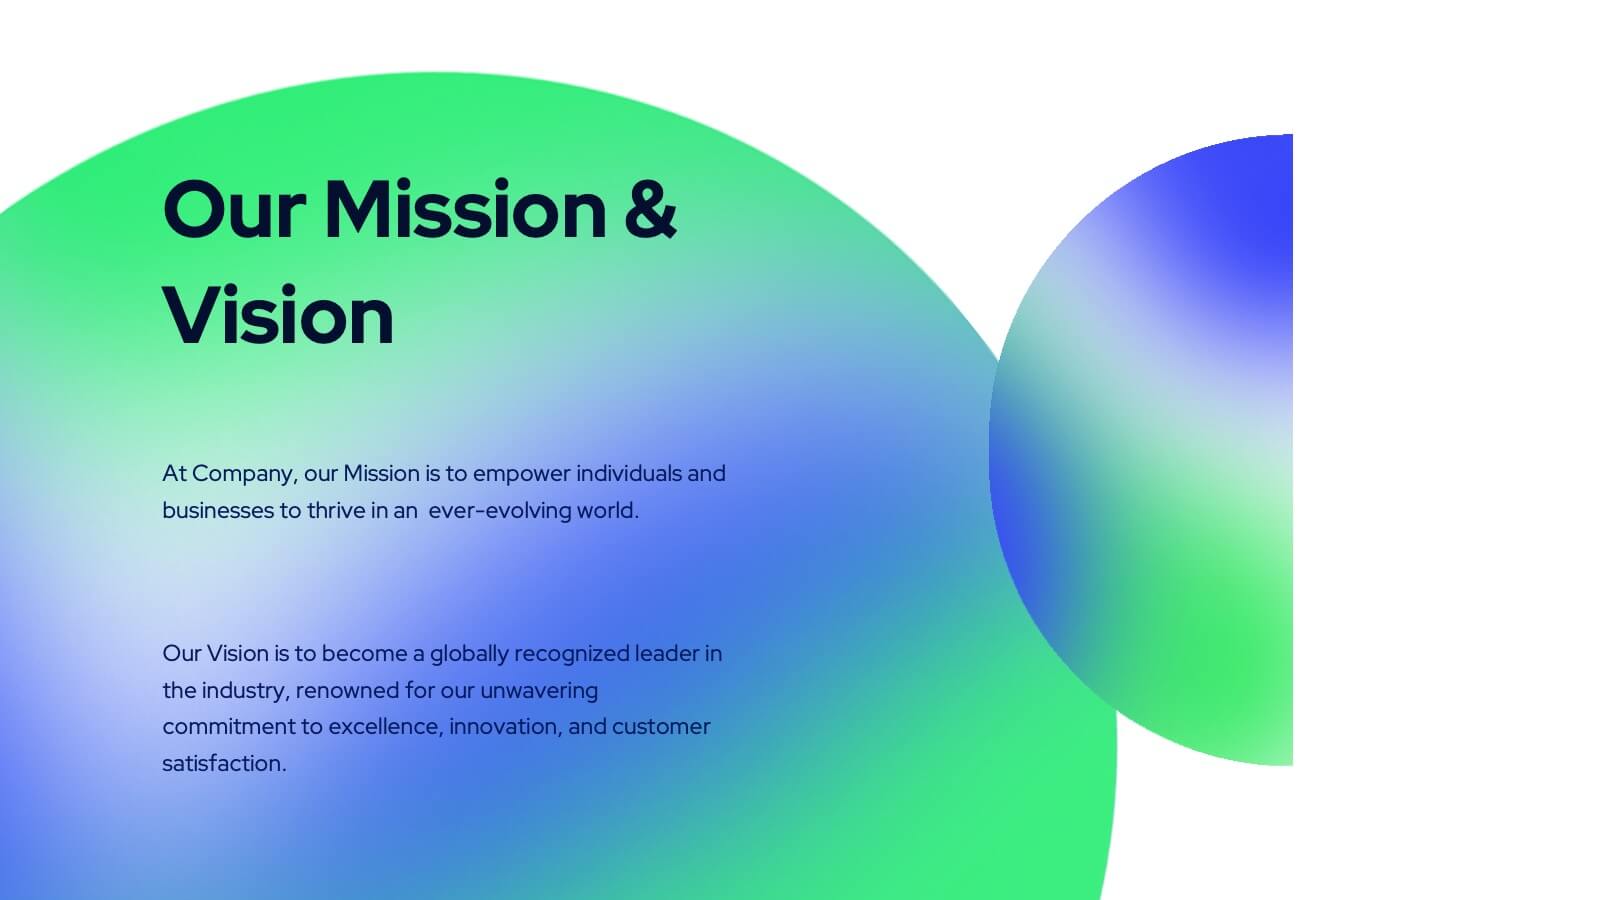
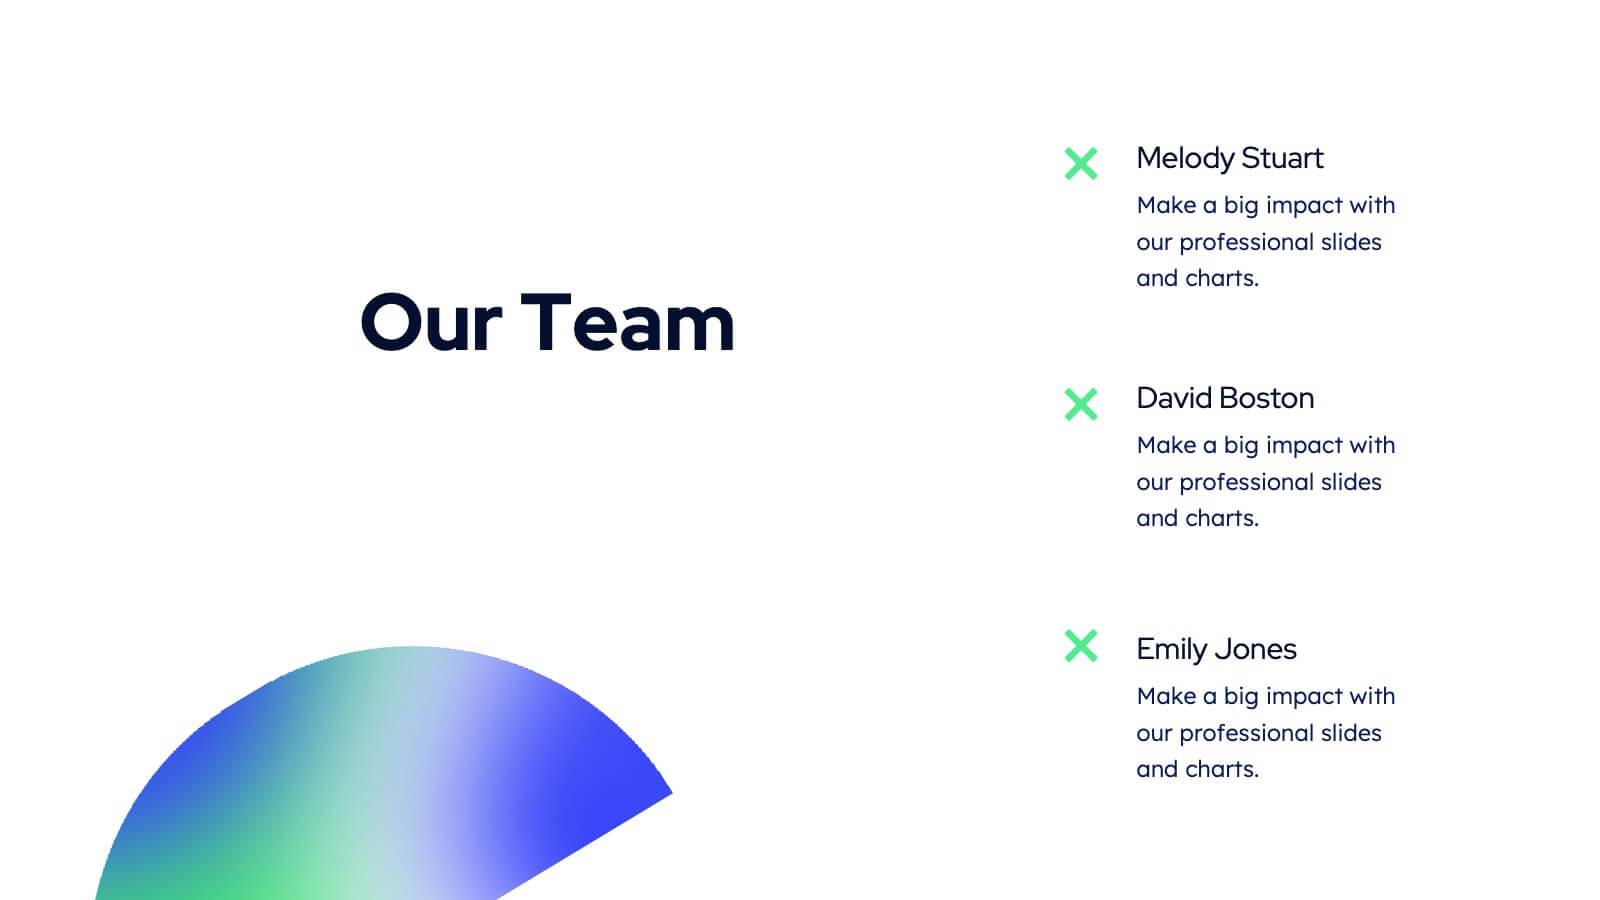
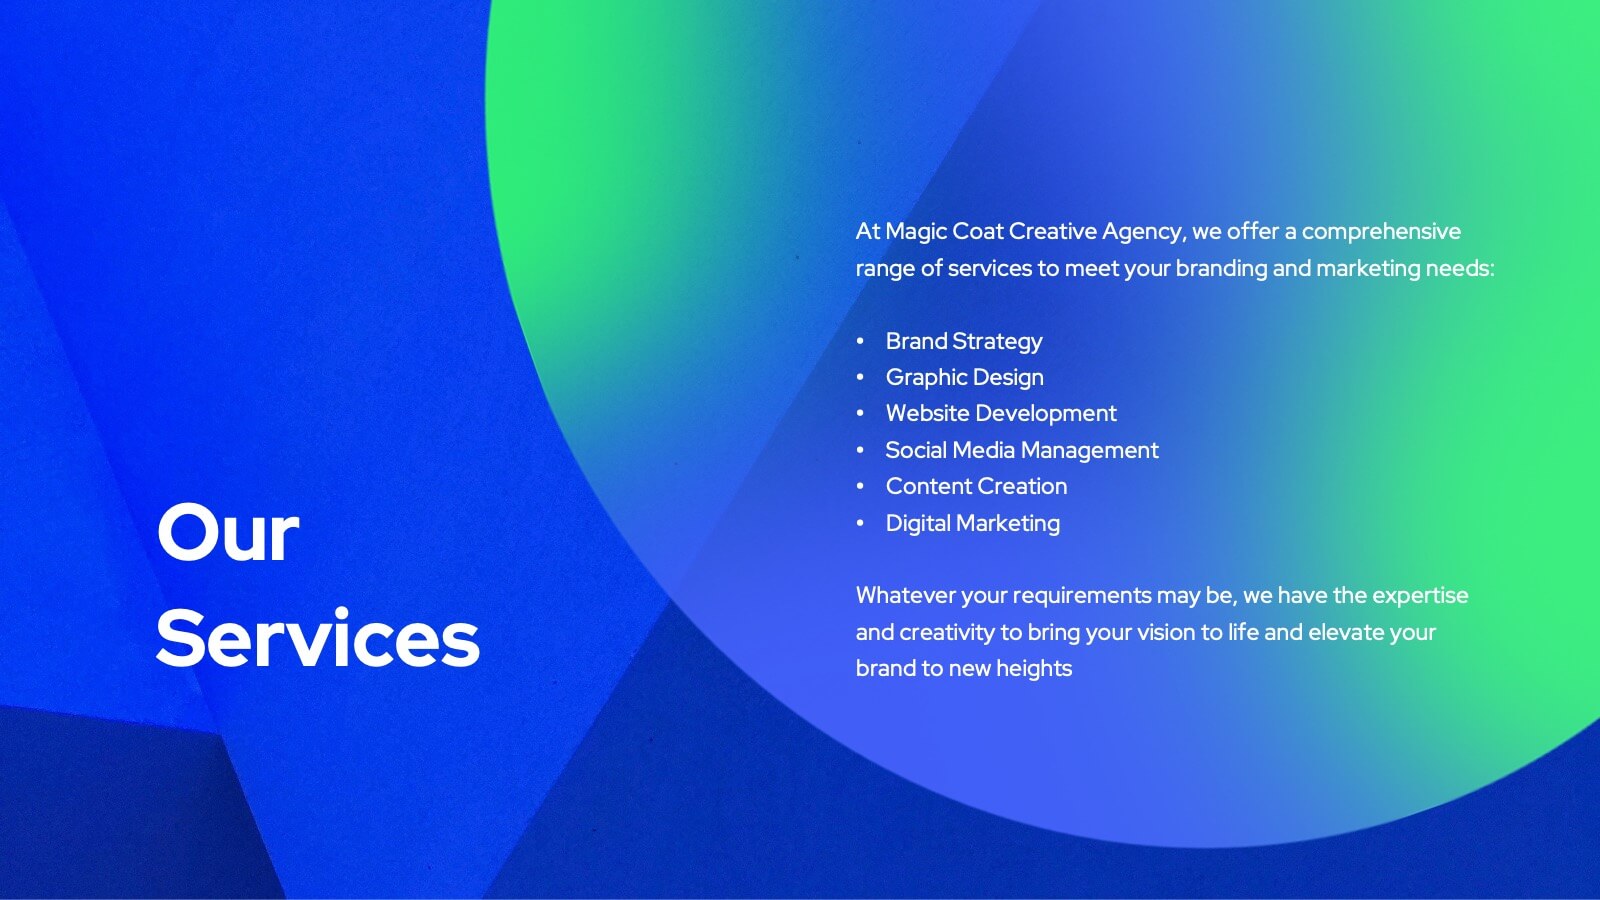
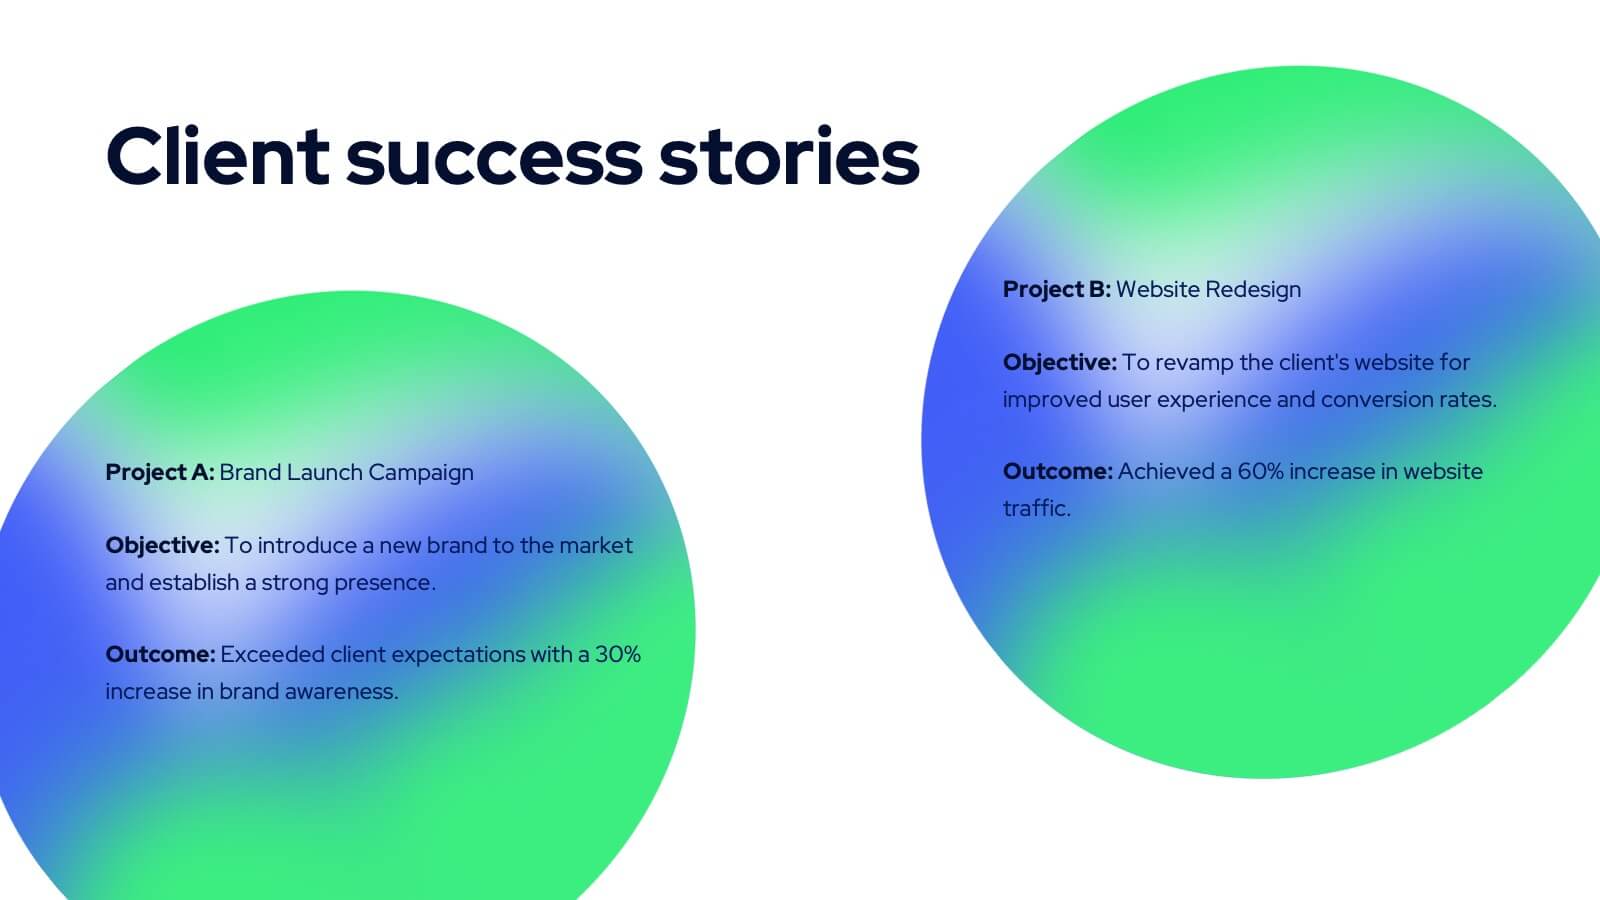
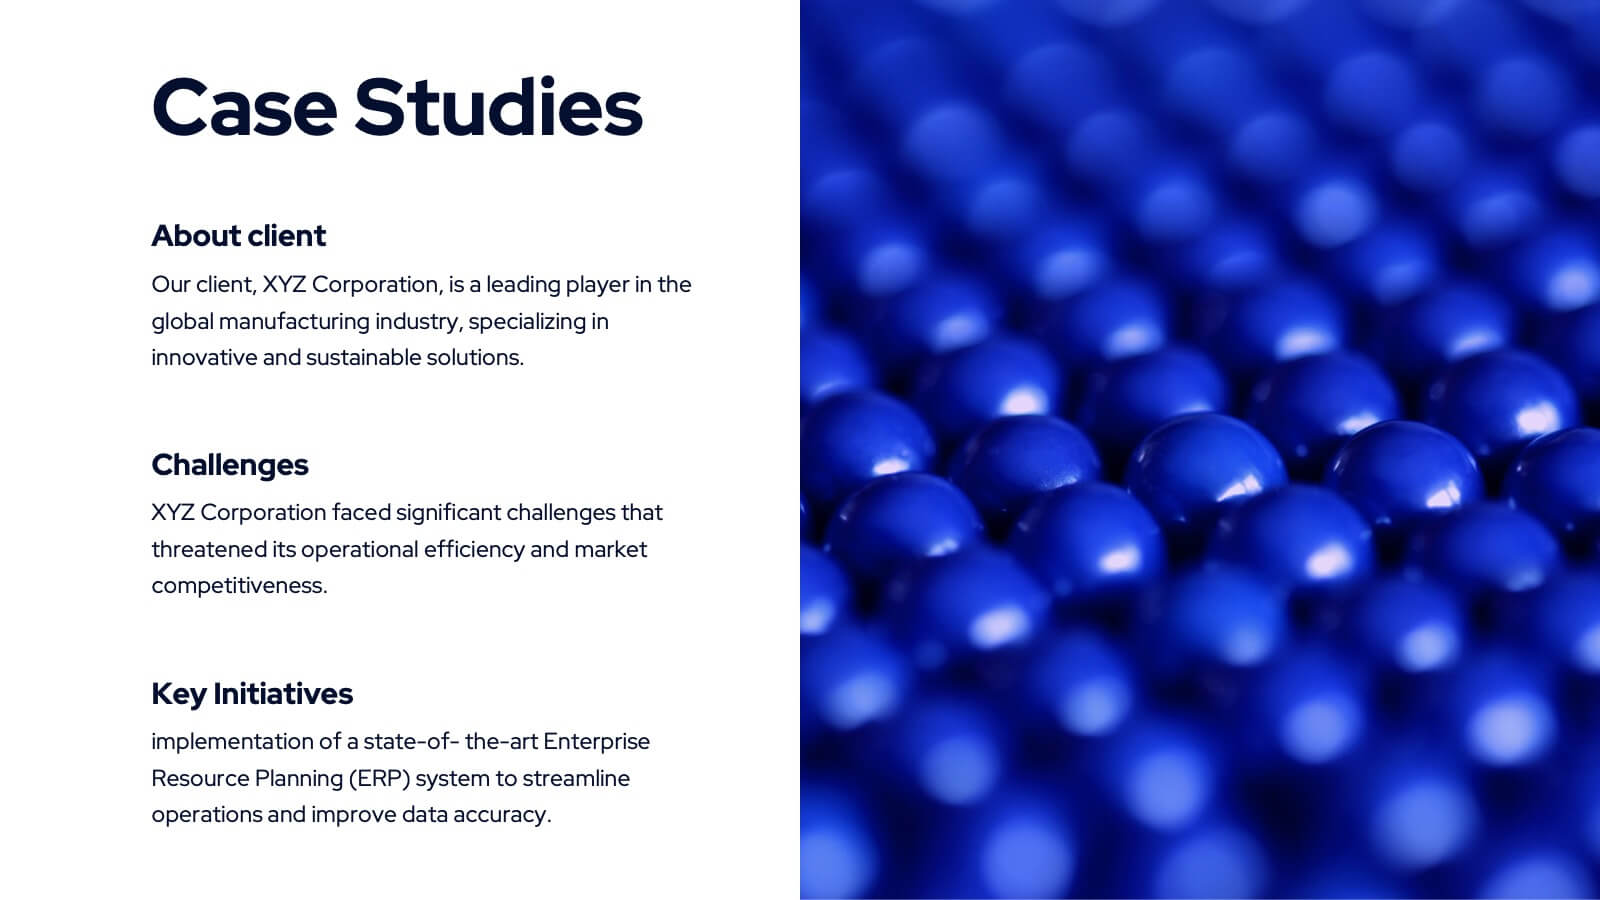
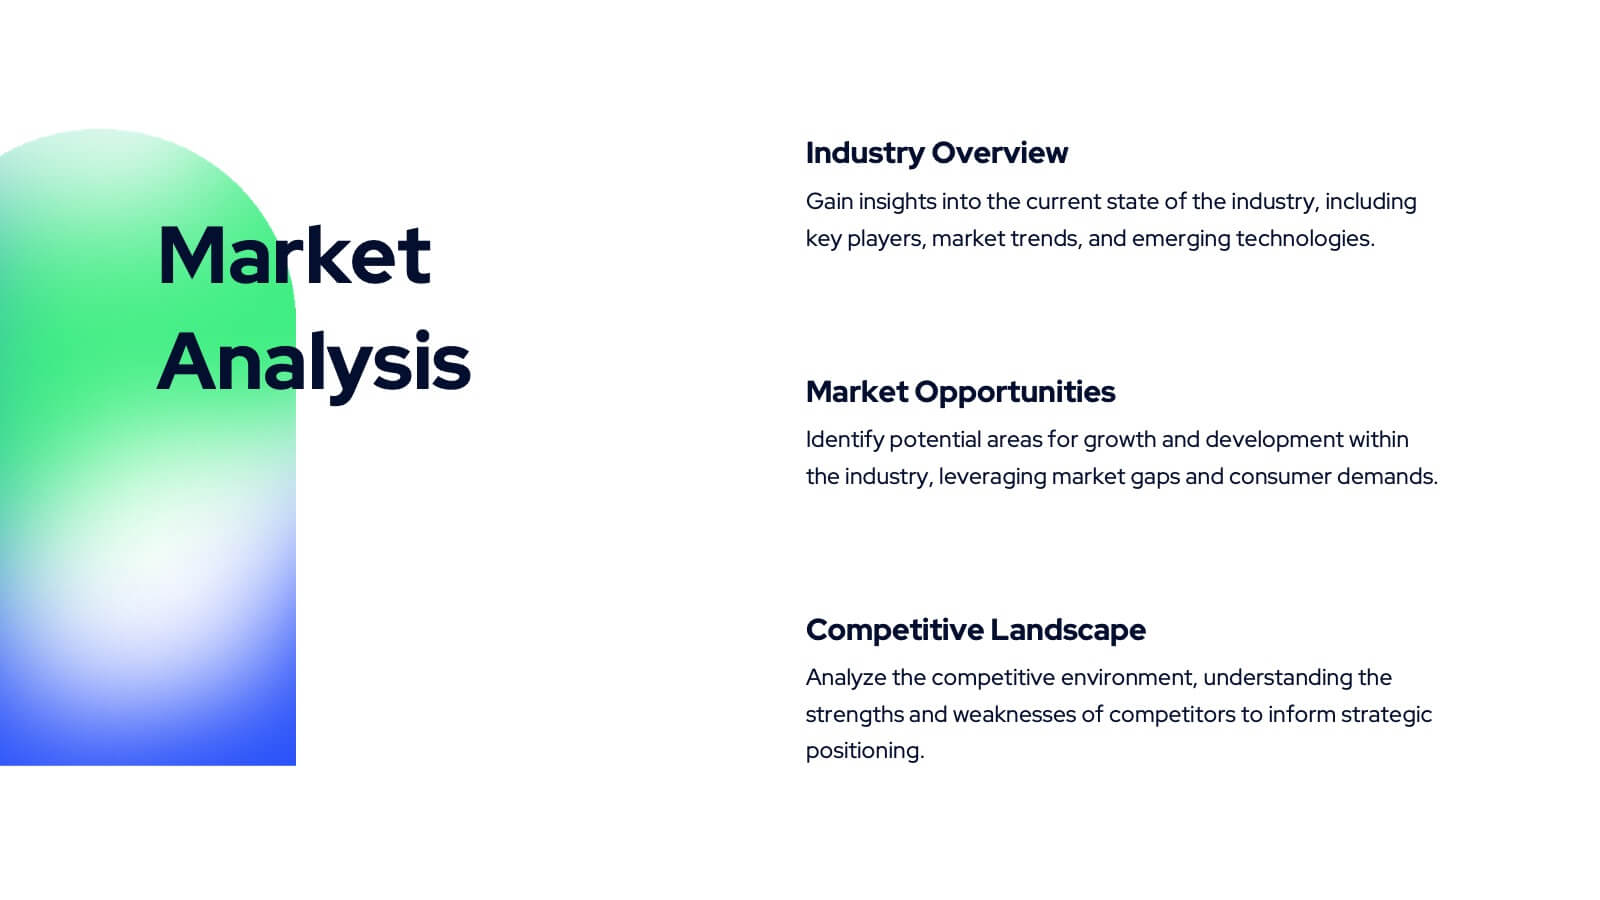
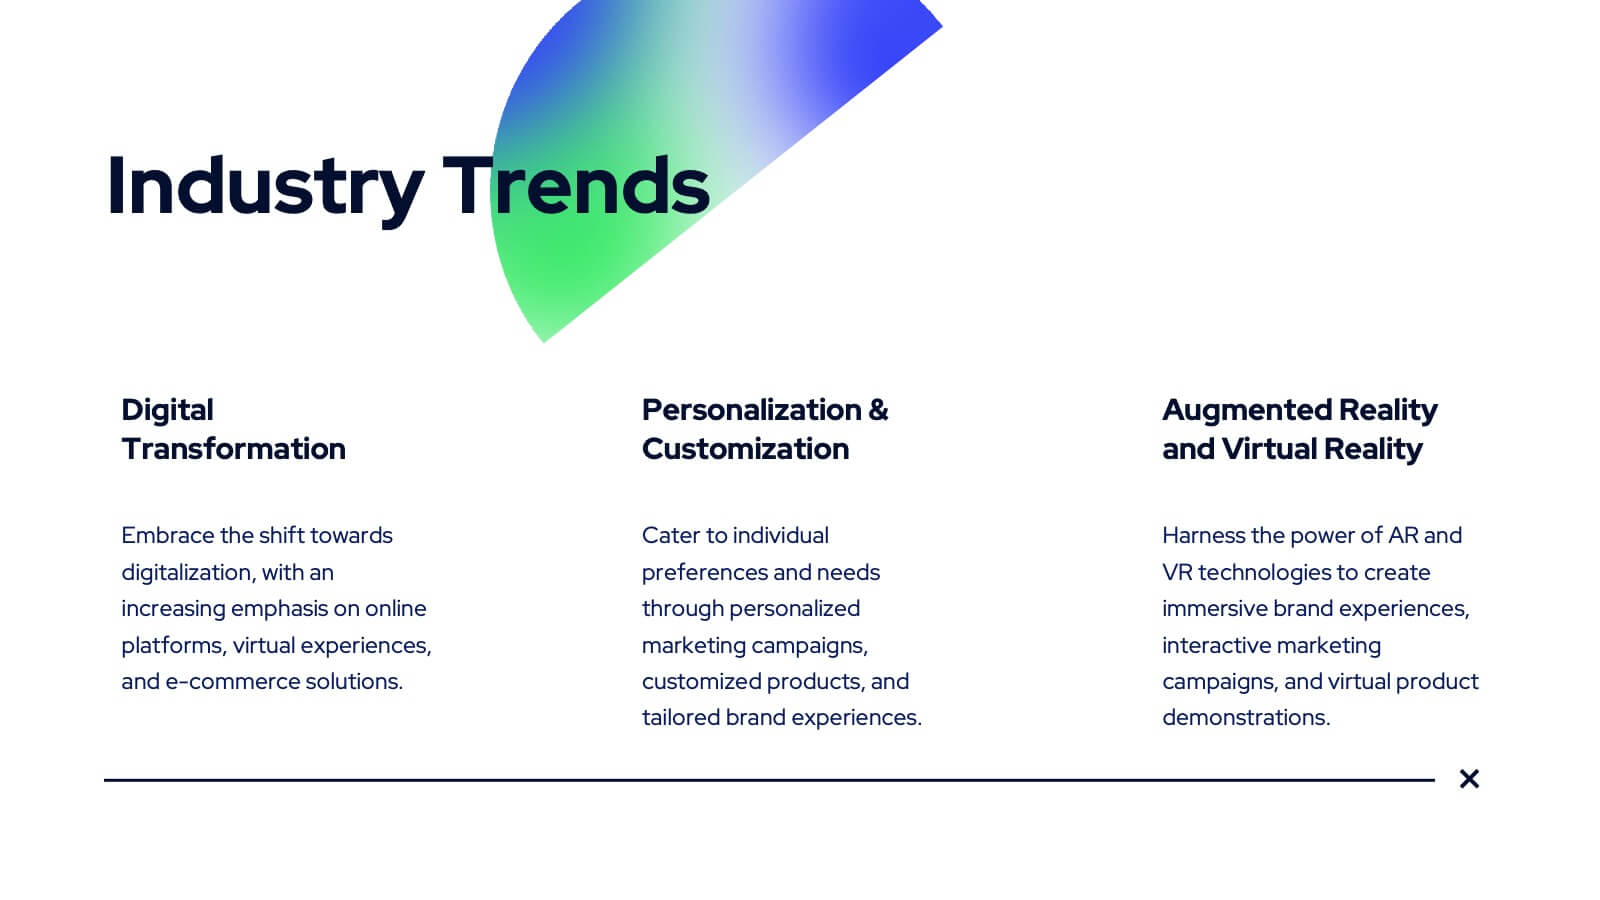
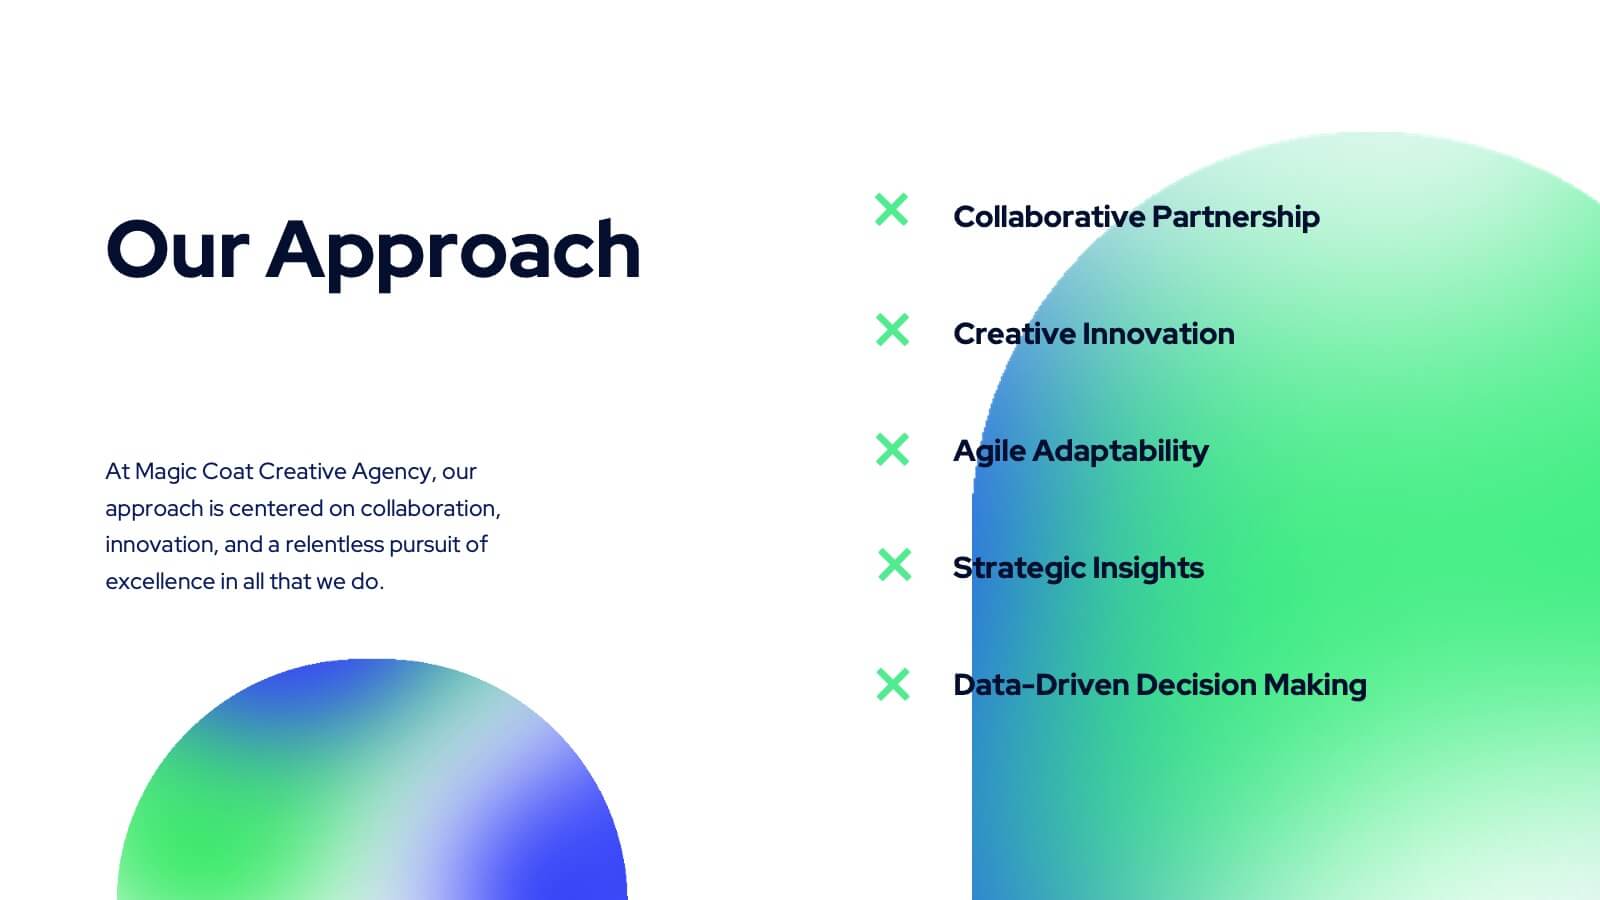
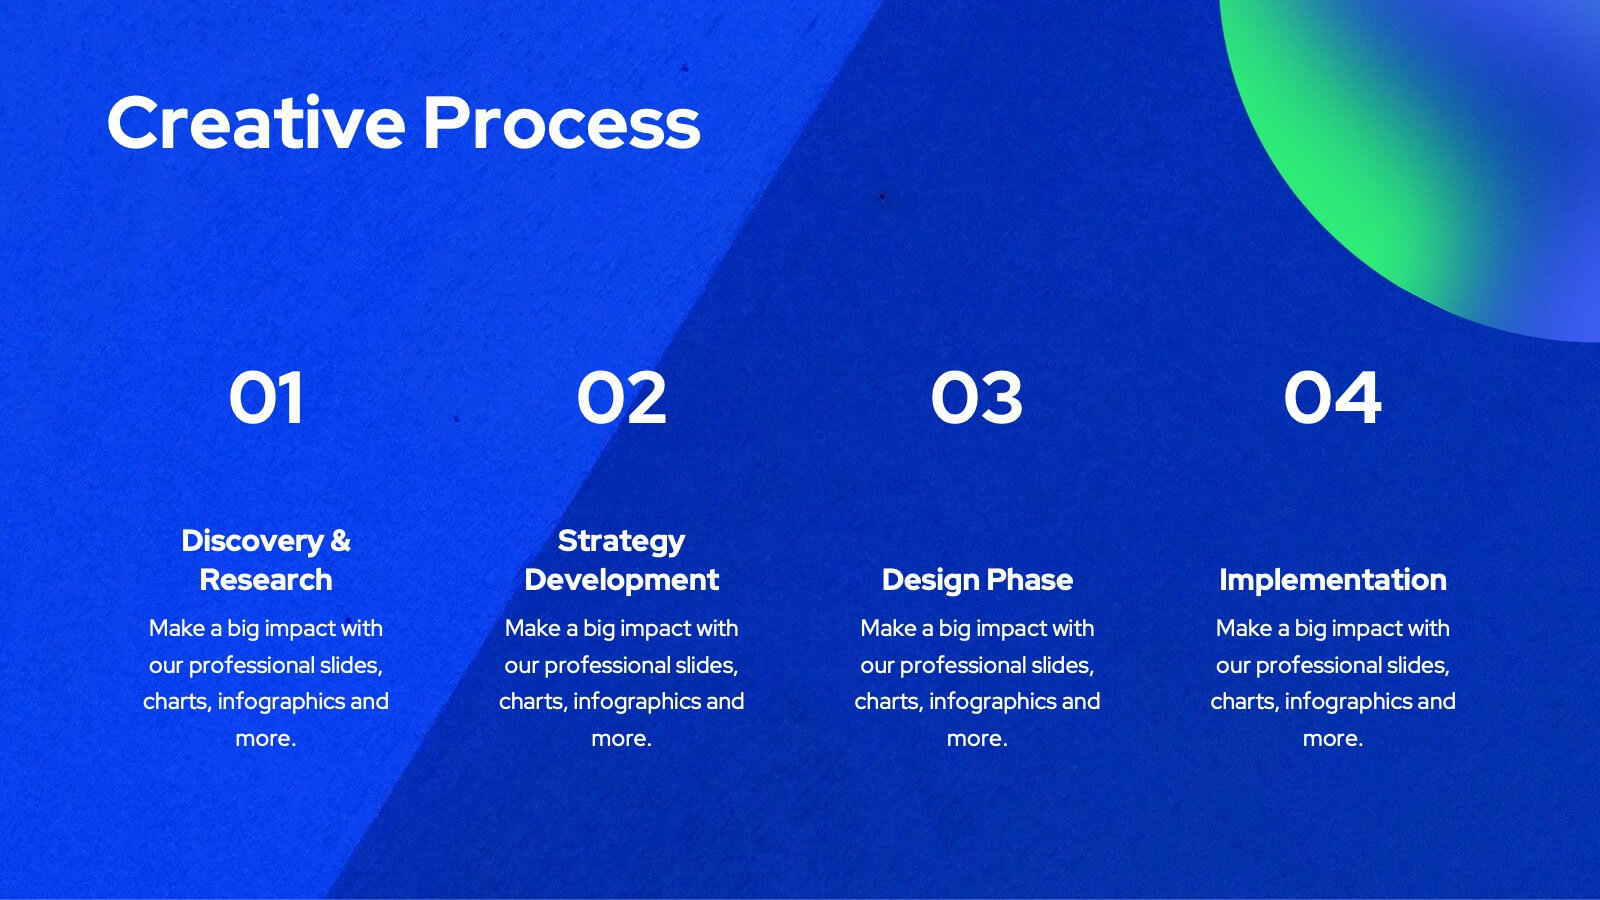
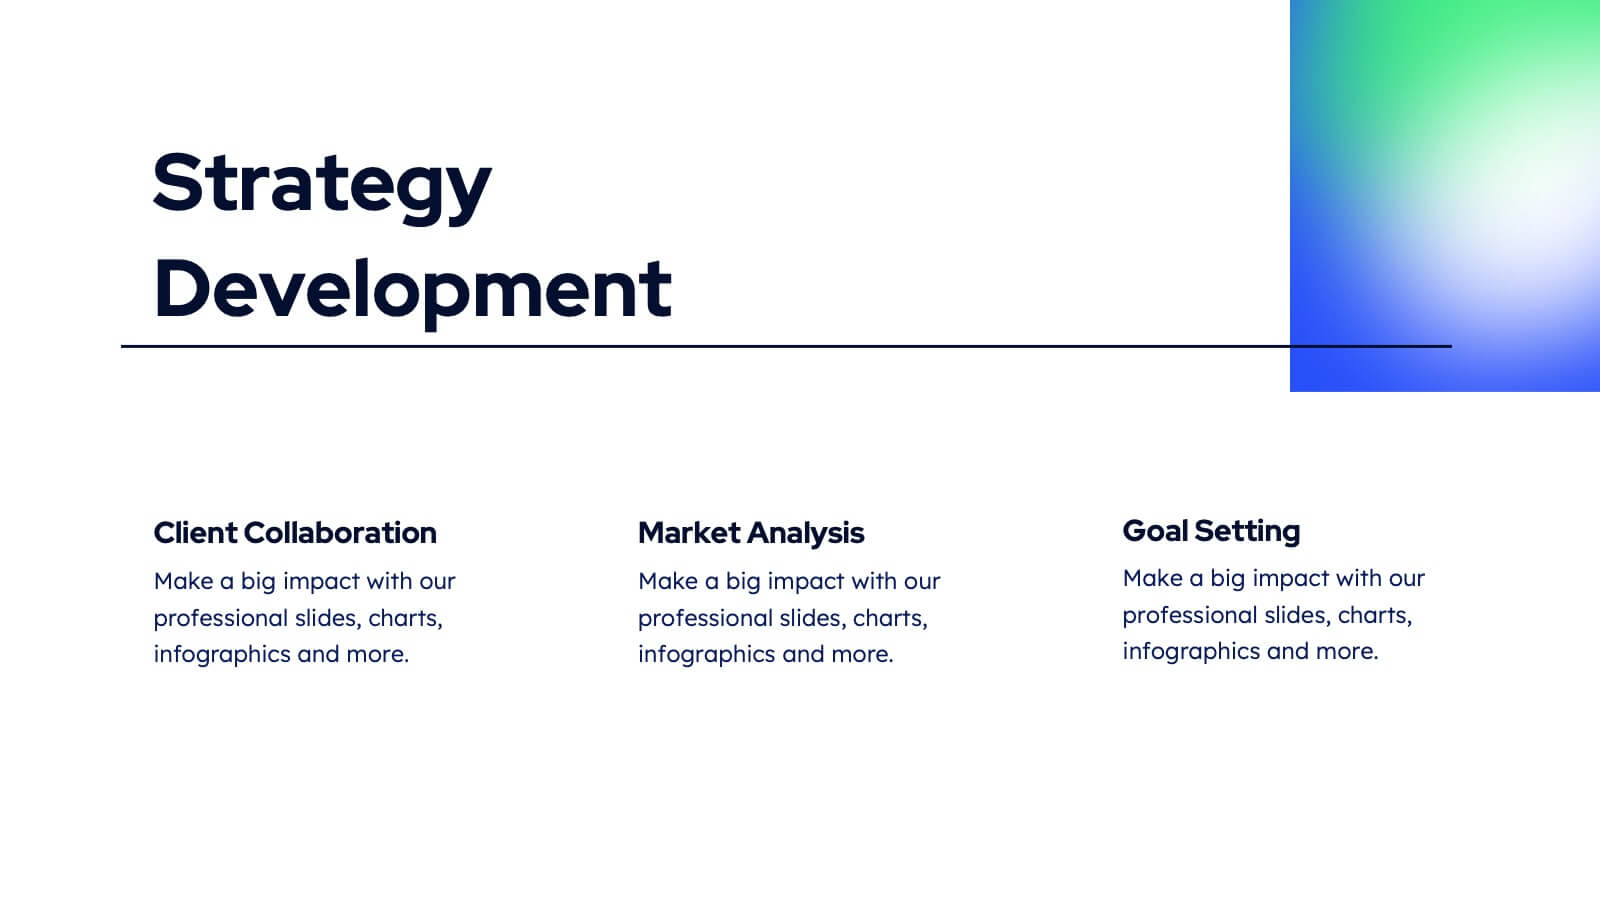
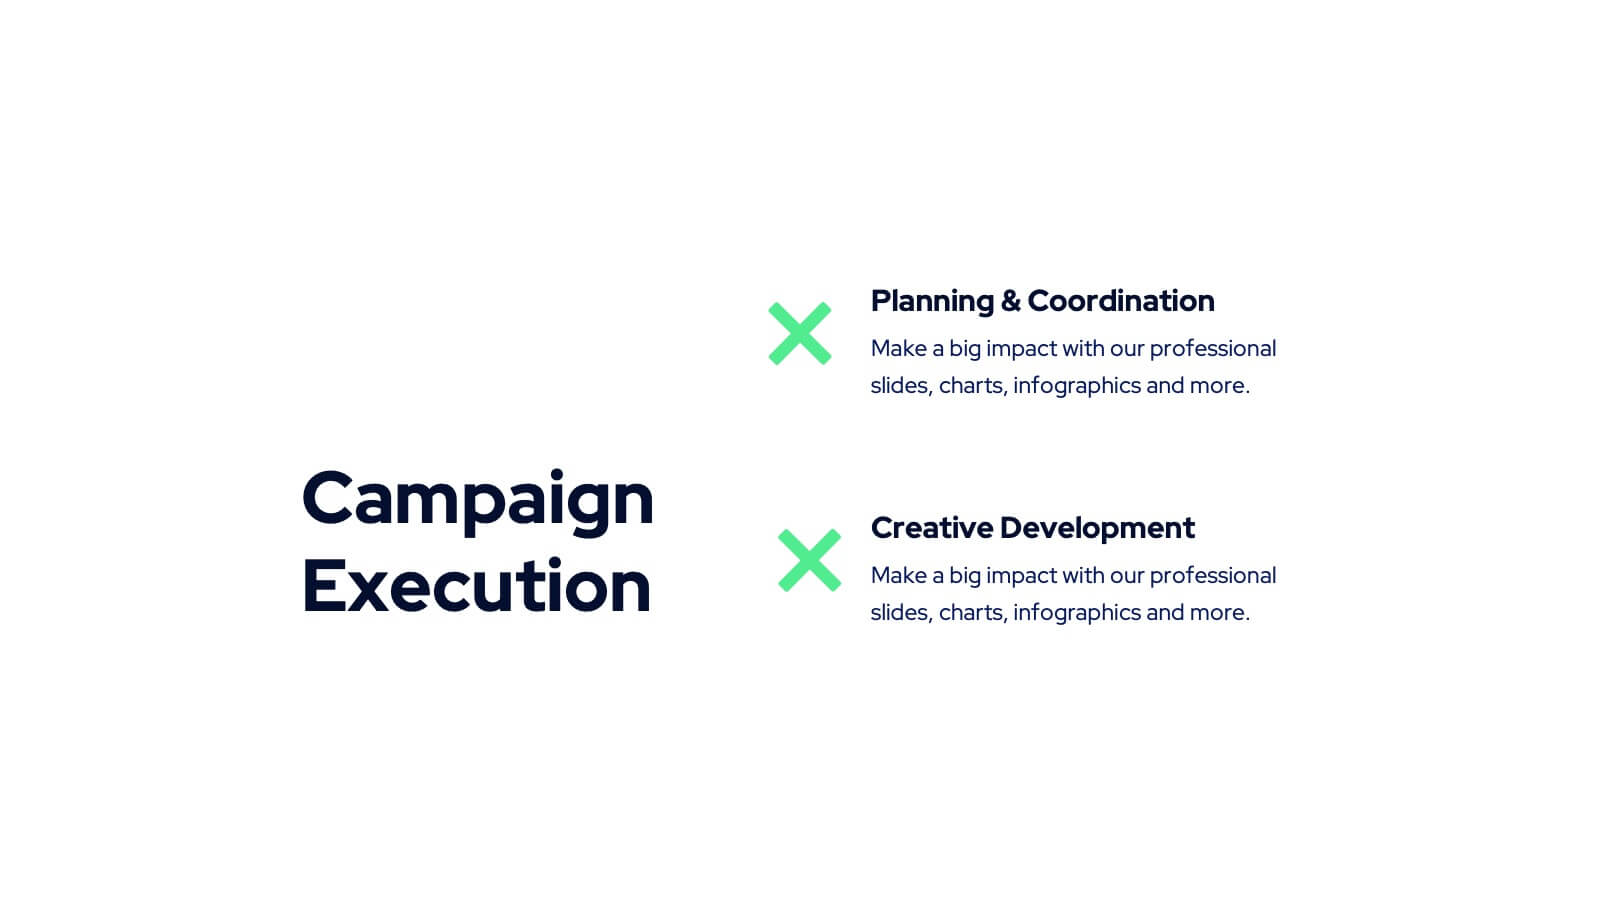
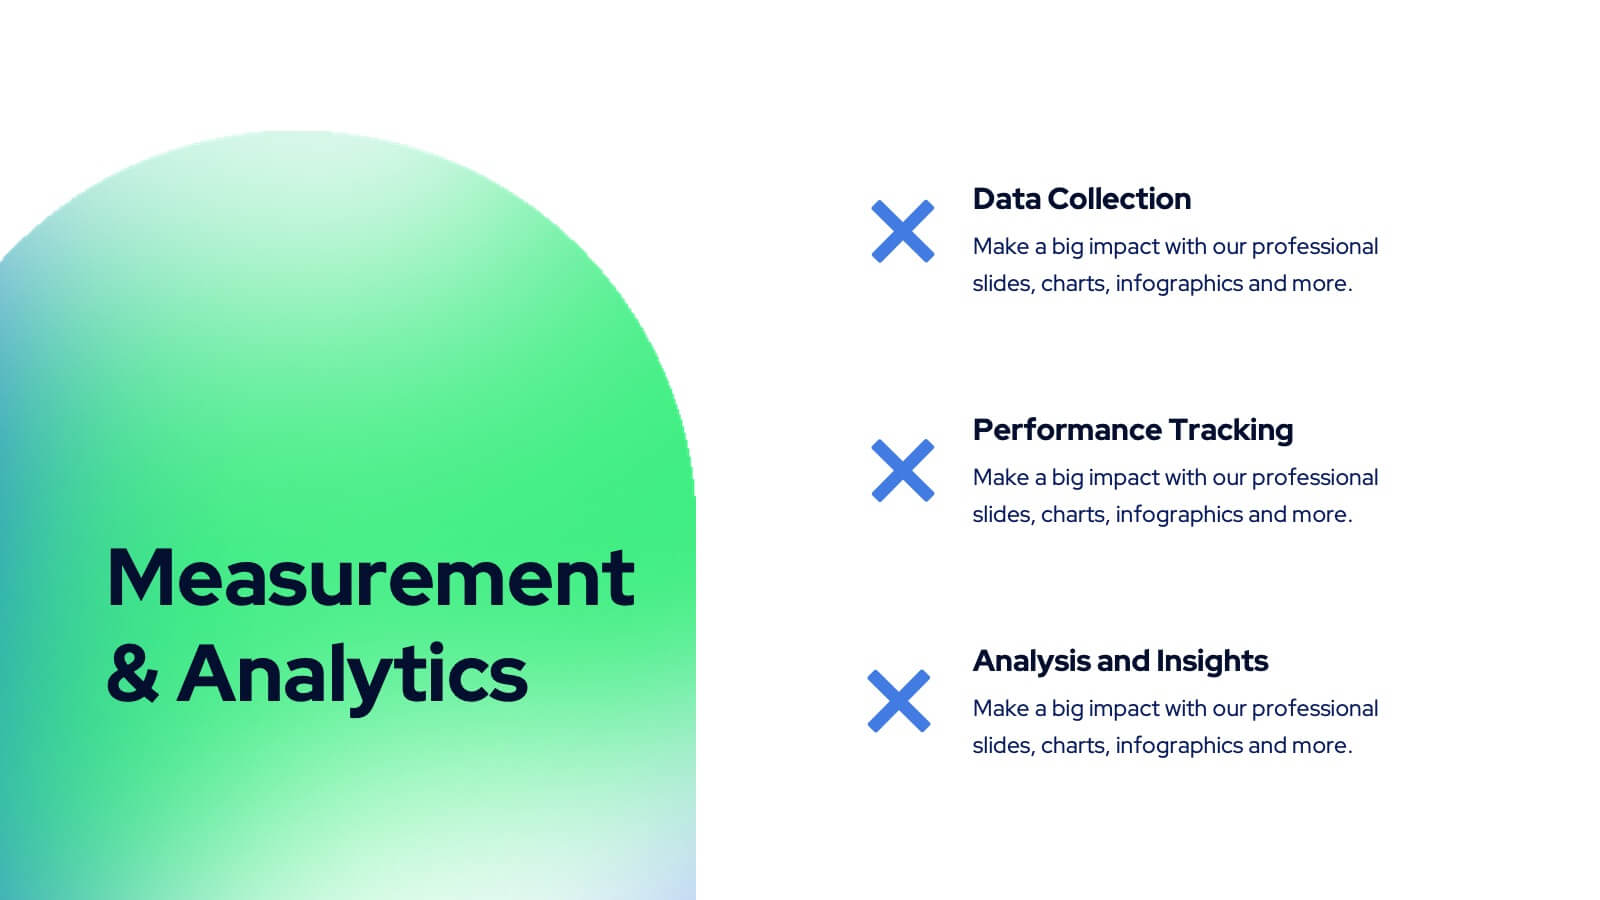
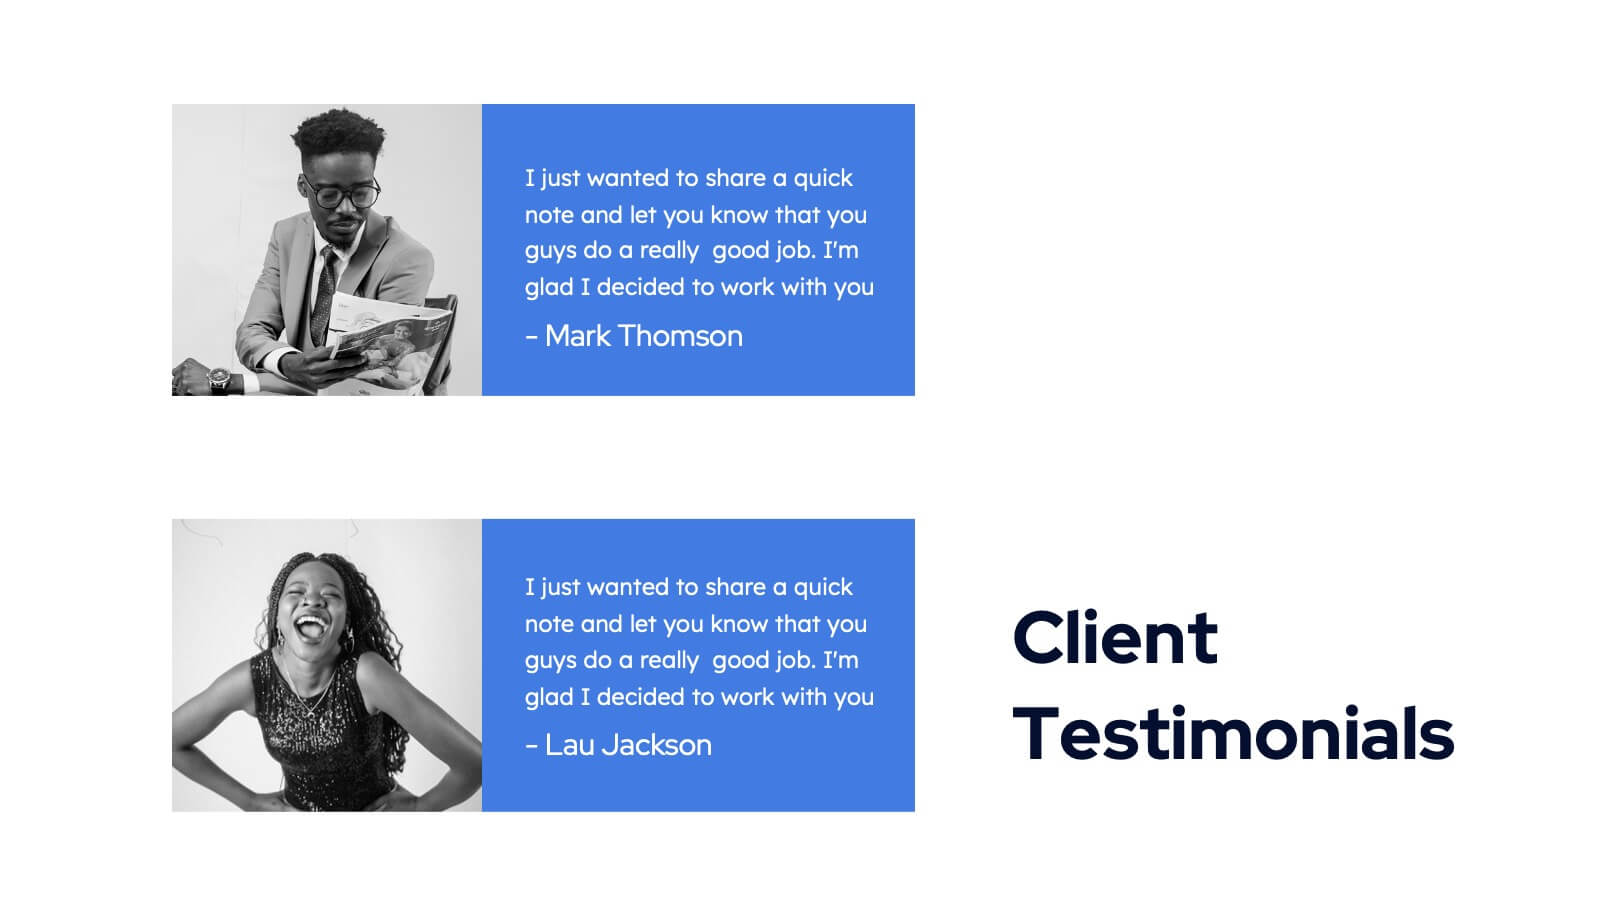
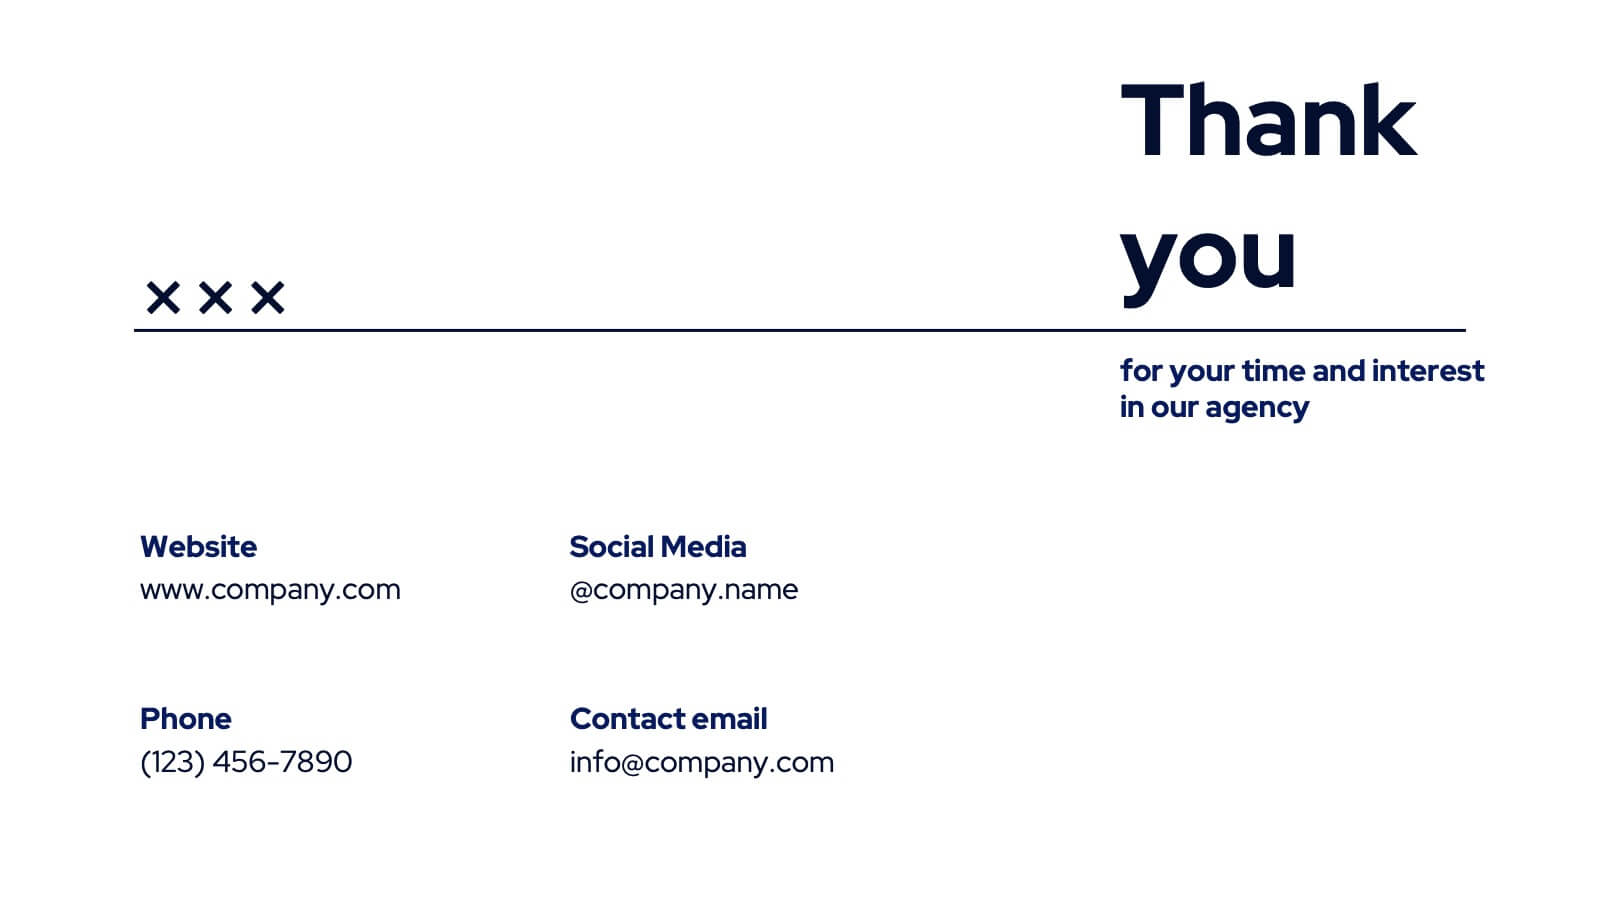
Tanzanite Full-Service Agency Project Plan Presentation
Showcase your agency's strengths with this bold and modern portfolio presentation template! From client success stories and case studies to market analysis and strategy development, this template highlights your expertise and approach. Perfect for agencies looking to present their services, creative processes, and partnerships. Compatible with PowerPoint, Keynote, and Google Slides, making it easy to impress any audience.


6 diapositivas
Year-End Company Report Overview Presentation
Summarize your annual results with this modern year-end report slide. Designed to showcase KPIs, growth stats, and financial outcomes, it features clean icons and a clear six-section layout. Ideal for performance reviews or stakeholder updates. Fully editable and compatible with PowerPoint, Keynote, and Google Slides for quick customization.


6 diapositivas
Search Engine Optimization Campaign Overview Presentation
Kick off your digital strategy with a clean, modern layout that makes every key insight feel connected and actionable. This presentation helps you explain campaign goals, highlight SEO priorities, and break down essential tasks in a structured, visual flow. Fully compatible with PowerPoint, Keynote, and Google Slides.


20 diapositivas
Uplift Content Marketing Pitch Deck Presentation
This content marketing presentation is designed to elevate your strategies to the next level! It covers everything from industry insights to the latest consumer behavior trends and SEO strategies. It helps streamline influencer marketing, data-driven approaches, and even includes sustainability in marketing. Perfect for PowerPoint, Keynote, and Google Slides presentations!


6 diapositivas
Effective Communication in Meetings Presentation
Communicate with impact using this circular diagram template designed to visualize six key elements or steps for better meeting communication. With centered speech bubble icons and balanced layout, it's ideal for sharing best practices, communication roles, or team feedback loops. Fully customizable in PowerPoint, Keynote, and Google Slides.


6 diapositivas
Modern Science Report Presentation
Bring your findings to life with a clean, dynamic layout designed to make scientific insights easy to follow. This presentation highlights key data, research points, and lab observations in a structured, visually engaging format that supports clarity and accuracy. Fully compatible with PowerPoint, Keynote, and Google Slides.


3 diapositivas
Persona Mapping for Target Audience Presentation
Get clear on who you're speaking to with this visual persona mapping slide. Ideal for marketing plans, customer research, or segmentation strategies, this layout helps you define and compare target audience types with clean icons and text space. Fully editable and works with PowerPoint, Keynote, and Google Slides.


6 diapositivas
Workplace Culture and Office Environment Presentation
Highlight team values and workplace dynamics with this modern layout, featuring a central desk illustration flanked by six color-coded points. Perfect for showcasing employee engagement, office norms, or hybrid work strategies. The split design helps balance visual storytelling with concise content. Easily editable in PowerPoint, Keynote, or Google Slides to match your brand and message.


6 diapositivas
Step-by-Step Process Guide Presentation
Clearly outline your workflow with this step-by-step process guide template, featuring six bold arrow graphics for sequential planning. Perfect for illustrating procedures, timelines, or strategies, this modern design ensures clarity and flow. Fully editable in Canva, PowerPoint, or Google Slides, making it ideal for business, project management, or training presentations.


21 diapositivas
Phoenix Design Portfolio Presentation
Elevate your design presentations with this stylish, contemporary template. Perfect for showcasing design portfolios, concept development, and project timelines, it features a modern layout with vibrant colors. Highlight key elements like color palettes, textures, and design processes to captivate your audience. Compatible with PowerPoint, Keynote, and Google Slides, it ensures seamless presentations on any platform.


5 diapositivas
Closing Statement with Highlights Presentation
Wrap up your presentation with this clean, step-by-step summary slide. Featuring a rising arrow path and a trophy icon, it’s ideal for showcasing final insights or major achievements. Highlight up to five key points clearly and concisely. Fully customizable in PowerPoint, Keynote, and Google Slides for seamless presentation use.


6 diapositivas
Executive Leadership Training Presentation
Enhance professional development with this executive leadership training template, designed with a step-by-step staircase layout symbolizing career progression. Perfect for leadership programs, corporate training, and skill-building workshops, it visually organizes six key topics for clarity. Fully editable in Canva, PowerPoint, or Google Slides, making customization effortless for any organization’s needs.