


Características


¿Tienes alguna pregunta?
Recomendar


5 diapositivas
Customer Perceived Value Analysis Presentation
Capture the essence of customer perception with this visually engaging template. Designed for businesses aiming to assess and enhance value propositions, it breaks down key insights into digestible segments. Perfect for marketing strategies and consumer behavior analysis, this template is fully compatible with PowerPoint, Keynote, and Google Slides for seamless customization.


5 diapositivas
Breast Cancer Awareness Day
Raise awareness and educate with this visually impactful Breast Cancer Awareness Day template. Featuring circular infographic elements styled in a breast tissue-inspired layout, this slide design is ideal for campaigns, health education, corporate wellness events, and social initiatives. Each section can be customized with key data, statistics, or actionable messages. Fully editable in PowerPoint, Keynote, and Google Slides.


6 diapositivas
Canvas Breakdown for Startup Strategy Presentation
Break down your startup strategy with this streamlined canvas layout. Designed for clarity and flow, this slide presents six core components in a visually engaging format. Ideal for early-stage founders, innovation teams, and pitch decks, it simplifies complex business models into clear, actionable sections for strategic alignment and storytelling.


5 diapositivas
Human Capital Planning Overview Presentation
Streamline workforce strategies with the Human Capital Planning Overview Presentation. This structured template helps visualize talent development, succession planning, and HR workflows in clear, step-by-step layouts. Perfect for HR leaders, consultants, and executives. Fully editable in PowerPoint, Keynote, and Google Slides for seamless customization to match your team or organization.


5 diapositivas
Quarterly Sales Funnel Overview Presentation
Visualize conversion performance with clarity using the Quarterly Sales Funnel Overview Presentation. This sleek funnel chart design breaks down each sales stage—from lead generation to closing—helping you present key percentages and insights effectively. Perfect for marketing reports, sales updates, and business reviews. Fully editable in Canva, PowerPoint, Keynote, and Google Slides.


6 diapositivas
Funnel Stages Infographic
In marketing and sales, the term "funnel stages" refers to the different stages or steps that a potential customer goes through in their journey from initial awareness of a product or service to making a purchase decision. These infographics visualize and help you understand the customer's progression through these stages. They aim to help businesses and professionals understand the customer journey and optimize their strategies for each stage of the funnel. Whether used in sales presentations, marketing workshops, or educational materials, this template helps businesses build successful sale funnels and maximize their revenue potential.


6 diapositivas
Risk Evaluation and Mitigation Plan Presentation
Take control of uncertainty with a clean, visual layout that helps you assess potential challenges and map out clear solutions. Ideal for project planning, operations, or corporate risk management, this presentation simplifies complex data into actionable insights. Compatible with PowerPoint, Keynote, and Google Slides for easy customization.


22 diapositivas
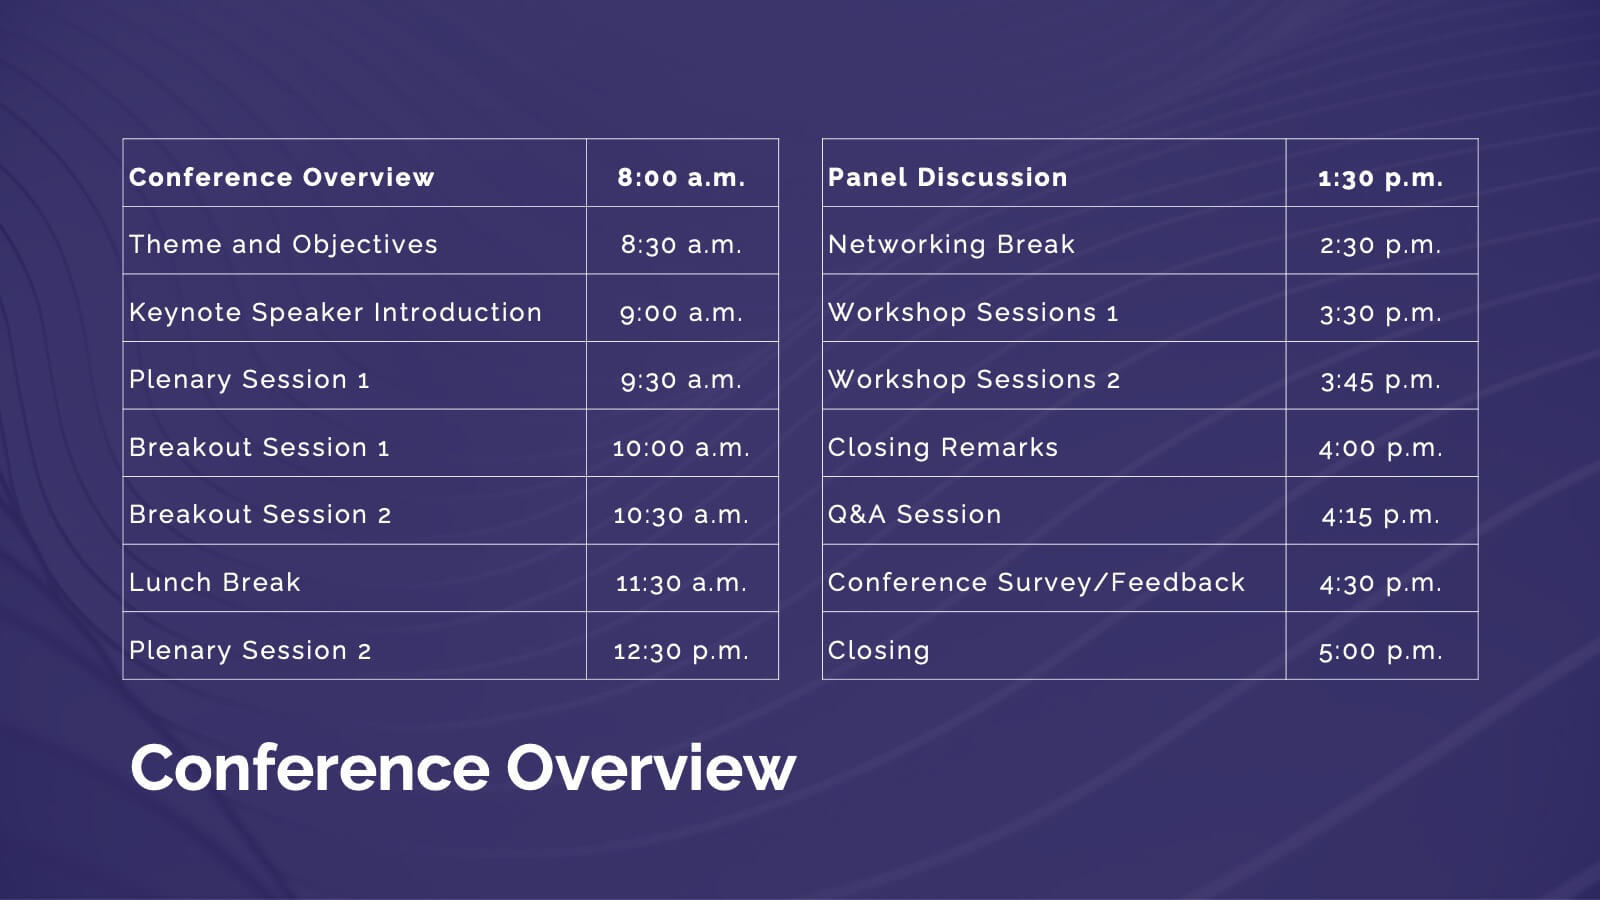
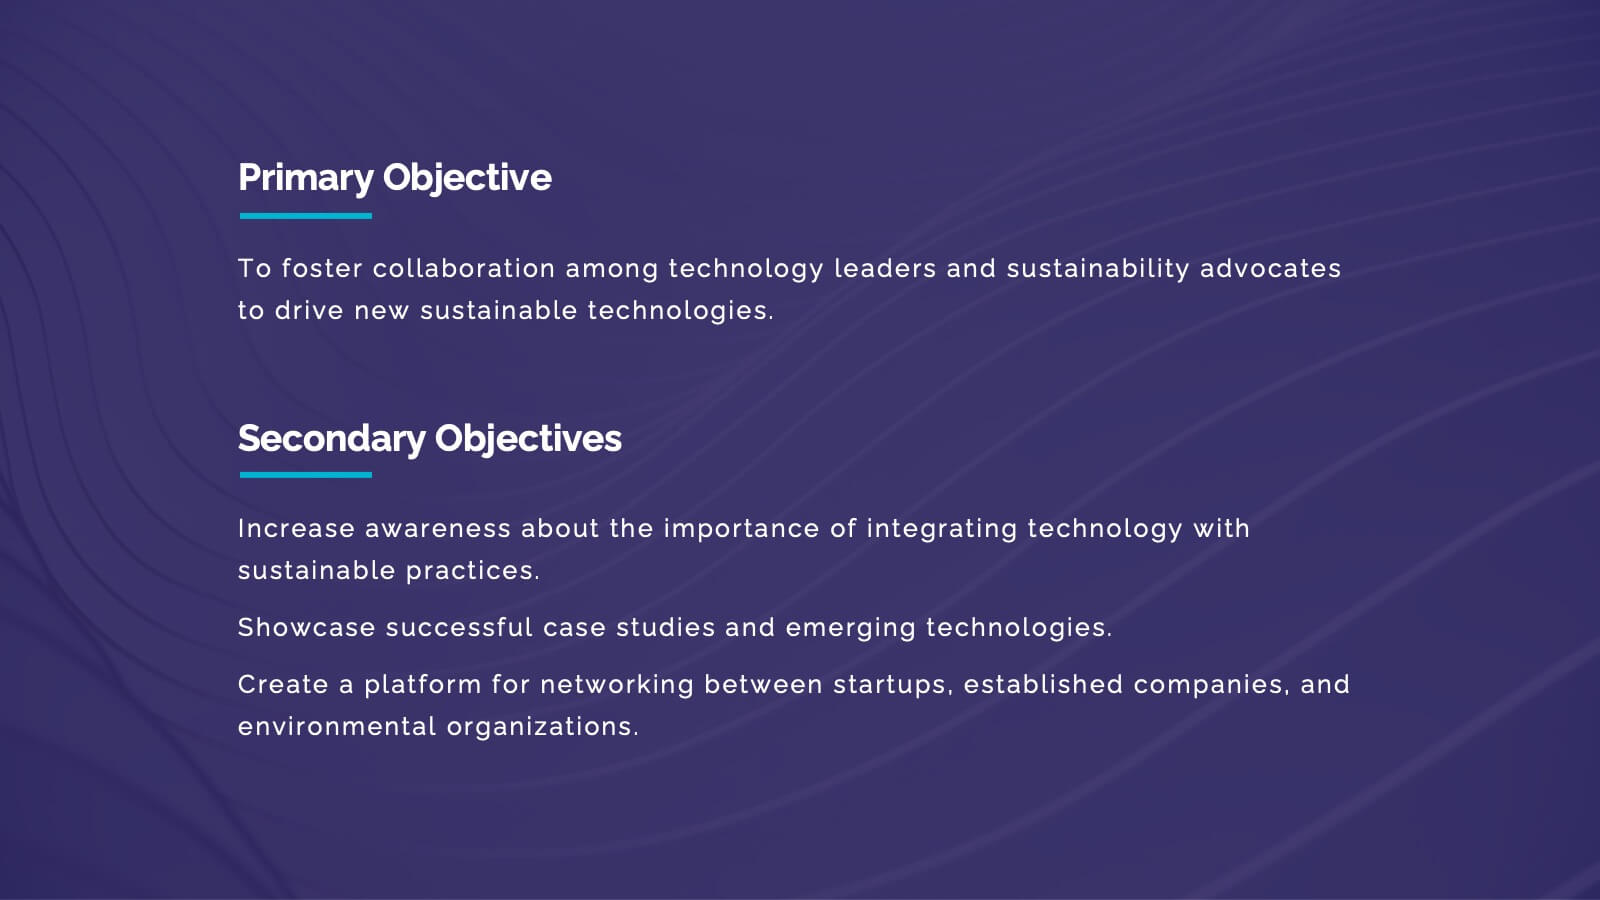
Nimbus Business Development Proposal Presentation
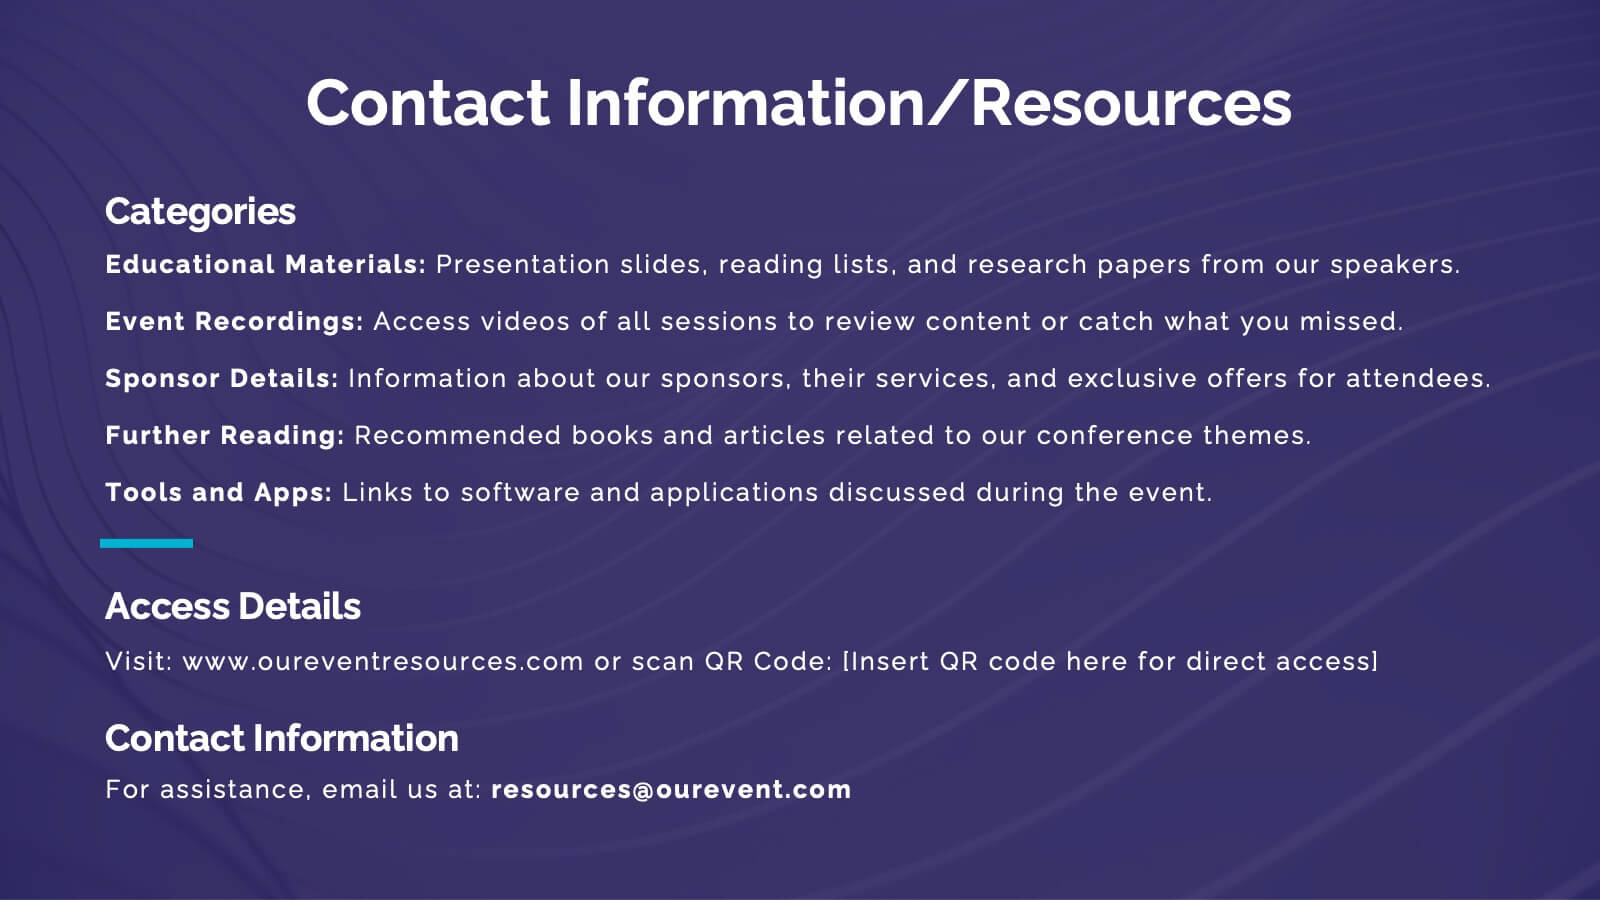
Boost your business presentations with this vibrant, professional template designed for business development proposals. Perfect for detailing conference overviews, themes, objectives, and keynotes, it features a clean and engaging layout. Highlight critical sessions and networking opportunities to captivate your audience. Compatible with PowerPoint, Keynote, and Google Slides, it ensures seamless presentations on any platform.


5 diapositivas
Importance of Sex Education Infographics
Sex Education is an important aspect of human development, but it can be a difficult topic to discuss. It is important for individuals to be knowledgeable about their own bodies and health, as well as understand healthy relationships and consent. These Infographics are visual tools designed to illustrate the need for sex education in schools and society. This template includes statistics, data, and facts about the benefits of sex education, including reducing the risk of sexually transmitted infections and unintended pregnancies, promoting healthy relationships, and empowering young people to make informed decisions about their sexual health.


7 diapositivas
Project Management Process Infographic
Navigate the vast arena of project management with our project management infographic. Anchored on a clear white base, the design is adorned with the calm of green, the trustworthiness of blue, and the innovative spirit of purple. Engage with meticulously designed infographics, tailored icons, and flexible image placeholders, providing a comprehensive visual guide to the realms of project planning, execution, and evaluation. Perfectly sculpted for Powerpoint, Keynote, or Google Slides. An invaluable asset for project managers, team leaders, consultants, or anyone in the corporate landscape wanting to visualize and optimize project stages.


2 diapositivas
End Slide with Contact and Gratitude Message Presentation
Say goodbye with impact and leave a lasting impression! This clean, modern slide is perfect for ending presentations with a clear contact section and a heartfelt thank-you message. Ideal for client decks, proposals, or reports. Fully compatible with PowerPoint, Keynote, and Google Slides for easy editing and customization.


10 diapositivas
Business Strategy Puzzle Presentation
Build a strong foundation with the Business Strategy Puzzle. This visually compelling design helps you break down key strategic components, business planning, and operational workflows into digestible segments. Perfect for corporate strategies, project management, and executive decision-making. Fully editable and compatible with PowerPoint, Keynote, and Google Slides.


4 diapositivas
Company Welcome and Overview Presentation
Set the tone for your business presentation with this professional welcome slide. Designed to introduce your company, services, or mission, it includes a customizable photo and clear text sections. Ideal for onboarding, team meetings, or proposals—fully editable in Canva, PowerPoint, or Google Slides for a polished first impression.


4 diapositivas
Startup Business Plan Executive Overview Presentation
Present your startup vision with this bold, rocket-themed executive overview template. Perfect for outlining growth strategies, milestones, and launch plans, it combines vibrant visuals with a clean layout. Fully editable in Canva, PowerPoint, and Google Slides, it’s ideal for inspiring investors and stakeholders with a clear, professional business roadmap.


22 diapositivas
Jade Graphic Design Project Plan Presentation
Unleash creativity with this vibrant Graphic Design Project template! Perfect for showcasing your design process, prototypes, and assets, it keeps the audience captivated with clean visuals and a fresh, modern look. Whether you're outlining color palettes or final designs, every slide exudes style. Ideal for PowerPoint, Keynote, and Google Slides!


7 diapositivas
South America Population Infographic Presentation
A South America map infographic is a visual representation of the continent of South America, highlighting its geography, population, culture, history, and other relevant information. Use this template as a graphic representation of South America that combines text, data, and images in an informative way. This infographic can be designed in different styles and formats, including political maps, physical maps, topographic maps, population density maps, and climate maps. You can also include information about major cities, landmarks, natural resources, and cultural traditions.


5 diapositivas
Strategic Budget Planning Forecasting Presentation
For strategic financial management, our Strategic Budget Planning Forecasting template provides a clear visual guide for balancing income and expenses. Ideal for financial planners, it simplifies quarter-by-quarter planning with dynamic charts, ensuring clarity and precision in forecasting financial outcomes. Fully compatible with PowerPoint, Keynote, and Google Slides, it's a versatile tool for any financial presentation or workshop.