


Características


¿Tienes alguna pregunta?
Recomendar


6 diapositivas
Business Performance Pie Chart
Visualize your key metrics clearly with this pie chart-style performance layout. Designed for business reviews and strategic updates, it breaks down five data categories into easy-to-read segments. Ideal for quarterly performance slides, team dashboards, and KPI tracking. Fully editable in PowerPoint, Keynote, and Google Slides.


26 diapositivas
Navigating the Creative Industry Presentation
Unlock the secrets to success in the creative industry with this dynamic and visually engaging presentation. Covering essential topics like career pathways, industry trends, collaboration strategies, and personal branding, this template helps you present insights with clarity and impact. Fully customizable and compatible with PowerPoint, Keynote, and Google Slides for a seamless experience.


5 diapositivas
Building Timeline Presentation
Bring structure and progress to your ideas with this visually engaging presentation design. Ideal for showcasing project milestones, construction phases, or business growth timelines, it helps you communicate progress clearly and professionally. Fully customizable and compatible with PowerPoint, Keynote, and Google Slides for seamless presentation editing and delivery.


4 diapositivas
Market Growth Strategy Presentation
Drive business success with this Market Growth Strategy template. Designed for marketers, entrepreneurs, and business analysts, this slide features a step-by-step financial growth visualization using stacked coin icons and peak markers. Showcase key strategies, revenue projections, and scaling tactics in an engaging, easy-to-follow format. Fully customizable and compatible with PowerPoint, Keynote, and Google Slides.


5 diapositivas
Recycling Basics Infographics
Recycling is the process of converting waste materials into new products to reduce the consumption of raw materials, energy usage, and environmental pollution. These infographic templates are designed to educate and motivate individuals to embrace recycling as a sustainable practice. With its eye-catching design, concise information, and visually appealing graphics, this template will help raise awareness and inspire positive recycling behaviors in your audience. This template allows you to effectively communicate key information about recycling. This is compatible with Powerpoint, Keynote, and Google Slides.


7 diapositivas
TAM SAM SOM Research Infographic
TAM, SAM, and SOM are acronyms often used in business and marketing to analyze and understand the potential market for a product or service. This infographic template acts as a compass, guiding you through the seas of Total Available Market (TAM), Served Available Market (SAM), and Share of Market (SOM). Compatible with Powerpoint, Keynote, and Google Slides. This showcases creative visualization methods to represent TAM, SAM, and SOM effectively, ensuring clarity and engagement. Use this template to discuss how insights from TAM SAM SOM analysis can shape business strategies, drive growth, and enhance competitiveness.


4 diapositivas
Governance Policy Overview Presentation
Set the foundation for transparency and accountability with this visually engaging presentation design. Perfect for outlining organizational rules, compliance standards, and policy frameworks, it turns complex governance details into clear, structured visuals. Fully customizable and compatible with PowerPoint, Keynote, and Google Slides for effortless professional presentations.


22 diapositivas
Gale Gust Financial Report Presentation
Unleash the power of your financial presentations with the Gale Gust Financial Report template! This sleek, modern design features a captivating black theme that radiates professionalism and confidence. The layout is meticulously structured to guide your audience through key highlights, performance metrics, sales performance, and financial summaries with ease. Each slide is designed to keep the focus on your data, with clean lines and a minimalist aesthetic that enhances readability and impact. Whether you're showcasing operational updates, market trends, or strategic initiatives, this template ensures that your content shines. Ideal for corporate meetings, investor updates, and financial reviews, this template is fully compatible with PowerPoint, Keynote, and Google Slides. The Gale Gust template is your perfect companion for delivering financial reports that command attention and leave a lasting impression. Get ready to make your numbers speak volumes!


6 diapositivas
Iceberg Chart Infographic
An iceberg infographic is a visual representation that uses the metaphor of an iceberg to convey information. This infographic template is designed to highlights the idea that only a small portion of the iceberg is visible above the waterline, while the majority of its mass remains hidden beneath the surface. The larger portion of the iceberg, submerged below the waterline, symbolizes the deeper or less obvious aspects of a topic. This can include underlying causes, complexities, challenges, or additional information that may not be immediately apparent. This is fully customizable and compatible with Powerpoint, Keynote, and Google Slides.


6 diapositivas
Environmental Science Infographics
Our "Environmental Science" infographic template, compatible with PowerPoint, Keynote, and Google Slides, is designed for educators, environmentalists, and scientists. This template effectively communicates important concepts in environmental science, making it a great tool for presentations and educational purposes. The template features key elements such as ecosystems, sustainability practices, and the impacts of climate change. It’s structured to help presenters convey complex environmental information in a way that is both easy to understand and visually engaging. This makes it ideal for educational settings, conferences, or public awareness campaigns about environmental issues. The design is vibrant and engaging, with a color scheme that reflects nature and environmental awareness. Incorporating greens, blues, and earth tones, it not only educates but also inspires the audience to think about the environment. Whether you're discussing conservation strategies, ecological studies, or environmental policies, this template ensures your presentation is both informative and visually striking.


4 diapositivas
Workforce Skills Gap Analysis
Spot the gap. Bridge the skills. This Workforce Skills Gap Analysis slide helps visualize the journey from your team’s current capabilities to their desired performance level, with a clear action plan in between. Fully editable and works seamlessly in PowerPoint, Keynote, and Google Slides.


6 diapositivas
Aviation Center Infographic
An aviation center refers to a facility or institution that is dedicated to activities related to aviation, which includes the design, development, manufacturing, maintenance, operation, and training associated with aircraft and aerospace technology. This engaging infographic template provides a concise and visually appealing overview of an aviation center's facilities, services, and offerings. This infographic plays a vital role in advancing the aviation industry, conducting research, offering training, and providing resources for aviation professionals and enthusiasts. This is the perfect template to encourage potential pilots and aviation enthusiasts.


21 diapositivas
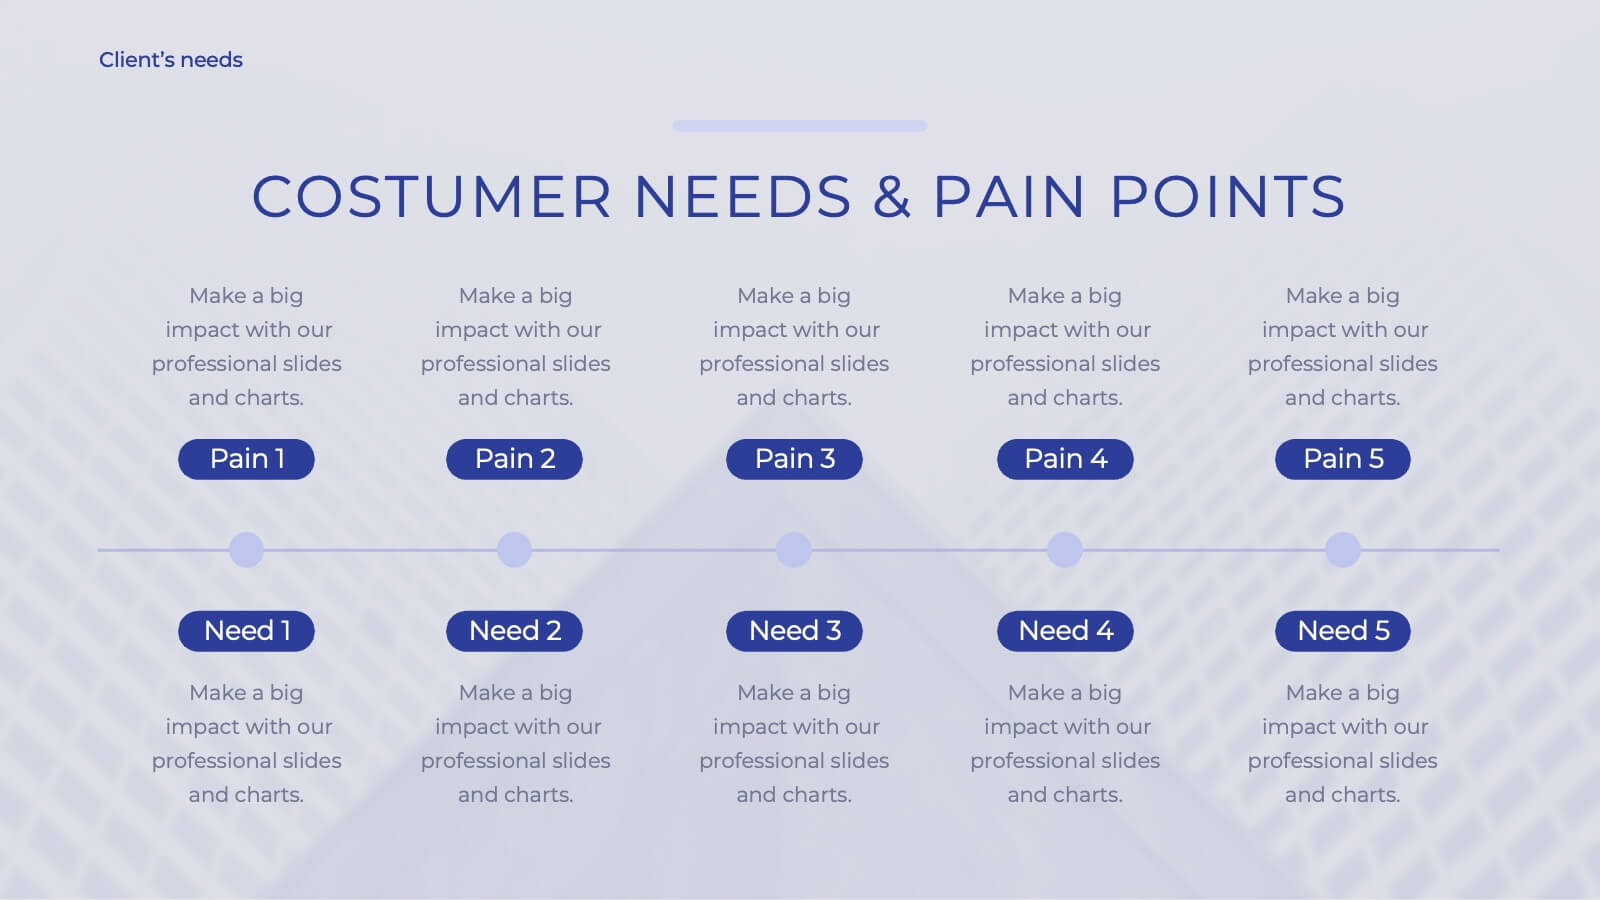
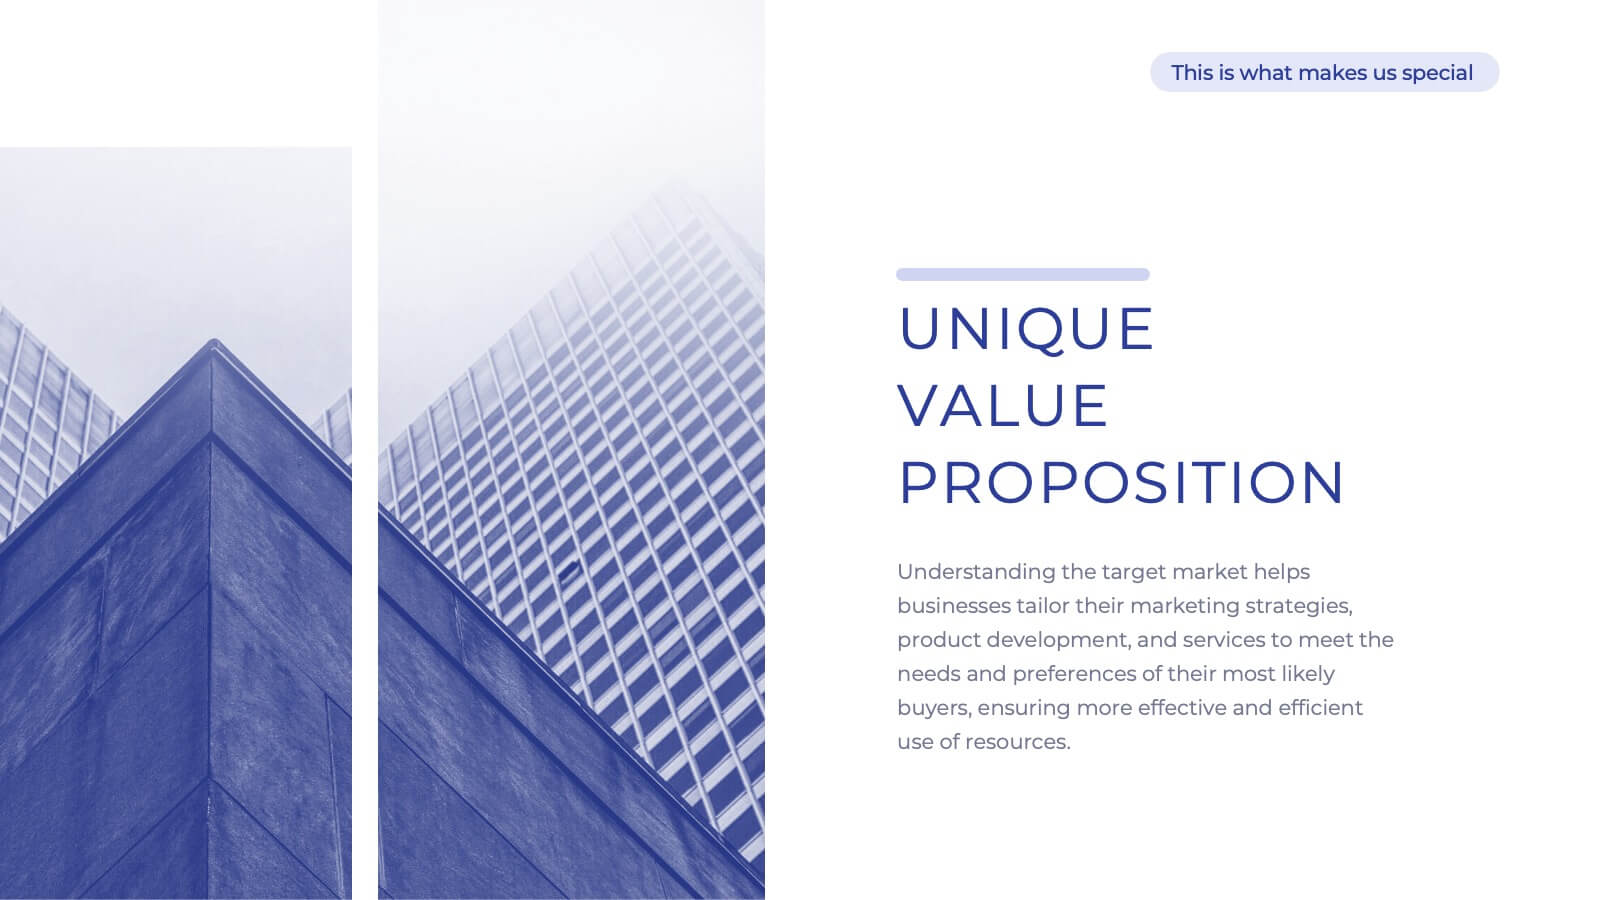
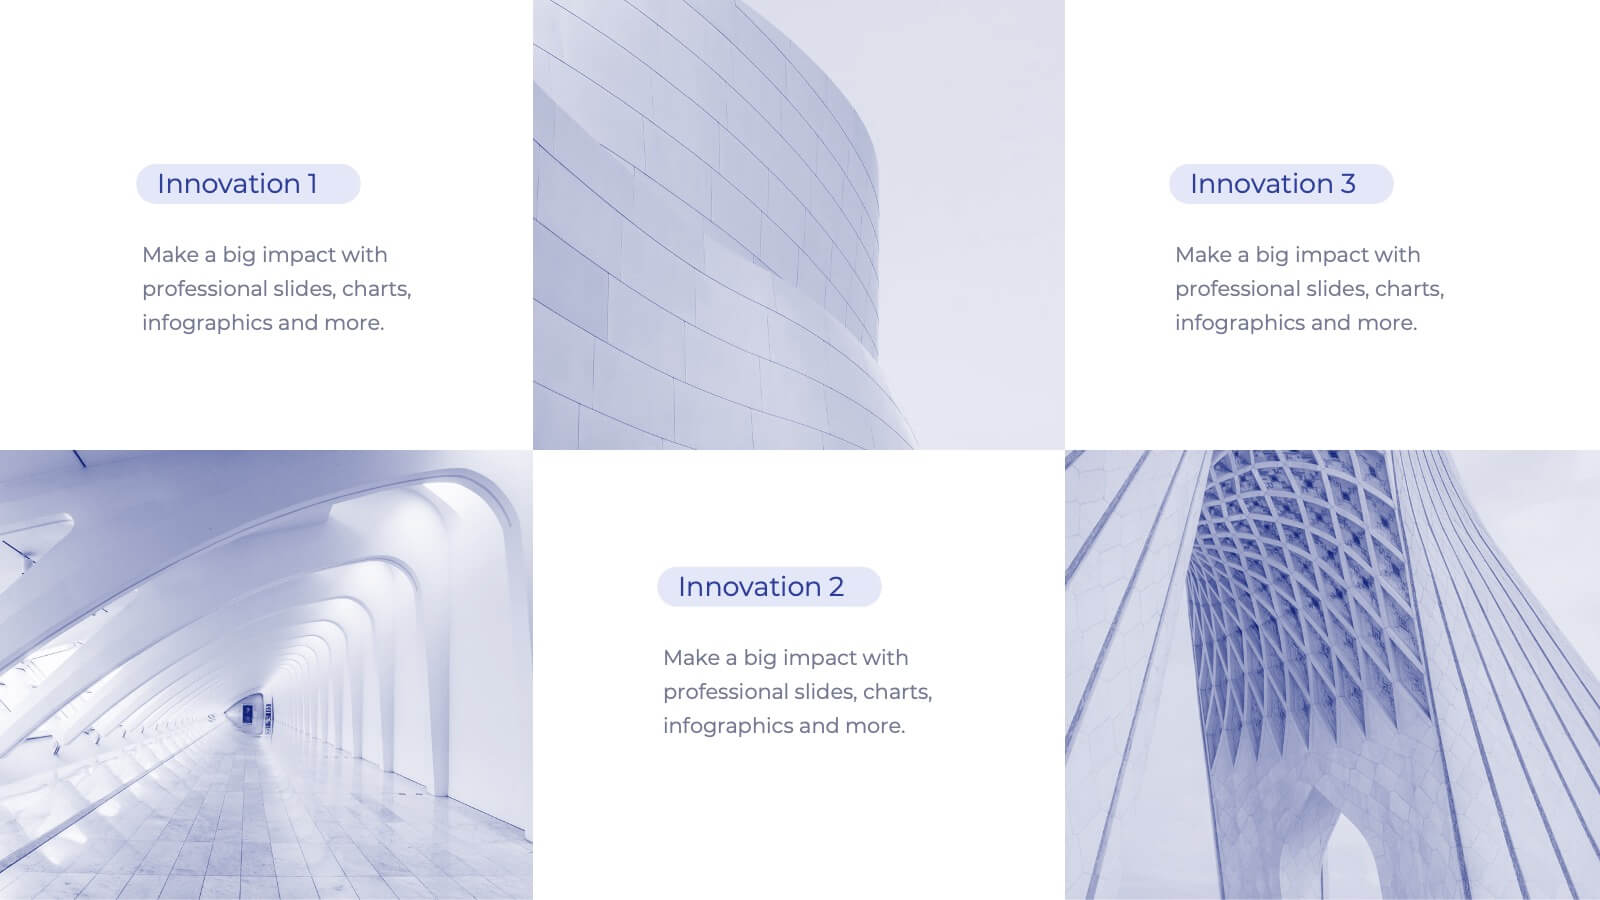
Hyperluma Startup Business Plan Presentation
Launch your vision with this startup business plan template, crafted to communicate your mission, market potential, and growth strategy with clarity and impact. Covering customer needs, unique value propositions, and financial projections, it’s ideal for entrepreneurs and founders. This template is compatible with PowerPoint, Keynote, and Google Slides, ready to fuel your startup’s journey.


6 diapositivas
Sales Performance Slide Presentation
Get ready to showcase your results with a slide that makes progress feel genuinely exciting. This presentation highlights key sales metrics, performance stages, and growth insights in a clean, visual format that’s easy to follow and great for reports or team updates. Fully compatible with PowerPoint, Keynote, and Google Slides.


7 diapositivas
Hierarchy Infographic Presentation Template
This Hierarchy infographic template presents information in a hierarchical format and makes it easy to see the most important pieces of information without having to read through all of your content. Use this template as a starting point to create an effective hierarchy chart by copying and pasting the template into PowerPoint. It features an assortment of color schemes and styles that can be customized. Our hierarchy infographic template will help you build an amazing presentation. This isn't just an ordinary Infographic template, it features a design that will stand out in the crowd!


20 diapositivas
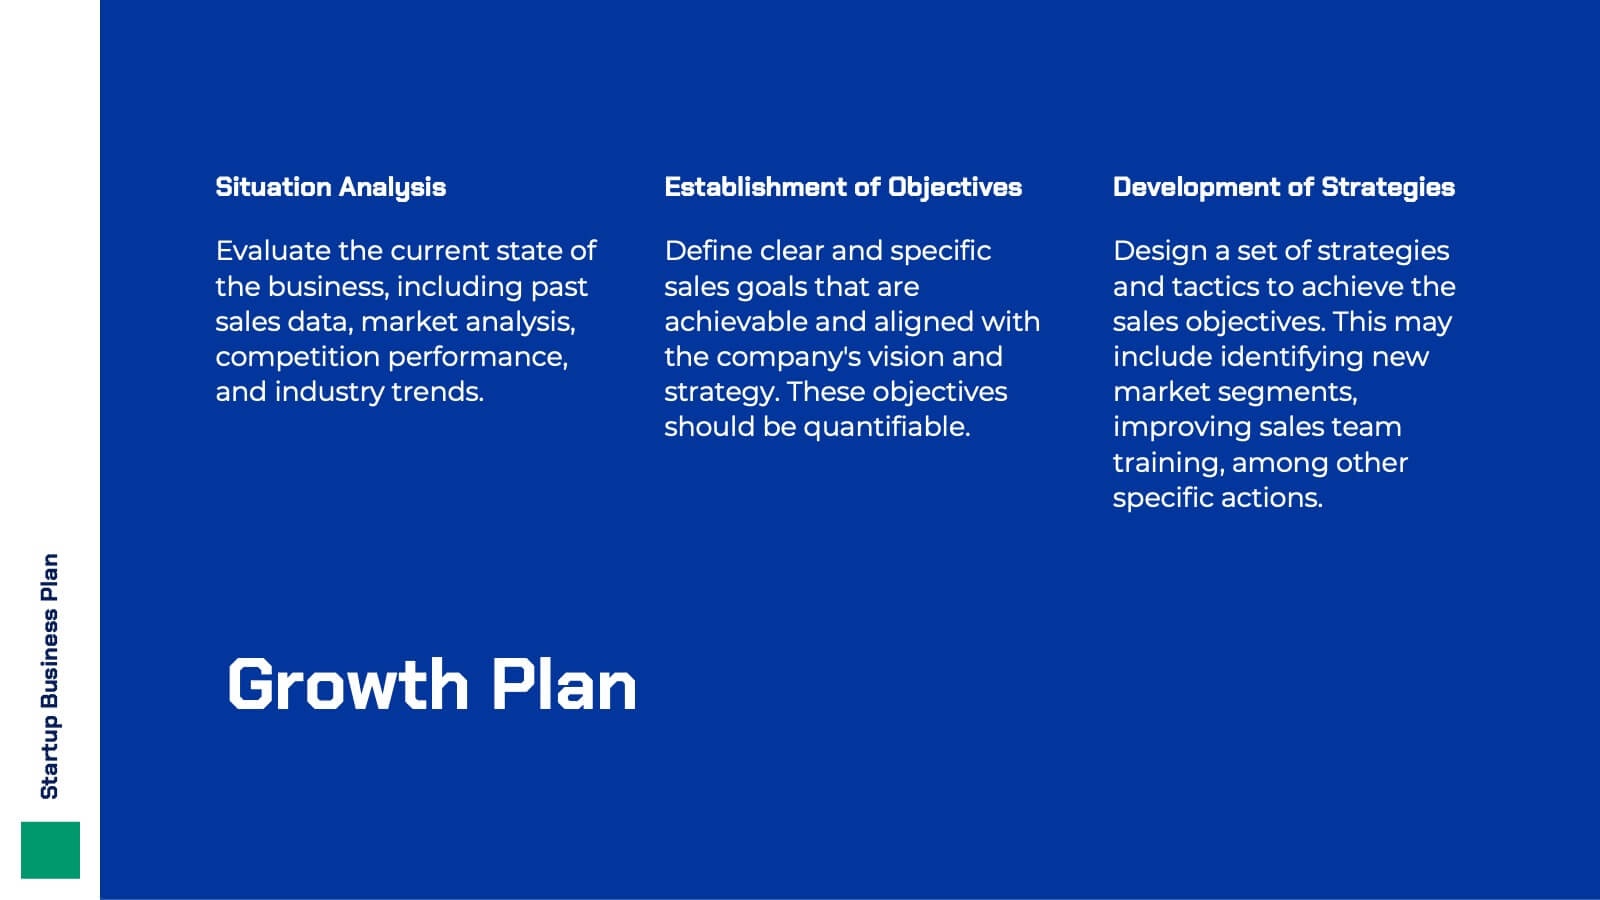
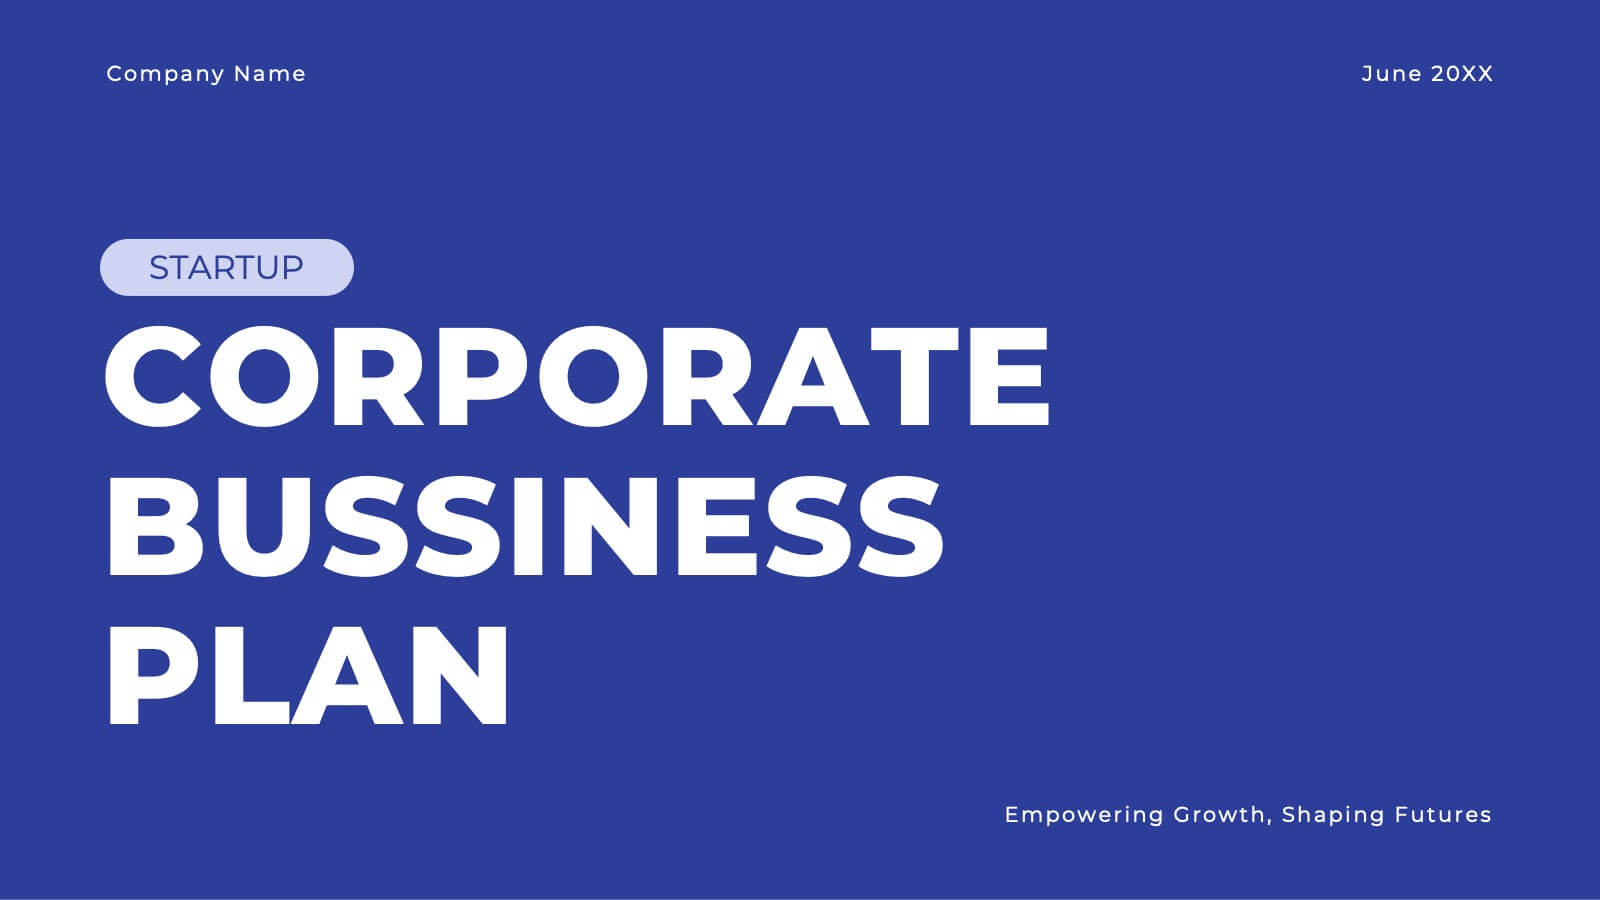
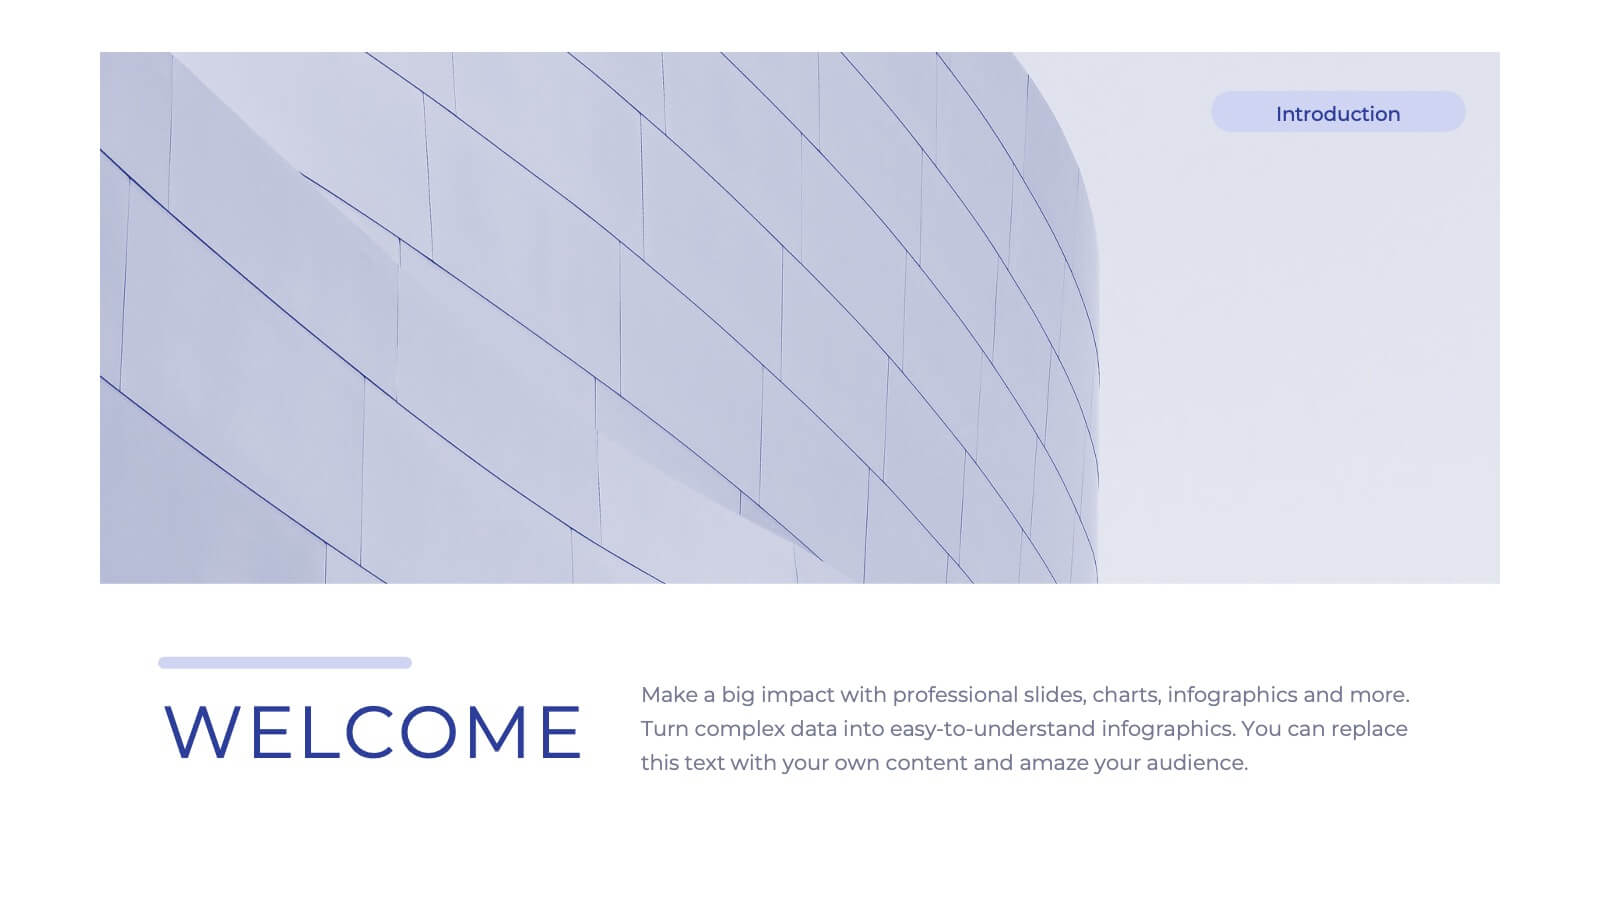
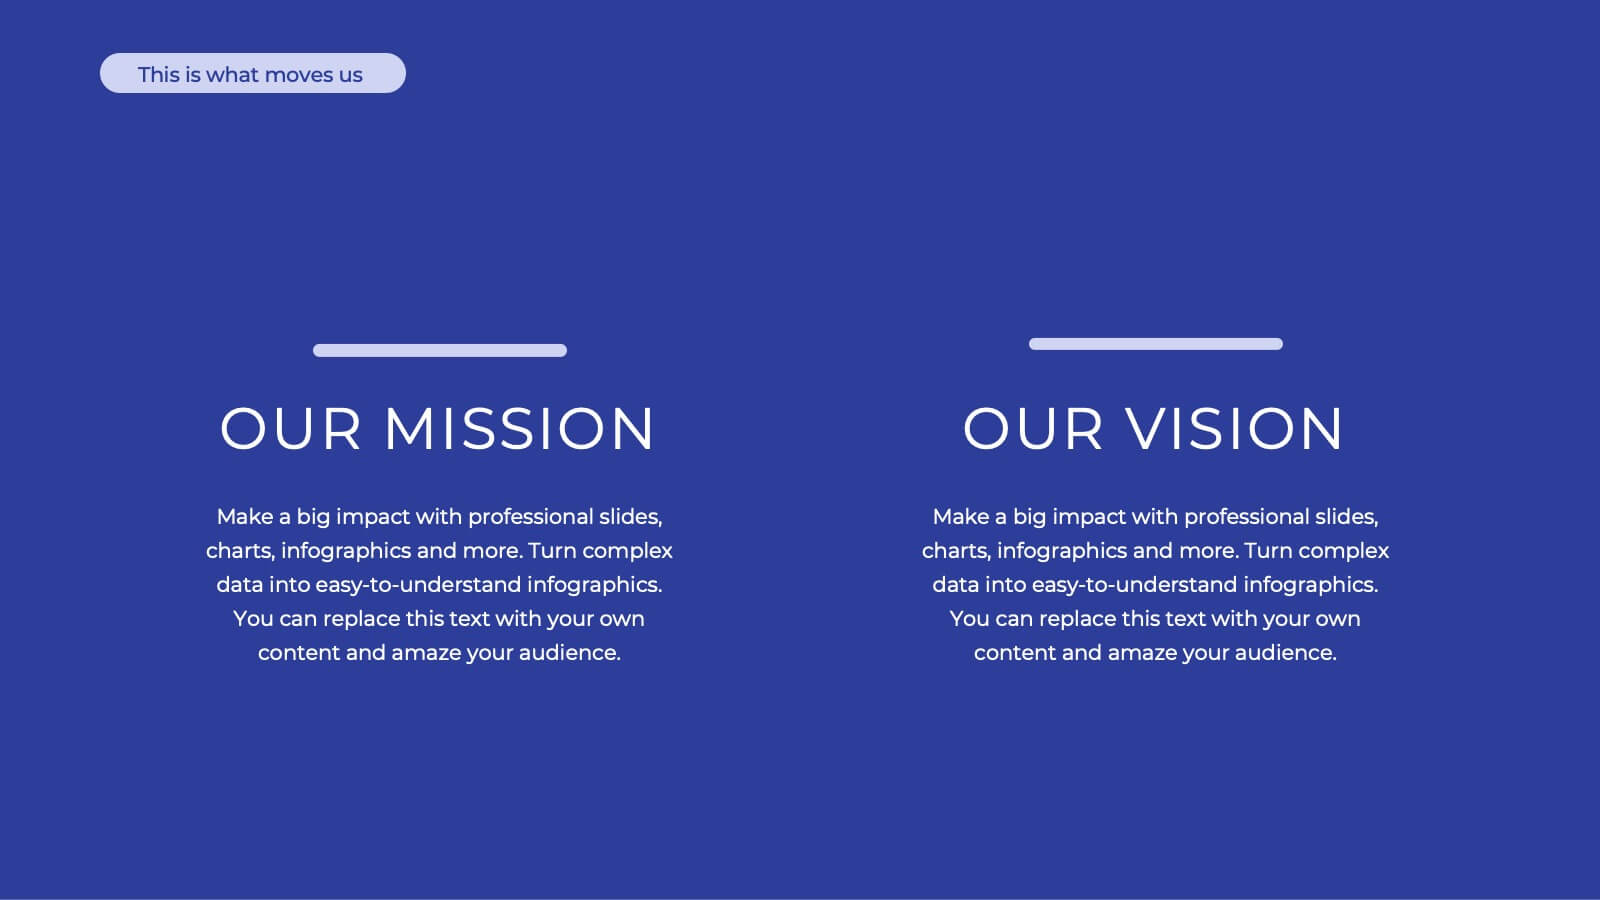
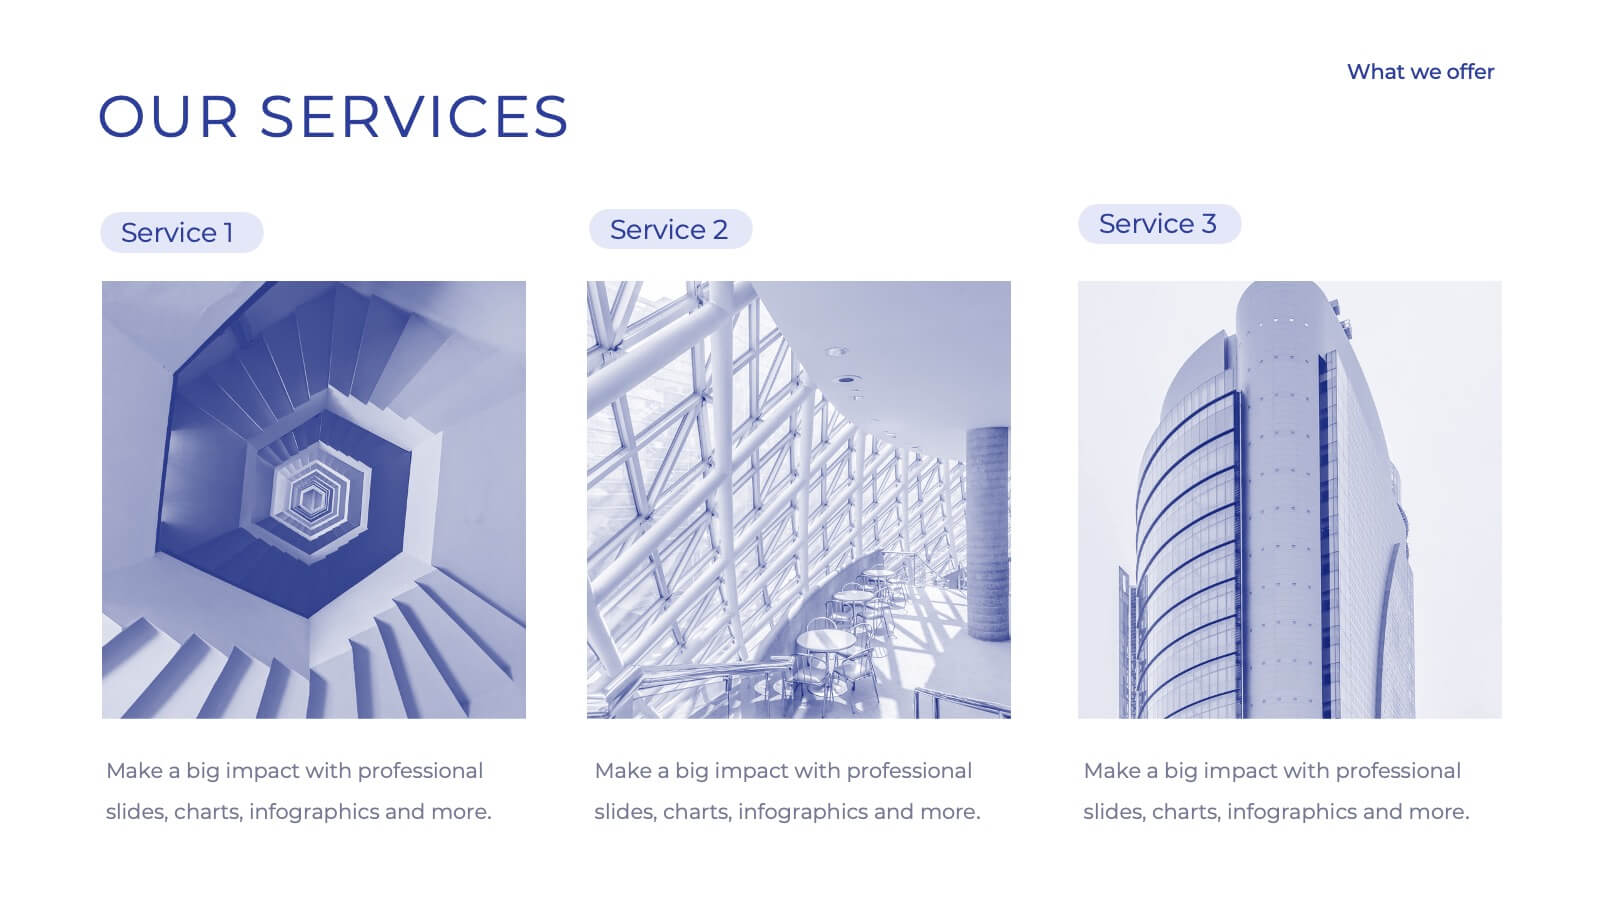
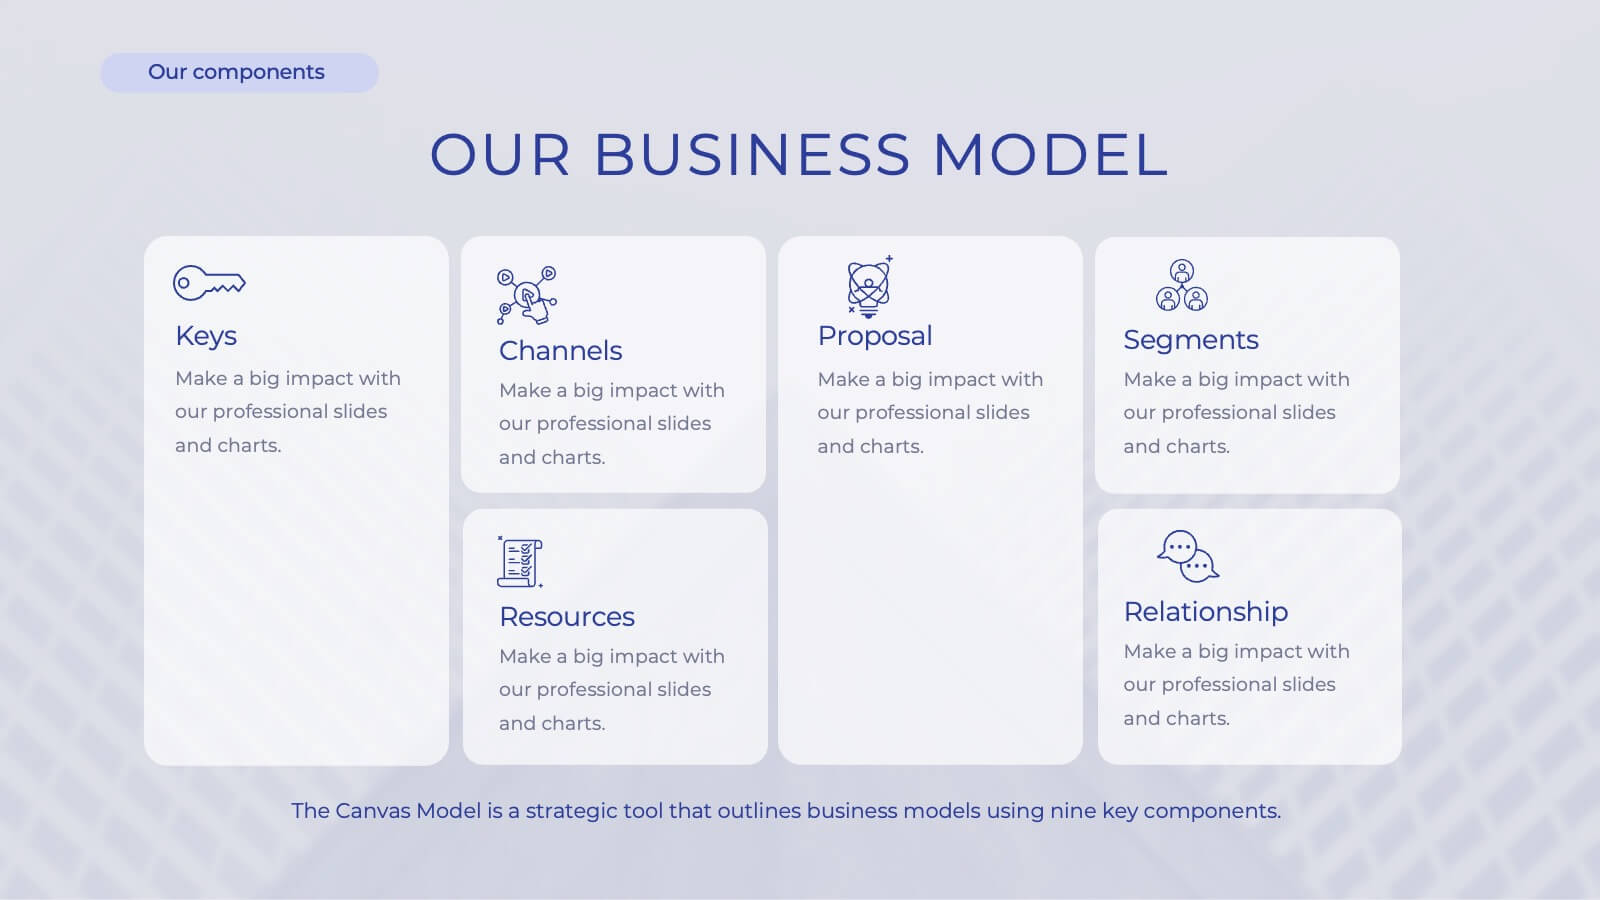
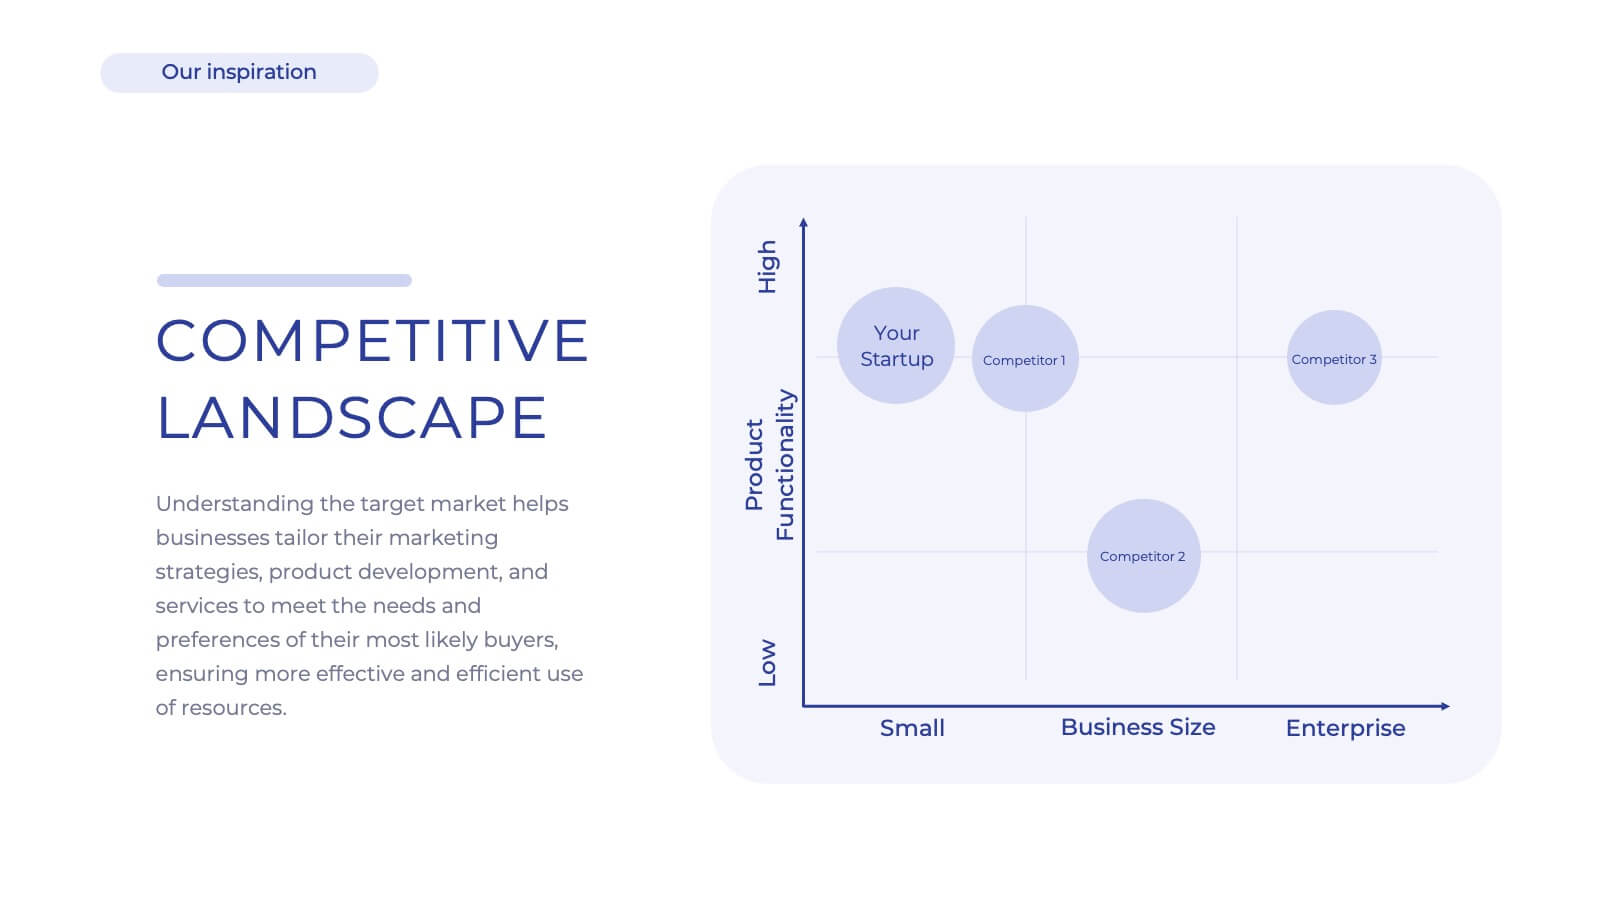
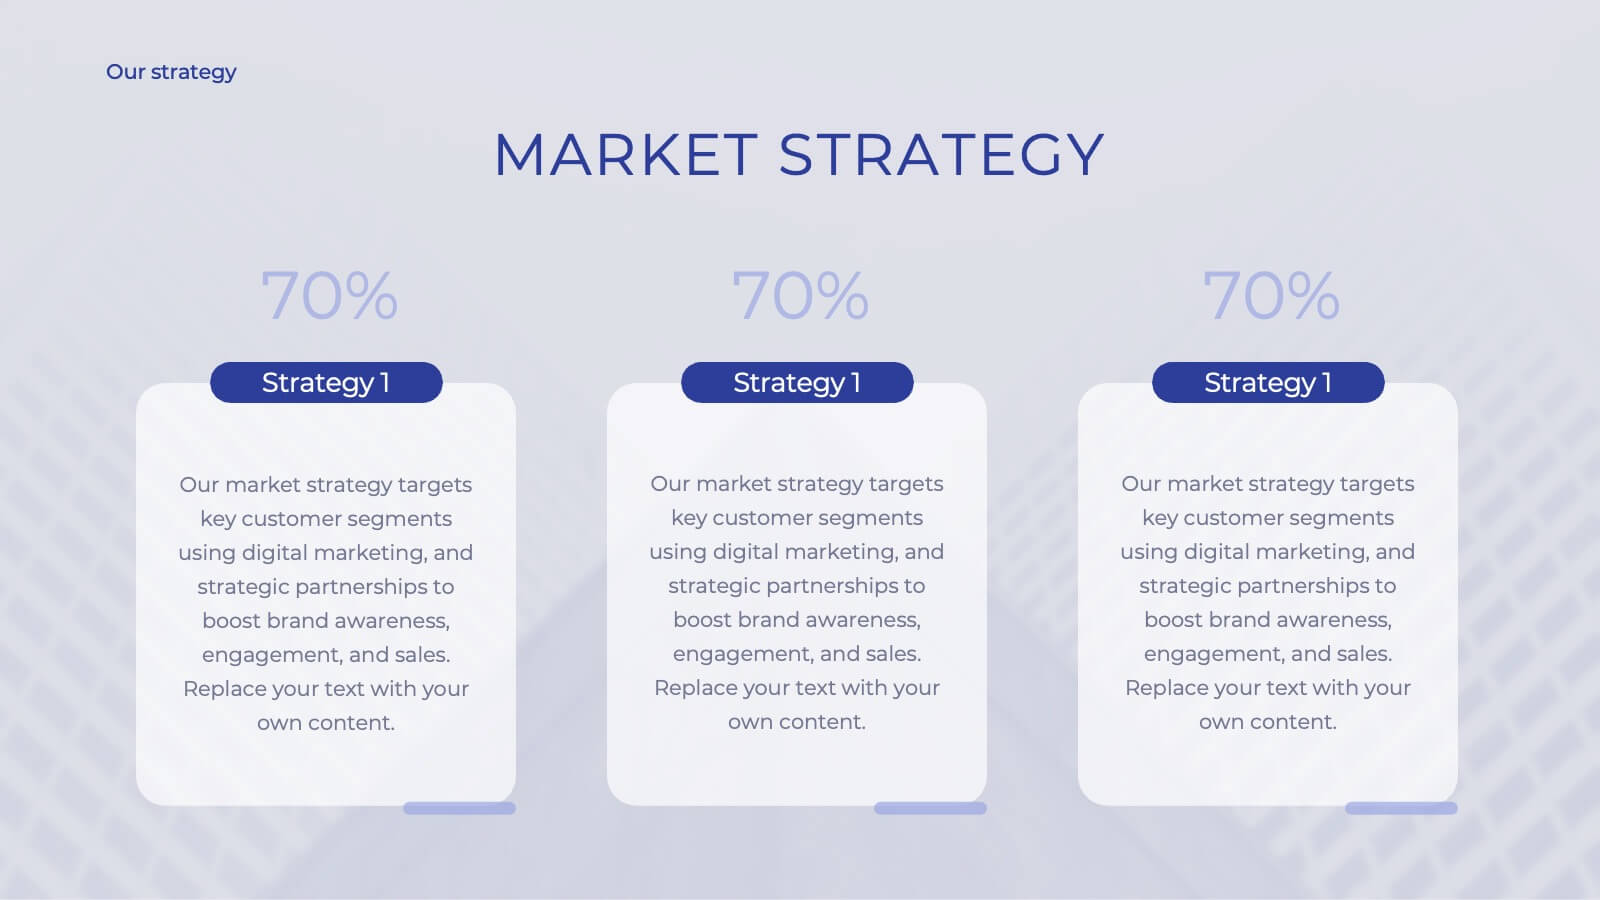
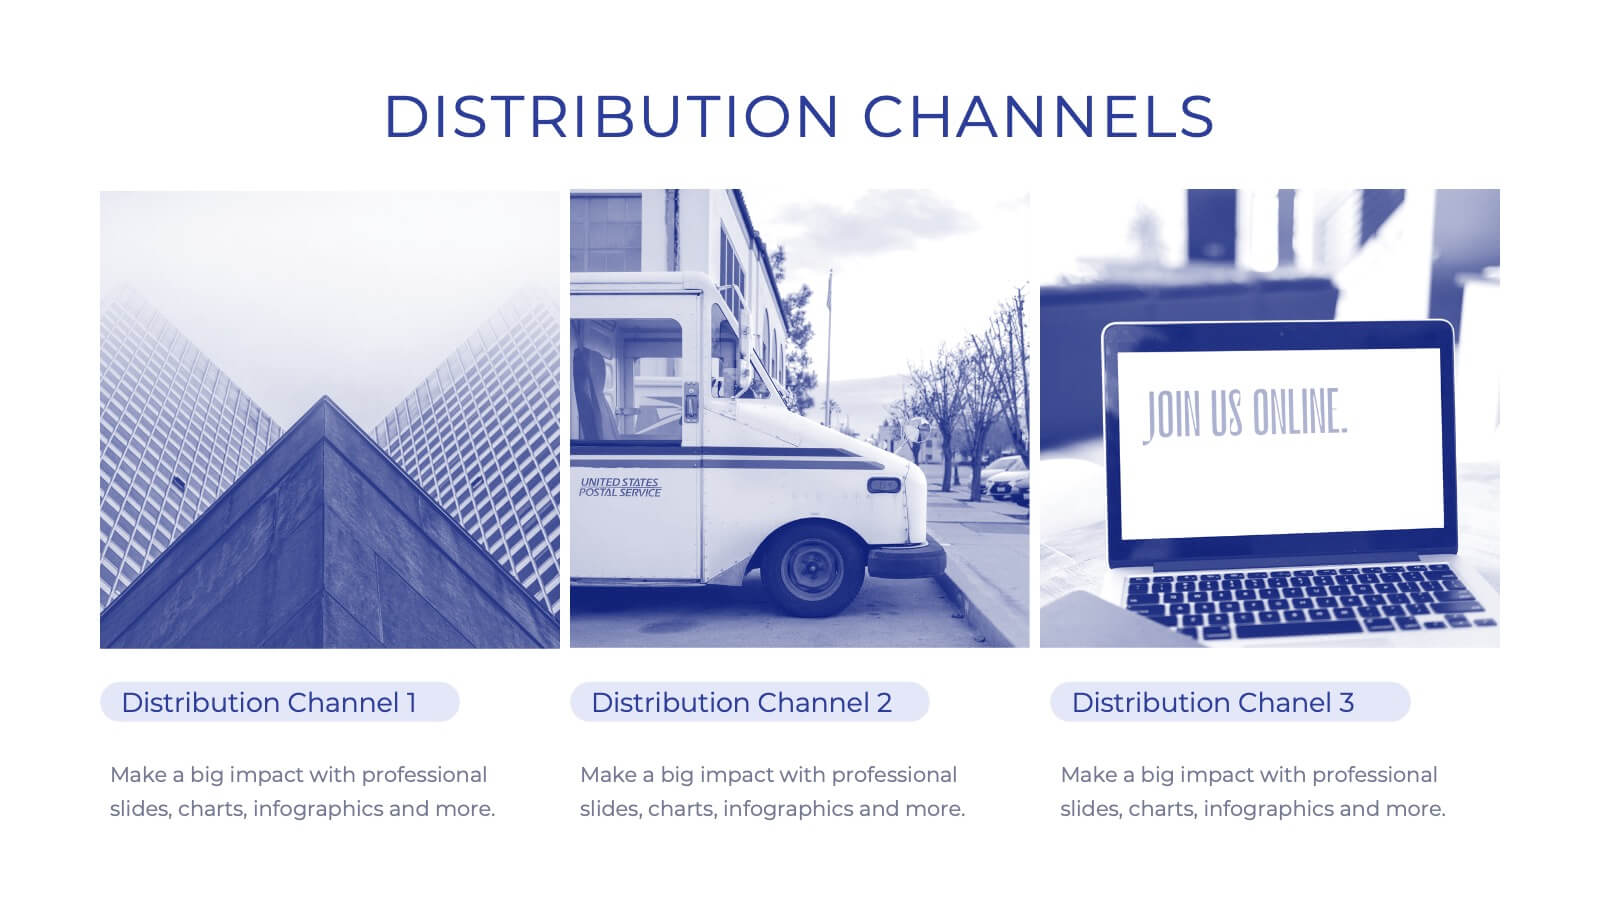
Iconic Startup Business Plan Presentation
Introducing our comprehensive corporate business plan template! Perfect for showcasing your company’s mission, vision, and services. Highlight your market strategy, competitive landscape, and growth plan in a professional design. Ideal for executives and entrepreneurs. Compatible with PowerPoint, Keynote, and Google Slides.


7 diapositivas
Balance Sheet and Profit Overview Presentation
Give your financial summary a clean, modern look with the Balance Sheet and Profit Overview Presentation. This slide offers a dual-column layout with icons and space for six key financial metrics or business insights—ideal for summarizing assets, liabilities, profits, and more. Easily editable in Canva, PowerPoint, and Google Slides.