


Características


¿Tienes alguna pregunta?
Recomendar


12 diapositivas
Business Issue Root Cause Identification Presentation
Pinpoint Business Challenges with Precision using this Business Issue Root Cause Identification presentation template. Designed to uncover underlying problems efficiently, this template features structured visuals, hierarchical frameworks, and clear labeling to facilitate root cause analysis. Whether you're a business strategist, operations manager, or consultant, this template helps identify, analyze, and resolve critical business issues. Fully customizable and compatible with PowerPoint, Keynote, and Google Slides, ensuring a seamless and professional presentation experience.


4 diapositivas
Marketing SWOT Assessment Presentation
Analyze your brand’s position with this colorful Marketing SWOT Assessment layout. Clearly outline strengths, weaknesses, opportunities, and threats in a column format, perfect for client reports or strategy sessions. Fully customizable in PowerPoint, Keynote, and Google Slides—ideal for marketers seeking clarity, structure, and visual impact in every presentation.


5 diapositivas
User Experience Survey Findings Presentation
Present key insights from your user research in a clean and impactful way with this survey findings slide. Designed to highlight percentages and categories clearly, it helps your audience quickly understand what users value most. Ideal for UX reports and product feedback reviews. Fully compatible with PowerPoint, Keynote, and Google Slides.


6 diapositivas
5-Stage Circular Cycle Presentation
Energize your workflow with a clean, circular layout that turns five interconnected steps into a clear, engaging story. This presentation helps you explain any repeating process or continuous cycle with simplicity and flow, making complex ideas easier to follow. Compatible with PowerPoint, Keynote, and Google Slides.


4 diapositivas
Workforce Adaptation Through Change Management Presentation
Show how your team evolves and thrives through transformation with this visual journey up the change curve. This template uses a clear mountain-climb illustration to highlight workforce progression and adaptation. Ideal for HR, change leaders, and organizational development professionals. Fully compatible with PowerPoint, Keynote, and Google Slides.


4 diapositivas
School Curriculum Overview Presentation
Present your academic plan with this creative curriculum overview layout. Featuring intersecting pencil graphics, it visually organizes four key subjects or areas of focus. Perfect for teachers, school administrators, or education consultants. Fully customizable in PowerPoint, Keynote, and Google Slides to match any educational level or institutional branding.


10 diapositivas
Key Strategies for Business Success Presentation
Achieve your goals with the Key Strategies for Business Success Presentation template. This structured and visually compelling slide deck is designed to outline essential business strategies, success factors, and growth plans. Featuring a clean and professional layout, this template is perfect for entrepreneurs, corporate teams, and business consultants. Fully customizable and available for PowerPoint, Keynote, and Google Slides, making it easy to tailor for your specific needs.


5 diapositivas
Employee Onboarding HR Presentation
Start your presentation with energy and clarity using this clean, engaging slide designed to simplify every step of the onboarding journey. It helps explain employee integration, training stages, and team alignment in a way that feels intuitive and visually organized. Fully compatible with PowerPoint, Keynote, and Google Slides.


6 diapositivas
Annual Scheduling with Calendar Milestones Presentation
Make your year feel like a well-oiled machine with this bold, color-coded visual layout. It helps you map out project phases, monthly milestones, and long-term plans with clarity and structure. Ideal for strategy meetings or annual reviews, this editable template works seamlessly in PowerPoint, Keynote, and Google Slides.

21 diapositivas
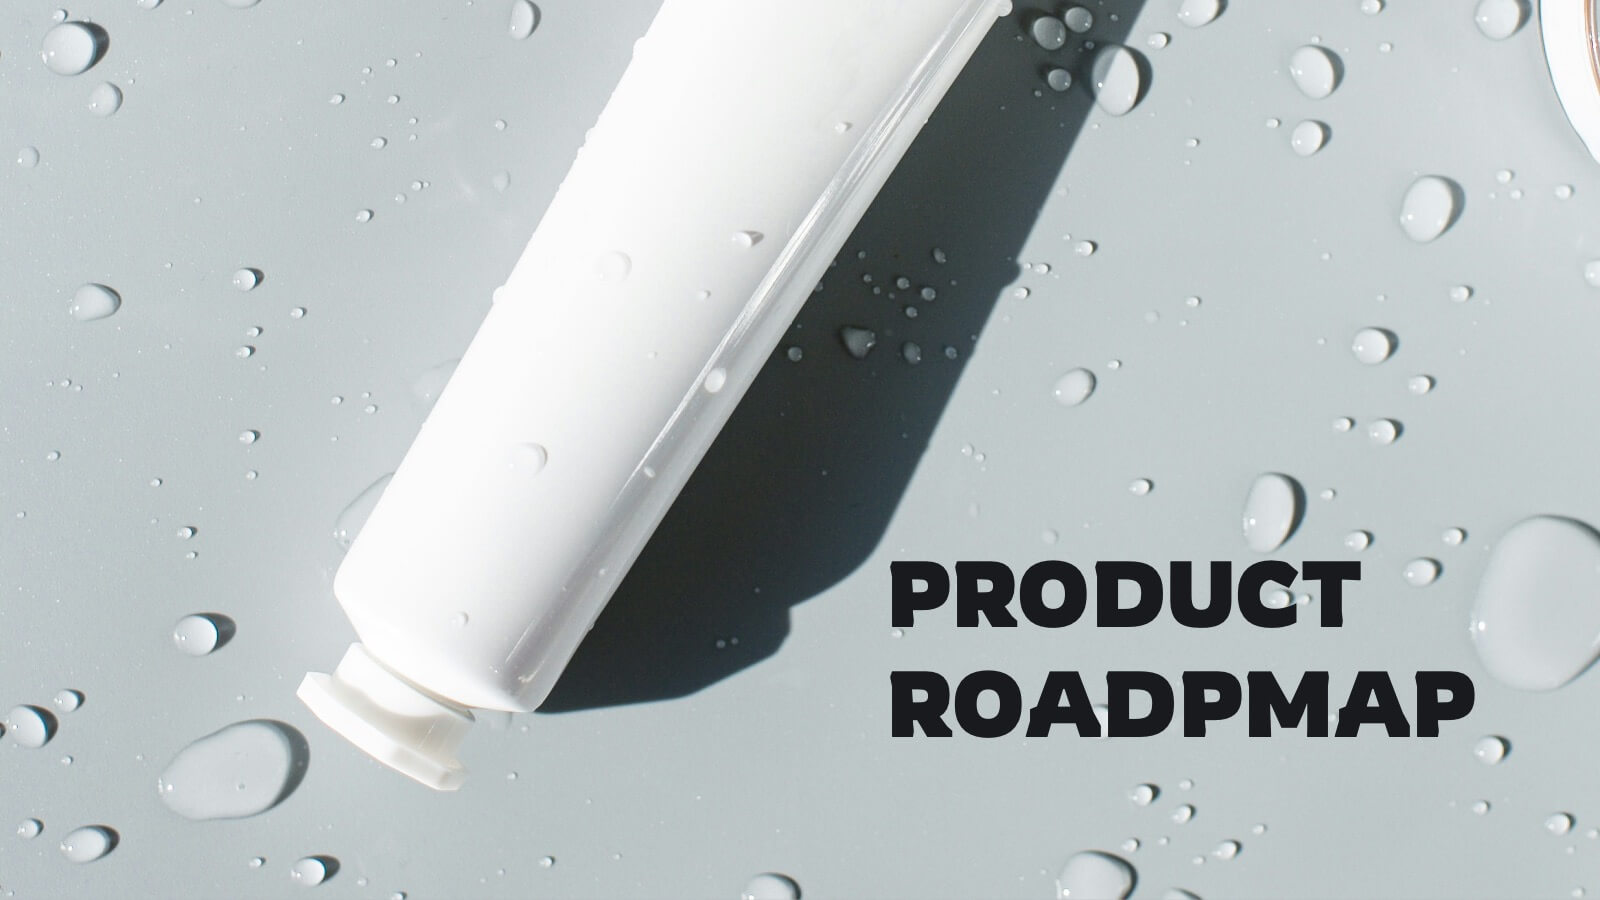
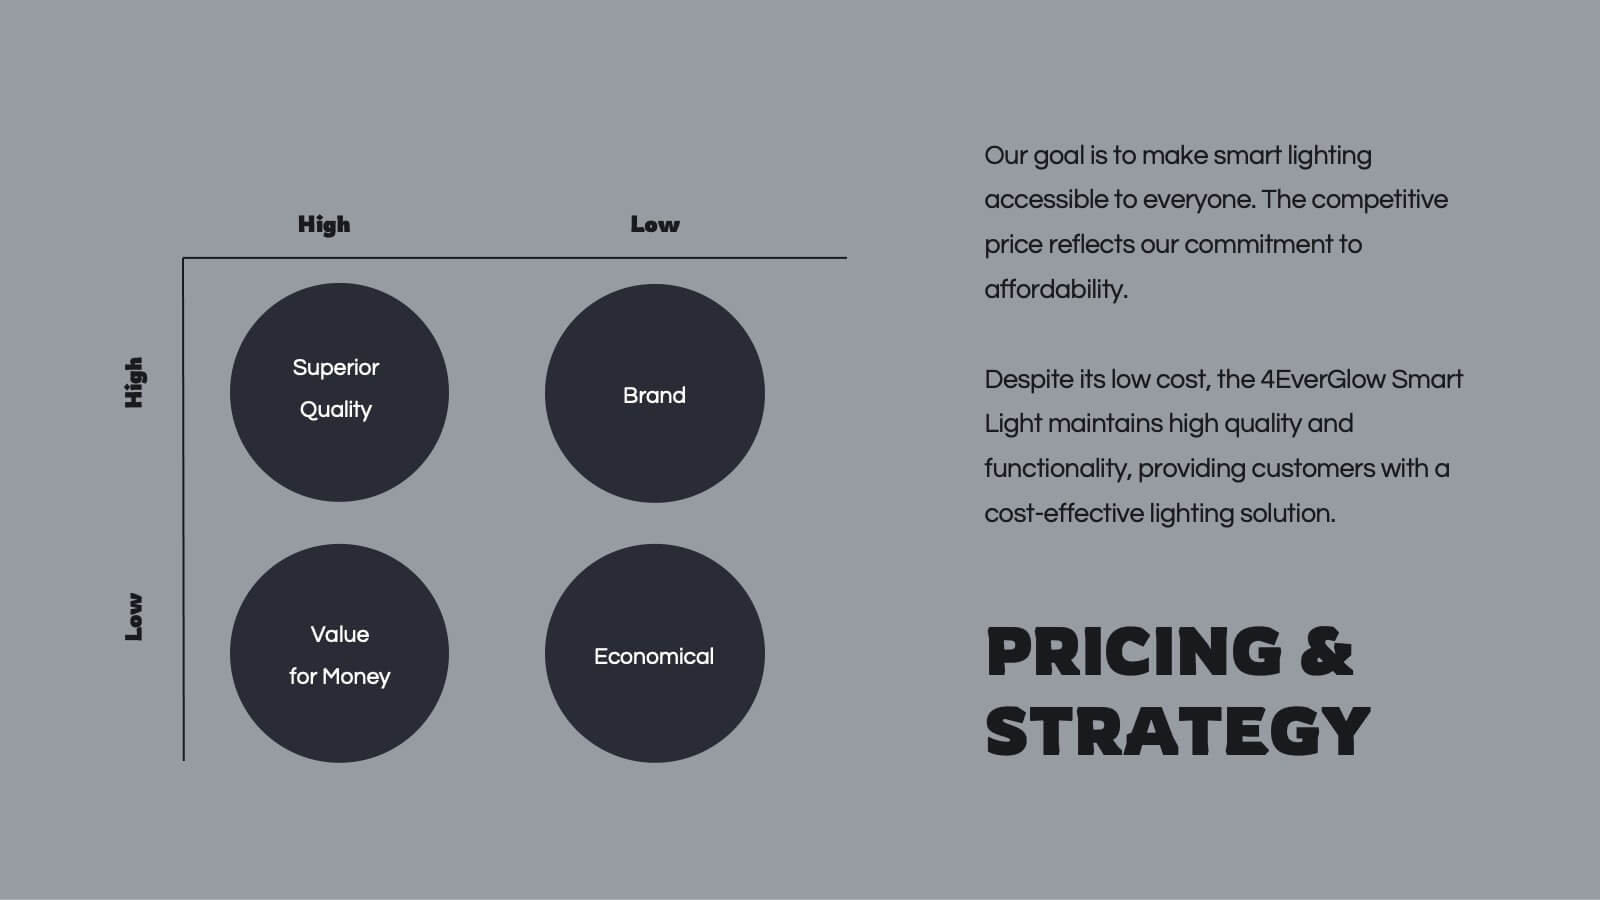
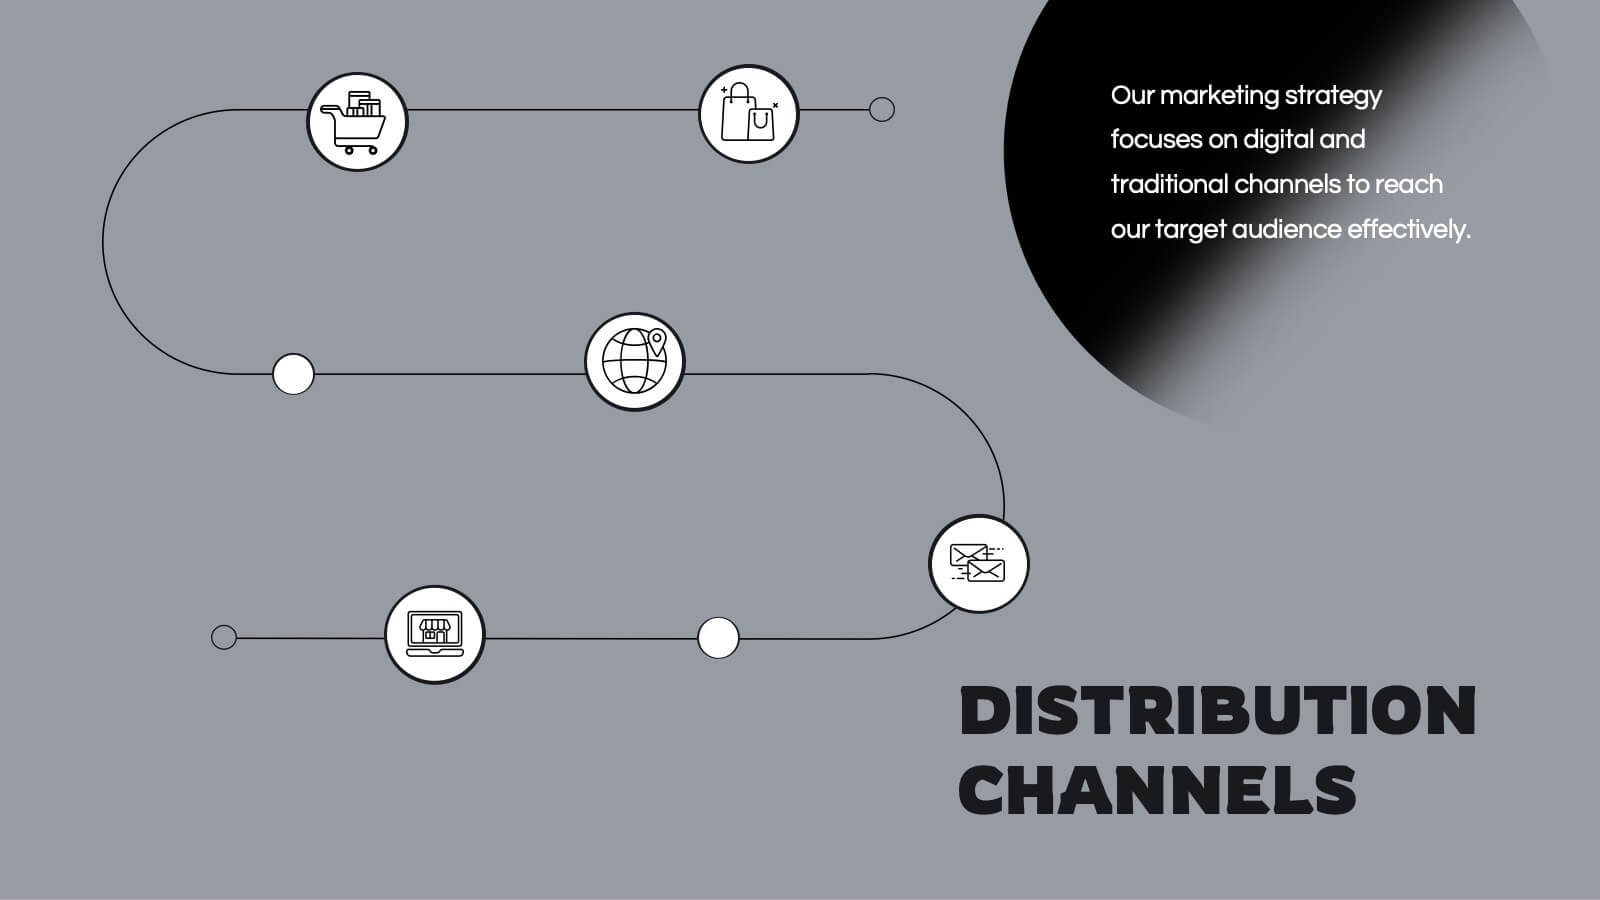
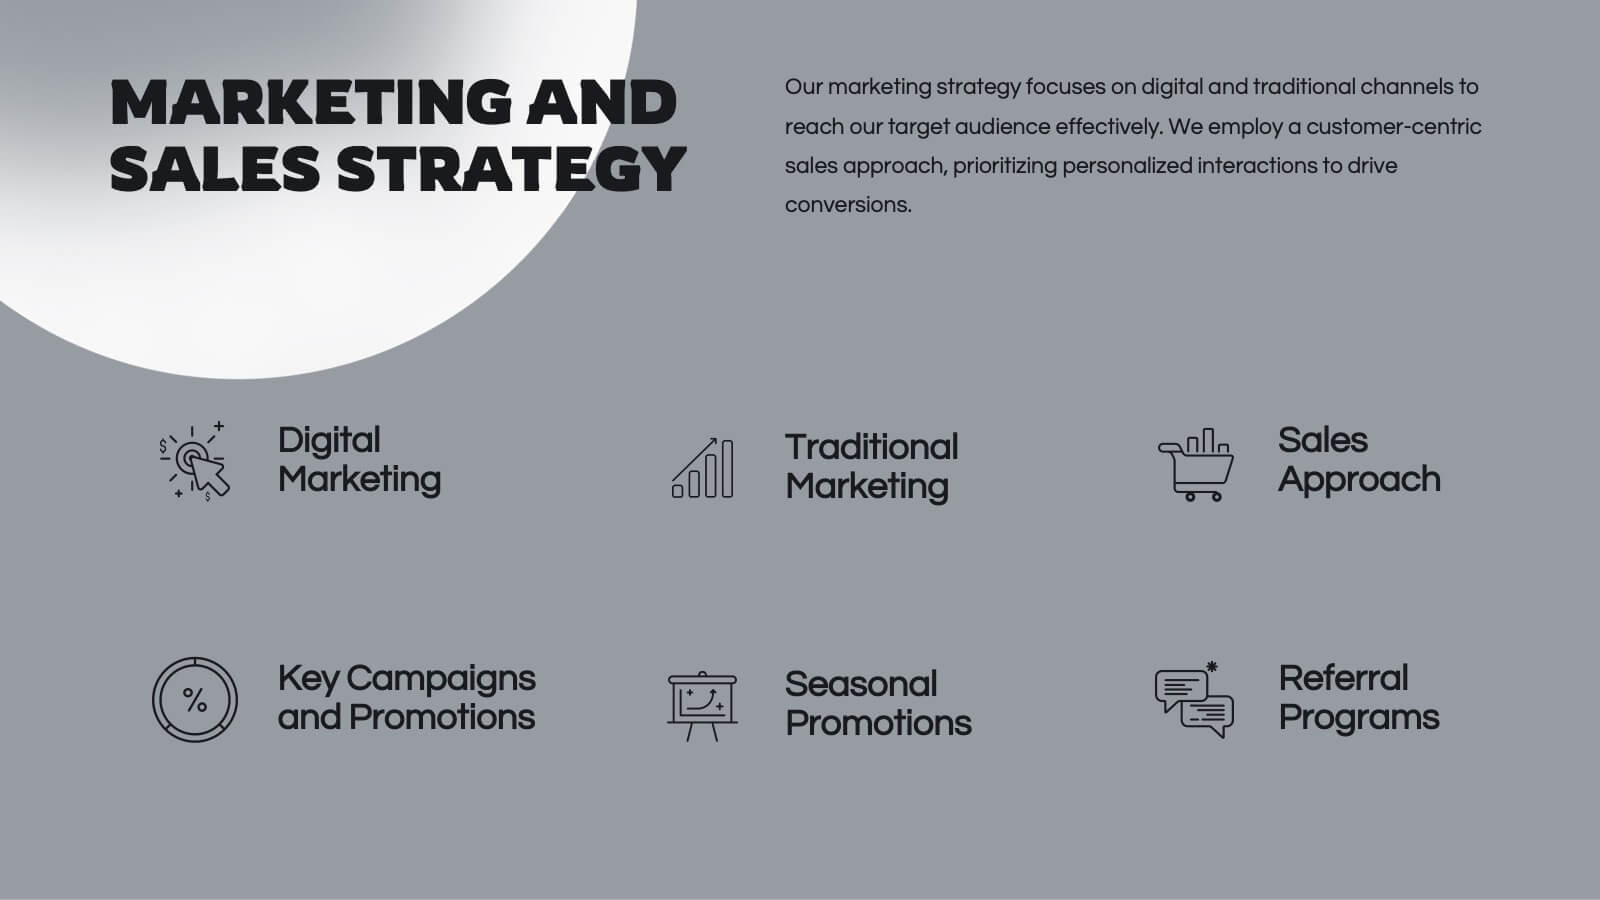
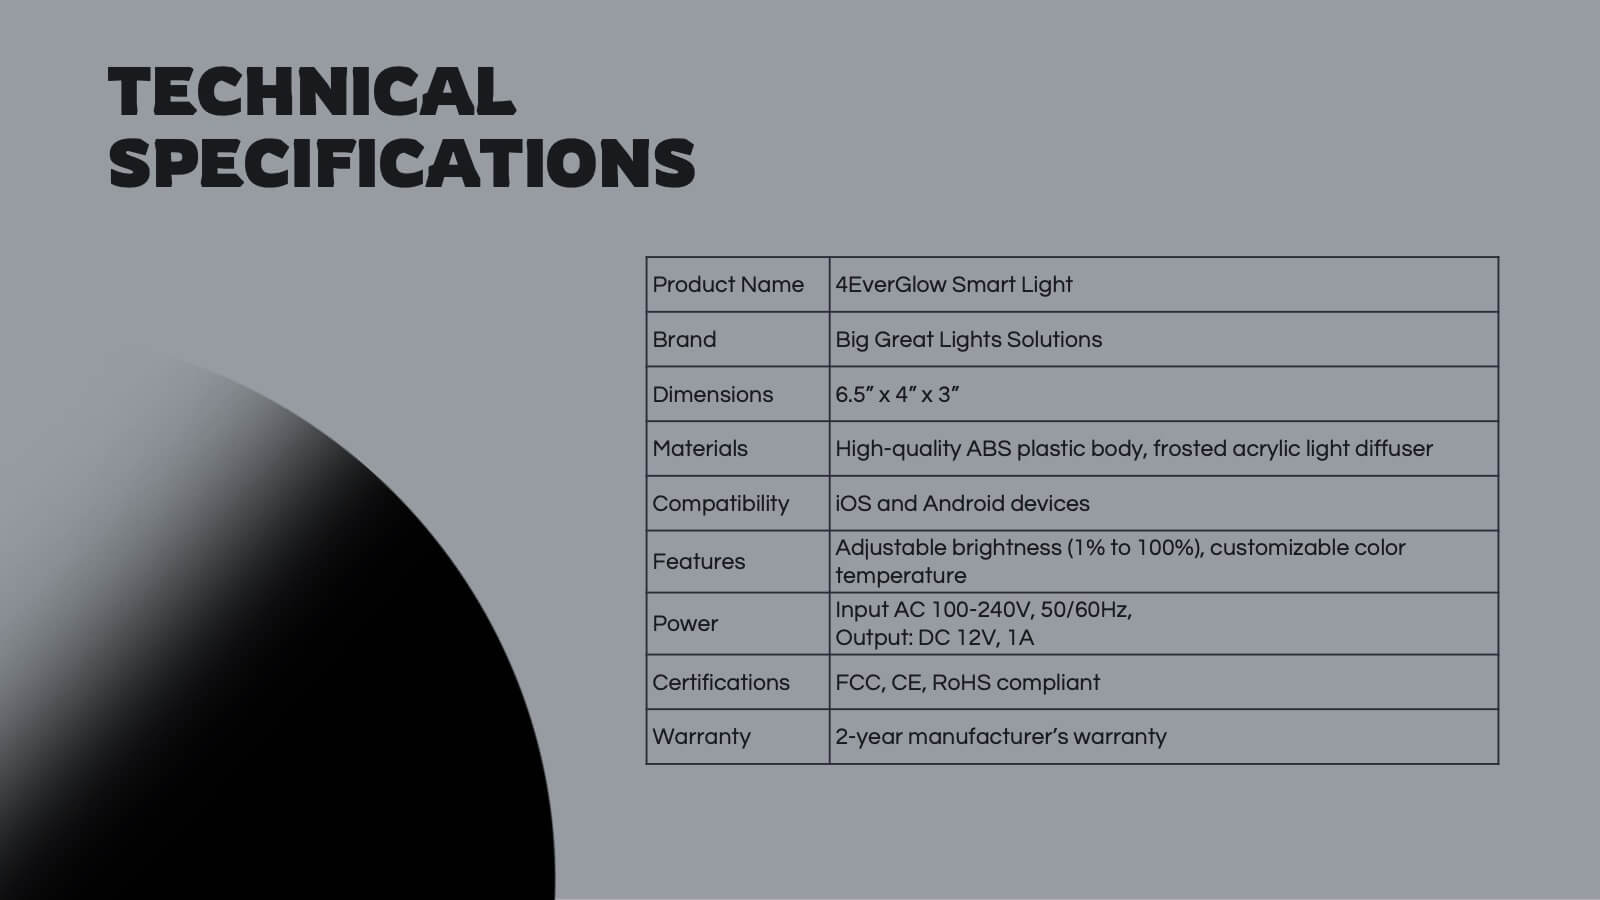
Spinel Product Strategy Report Presentation
Take your product strategy to the next level with this polished, spinel-inspired presentation! Designed to effectively communicate your product's goals, market analysis, and strategy roadmap, this template is both visually striking and easy to navigate. Its sharp design ensures a professional touch. Compatible with PowerPoint, Keynote, and Google Slides.


5 diapositivas
Geographic Oceania Overview Presentation
Visualize your regional data with a sleek, easy-to-read map highlighting key areas across Oceania. Perfect for presenting geographic insights, business distribution, or market trends, this clean layout ensures every detail stands out clearly. Fully compatible with PowerPoint, Keynote, and Google Slides for simple editing and professional presentations.


4 diapositivas
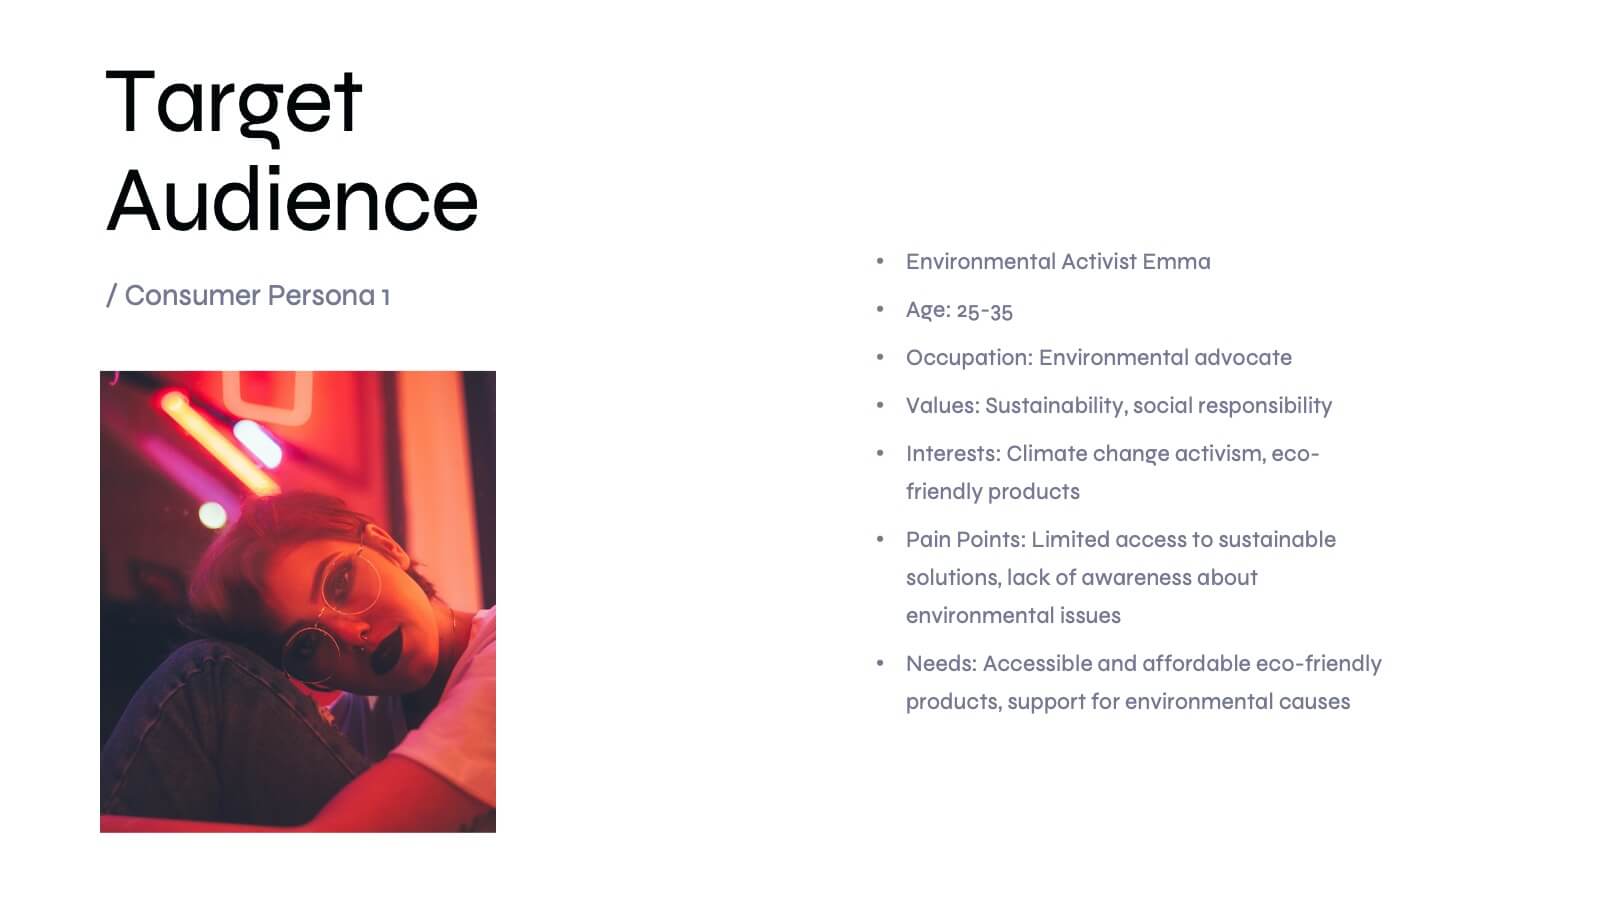
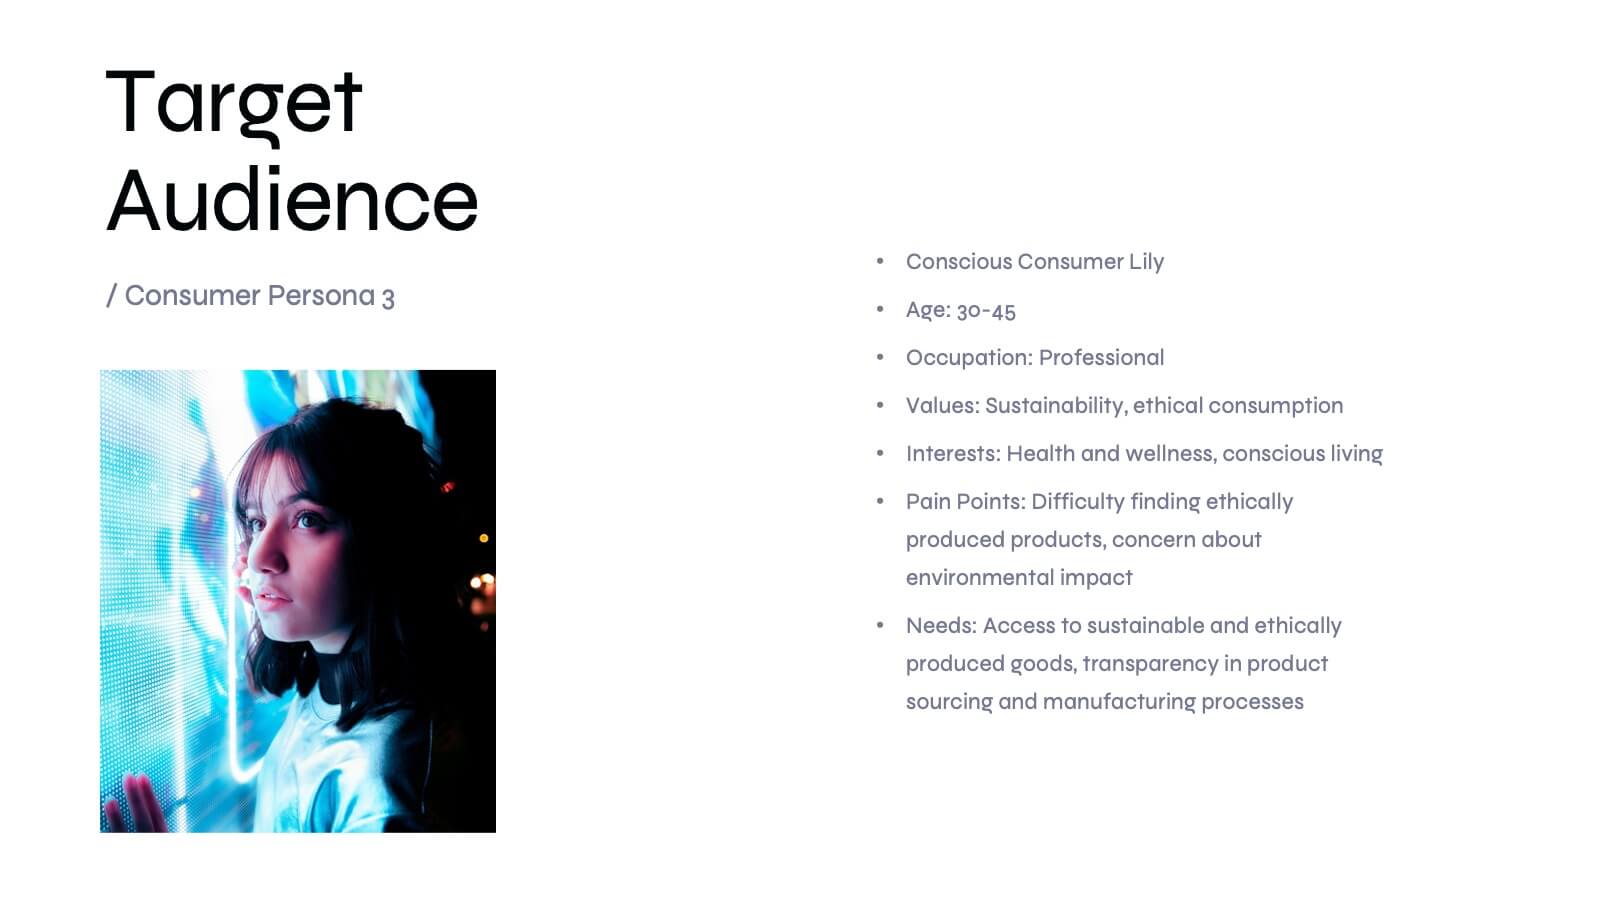
Customer Persona Slide Presentation
Bring your audience closer to your ideal customer with this clean, visual layout designed for clarity and storytelling. Perfect for marketing, branding, and strategy presentations, it helps you highlight key traits, motivations, and insights with ease. Fully compatible with PowerPoint, Keynote, and Google Slides for effortless customization.


12 diapositivas
Business Event Planning Schedule Presentation
Optimize your event planning with the Business Event Planning Schedule template, which streamlines your organization efforts by providing a clear timeline from January to June. It's perfect for entering key business insights or data at various stages. Designed for adaptability, this template ensures your planning remains concise and relevant. Compatible with PowerPoint, Keynote, and Google Slides, it integrates effortlessly into your workflow.


8 diapositivas
Business Challenge and Issue Definition Presentation
Break down complex problems with clarity using this Business Challenge and Issue Definition presentation. Designed to highlight key issues step by step, this layout helps your audience follow your reasoning with ease. Ideal for internal reviews or strategy alignment, it’s fully editable in Canva, PowerPoint, and Google Slides.


20 diapositivas
Visionix Project Management Plan Presentation
Streamline your project planning with this clean and modern presentation template. Covering key aspects such as objectives, timeline, budget breakdown, and risk management, it helps you organize and communicate your project strategy effectively. Ideal for business teams and project managers. Compatible with PowerPoint, Keynote, and Google Slides for easy customization.


5 diapositivas
Gantt Chart Project Schedule Presentation
Bring structure to your project timeline with a clean, easy-to-read layout that maps tasks, durations, and progress at a glance. This presentation helps teams stay aligned, visualize schedules, and track milestones with clarity and precision. Fully compatible with PowerPoint, Keynote, and Google Slides.


23 diapositivas
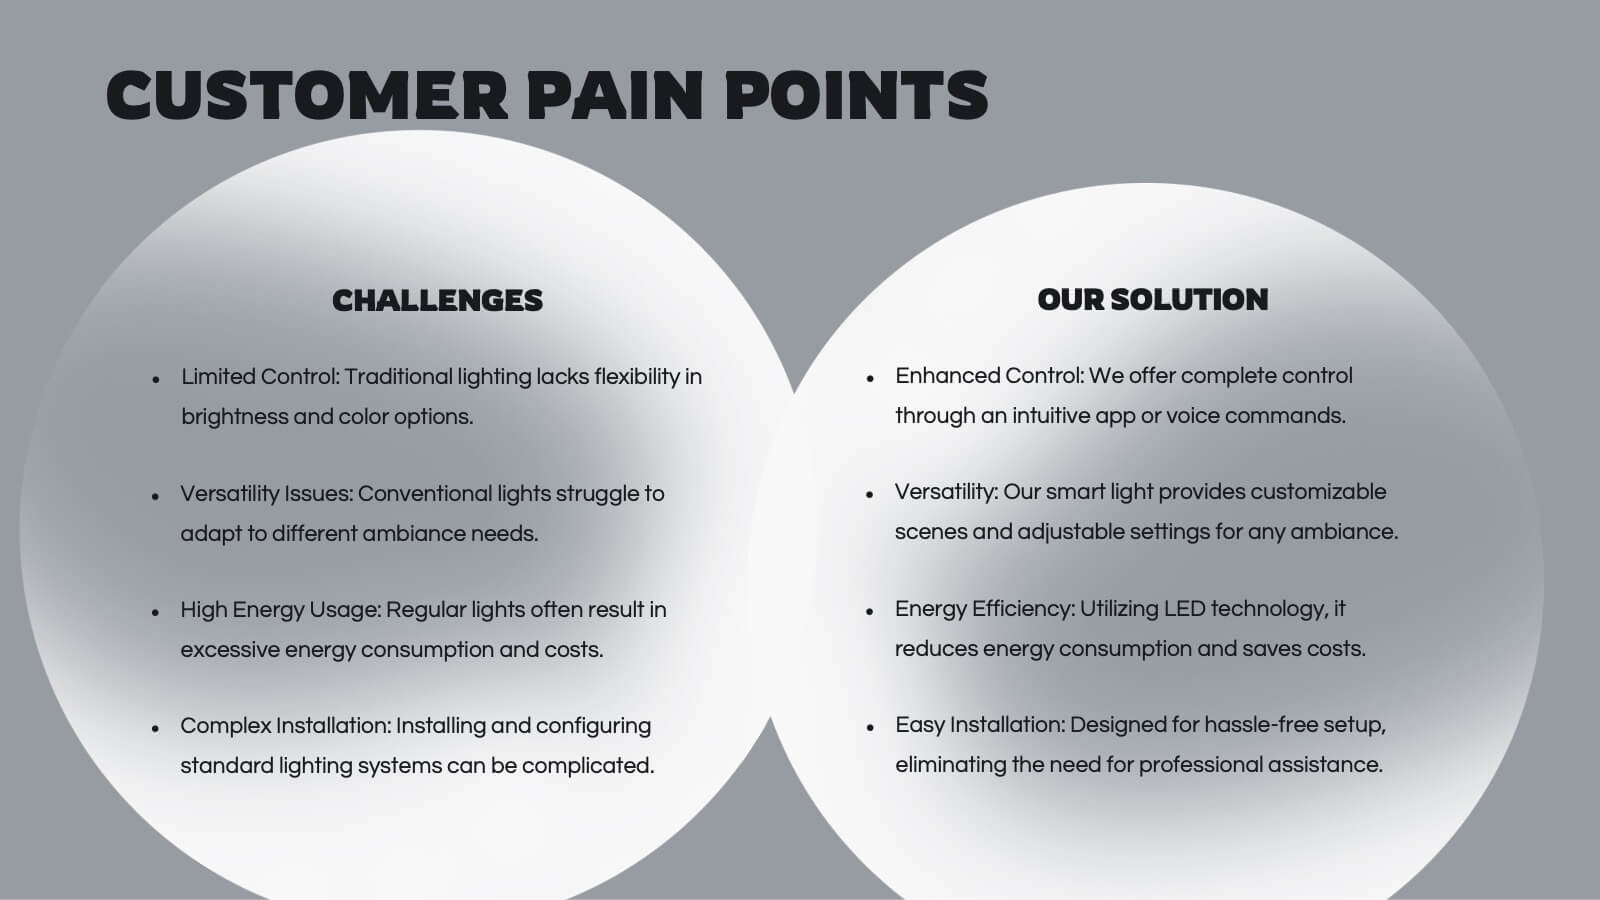
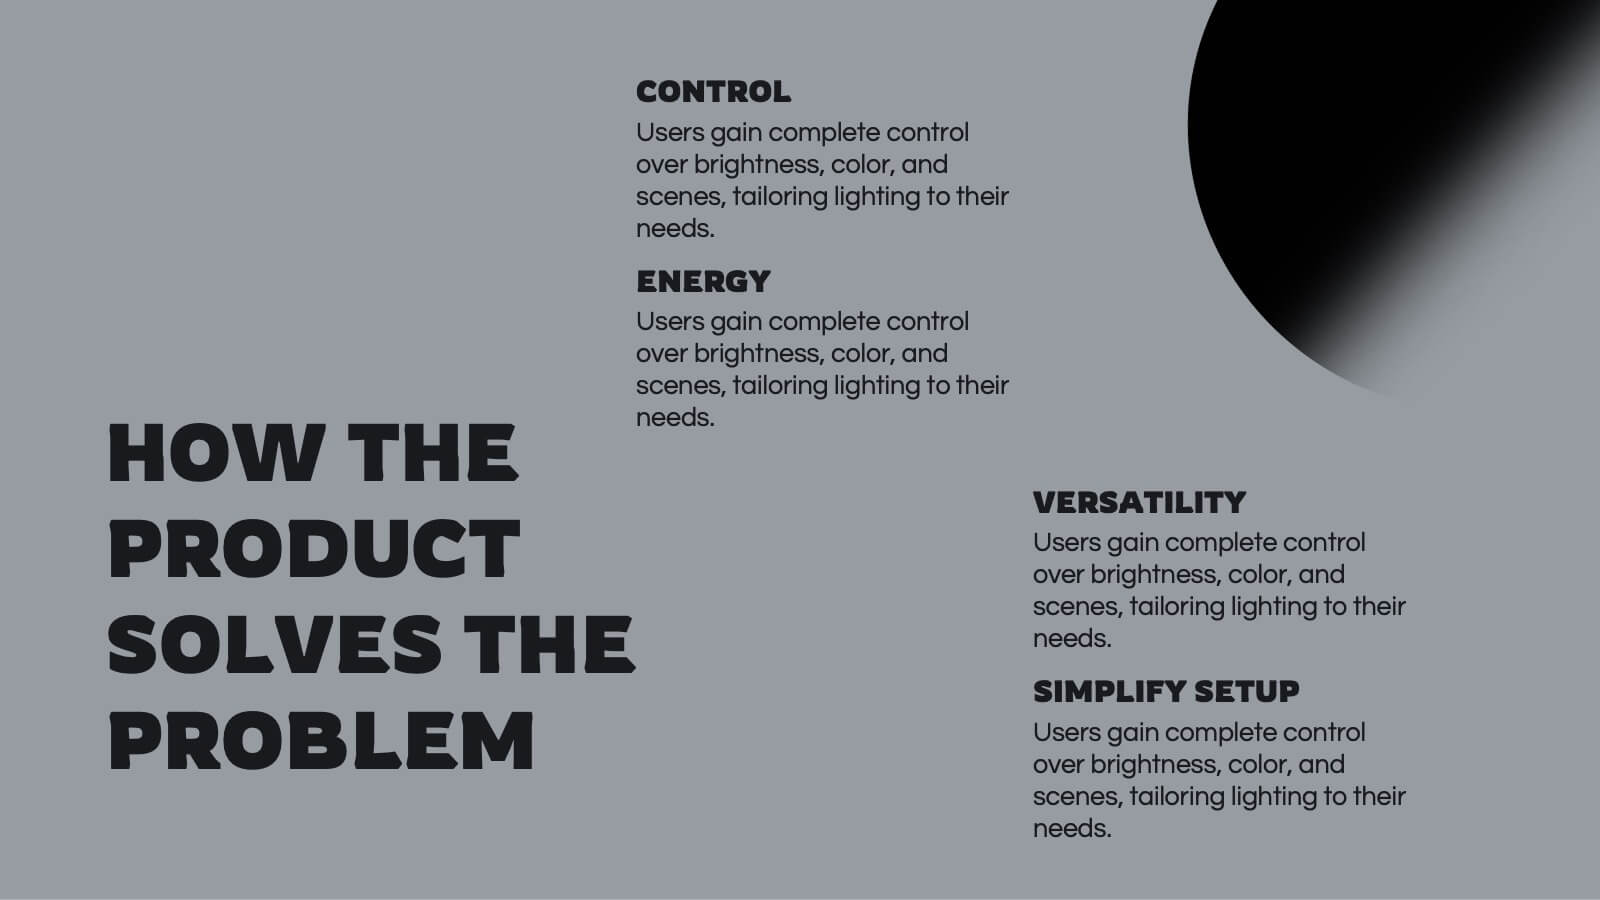
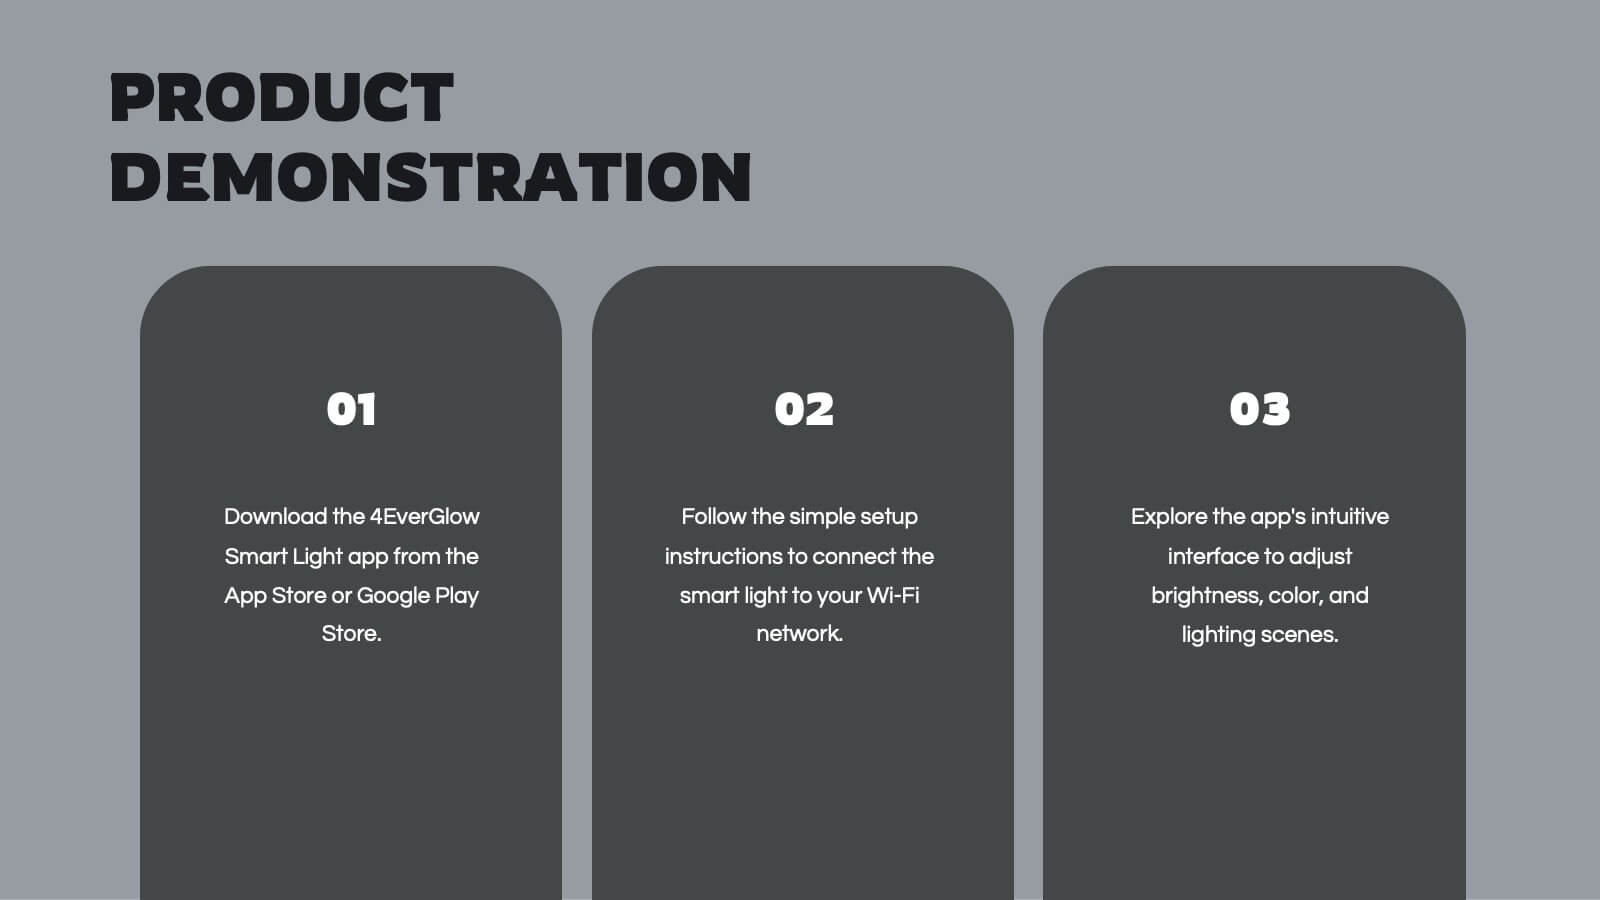
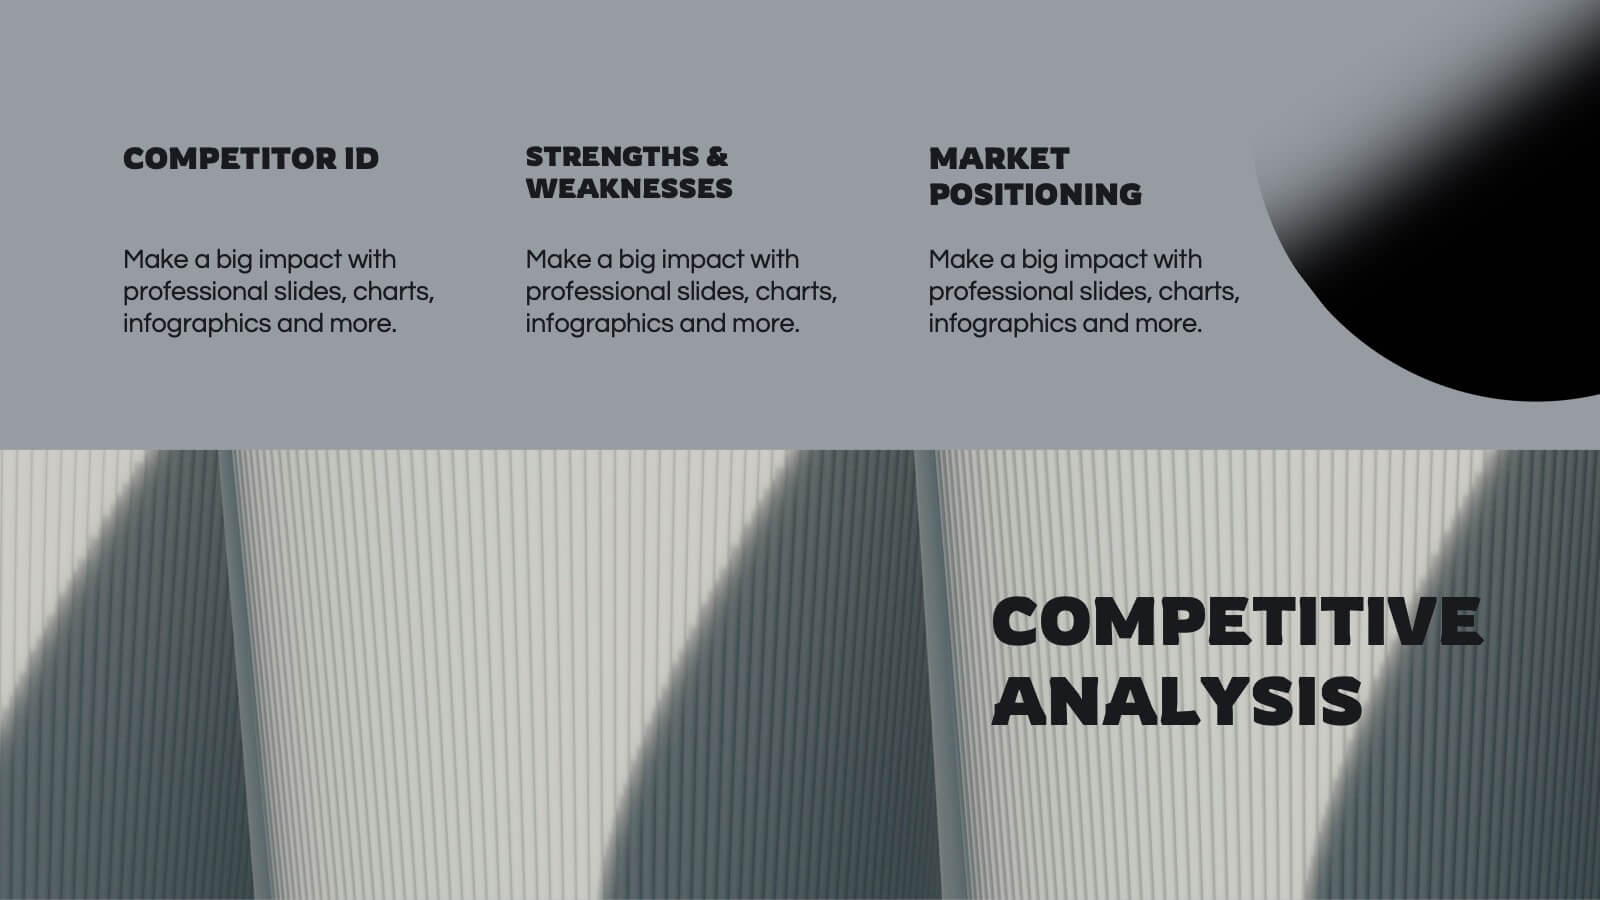
Soundburst Business Idea Pitch Deck Presentation
The Pitch Deck Presentation Template delivers a professional, modern design with 23 slides tailored for startups and businesses. Covering company overview, solutions, market opportunities, and financials, it's fully customizable for your unique vision. Compatible with PowerPoint, Keynote, and Google Slides, this template ensures impactful, investor-ready presentations.