


Características


¿Tienes alguna pregunta?
Recomendar


5 diapositivas
Performance Scaling Overview Presentation
Illustrate performance development with this sleek layered pyramid chart. Designed to visualize growth stages, team levels, or scaling strategies, each tier includes editable text and icons for clarity. Ideal for business reviews, capability mapping, or operational planning. Fully customizable in PowerPoint, Keynote, and Google Slides for effortless updates.


7 diapositivas
Sports Bases Infographic
Step up your game with our sports bases infographic! Designed to captivate sports enthusiasts, coaches, trainers, and educators, this vibrant infographic illuminates the aspects of various sports disciplines. With a crisp blue backdrop coupled with dynamic shades of blue and an array of sporty colors, it provides a visual sprint through the key bases of multiple sports. Ideal for coaches aiming to provide a overview to their teams, or educators introducing students to the fundamentals of sports. Compatible with PowerPoint, Keynote, and Google Slides, you can seamlessly integrate it into your presentations and captivate your audience with a sporty edge.


7 diapositivas
Business People Management Infographic
Business people refer to individuals involved in the world of commerce and trade, encompassing various roles within the business landscape. This Infographic is an illuminating and dynamic template designed to guide you through the art and science of managing human capital within the business sphere. Explore the key aspects of effective people management and elevate your organizational success by harnessing the power of your workforce. Compatible with Powerpoint, Keynote, and Google Slides. Discover the art of leading and engaging your team, and witness the transformation as your organization excels and grows, driven by the power of effective people management!


10 diapositivas
Healthcare Innovations in Medicine Presentation
Showcase groundbreaking advancements with the Healthcare Innovations in Medicine Presentation template. Designed to highlight medical breakthroughs, research developments, and technological advancements, this visually appealing layout is ideal for healthcare professionals, researchers, and medical institutions. Fully customizable and compatible with PowerPoint, Keynote, and Google Slides, this template ensures your presentation is clear, engaging, and impactful.


5 diapositivas
Business Planning and Execution Presentation
Align your business objectives and execution plan with this modern, arrow-themed presentation slide. Featuring four sequential sections with bold icons and customizable titles, this layout is perfect for showcasing milestones, KPIs, or phases of a strategic process. Designed for clarity and impact, it's compatible with PowerPoint, Keynote, and Google Slides.


7 diapositivas
Customer Thank You Infographic
Elevate your expressions of gratitude with this sophisticated collection, designed to blend elegance with heartfelt thanks. Each piece in this set is crafted with meticulous attention to detail, featuring a mix of subtle color palettes, elegant typography, and beautifully arranged visual elements to enhance the sincerity of your message. Choose from a variety of designs, ranging from minimalist to more richly layered compositions, each providing a unique way to communicate appreciation. These designs can be customized to suit any occasion, making them perfect for expressing professional thanks to clients, customers, or partners. Ideal for use across both digital and physical mediums, this collection helps ensure that your messages not only convey thanks but also resonate deeply with recipients, strengthening relationships and leaving a memorable impression.


7 diapositivas
Business Puzzle Infographic Presentation
A Puzzle Piece Infographic is great for visualizing and communicating complex topics, such as the order of steps to solve a problem or a methodical process. This template is great if you want to show your audience how different topics relate to each other, or if you want to illustrate how information fits together. This infographic will allow you to showcase your data and information in a fun, visual way. The puzzle design will help you organize information for your audience to easily understand. This template is compatible with Powerpoint, keynote and google slides, making it easy to edit!


26 diapositivas
Mazen Presentation Template
Mazen is a multi-purpose template that’s perfect for any business. The colors and layout are clean and chic, and it’s suitable for all types of businesses, from small business accounts to large corporate companies. It also has a hip aesthetic with nude warm tones, while pictures and charts are easy to edit and easy to read so users can easily understand the information in them. Easy to use, high quality and many features make this template suitable for all kinds of businesses. Pictures and charts are also made for easy editing as well as easy readability without too much confusion on reading.


5 diapositivas
Human Resource Management Infographics
Human Resources Management is a critical function within organizations that focuses on managing and developing the human capital of an organization. These infographic templates are designed to showcase key concepts and strategies related to HR management. These infographics are in vertical form and offer a range of slide layouts to cover various aspects of HR. This offers a visually appealing and informative way to present key concepts and strategies. Compatible with Powerpoint, Keynote, and Google slides, Its customizable features and logical structure make it an effective tool for HR presentations or educational purposes related to HR management.


6 diapositivas
Search Engine Optimization Campaign Overview Presentation
Kick off your digital strategy with a clean, modern layout that makes every key insight feel connected and actionable. This presentation helps you explain campaign goals, highlight SEO priorities, and break down essential tasks in a structured, visual flow. Fully compatible with PowerPoint, Keynote, and Google Slides.

20 diapositivas
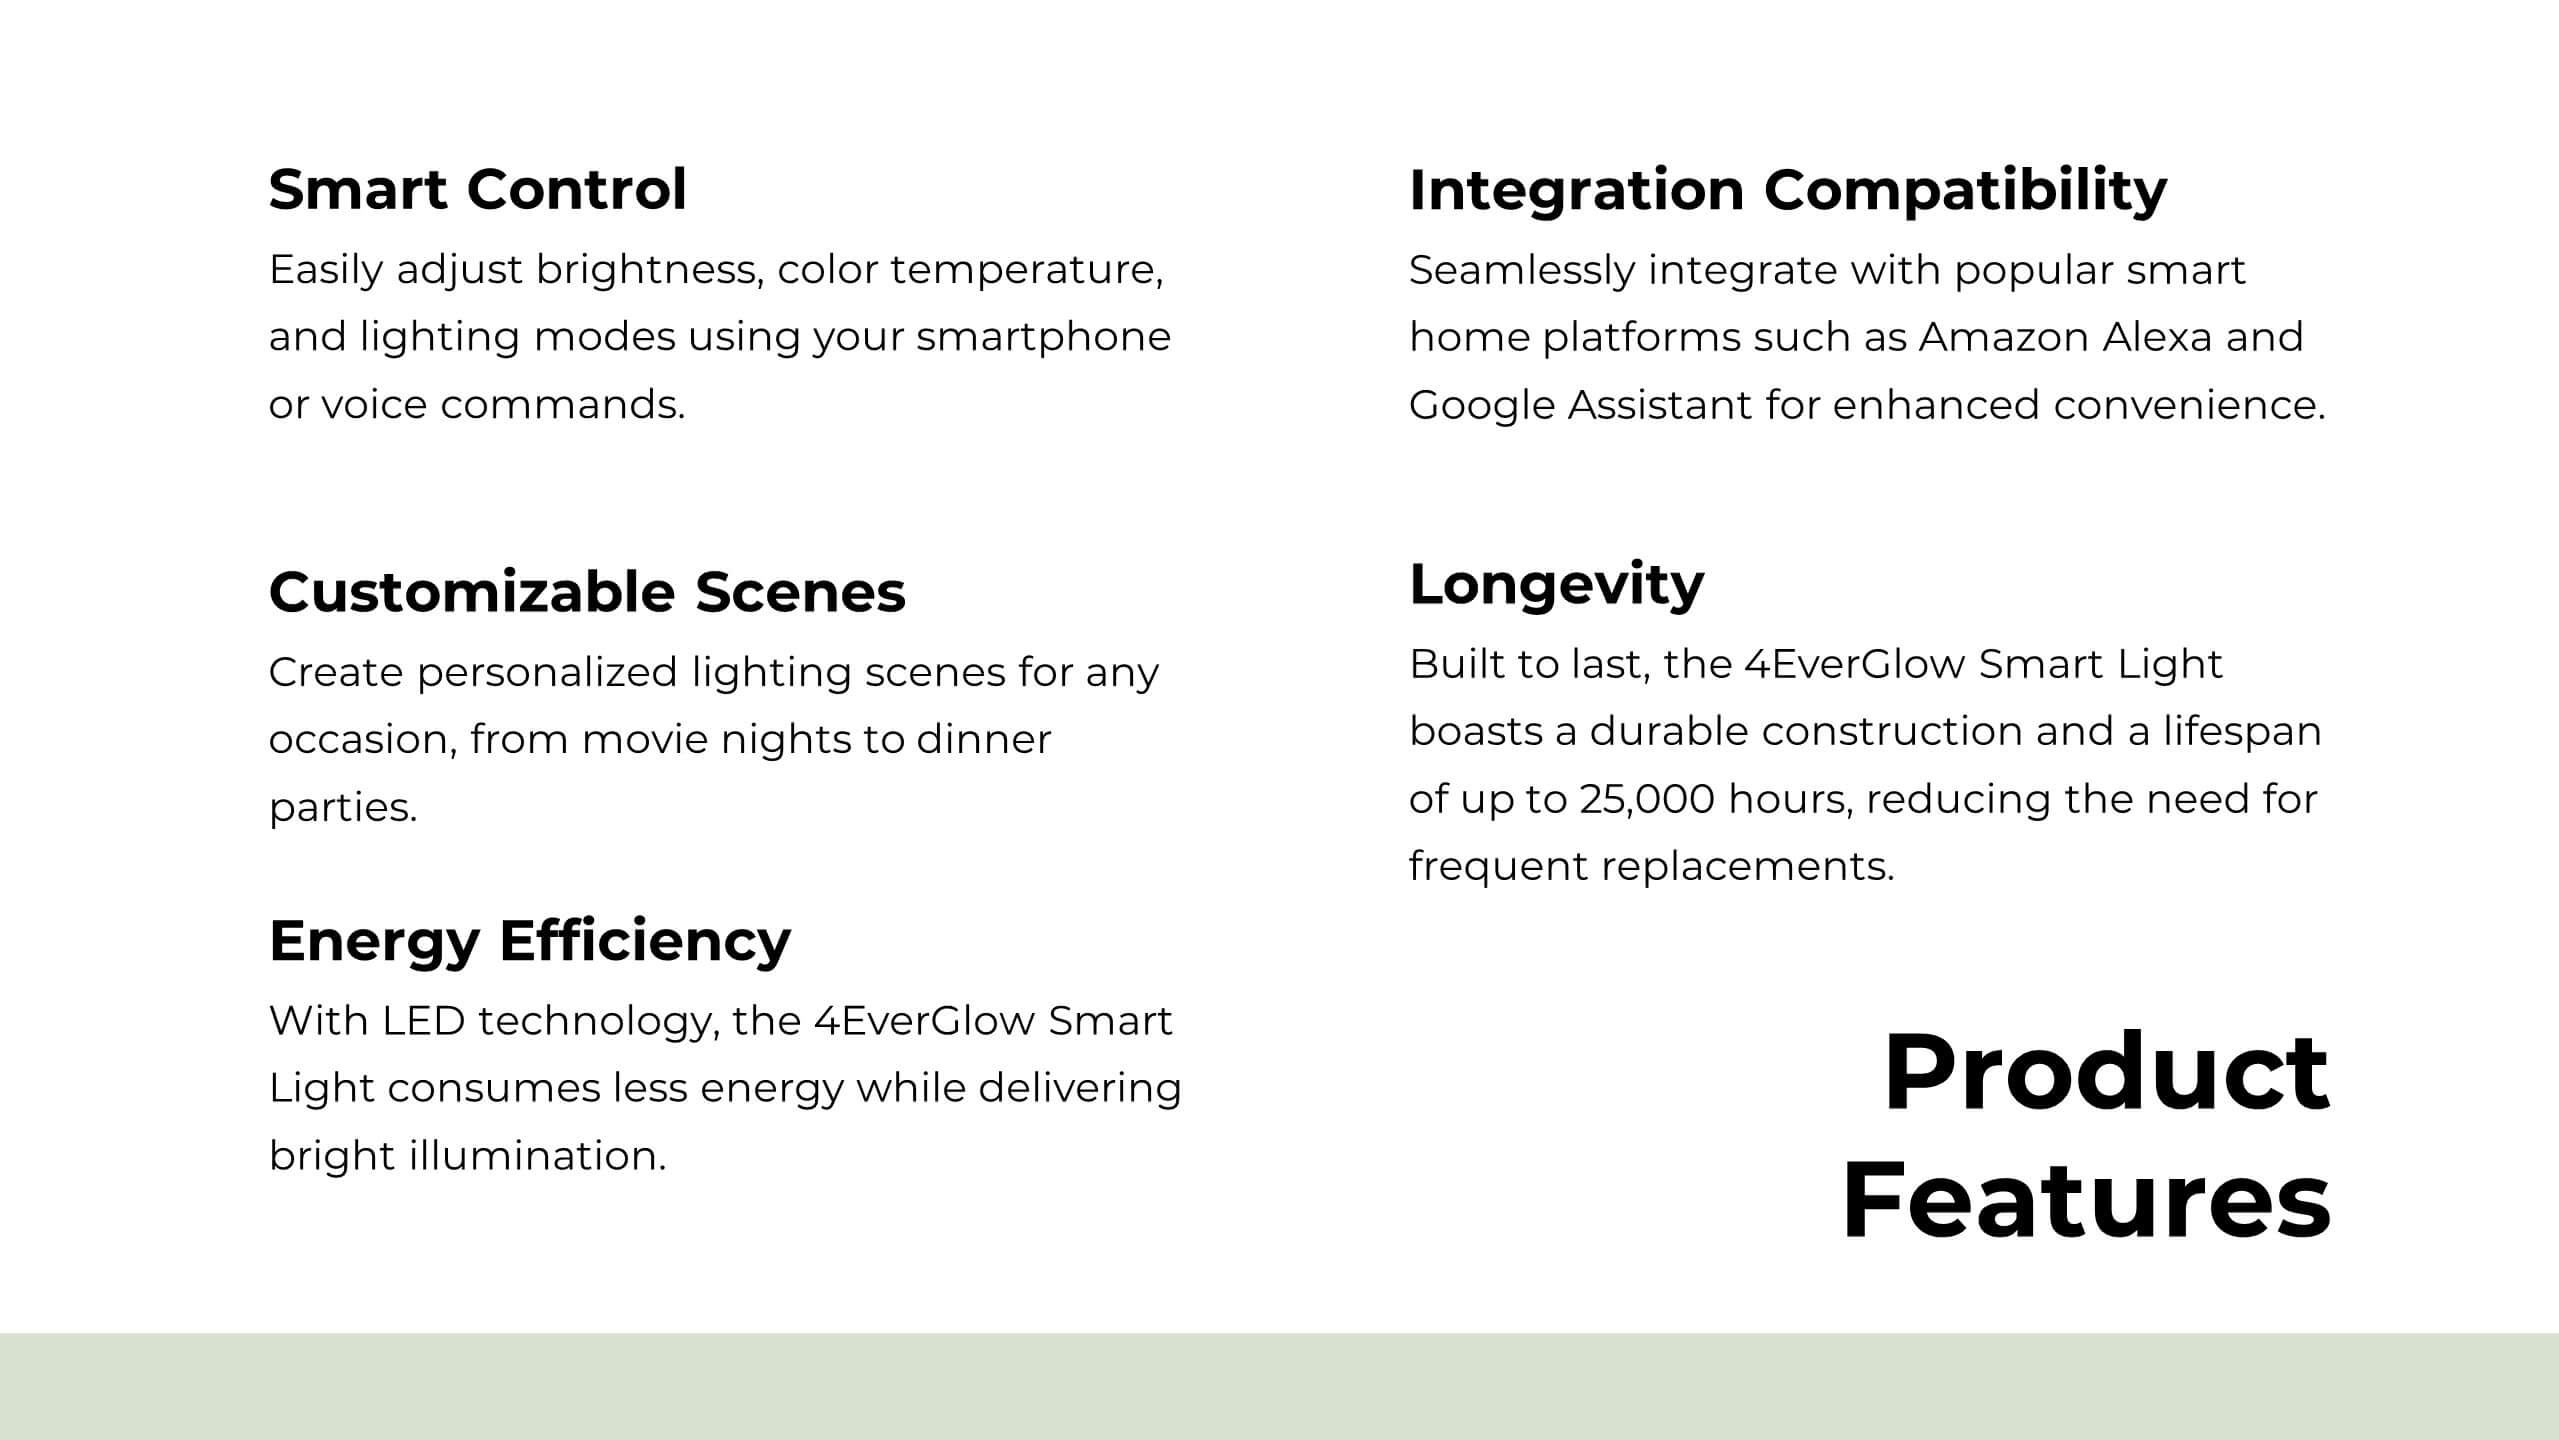
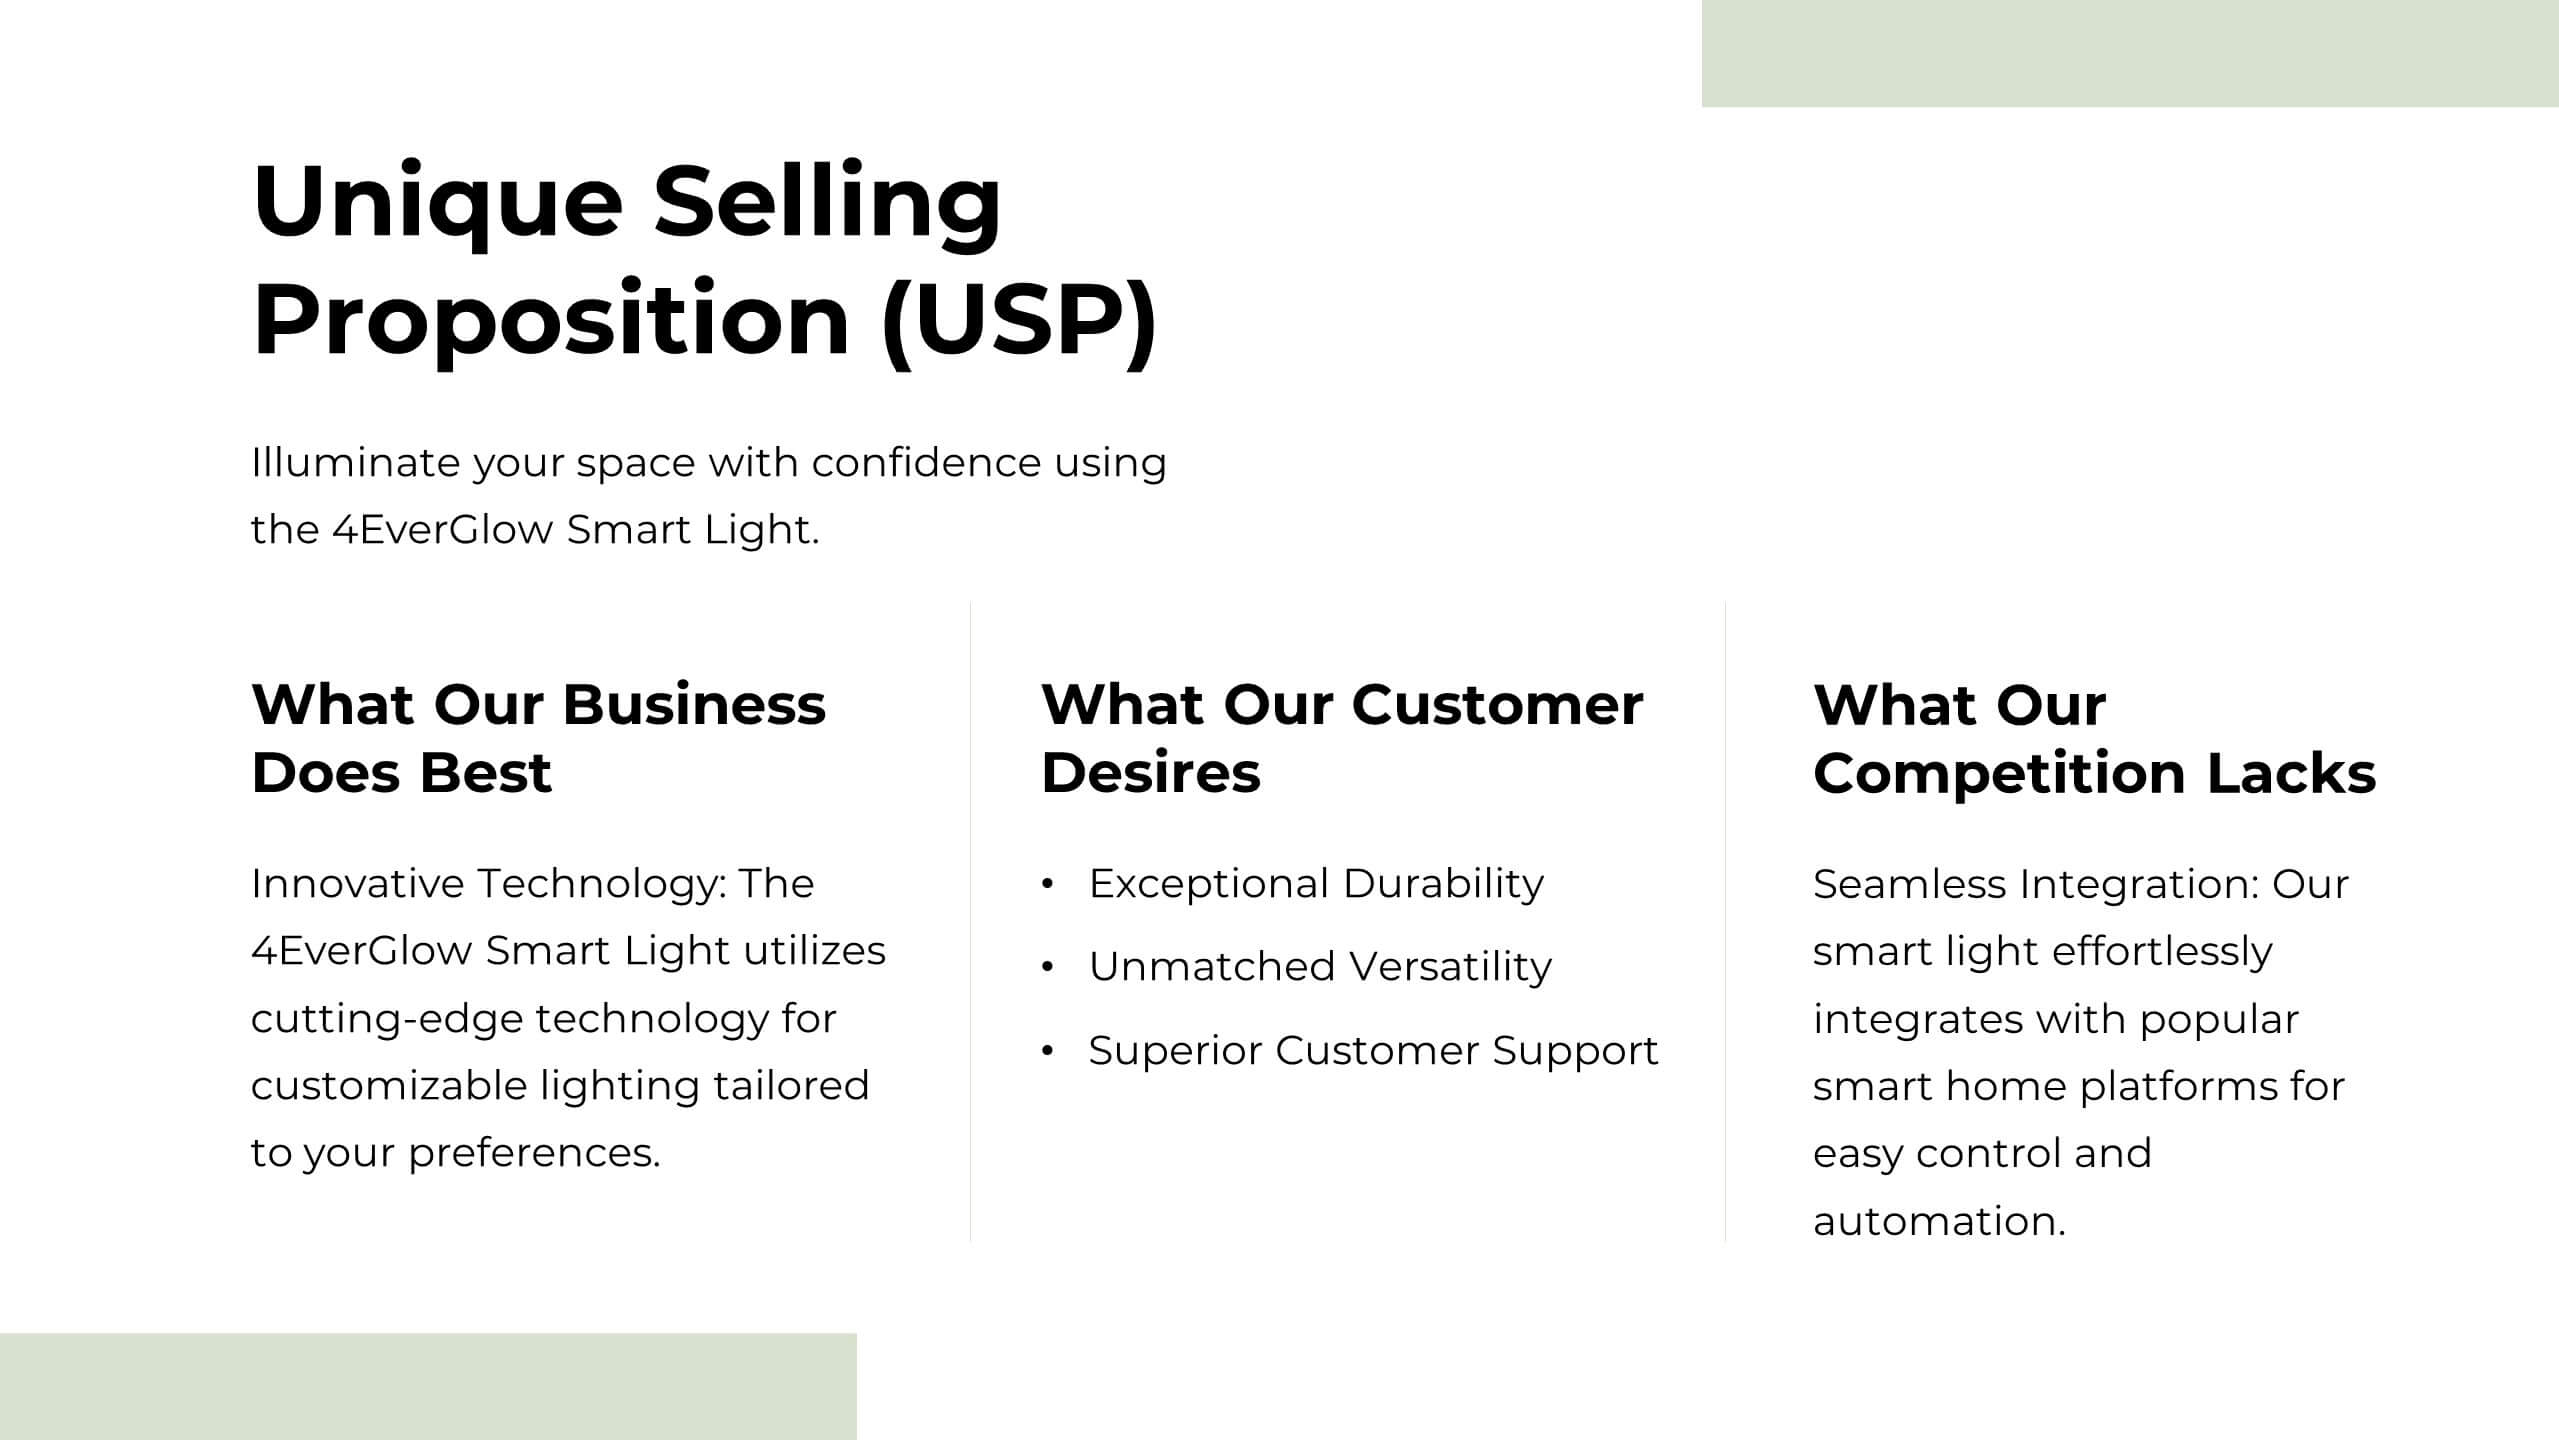
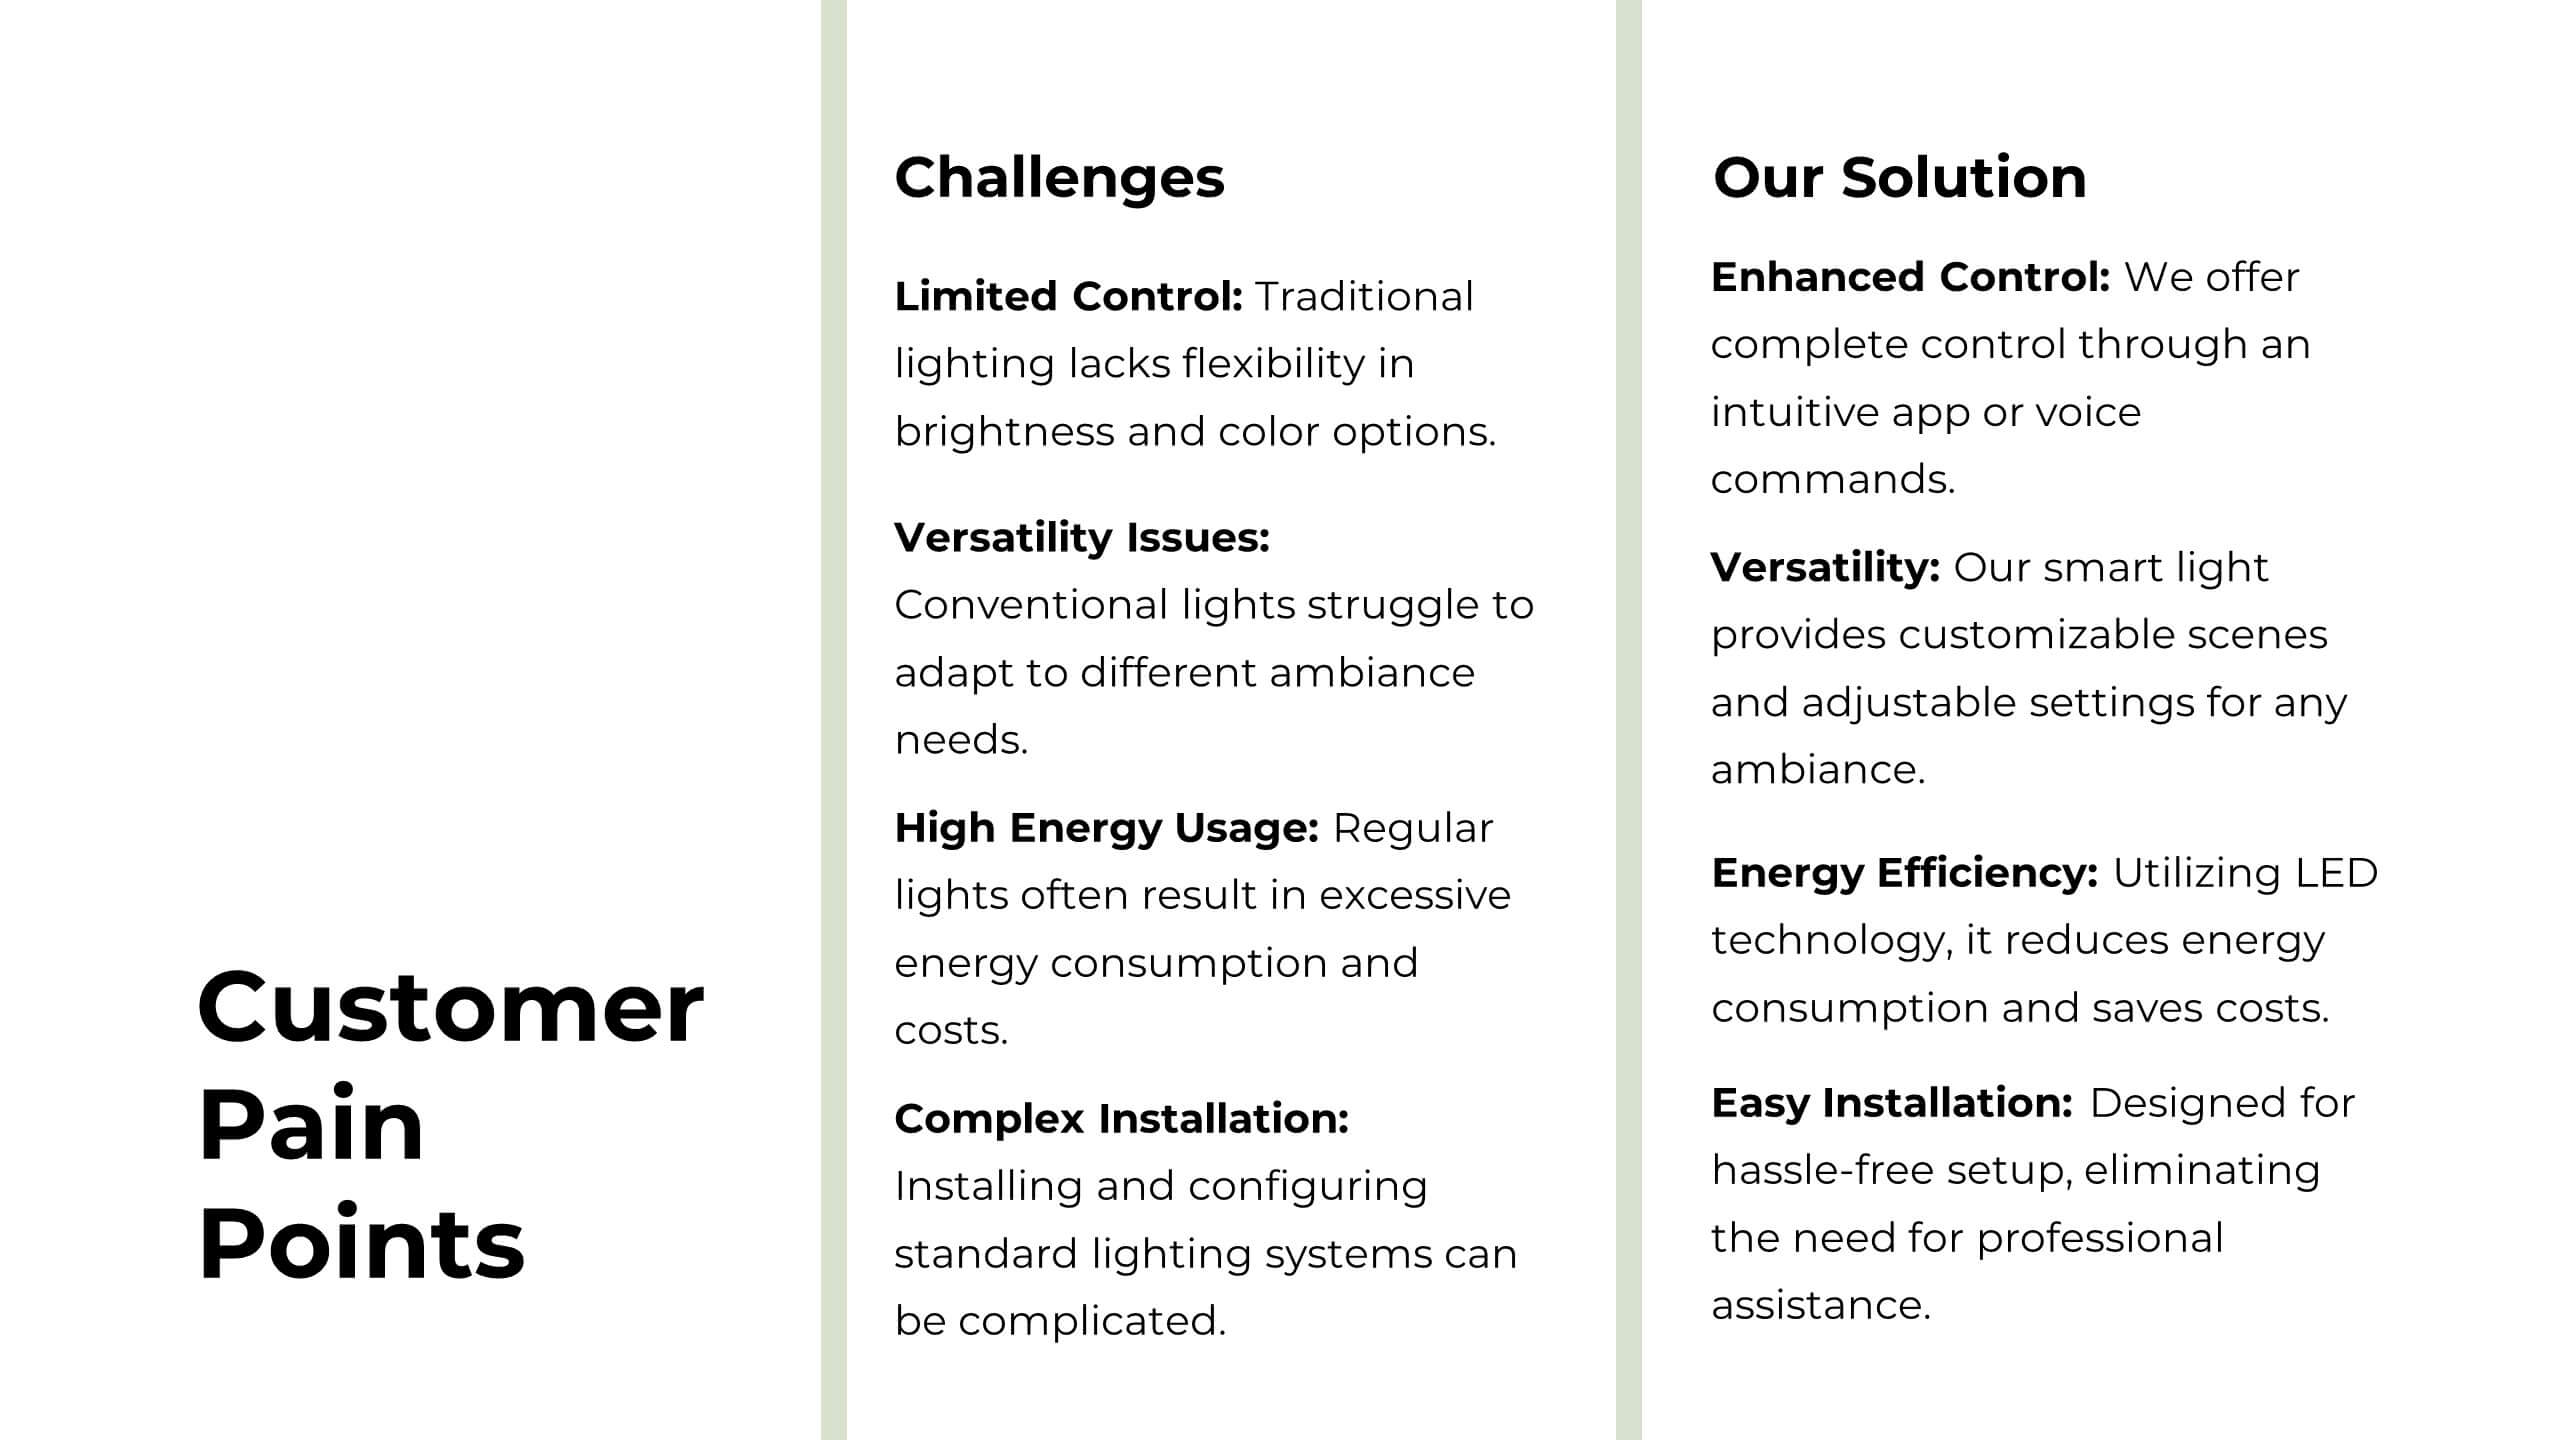
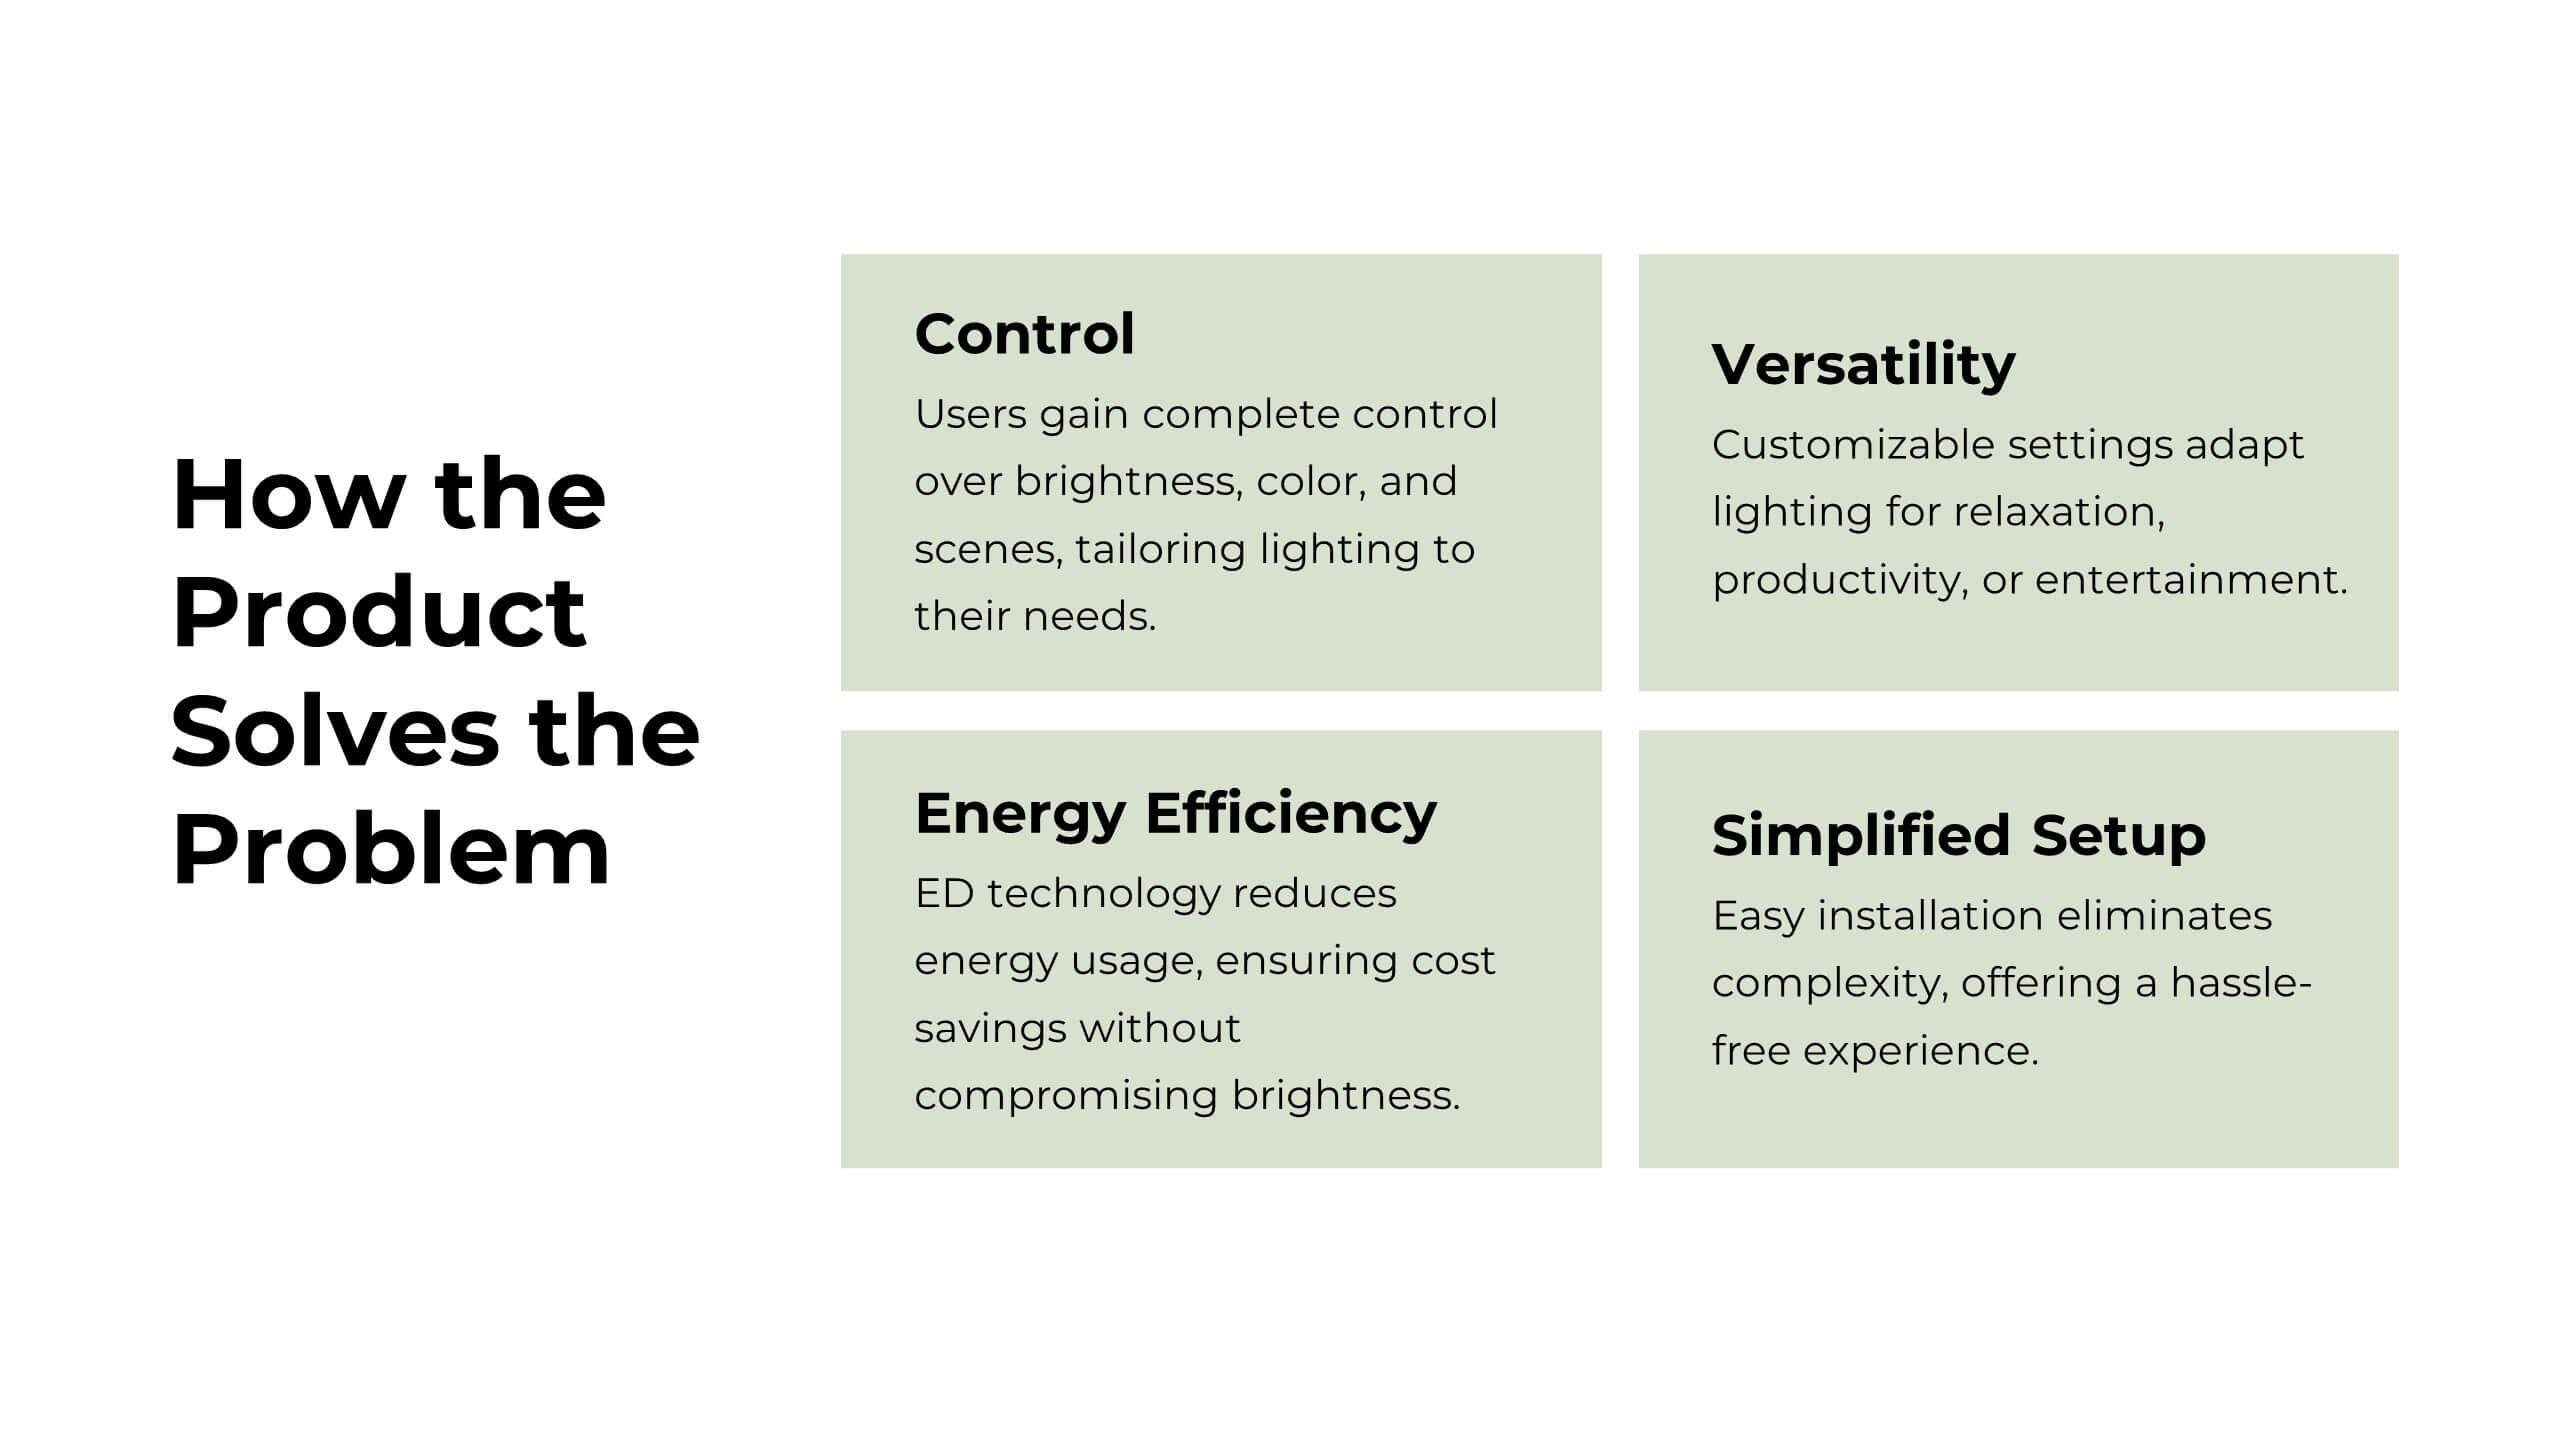
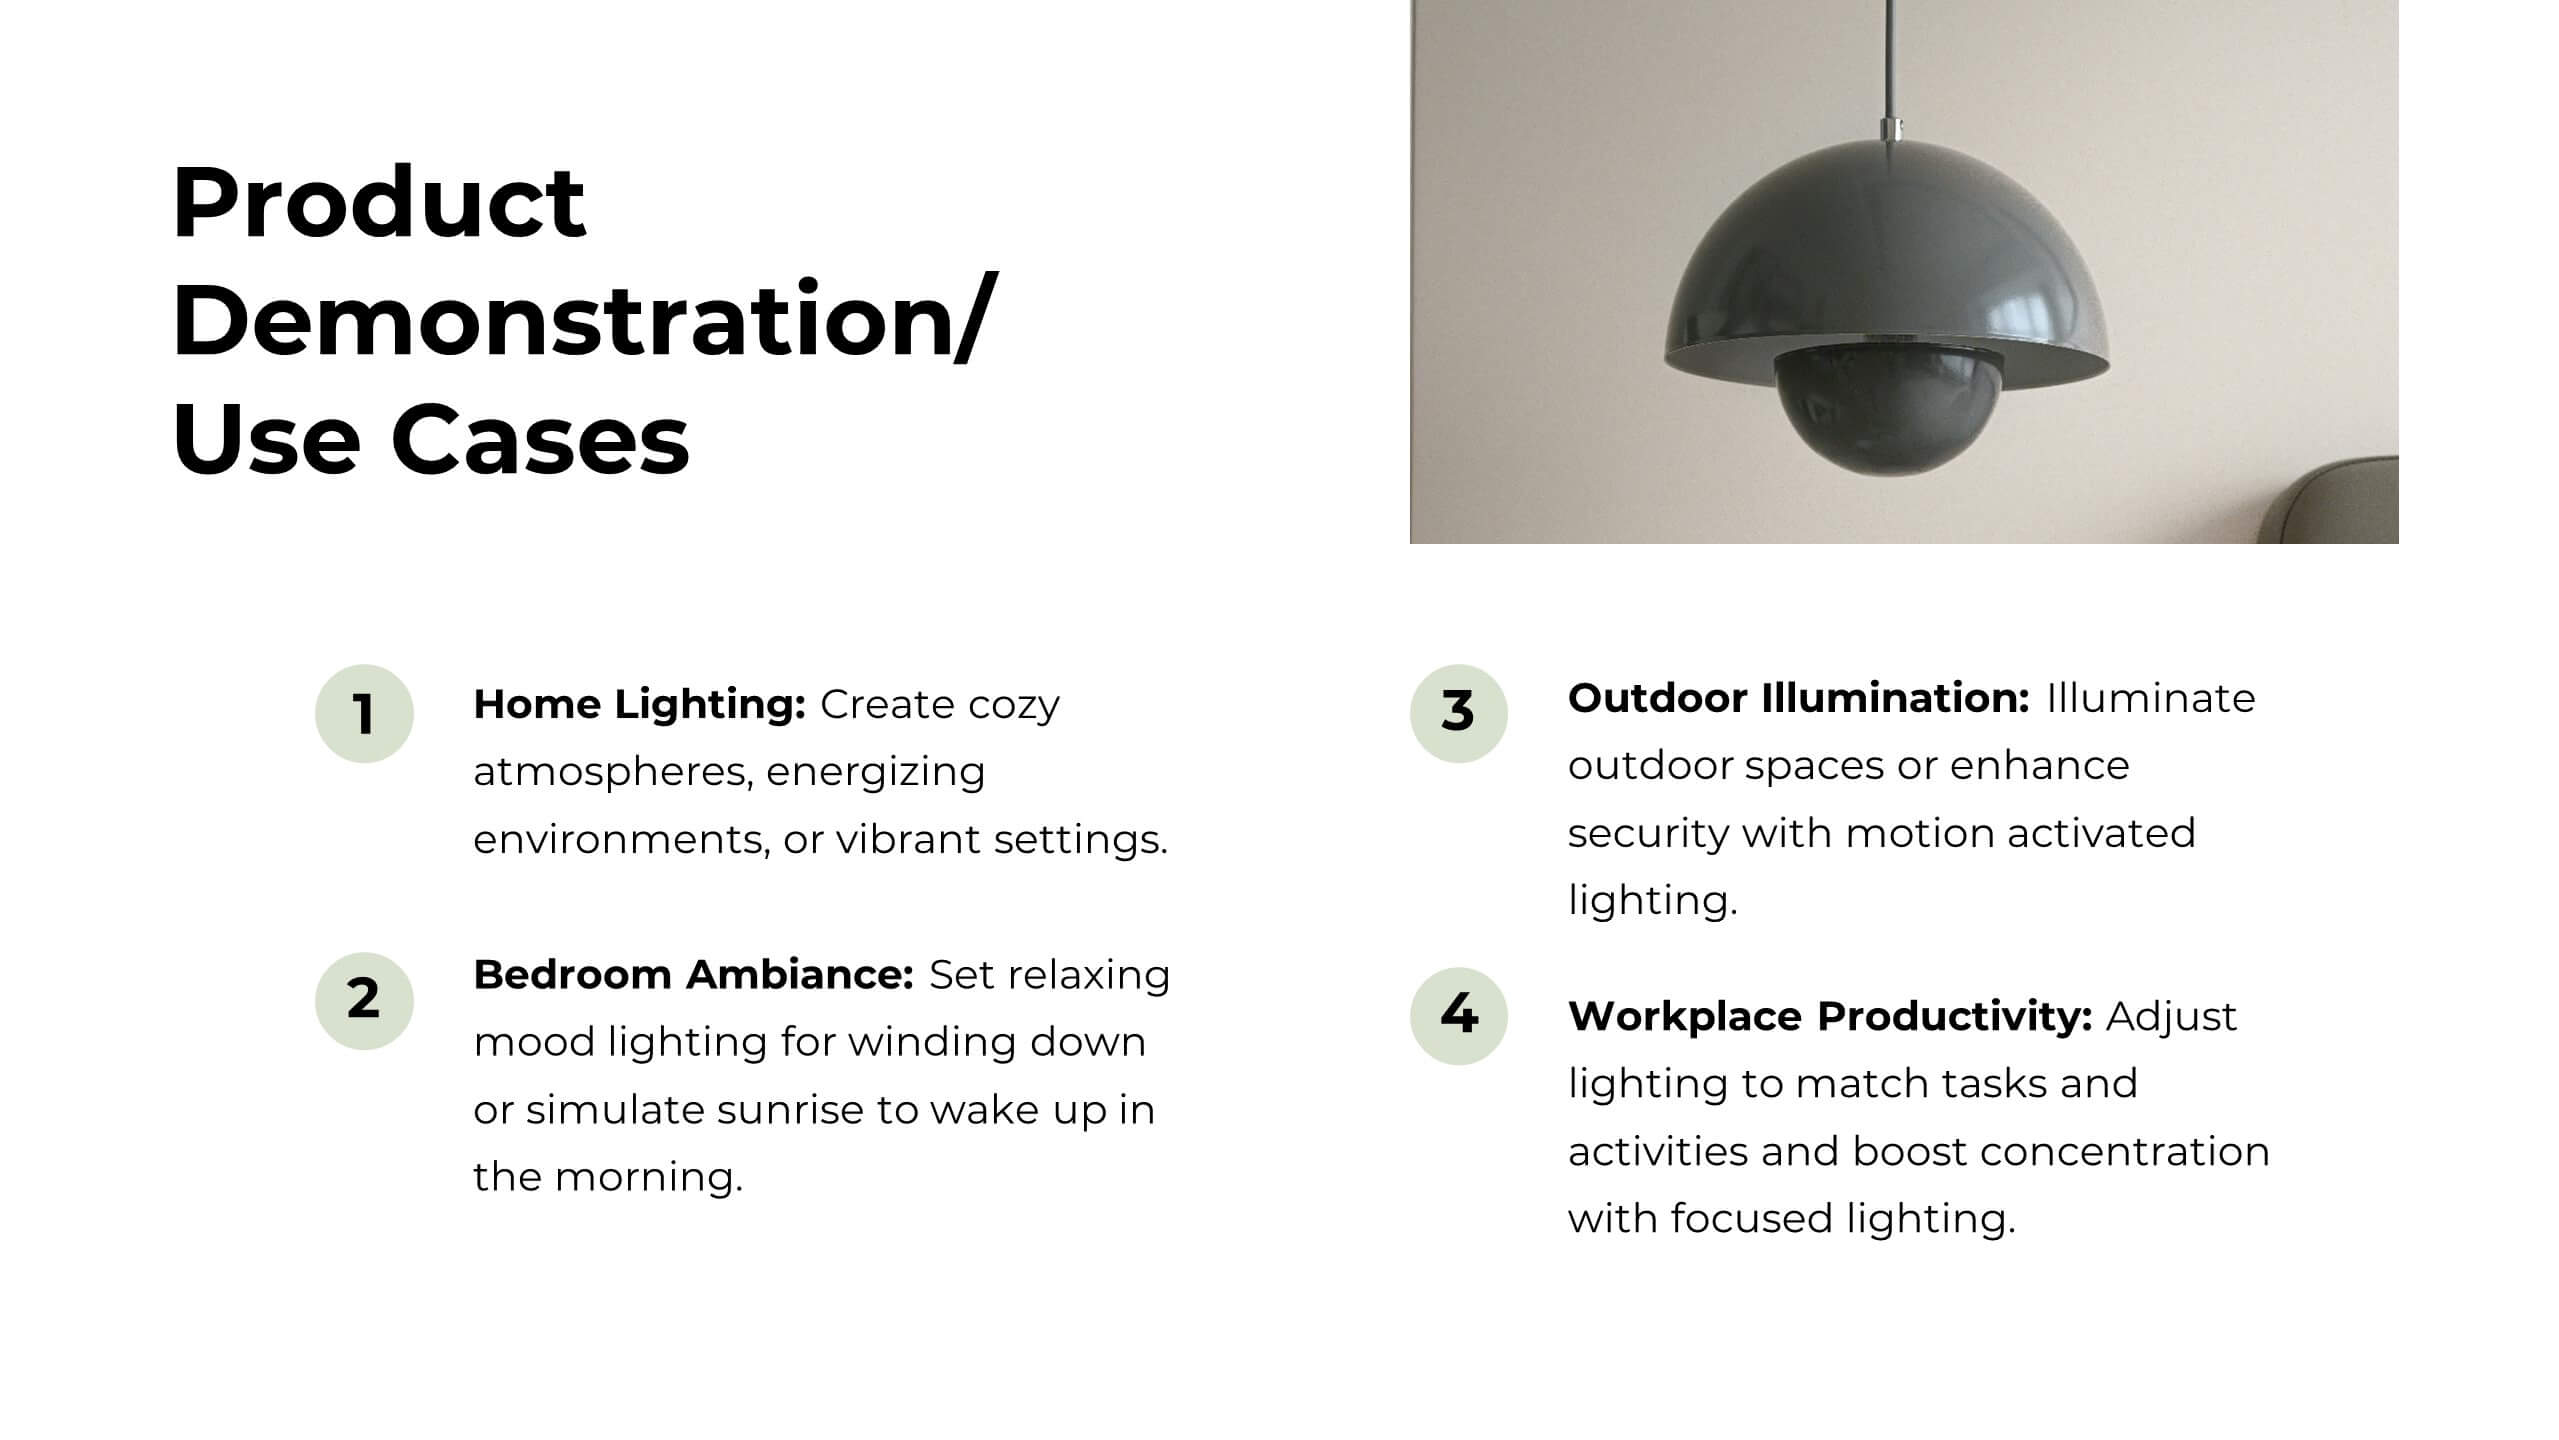
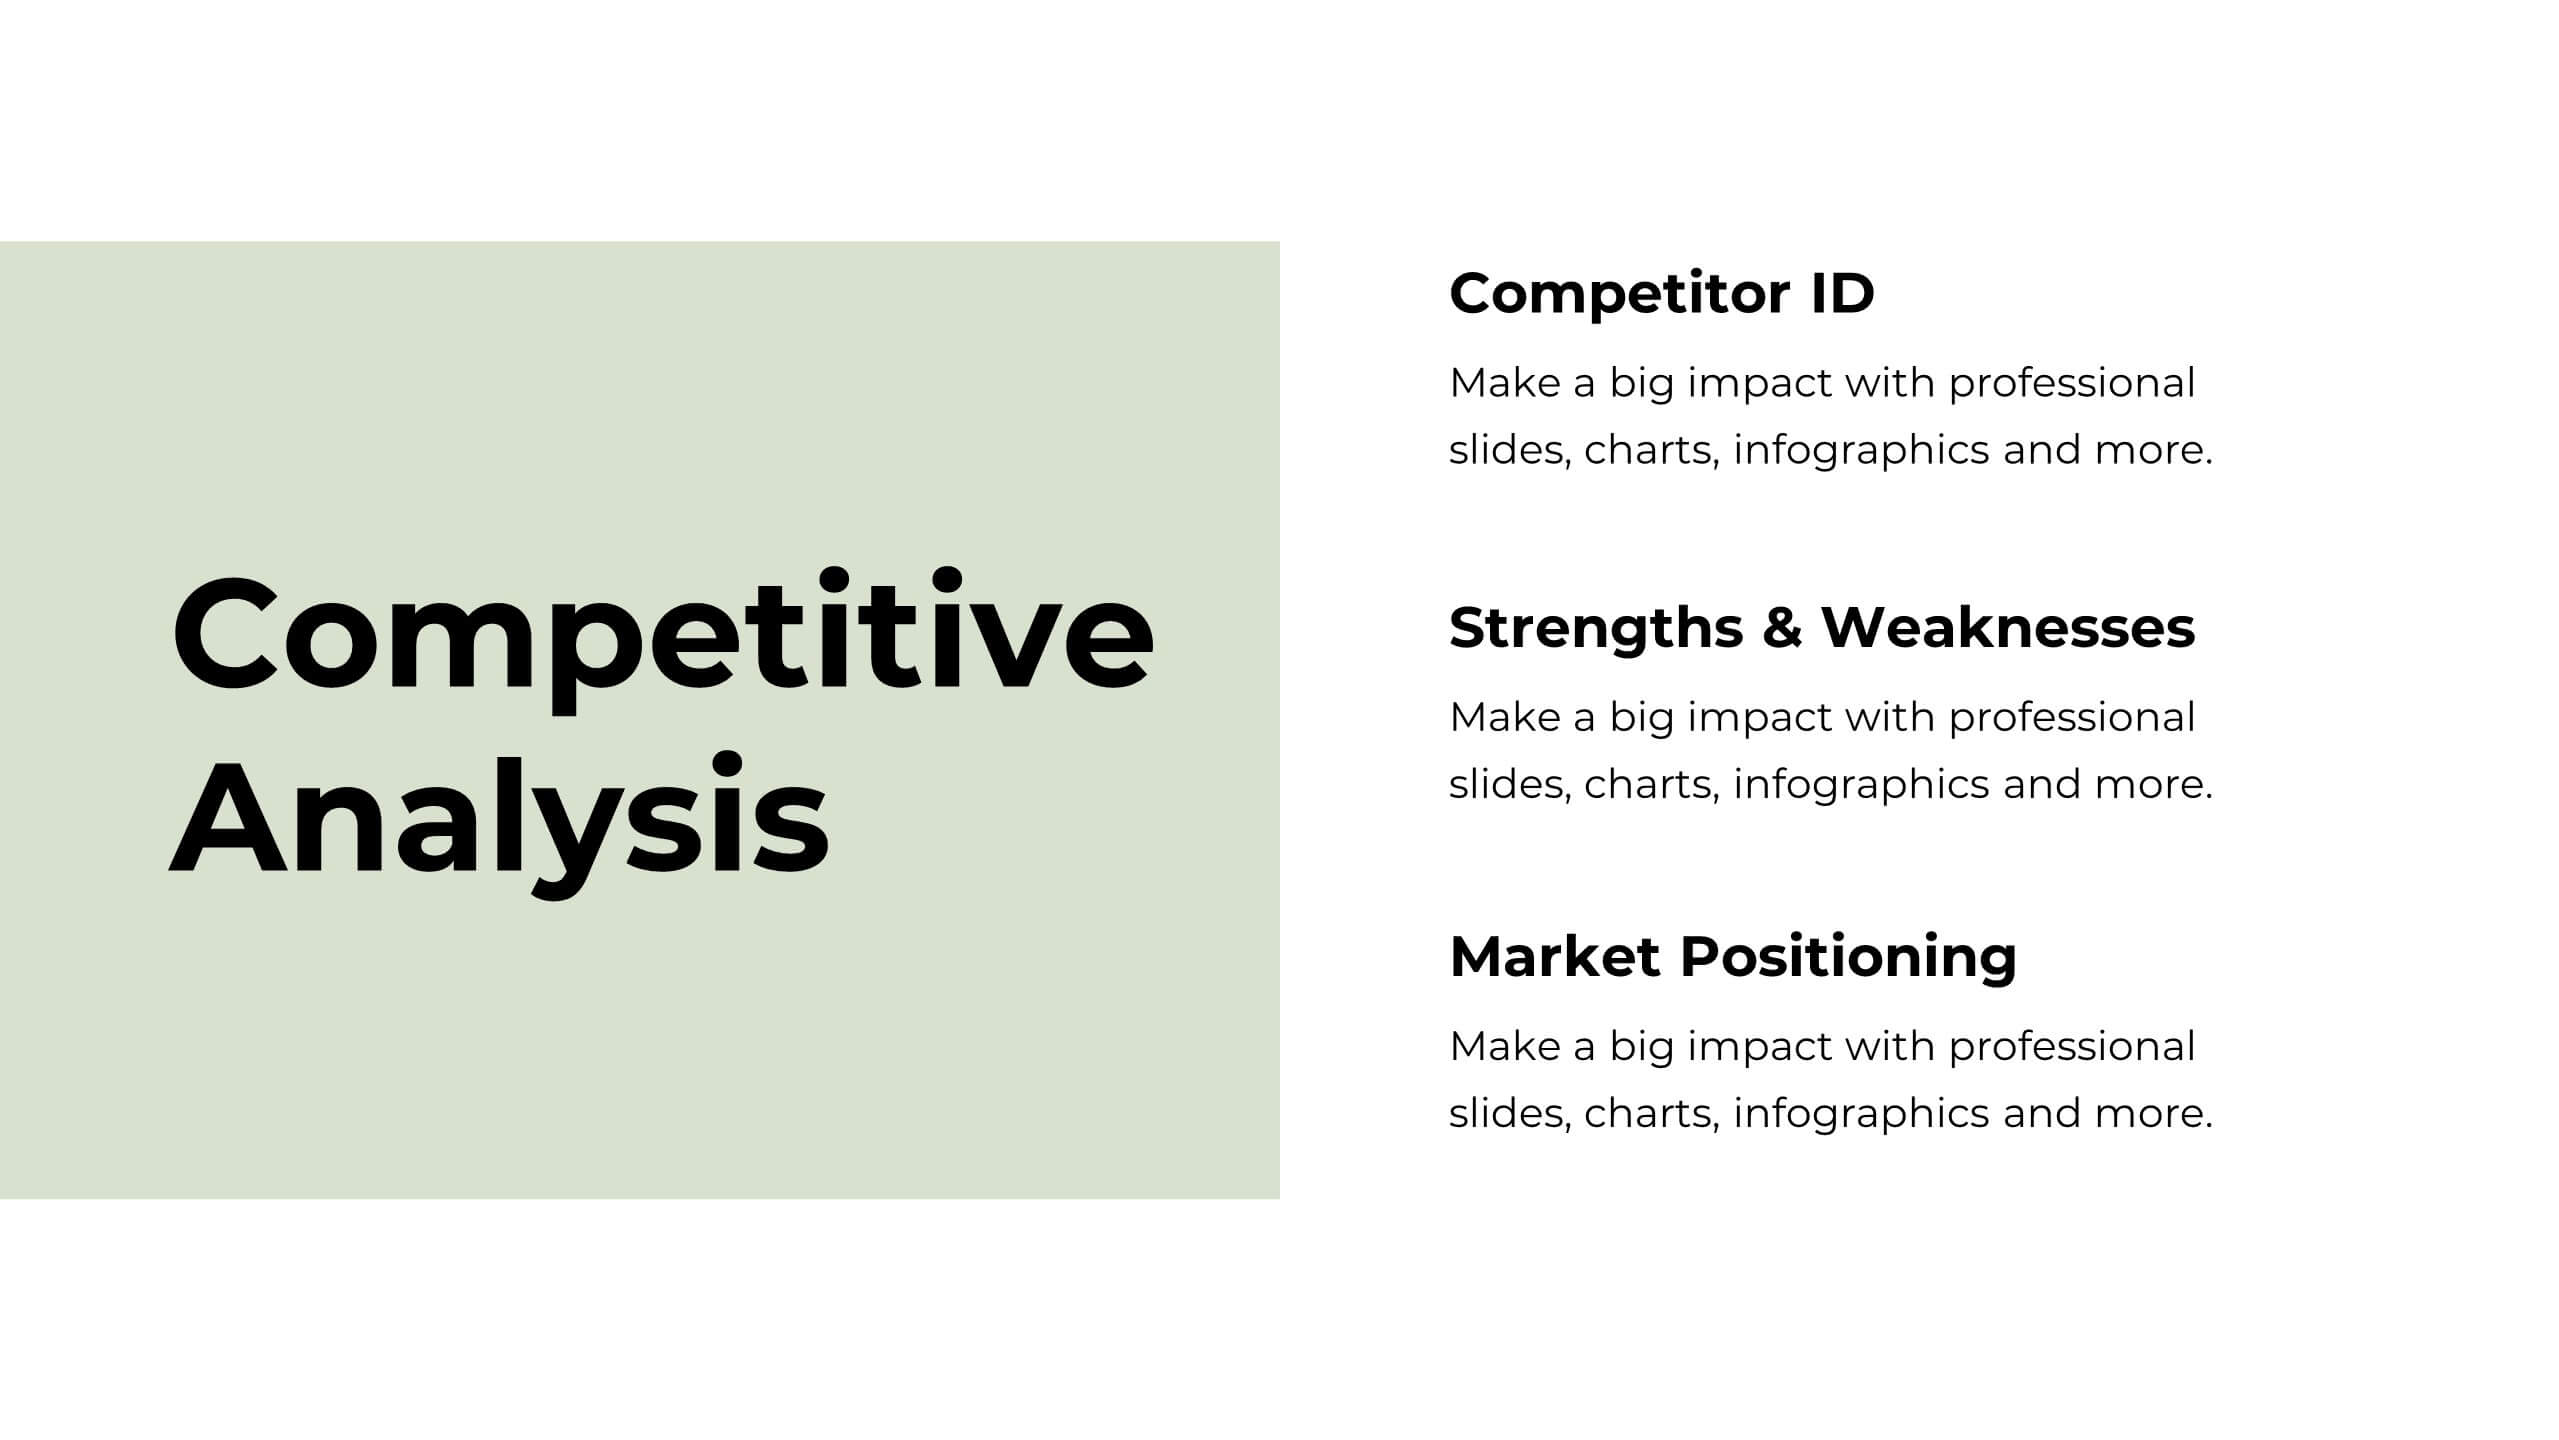
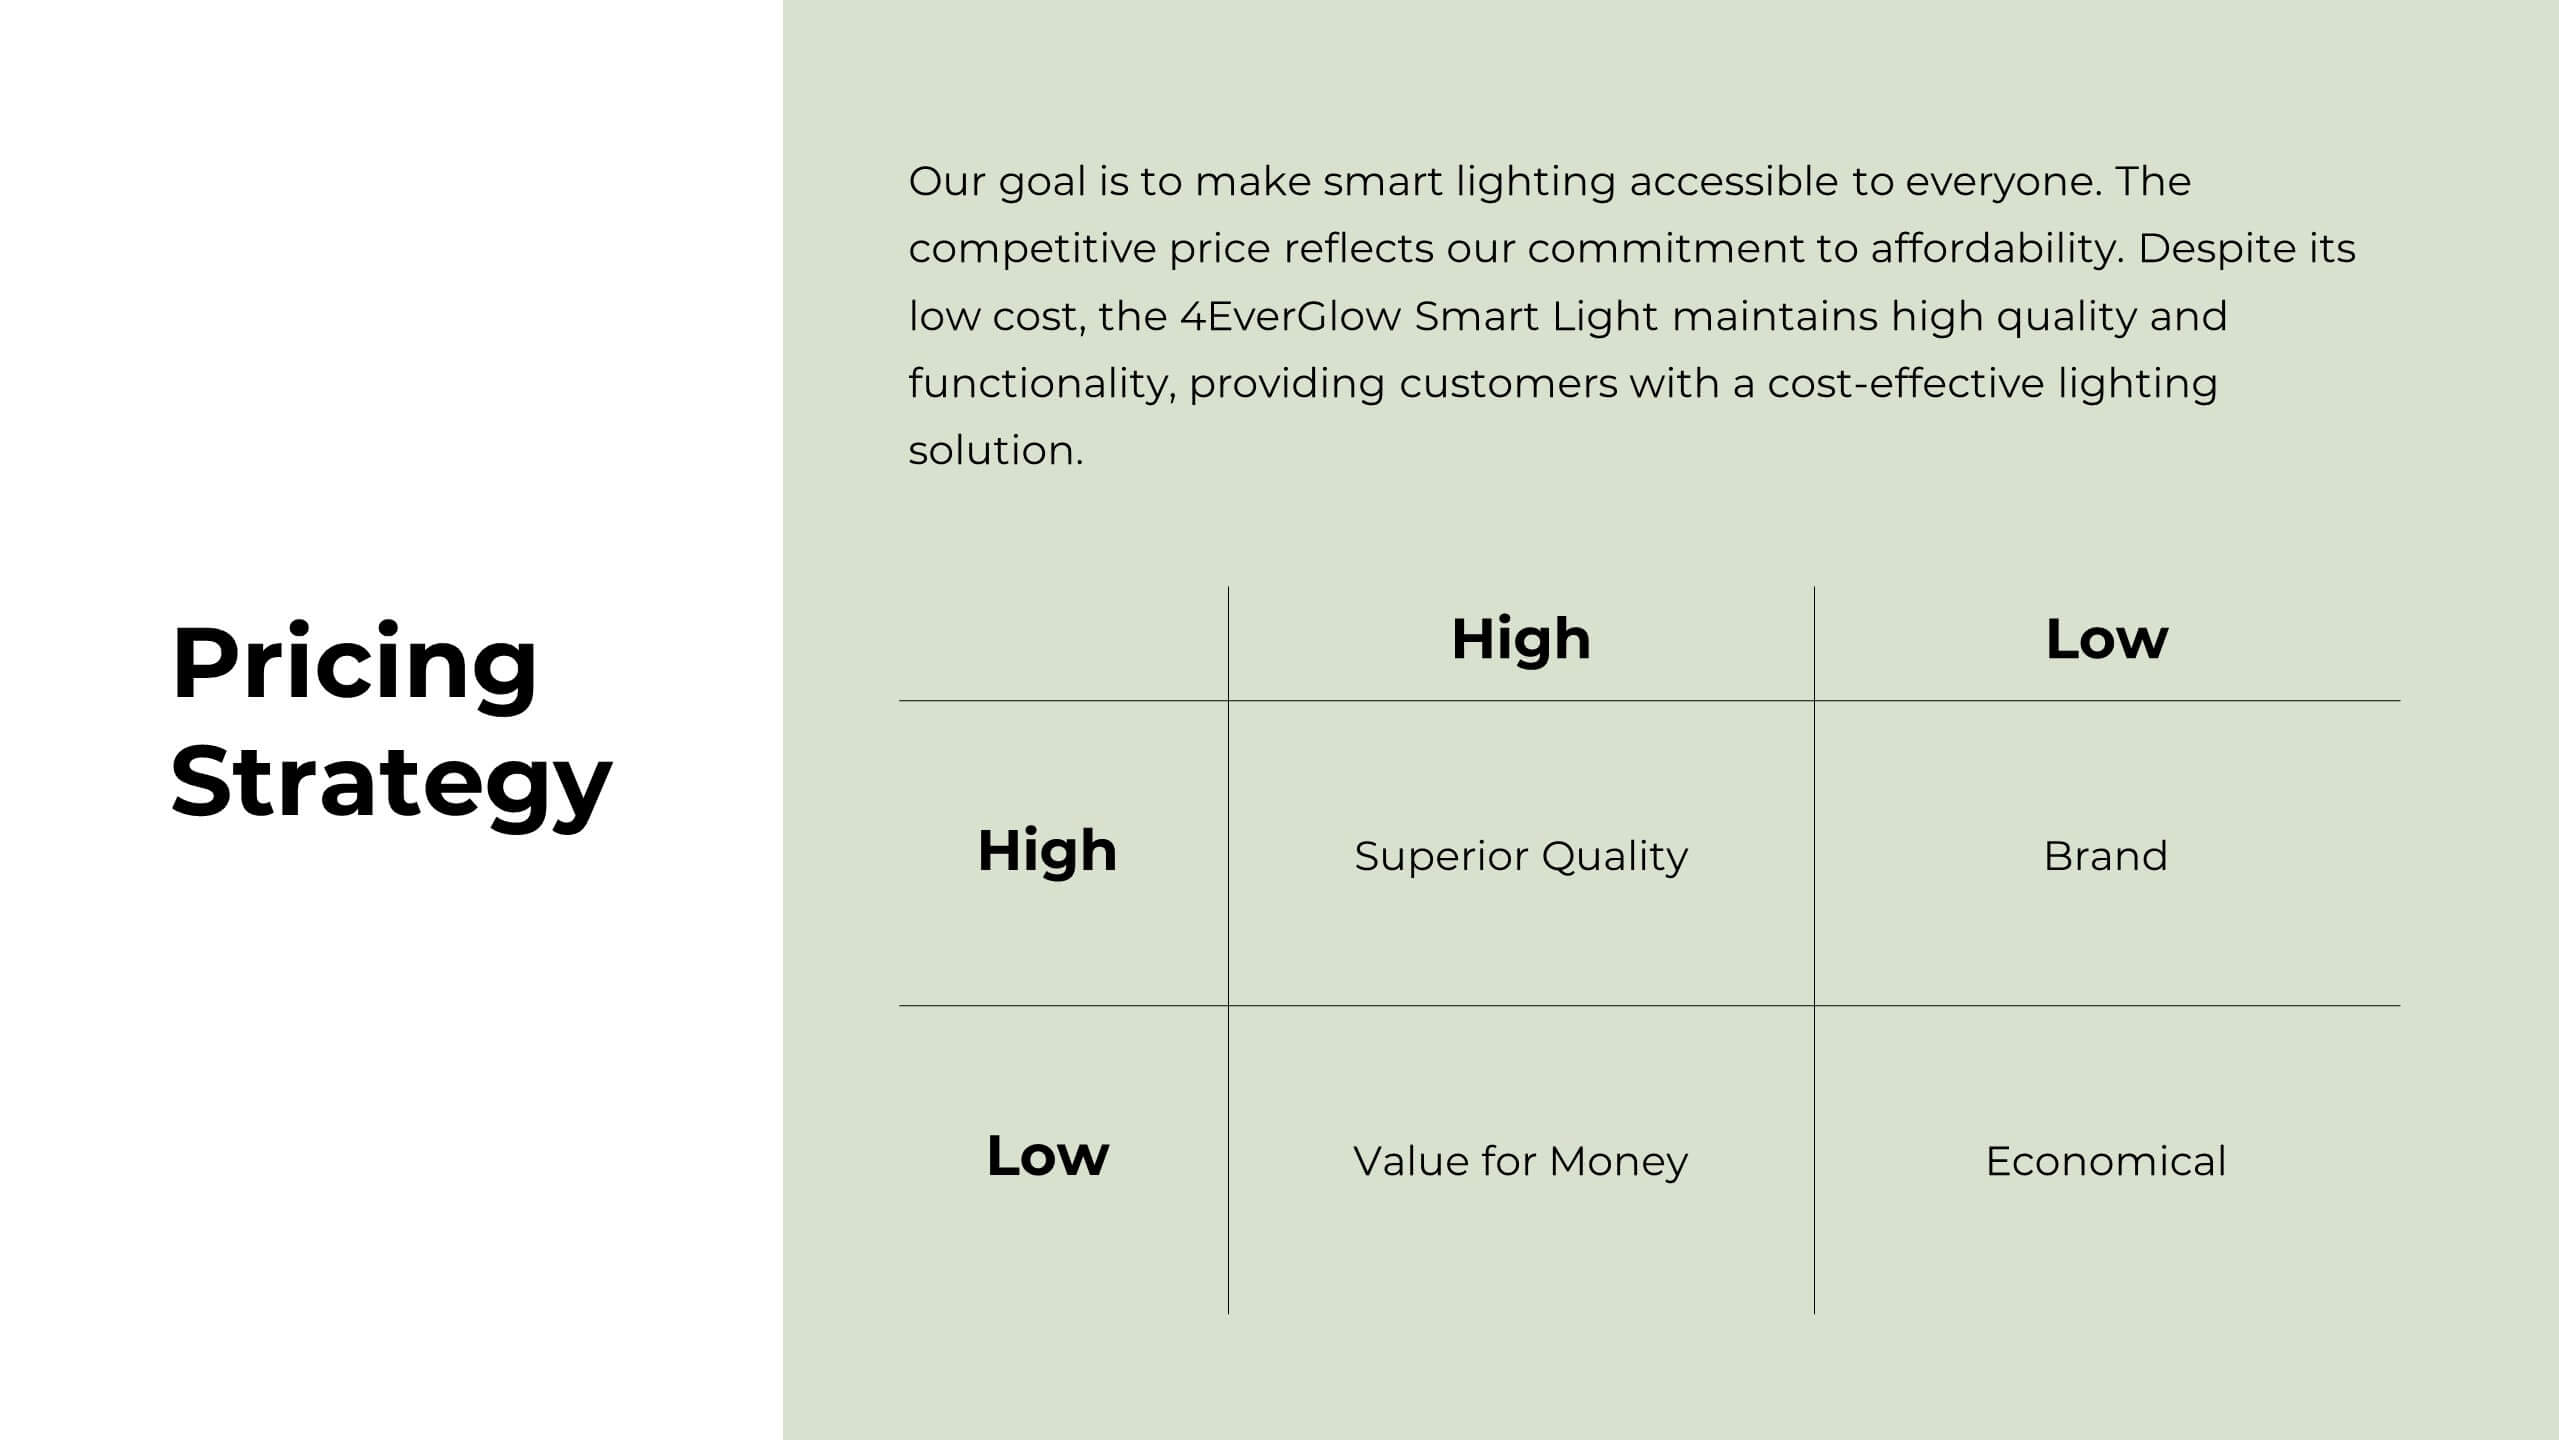
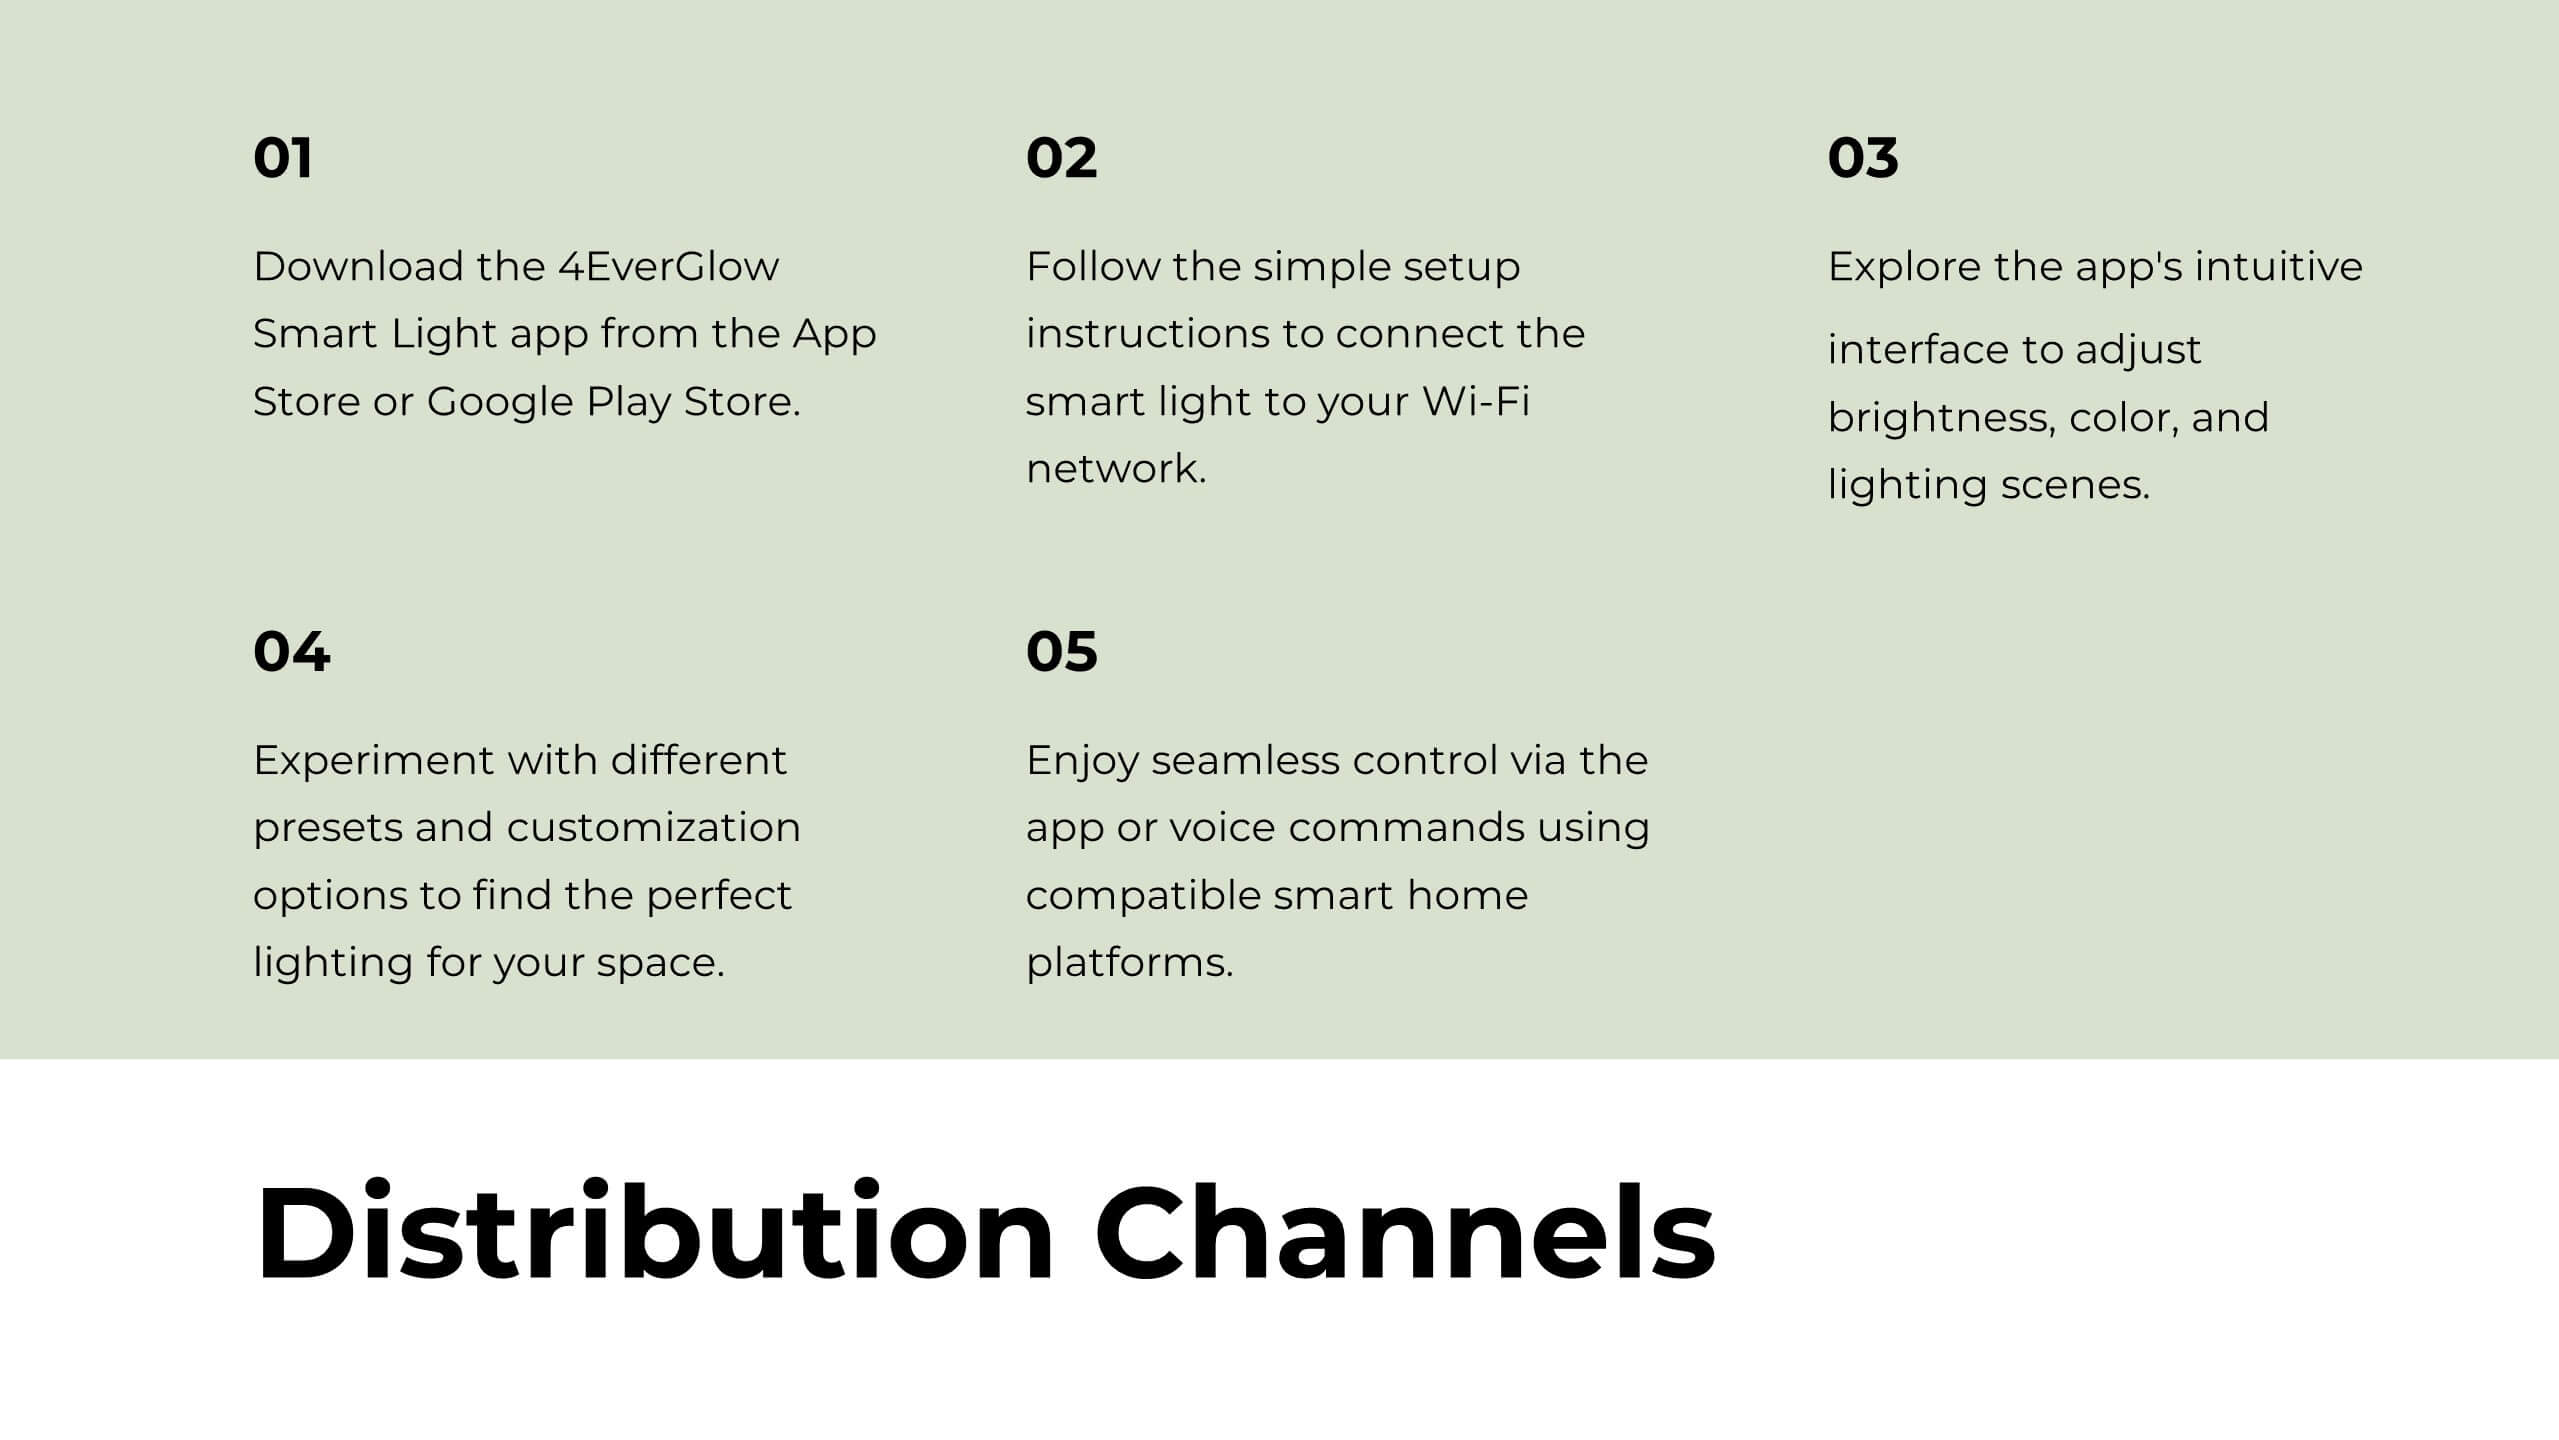
Glint Product Launch Presentation
Develop your product with confidence using this detailed product development plan template! Perfect for outlining features, market analysis, and competitive advantages. Ensure your team's efforts are aligned and maximize the impact of your product launch. Compatible with PowerPoint, Keynote, and Google Slides, it’s your ideal companion for successful product development.


10 diapositivas
Workforce Learning & Training Module Presentation
Visualize your team’s learning journey with the Workforce Learning & Training Module Presentation. This hexagonal layout clearly maps training pillars or module stages, helping you present development plans in a structured, engaging way. Ideal for HR professionals, corporate trainers, and consultants. Fully editable in PowerPoint, Keynote, Google Slides, and Canva.


4 diapositivas
Break-Even Point Financial Analysis Presentation
Clearly define profitability with this break-even point financial analysis template. It visually maps costs, revenue, and profitability, helping businesses assess when they'll cover expenses and start making a profit. Perfect for financial forecasting and business planning. Fully customizable and compatible with PowerPoint, Keynote, and Google Slides for seamless editing and presentation.


4 diapositivas
Strategic SWOT Analysis Chart Presentation
Kick off your strategy session with a clean, modern layout that makes analyzing key strengths, weaknesses, opportunities, and threats feel effortless. This presentation helps teams visualize insights, connect patterns, and plan smarter using a clear, connected flow. Perfect for strategic planning and business reviews. Fully compatible with PowerPoint, Keynote, and Google Slides.


7 diapositivas
Agriculture Cooperative Infographic
Agriculture is the practice of cultivating plants and rearing animals for various purposes, primarily for food, fiber, medicinal plants, and other products used to sustain and enhance human life. This informative infographic template is a scenic route through the cooperative landscape, providing essential insights into communal farming practices and fostering agricultural growth. Compatible with Powerpoint, Keynote, and Google Slides. Easily highlight the educational aspect of cooperatives. This template is designed to cultivate understanding and appreciation for the collaborative spirit that drives agricultural progress.


6 diapositivas
Financial Report Summary Presentation
Showcase key financial highlights with the Financial Report Summary slide. Featuring a central moneybag icon surrounded by currency symbols, this layout is ideal for presenting up to five critical financial insights or revenue sources. Each label is paired with editable titles and descriptions to keep your content clear and relevant. Fully compatible with PowerPoint, Keynote, and Google Slides for effortless customization.


4 diapositivas
Lean Startup Business Model Presentation
Optimize your startup strategy with the Lean Startup Business Model Presentation. This fully customizable template simplifies key business components, including funding sources, revenue models, growth strategies, and value propositions. Designed for entrepreneurs, investors, and business analysts, this layout is available for PowerPoint, Keynote, and Google Slides, ensuring a professional, structured, and impactful presentation.