


Características


¿Tienes alguna pregunta?
Recomendar


20 diapositivas
Venus Design Proposal Presentation
Present your design proposal with confidence using this sleek and professional layout! It includes everything from problem statements and proposed solutions to budget breakdowns, milestones, and team expertise, ensuring every detail is covered. Ideal for client presentations or internal project pitches, this template is fully compatible with PowerPoint, Keynote, and Google Slides.


6 diapositivas
Governance Information Infographic
Governance refers to the system of rules, practices, and processes by which an organization or entity is directed, controlled, and regulated. This infographic template is designed to present key information about a governance structure, guidelines, or principles. The layout of this template is organized logically, maintaining a clear flow from one section to another. Summarize the benefits and importance of effective governance. This template will encourage you audience to learn more about the governance or its implementation. This template is fully customizable and compatible with Powerpoint, Keynote, and Google Slides.


6 diapositivas
Project Status Dashboard Infographic
"Project status" refers to the current state or progress of a project at a specific point in time. This infographic template provides an overview of the project's accomplishments, milestones achieved, and any potential issues or challenges that may have arisen during its execution. This well-designed project status infographic serves as a quick reference guide for your audience to understand a project's overall health, progress, and potential challenges. Compatible with Powerpoint, Keynote, and Google Slides. The use of icons, images, and graphics help enhance engagement. The incorporation of charts and graphs present quantitative information.


6 diapositivas
Value Delivery Framework Presentation
Turn your strategy into action with a clear, layered design that highlights how value flows through every stage of your process. Perfect for explaining organizational efficiency, performance models, or delivery systems. Fully editable and compatible with PowerPoint, Keynote, and Google Slides for easy, professional customization.
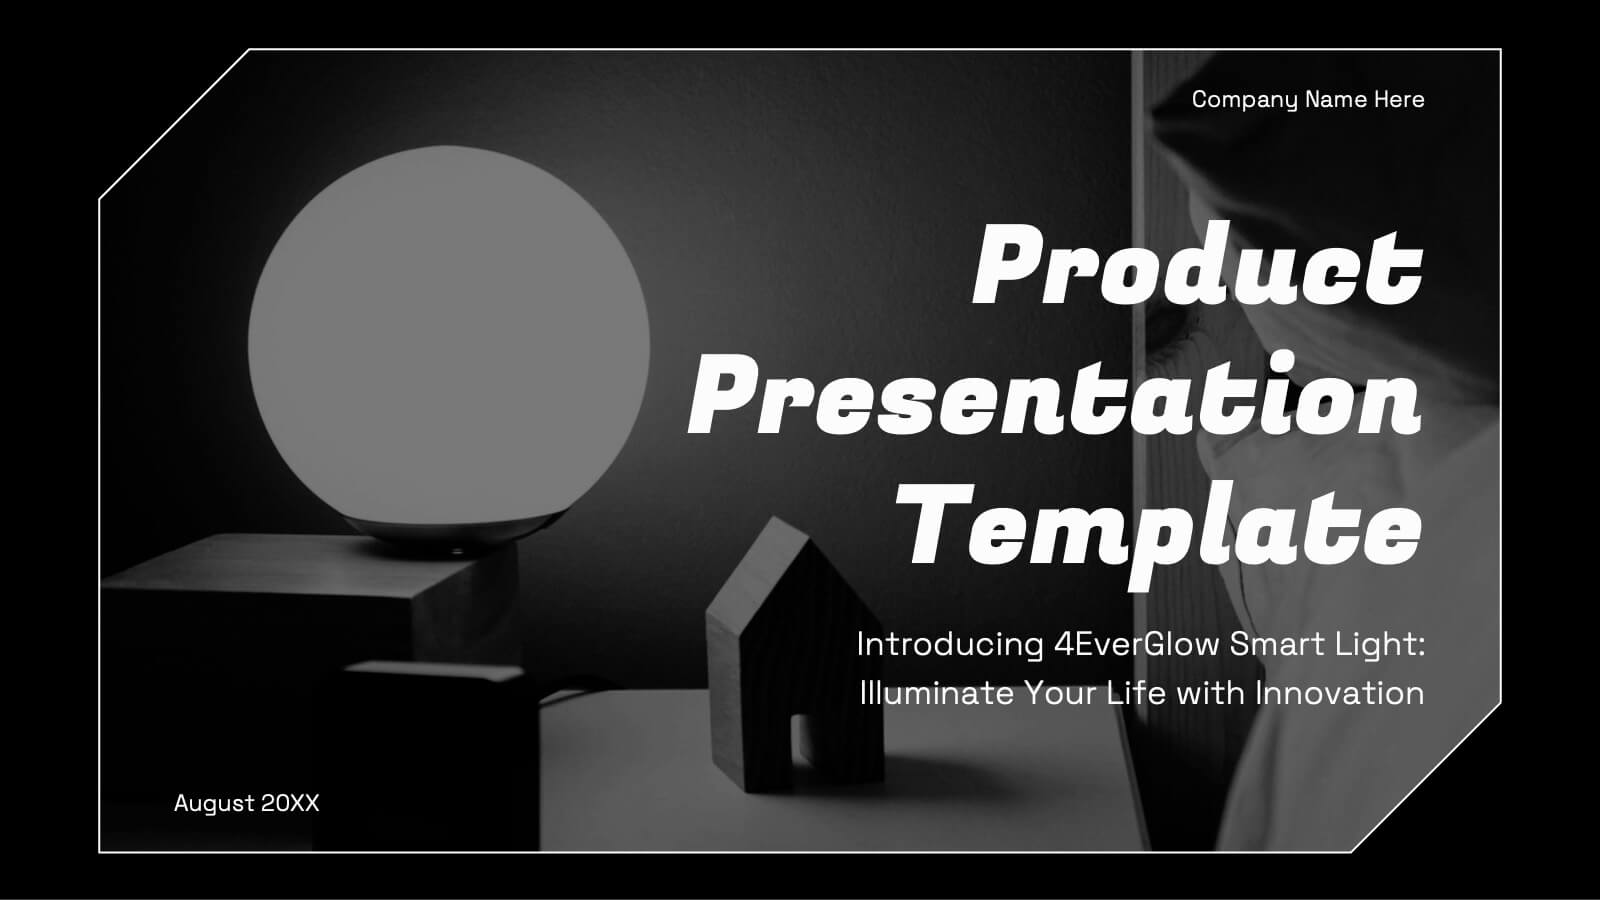
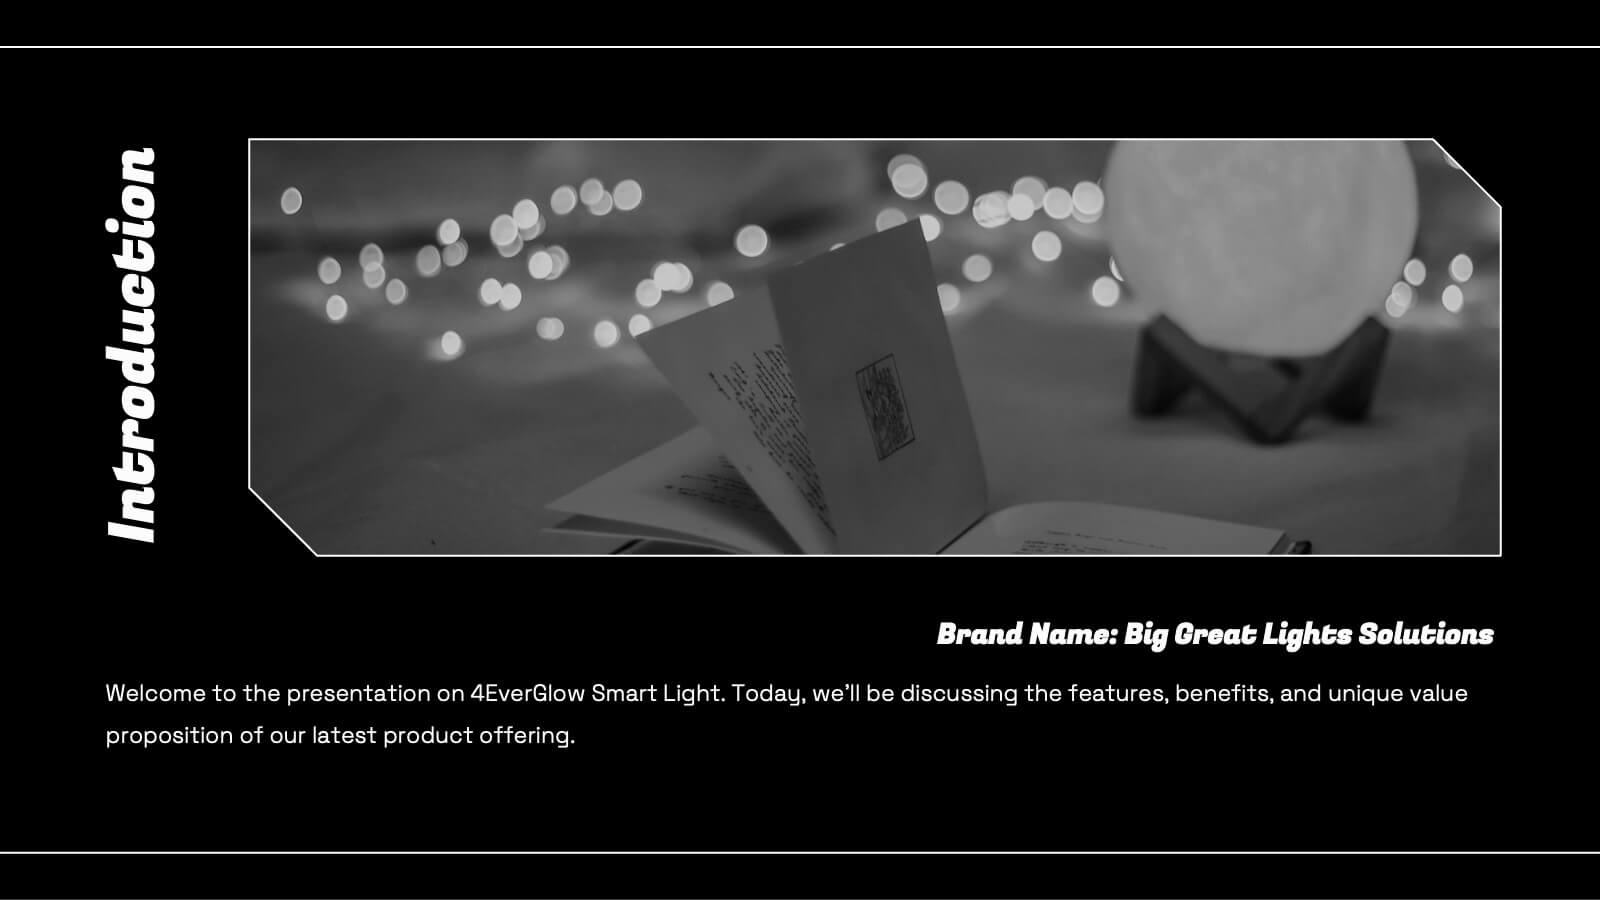

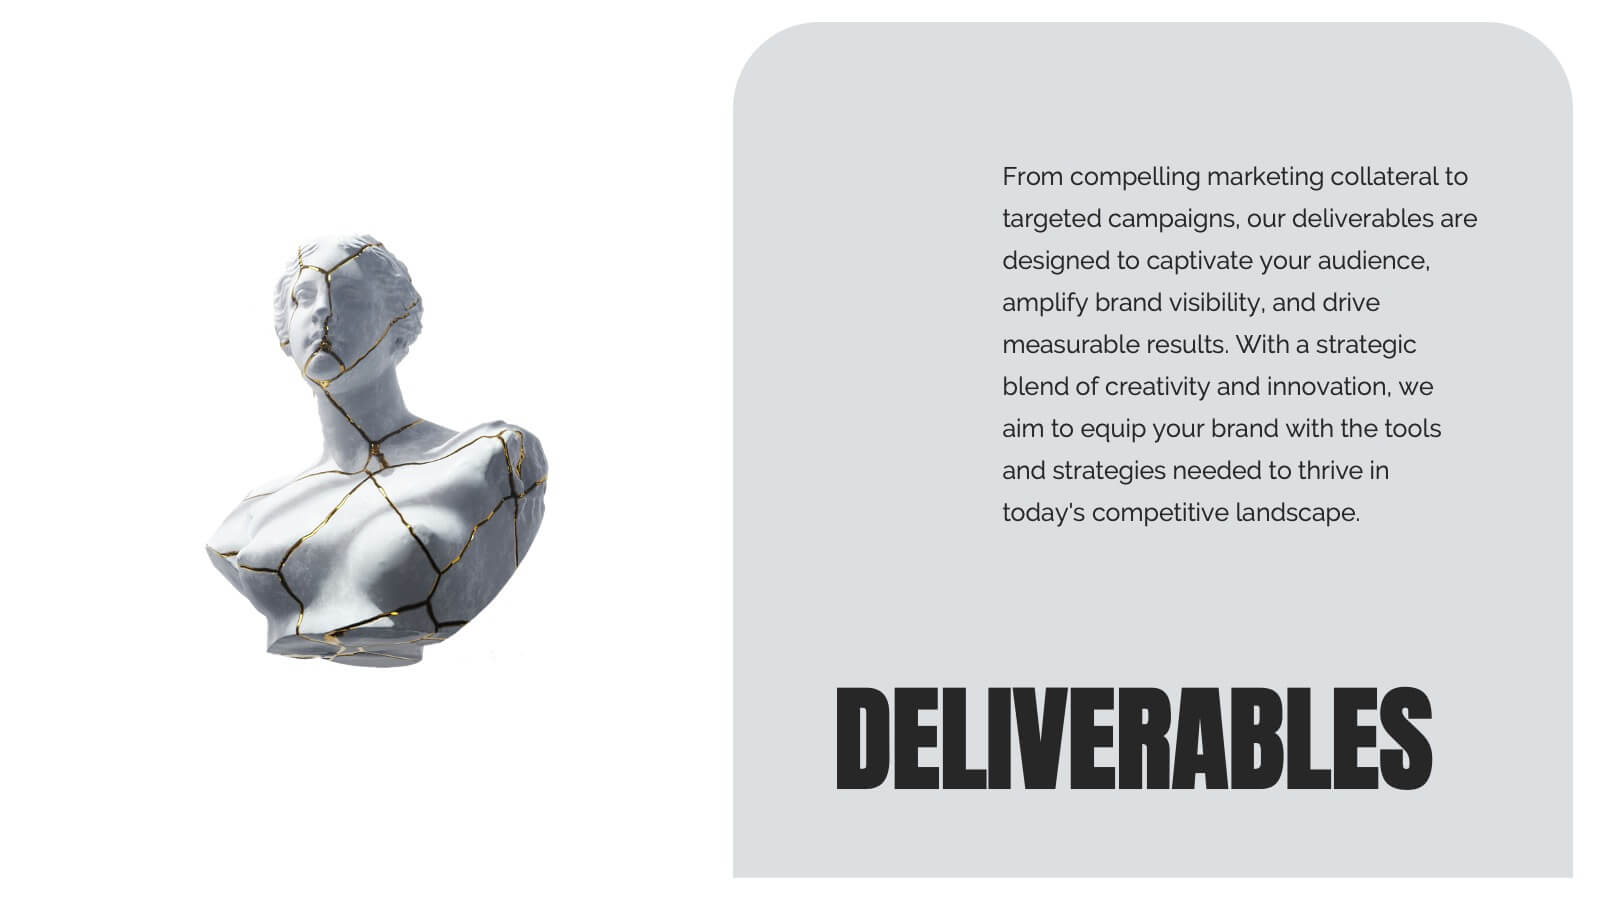
20 diapositivas
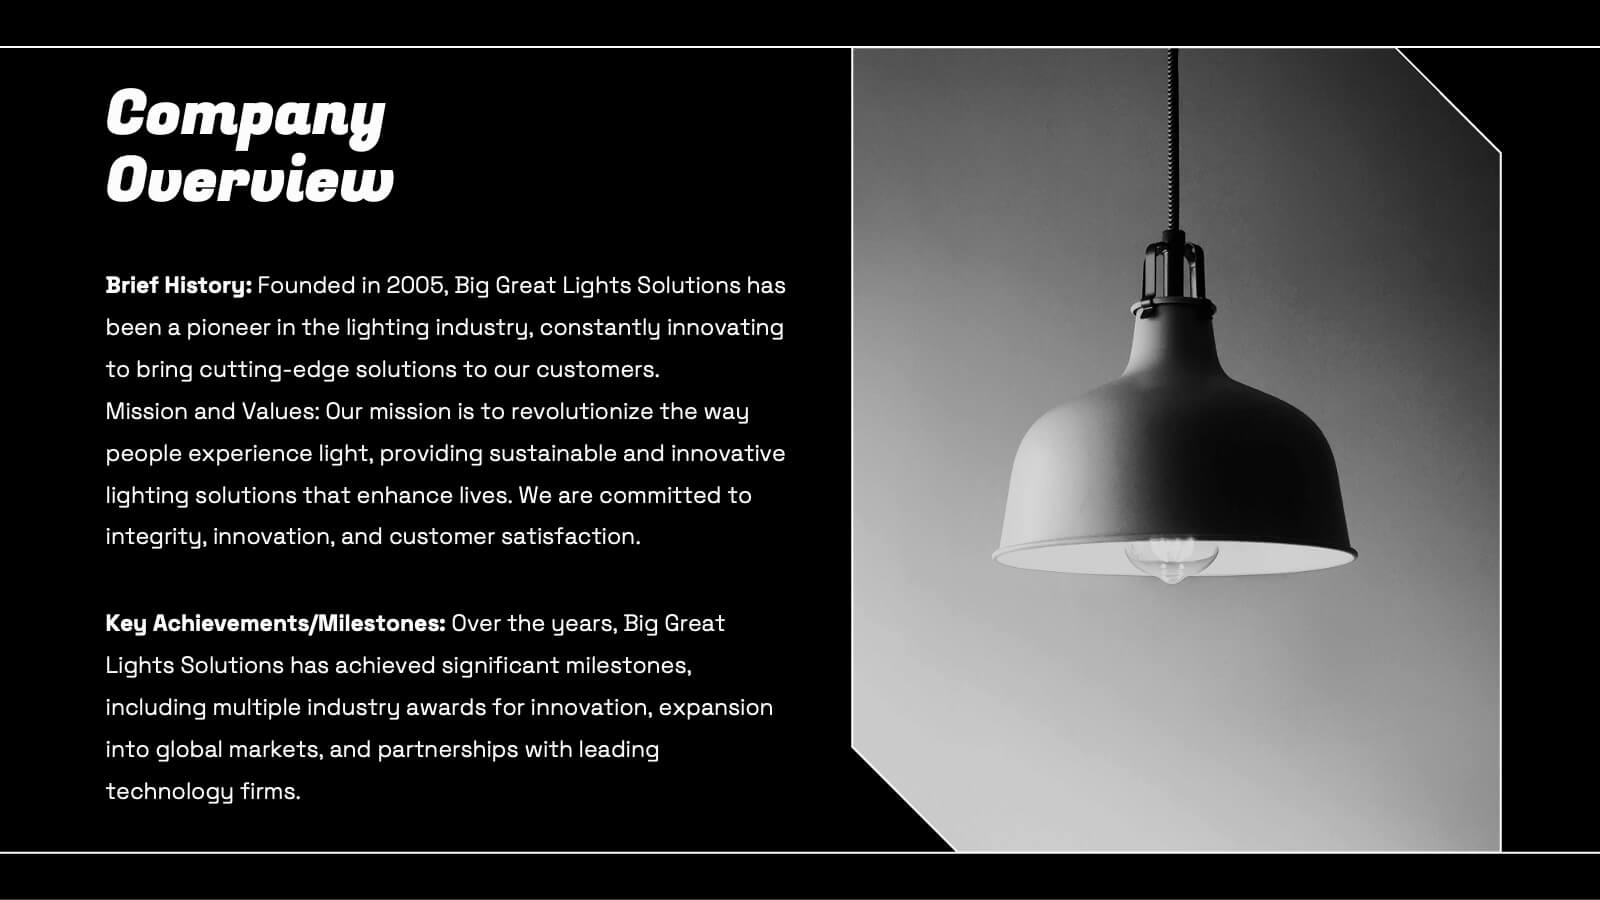
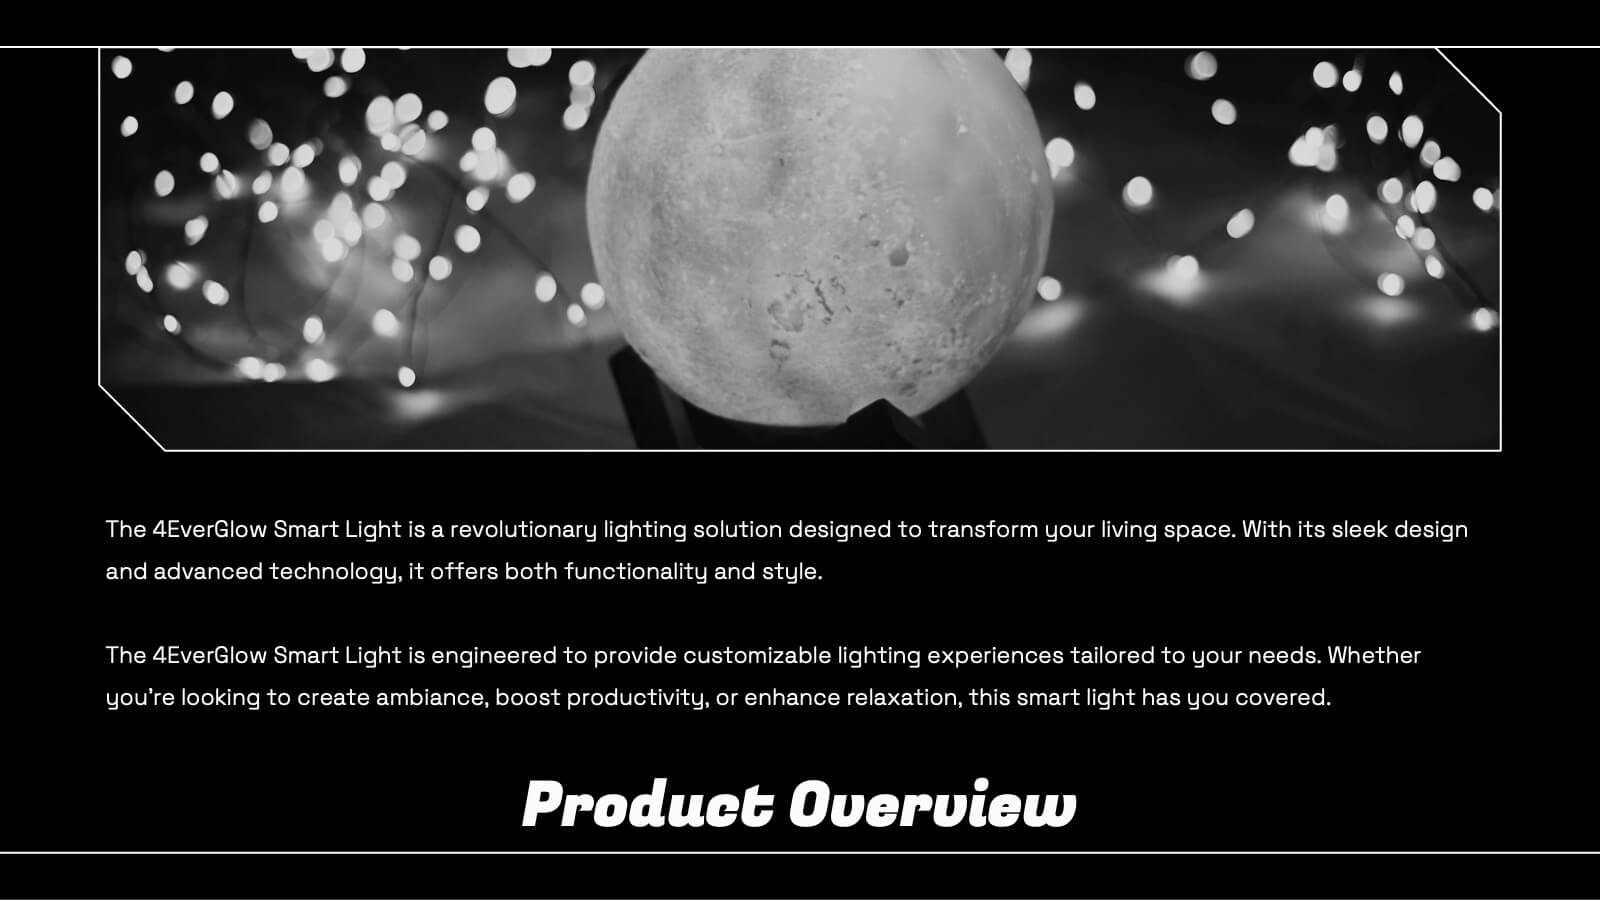
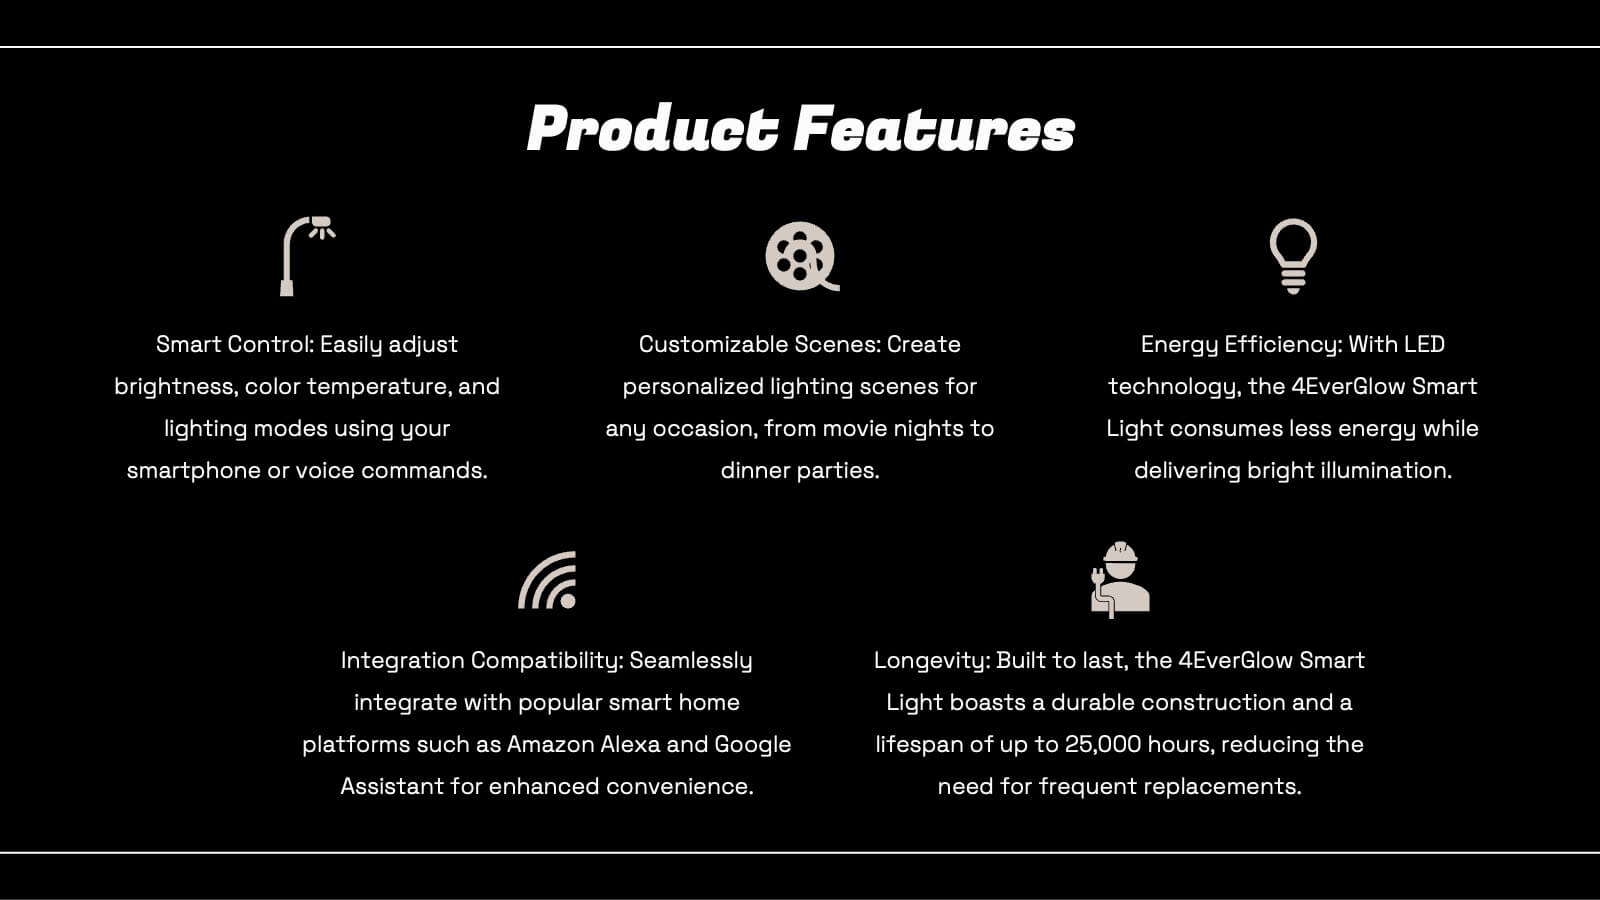
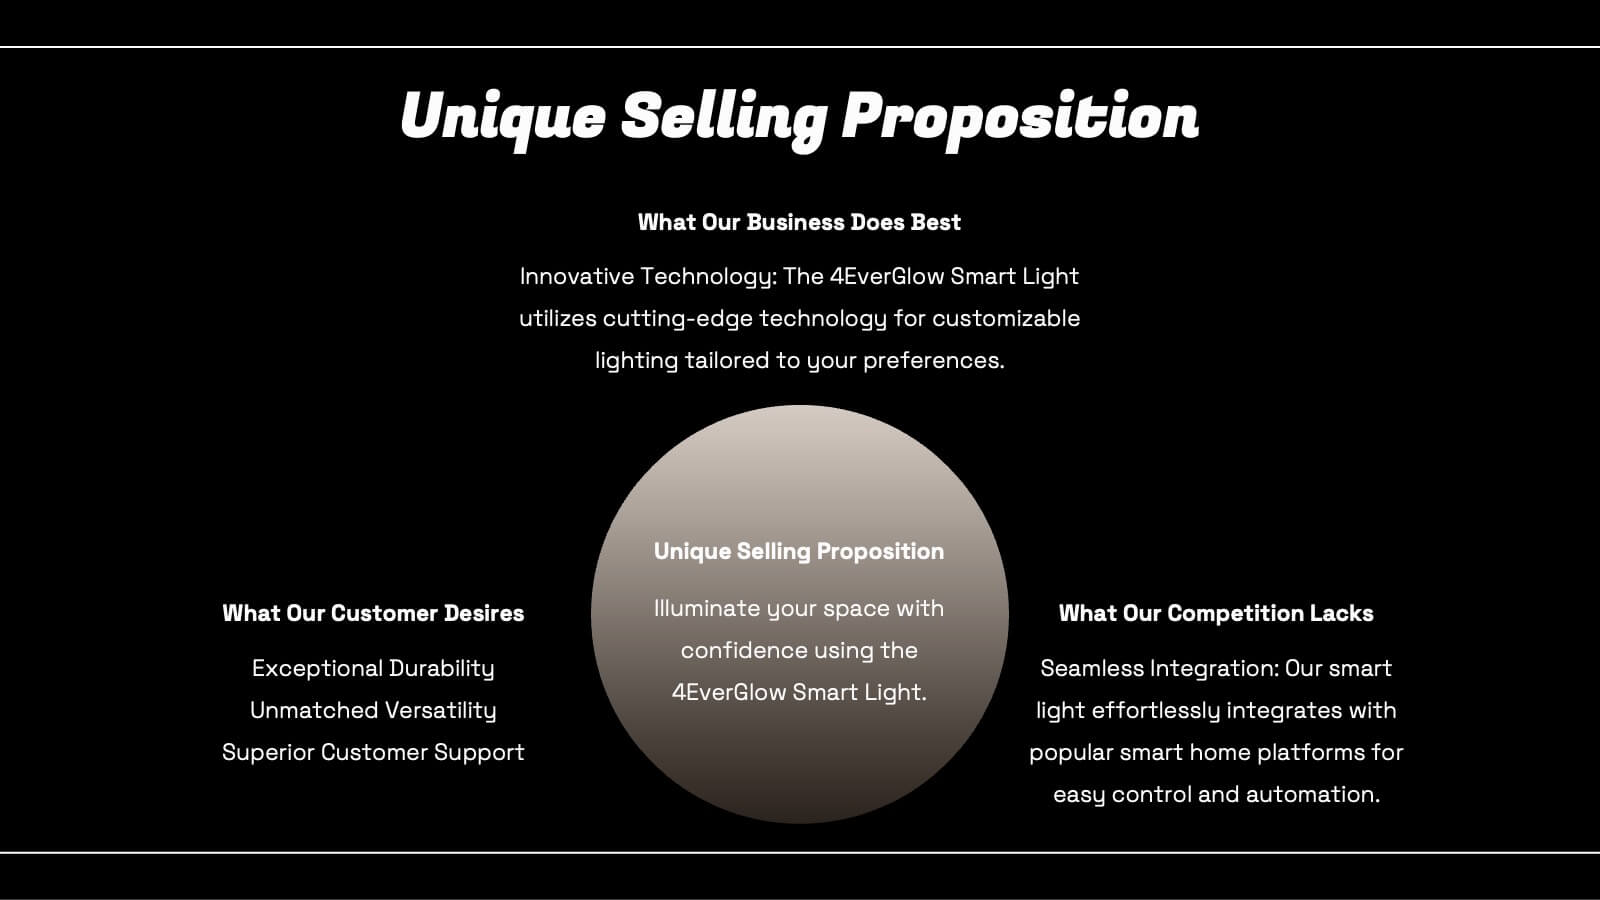
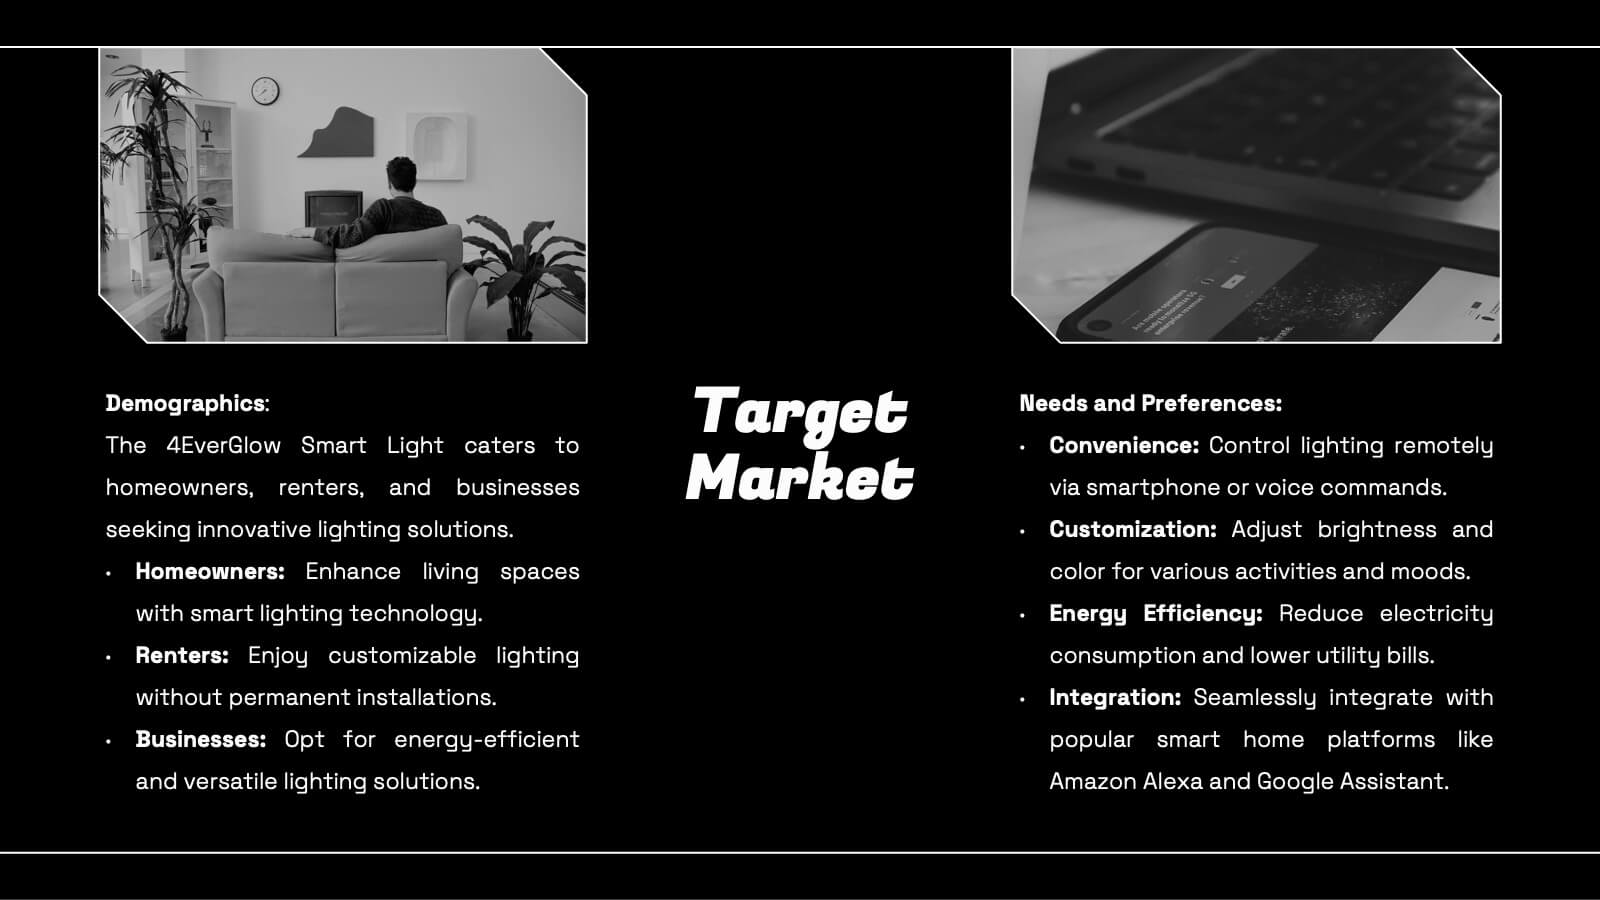
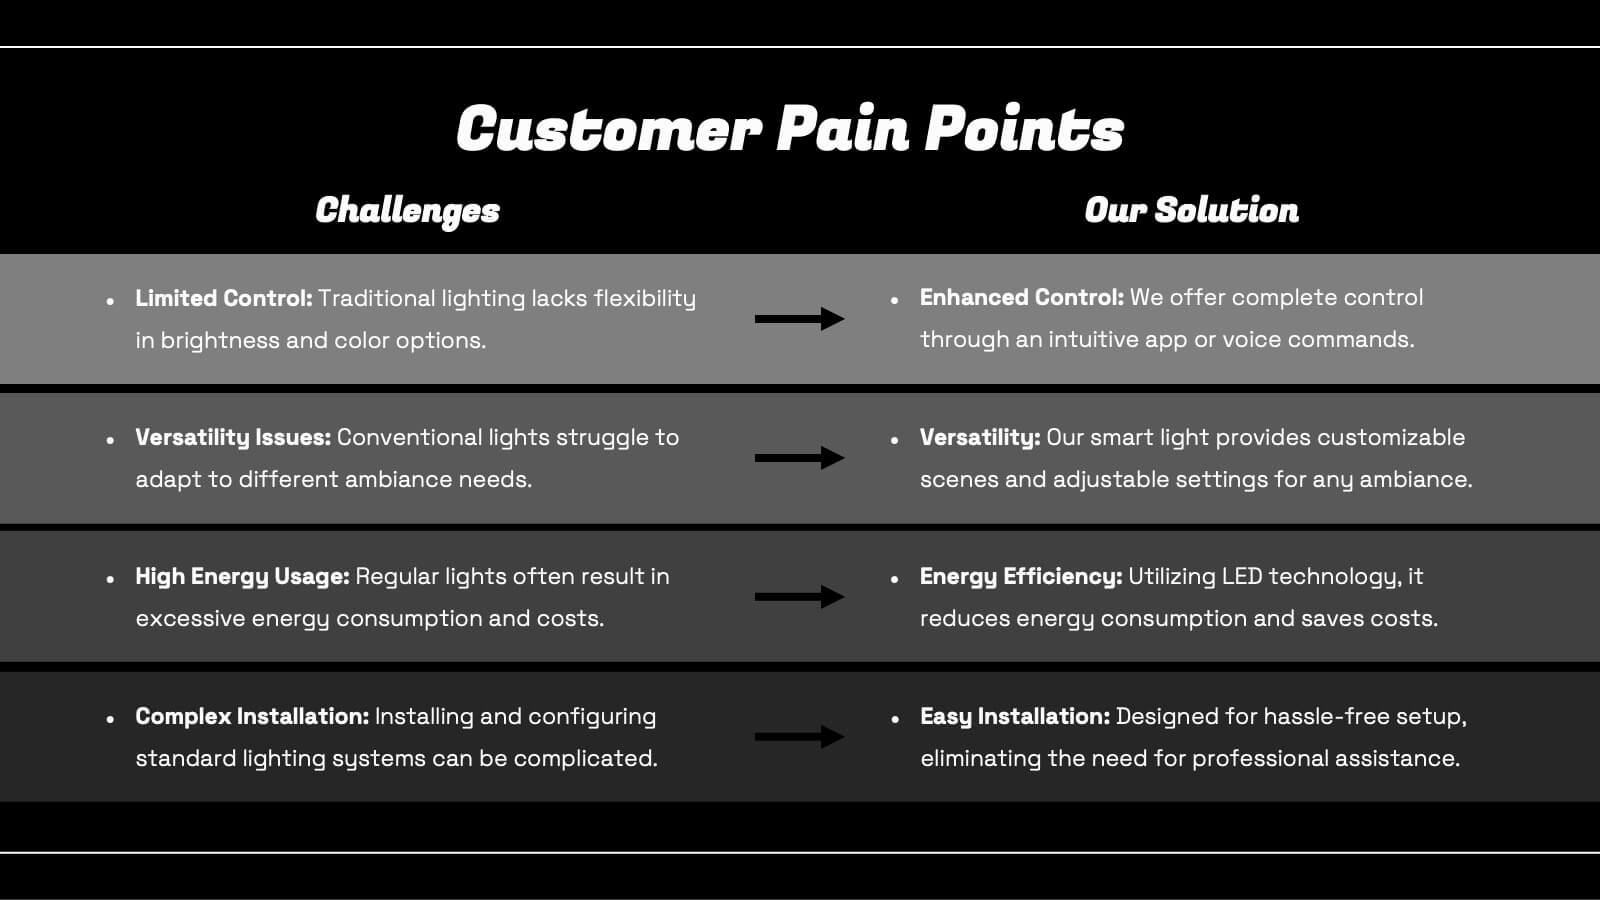
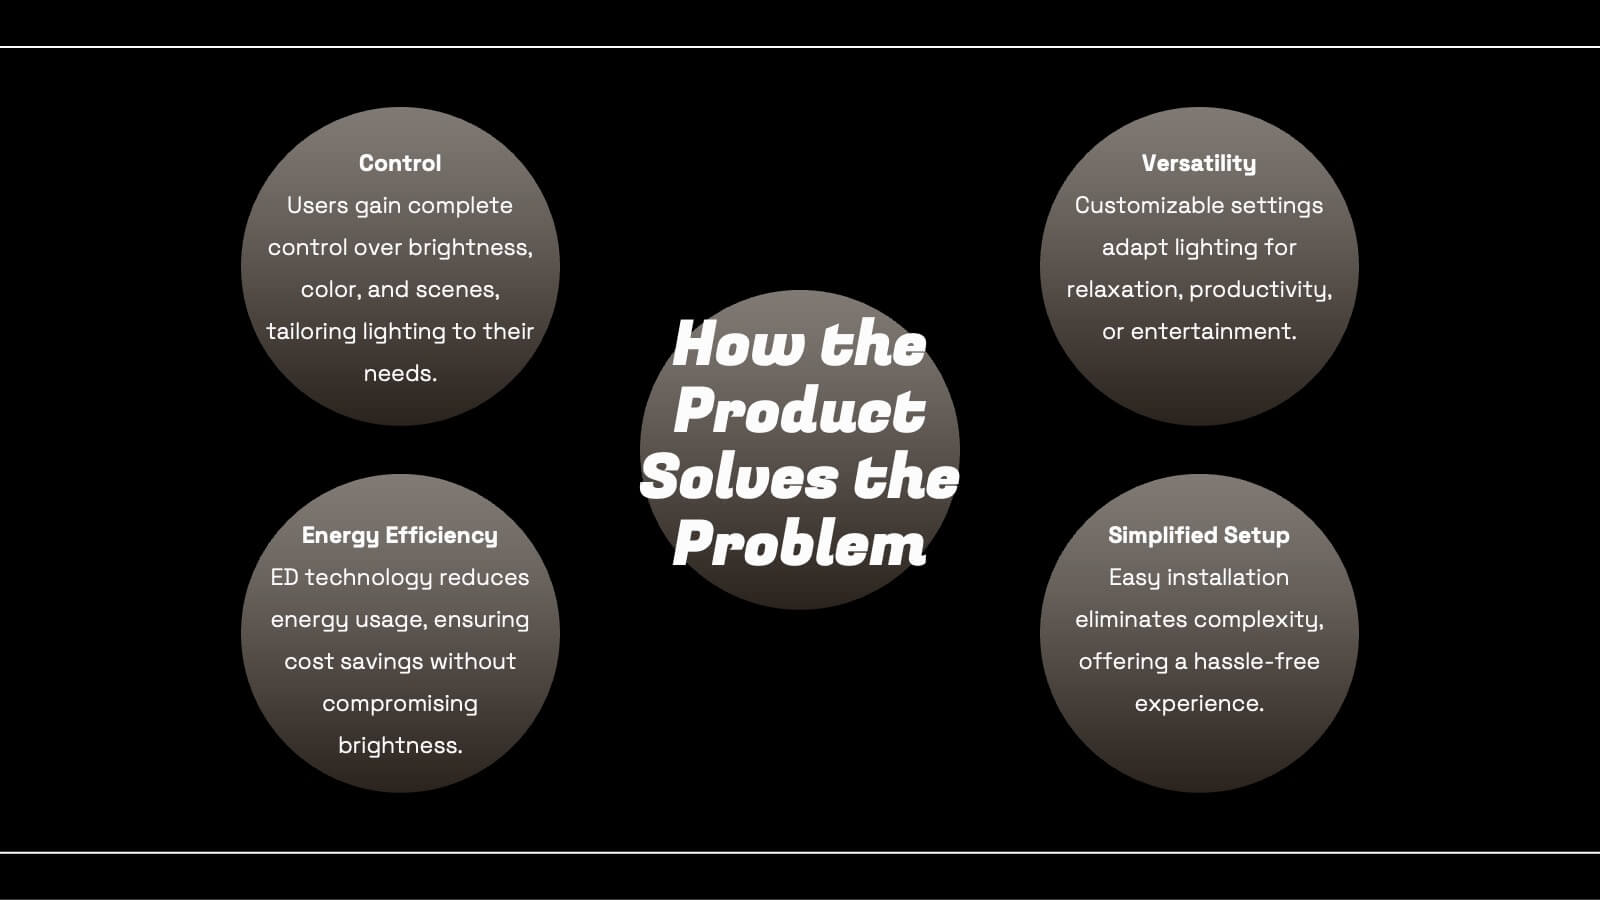
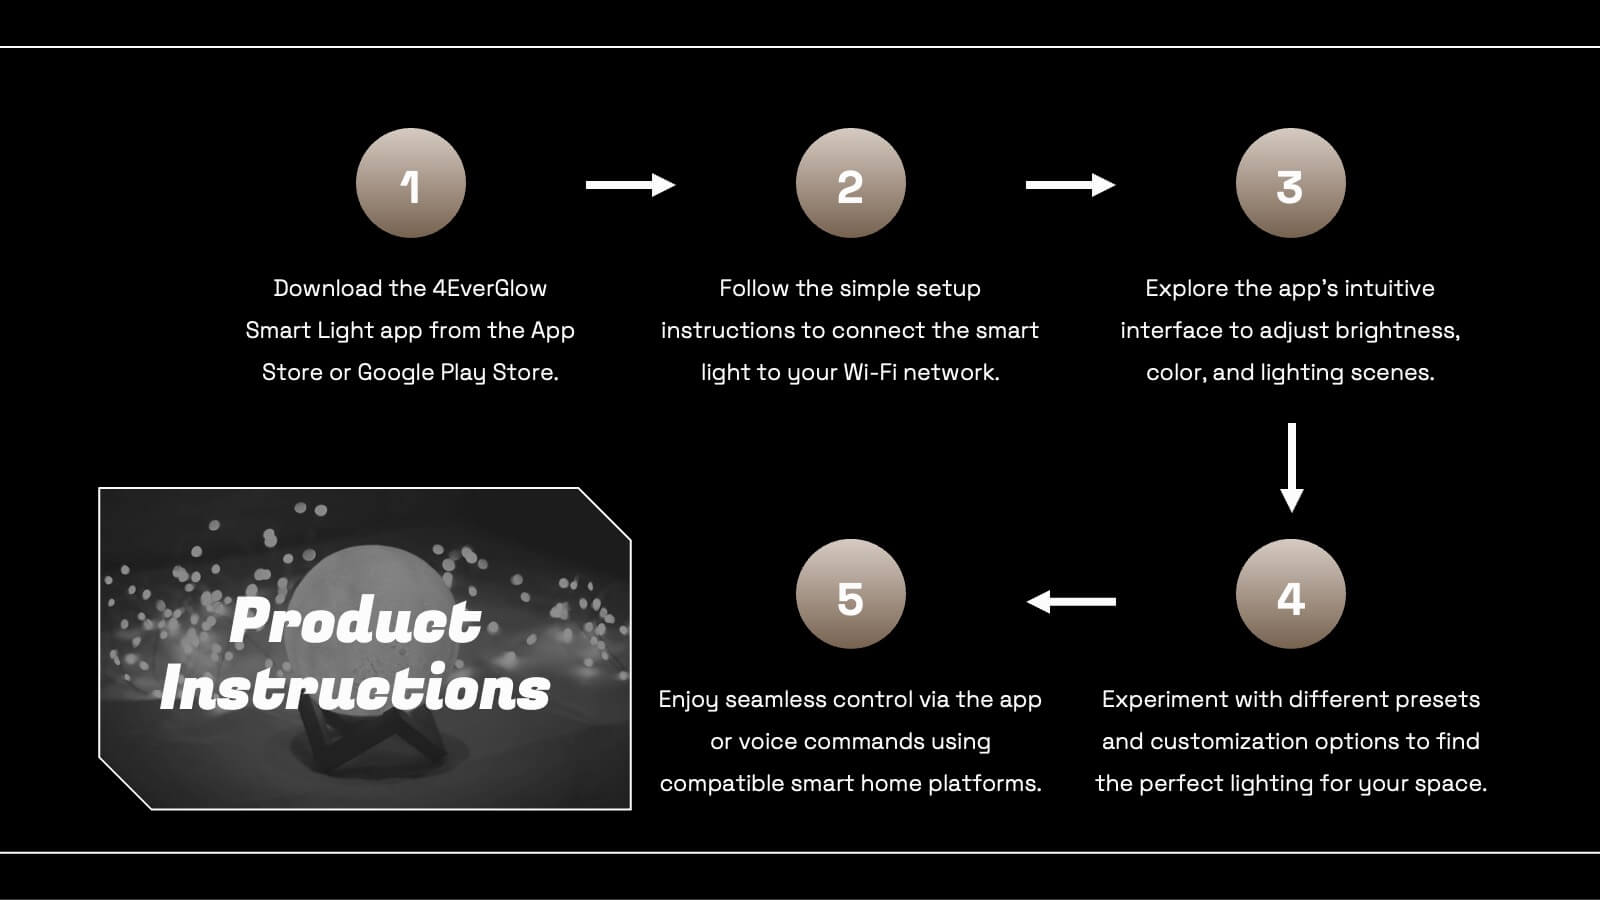
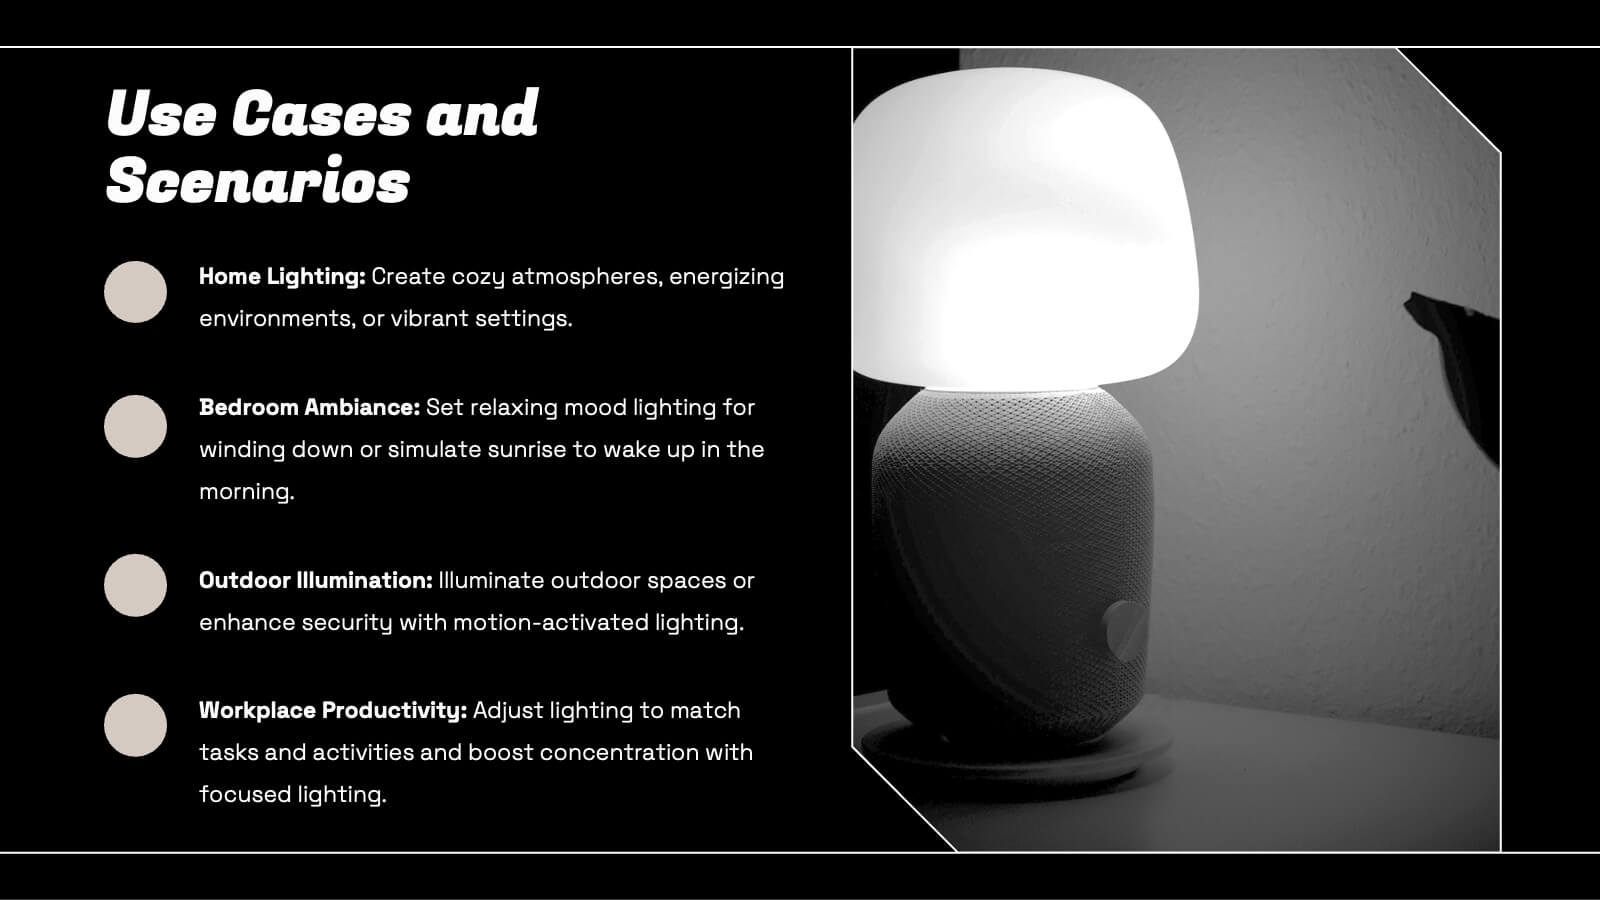
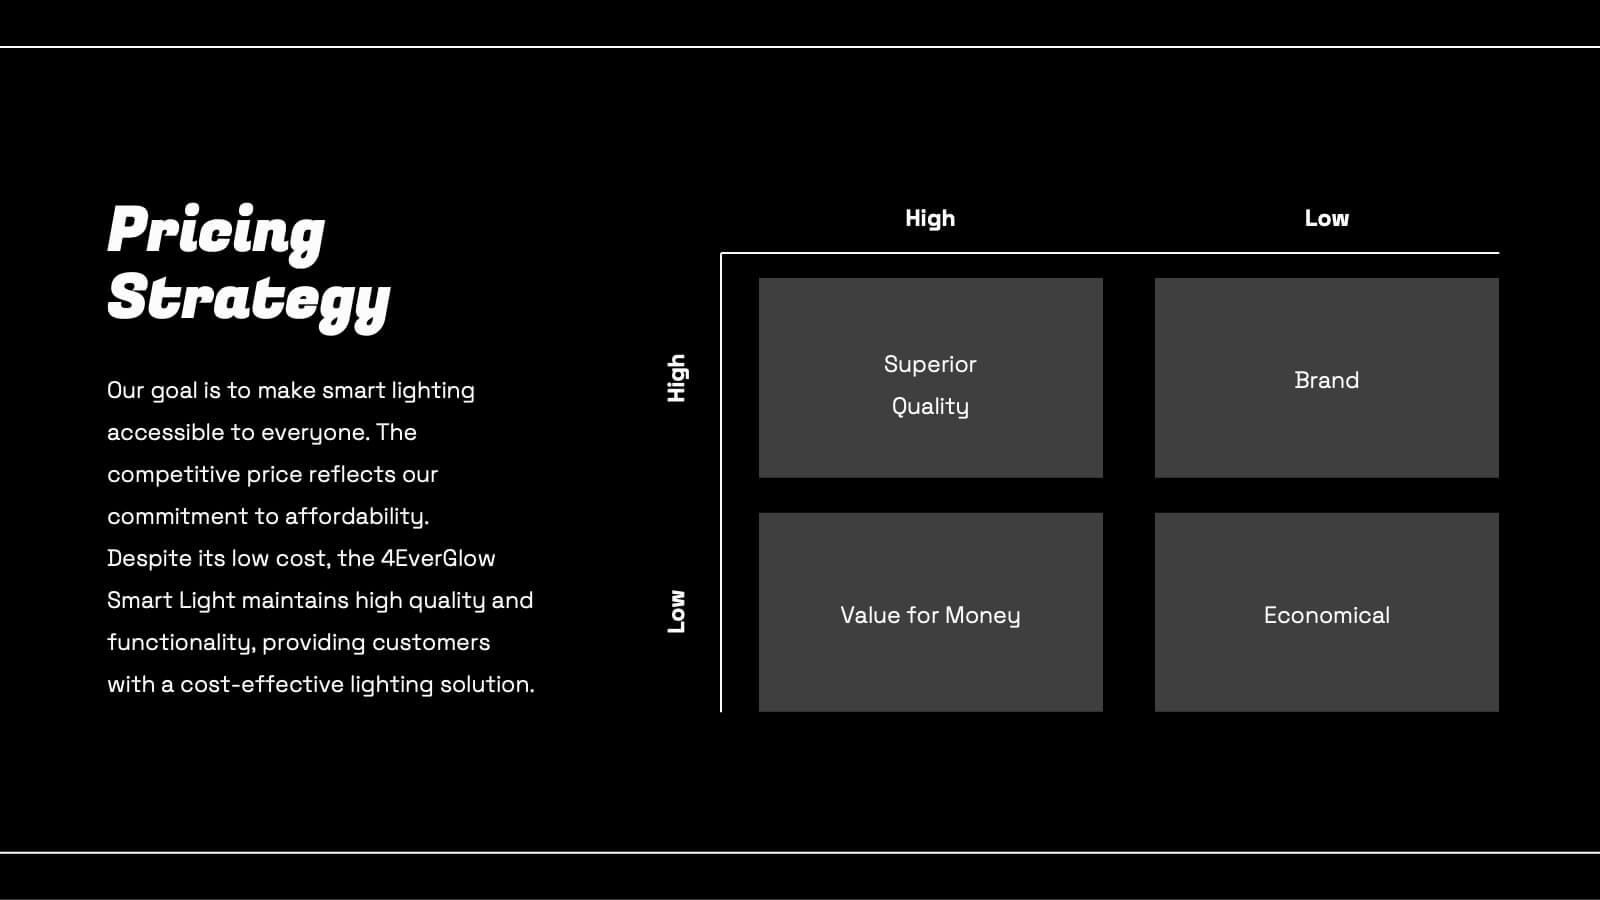
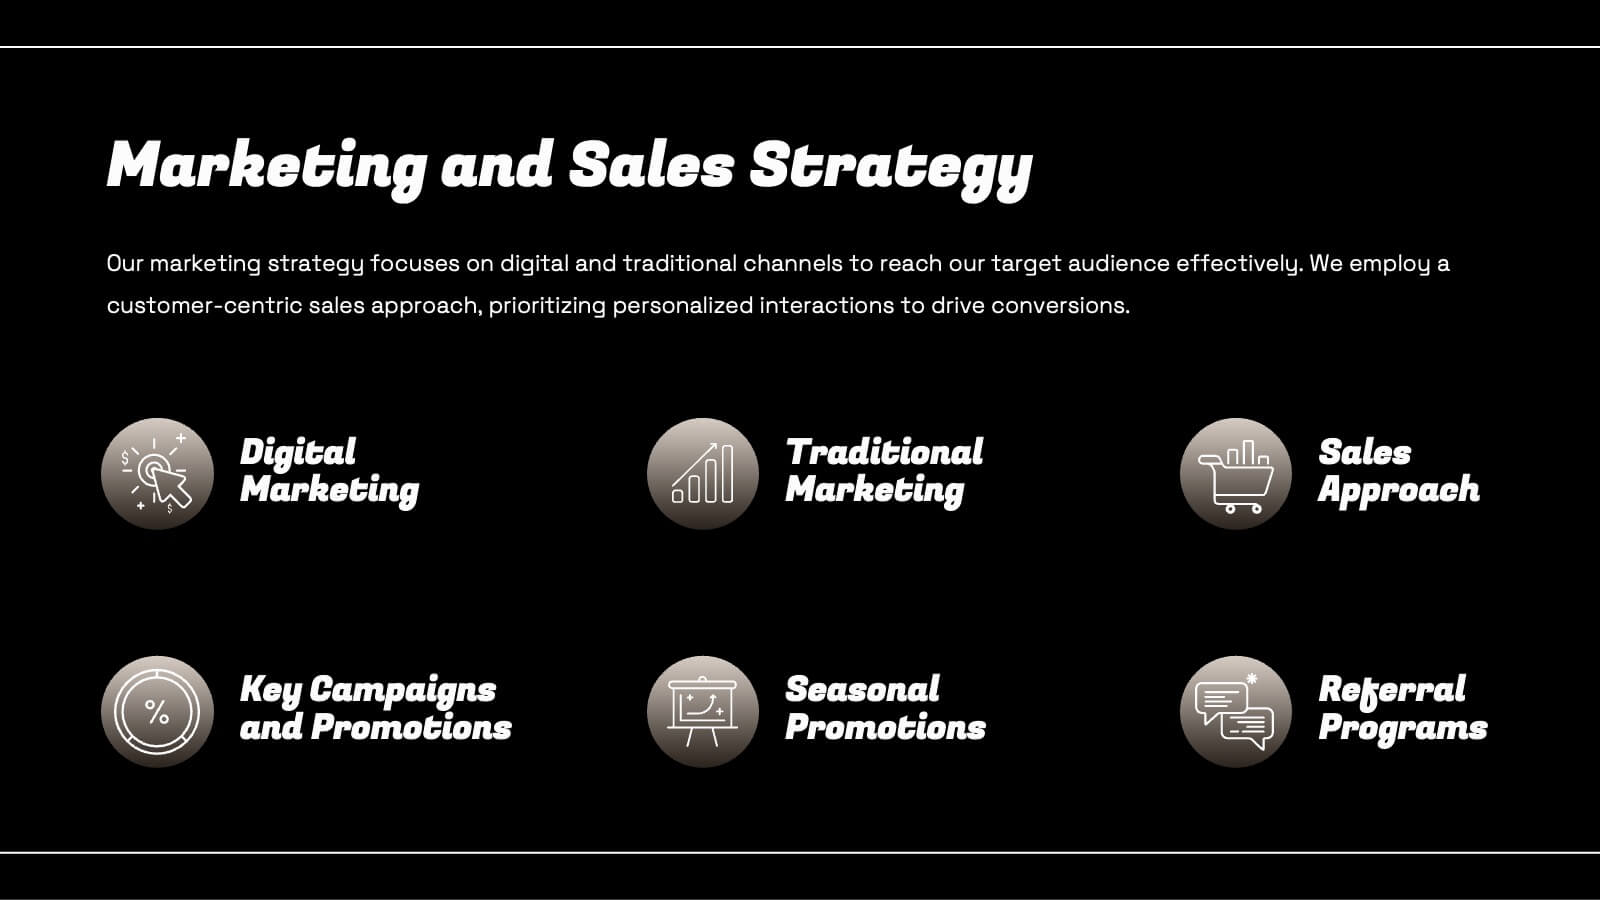
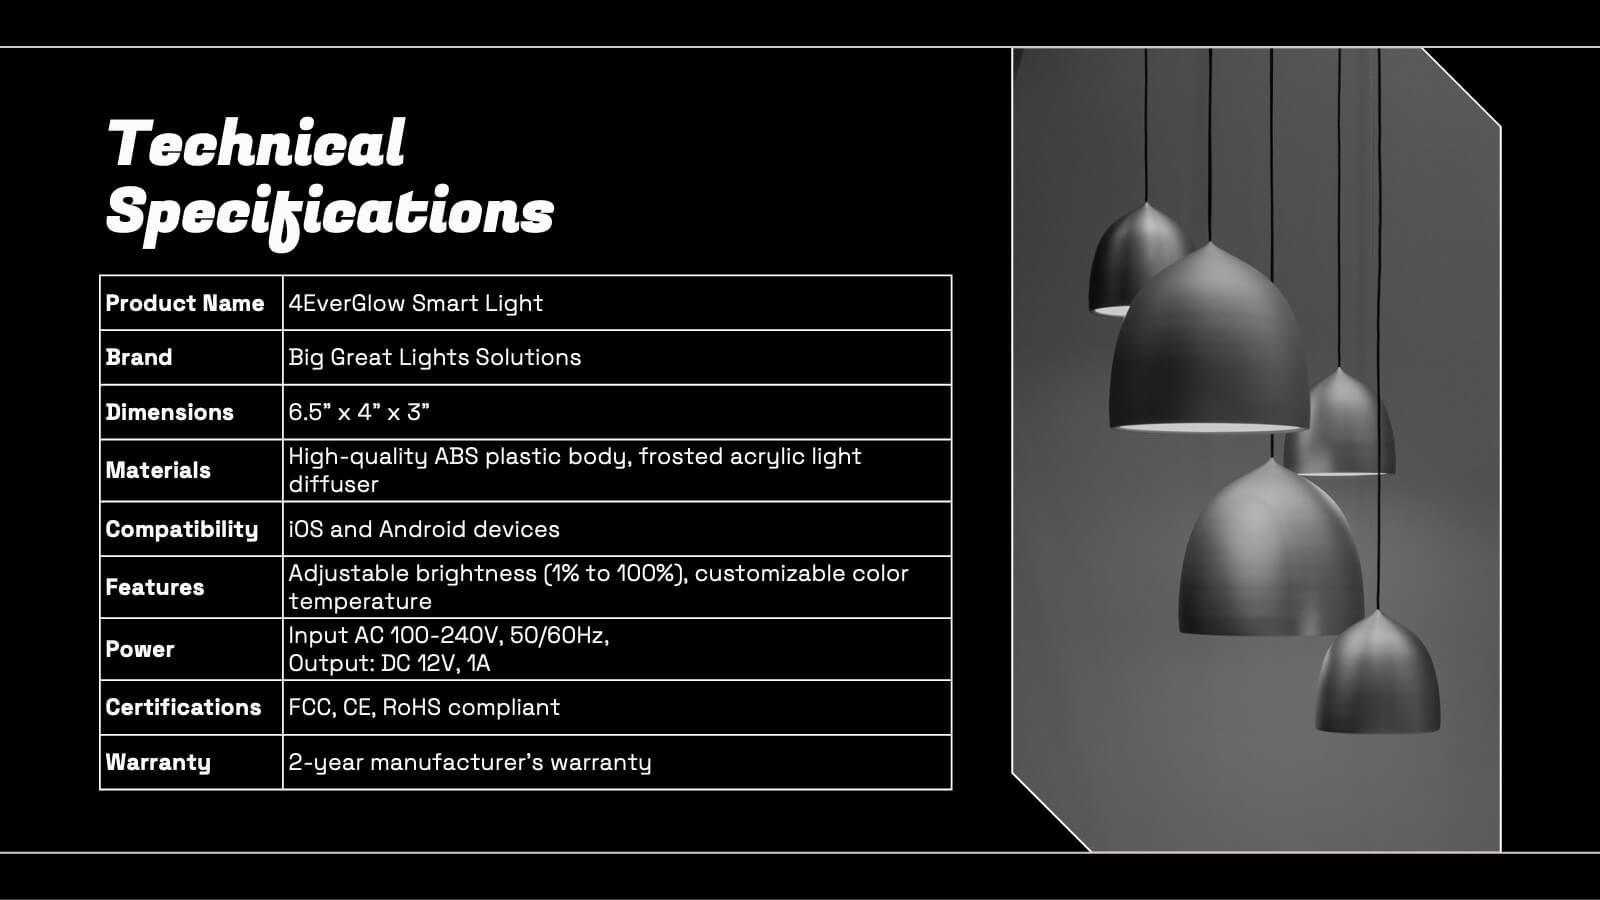
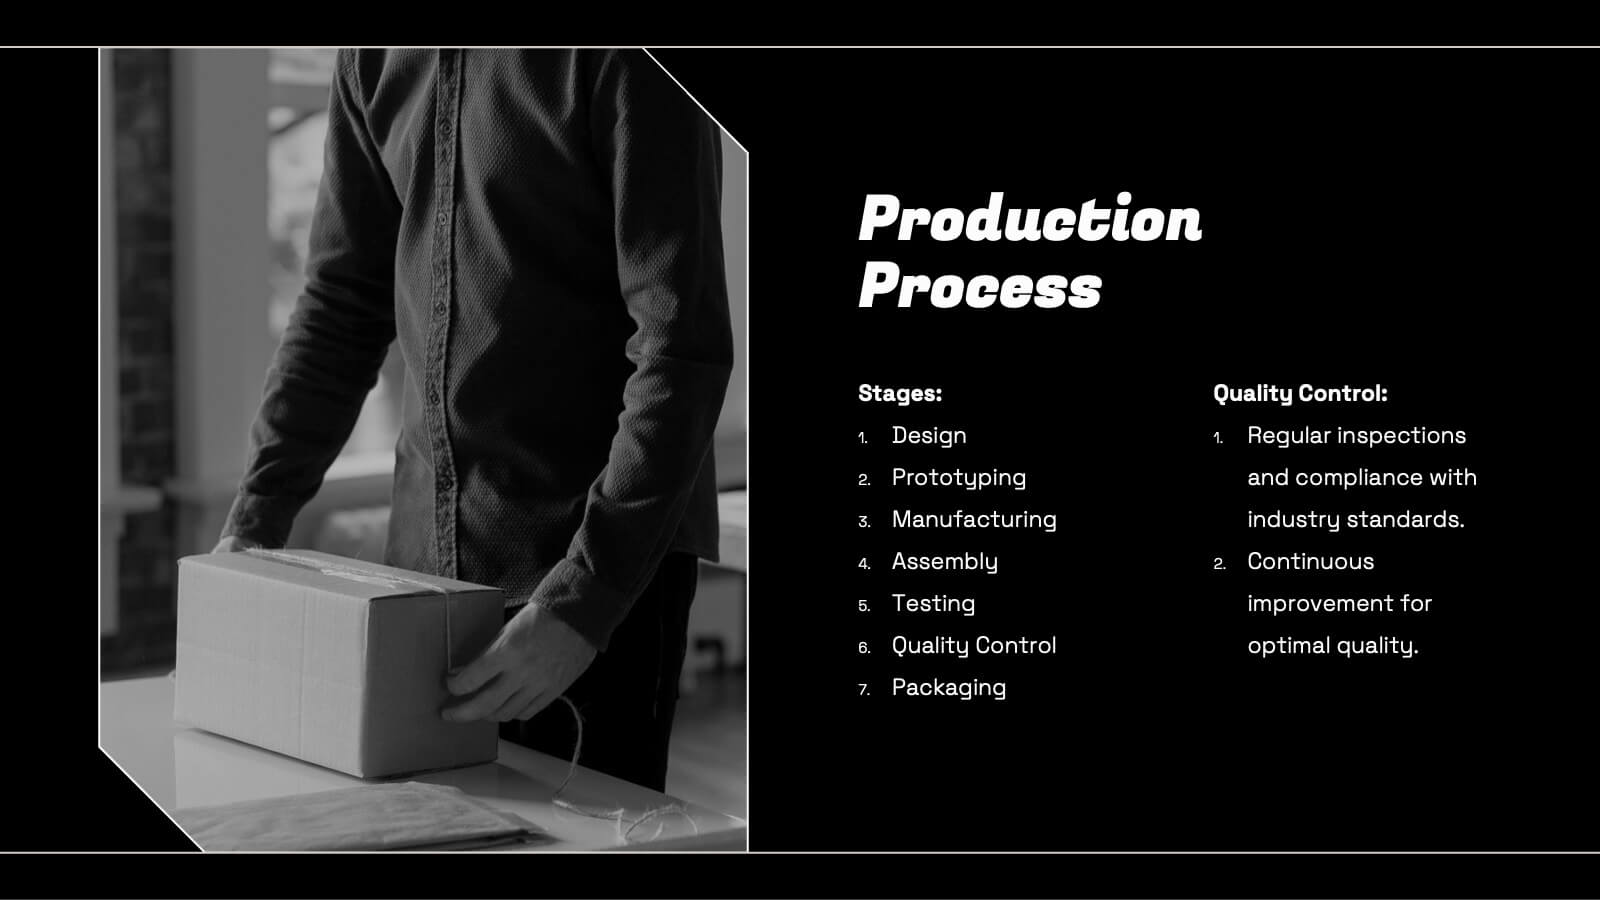
Smart Light Product Presentation
Enhance your product presentations with this Smart Lighting template. Designed for clarity and aesthetic appeal, it includes slides detailing product features, market analysis, technical specifications, and pricing strategies. Ideal for tech products, it's compatible with PowerPoint, Keynote, and Google Slides, ensuring broad accessibility and ease of use.


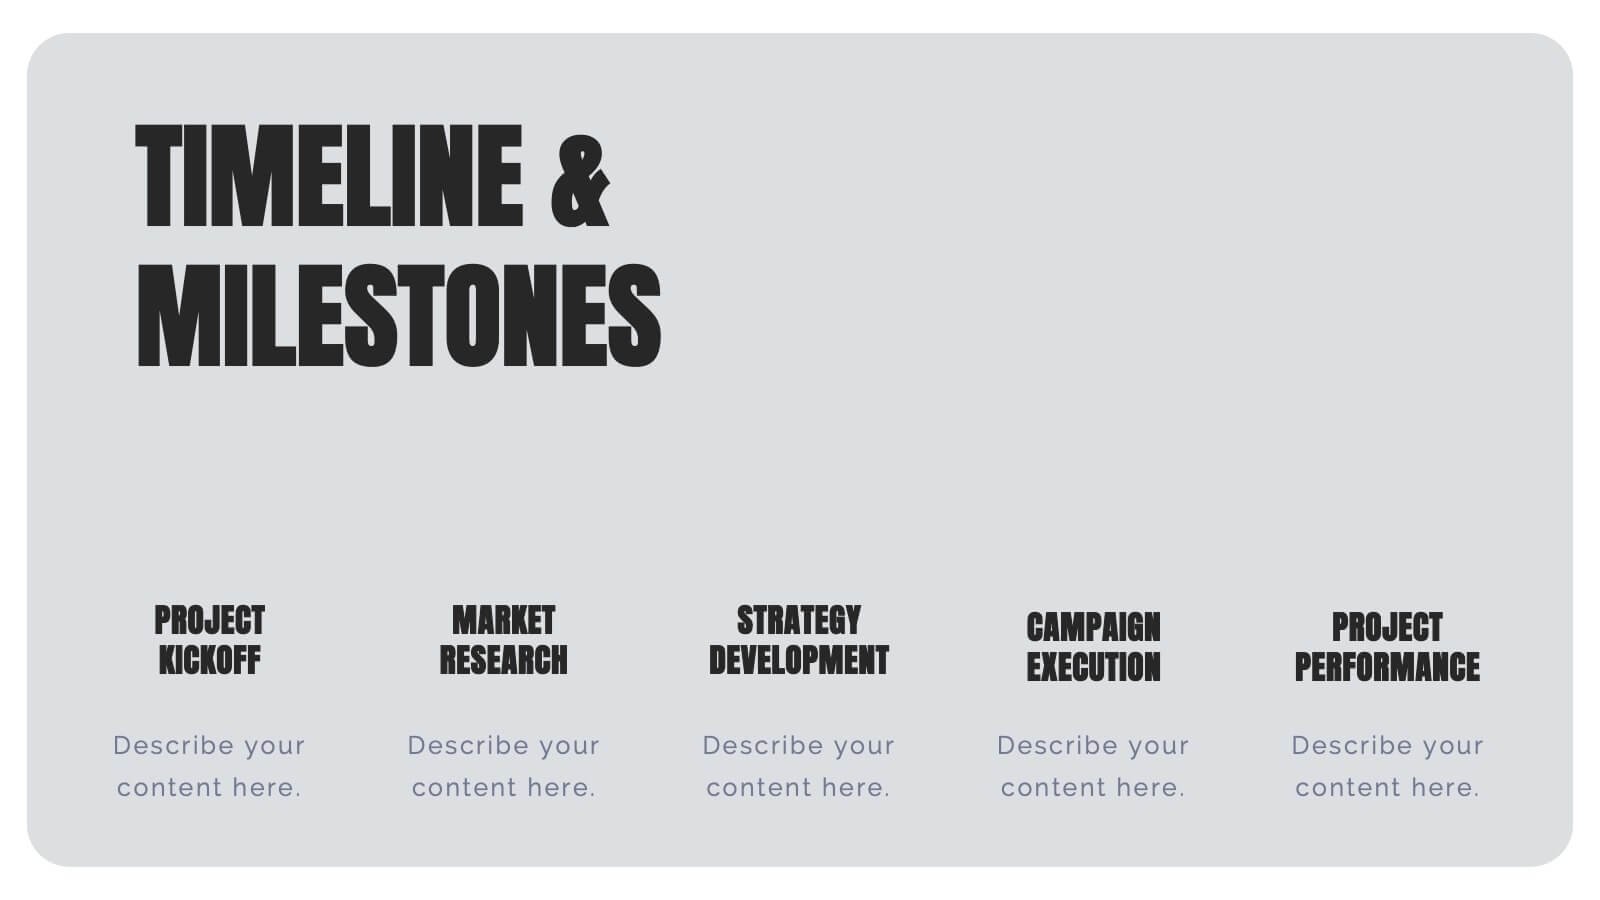
7 diapositivas
Creative Timeline Infographic Presentation Template
A Timeline is an essential tool to illustrate the chronology of events; it also provides a method for organizing and summarizing material. With the timelines provided in this template you will be able to visualize the passage of time, so that you can better understand how influences from the past still impact your life today. This template is designed to assist you with crafting your timeline so that it can be easily understood. The color-coding makes it easy to see daily progress. Use the timelines in this template to create useful visualization, and convey the growth of your business or brand.


4 diapositivas
IT Network Infrastructure Presentation
Optimize your IT infrastructure with this IT Network Infrastructure template. Designed with a cloud-based network architecture layout, this slide helps illustrate data flow, system components, and key IT connections in a structured format. Perfect for IT professionals, network engineers, and tech strategists, this fully customizable slide works seamlessly with PowerPoint, Keynote, and Google Slides.


8 diapositivas
Social Media Engagement Report Presentation
Deliver impactful campaign reviews with the Social Media Engagement Report Presentation. This dynamic layout uses a megaphone visual to amplify your messaging and organize engagement data into four key segments. Perfect for tracking audience reactions, measuring reach, or presenting content performance. Compatible with PowerPoint, Keynote, and Google Slides for seamless customization.


7 diapositivas
Cloud Infographic Presentation Template
This Cloud infographic, is a versatile and professional template designed for corporate presentations. This is perfect for businesses and organizations in the technology and IT field, as well as any company looking to showcase their data and information in a visually appealing way. This template features a corporate style with a blue theme, which gives it a professional look and feel. The slides are filled with icons, and other visual elements that will help you communicate your message in an effective way. This template has everything you need to create an engaging and informative presentation.


7 diapositivas
Investment Infographic Presentation Template
This Investment Infographic template is a professionally designed presentation made to present your ideas in an easy to understand format. This template features a professional design, easy color customization and a number of other useful elements to help you create an amazing infographic. This template is designed to include a variety of charts and graphs to visually demonstrate key points, and incorporates animated elements that make it more interesting for the viewer. This is the perfect presentation to introduce your company's investment portfolio to potential investors.


6 diapositivas
Project Gantt Chart Presentation
This Project Gantt Chart Presentation helps visualize your project timeline with clarity. Featuring six tasks, weekly progress bars, and colorful icons, it’s ideal for tracking milestones. Fully customizable and easy to edit, this slide works seamlessly in PowerPoint, Keynote, and Google Slides for organized, professional project management presentations.


30 diapositivas
Fusoria Brand Guidelines Proposal Presentation
Build a strong and cohesive brand identity with this sleek and professional brand guidelines proposal presentation. Covering essential topics like typography, color palettes, visual direction, and branding principles, this template helps you define and communicate your brand’s essence. Fully customizable and compatible with PowerPoint, Keynote, and Google Slides for a seamless presentation experience.


6 diapositivas
Side-by-Side Comparison Slide Presentation
Bring your ideas to life with a bold, flowing layout that makes comparing two options feel effortless and visually engaging. This presentation helps you break down differences, highlight strengths, and guide viewers toward clear conclusions using a clean, modern design. Fully compatible with PowerPoint, Keynote, and Google Slides.


23 diapositivas
Ignifis Investor Pitch Presentation
Capture investor interest with this dynamic and professional pitch deck presentation template. It includes essential slides such as company overview, problem statement, revenue model, competitive landscape, financials, and growth projections. Designed for clarity and impact, it's fully customizable and perfect for securing funding. Compatible with PowerPoint, Keynote, and Google Slides.


23 diapositivas
Cloudrift UX Case Study Presentation
Present a comprehensive and visually engaging UX Case Study with this dynamic and modern template. Begin with an introduction to the design challenge, followed by detailed slides for project overviews, user research, and persona development. Highlight the user journey mapping, information architecture, and wireframing process to showcase your structured approach to solving design problems. This template offers dedicated sections for prototyping, user testing, and feedback iterations, ensuring every stage of your process is documented. Dive into critical components like interaction design, responsive design, and accessibility considerations, demonstrating your commitment to delivering user-centric solutions. Conclude with a project showcase that highlights the final product and its impact. Fully customizable and compatible with PowerPoint, Google Slides, and Keynote, this template is perfect for presenting your UX design insights with clarity and professionalism.


5 diapositivas
Strategic Blue Ocean Shift Presentation
Dive into bold new thinking with a slide that makes strategic transformation feel clear, focused, and actionable. This presentation breaks down key decisions that help teams shift from competitive pressure to value innovation, making complex choices easy to visualize and present. Fully compatible with PowerPoint, Keynote, and Google Slides.


19 diapositivas
Fableia Marketing Research Report Presentation
Deliver data-driven insights with a professional and visually engaging marketing research report presentation. This template is tailored for marketing professionals, agencies, and businesses looking to showcase research findings with precision and clarity. Highlight key sections such as market trends, consumer behavior analysis, and campaign performance using dynamic visuals and well-structured layouts. Share your insights on emerging technologies, social media strategies, and customer targeting with easy-to-edit graphs, charts, and infographics. Use dedicated slides for SEO analytics, value propositions, and recommendations to present actionable strategies that resonate with your audience. This template is fully customizable and works seamlessly with PowerPoint, Google Slides, and Keynote, ensuring you can adapt it to your unique needs. Present your research with confidence and leave a lasting impact on stakeholders and decision-makers.