


Características


¿Tienes alguna pregunta?
Recomendar


4 diapositivas
Sales and Reach Across Asia Map Presentation
Visualize your company’s market presence with the Sales and Reach Across Asia Map Presentation. Featuring clean markers, color-coded regions, and icon-labeled highlights, this template helps you clearly showcase key sales zones, distribution channels, or growth markets across Asia. Perfect for business reviews, expansion pitches, and performance updates. Fully editable in PowerPoint, Keynote, Google Slides, and Canva.


23 diapositivas
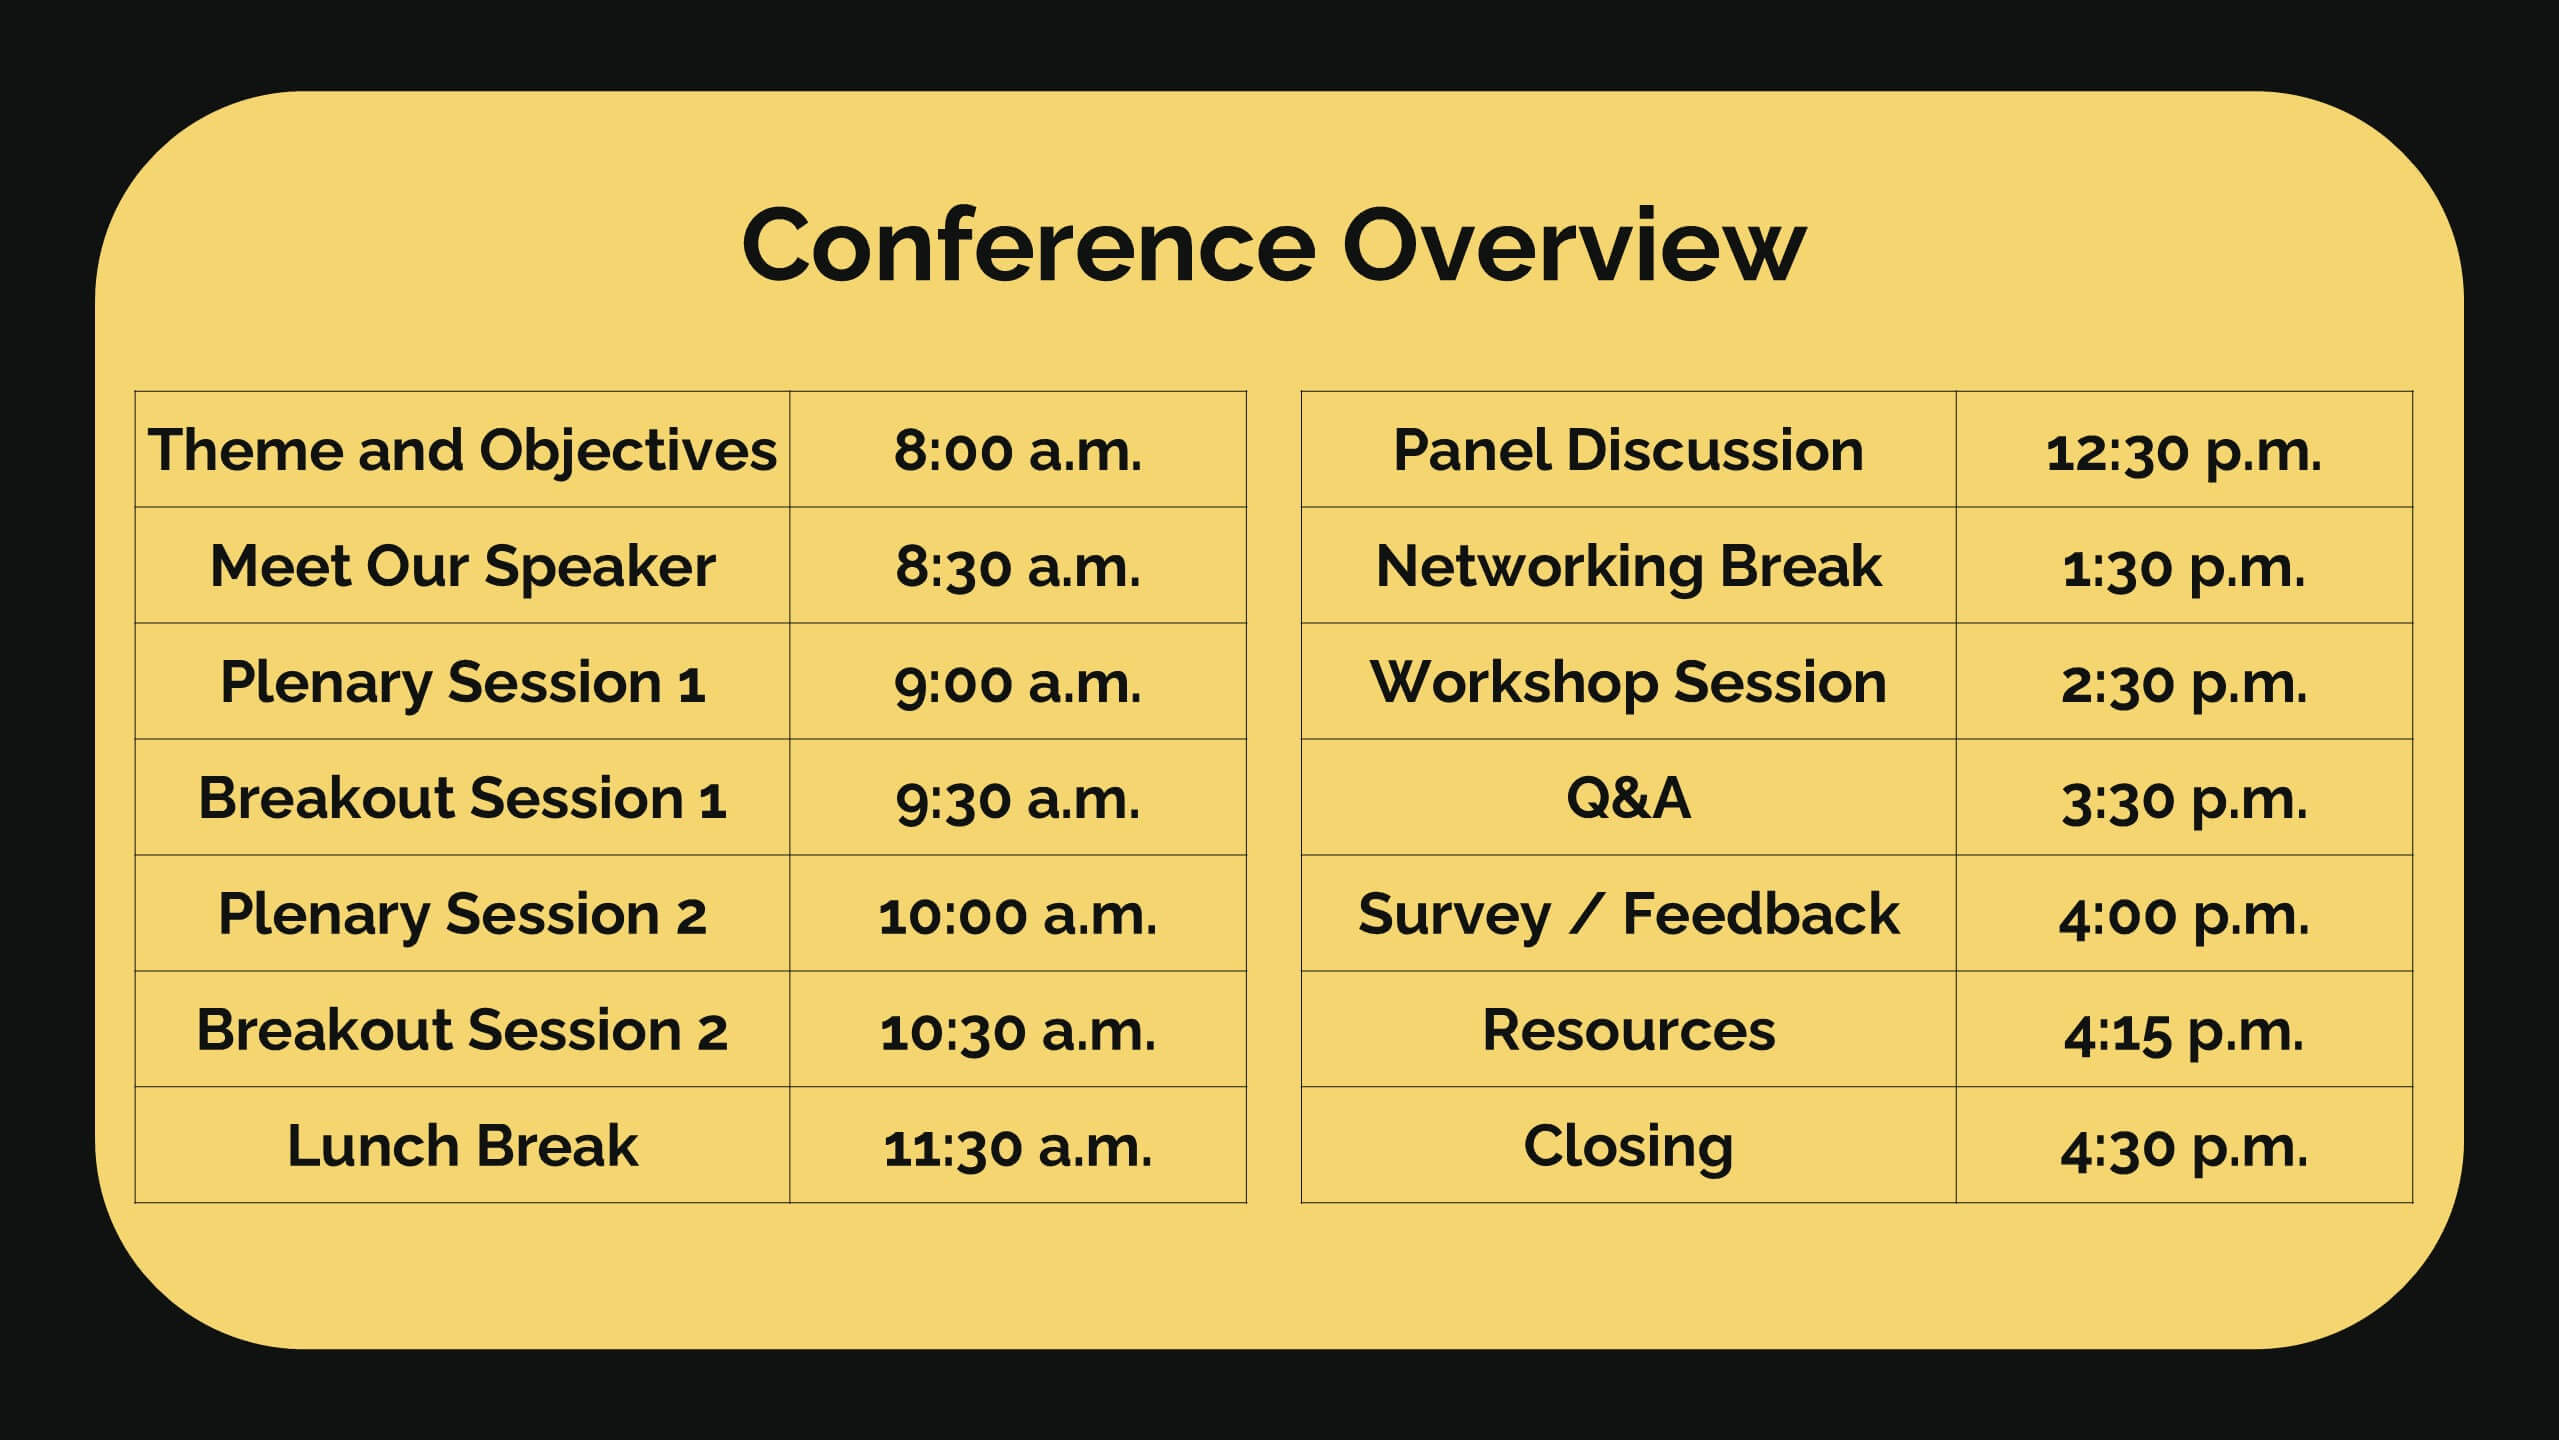
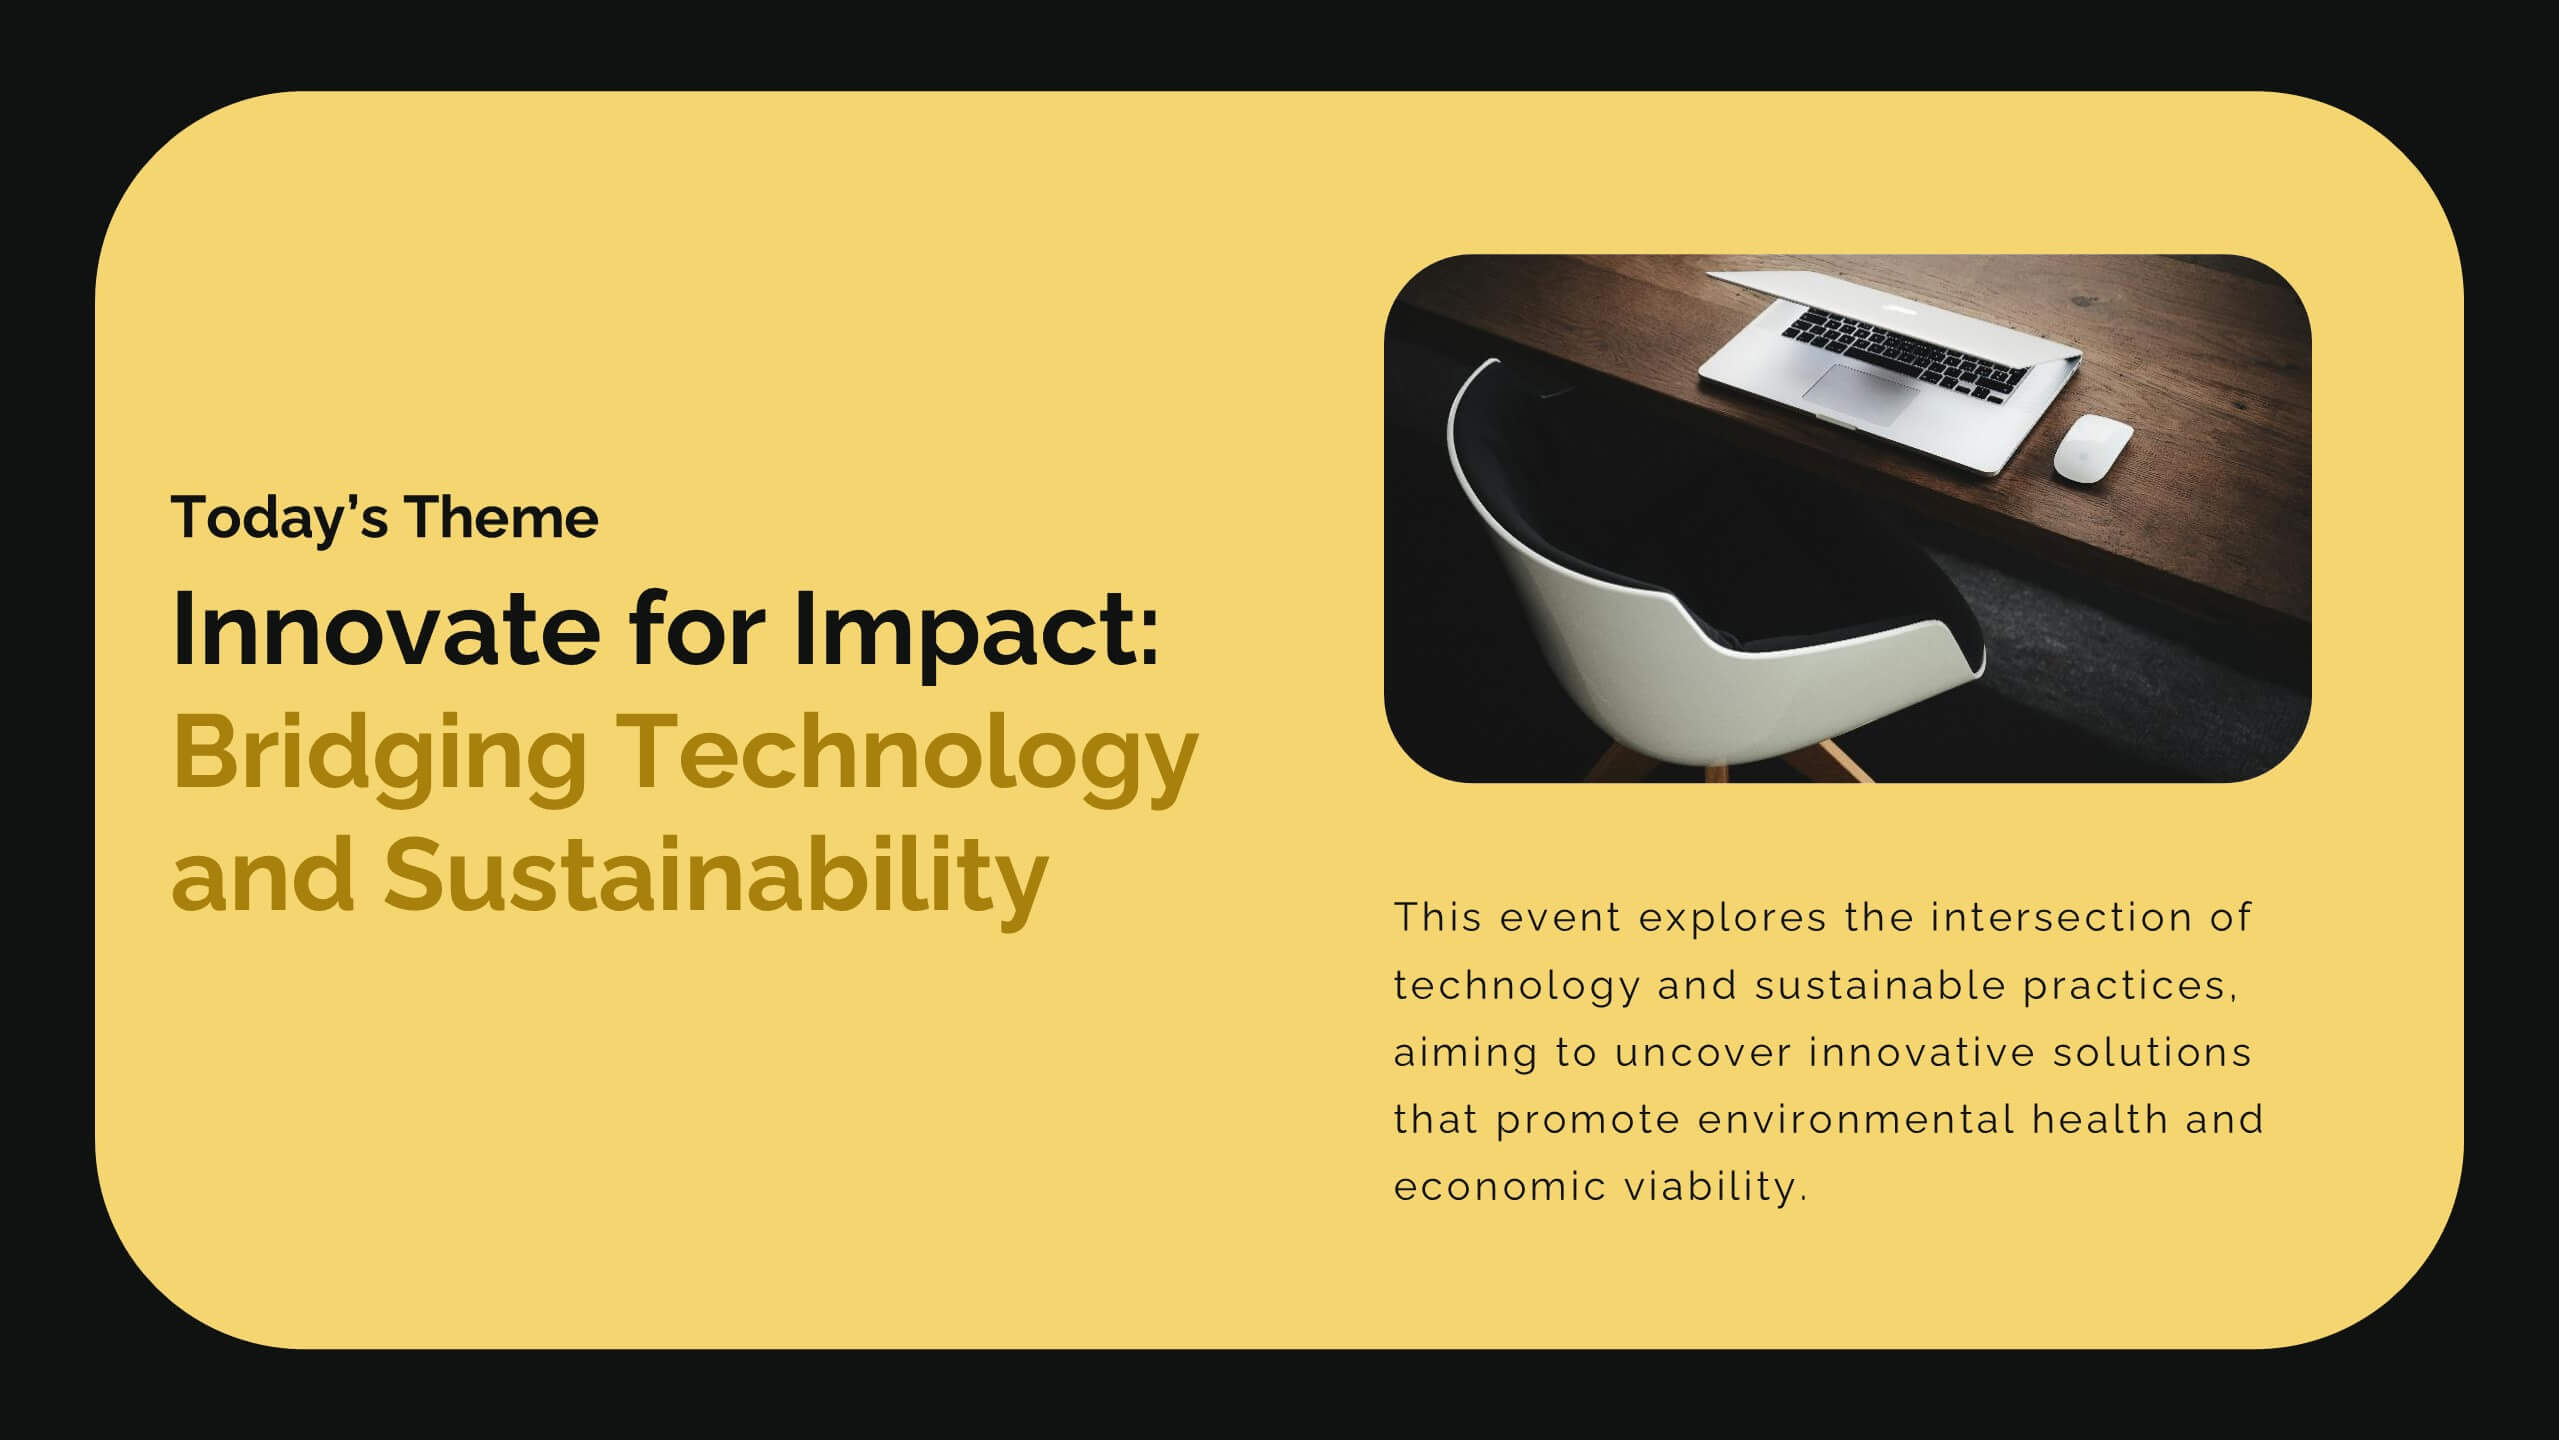
Diamond Business Development Proposal Presentation
Unlock the potential of your business proposals with this bold and engaging presentation template! Perfect for business development pitches, conferences, and workshops, it includes sections for speaker introductions, panel discussions, and session breakdowns. With its clean and professional design, this template ensures clarity and impact. Fully customizable and compatible with PowerPoint, Keynote, and Google Slides.


6 diapositivas
Blue Ocean Strategy Business Model
Capture new market spaces with this innovative Blue Ocean Strategy slide. Designed with a dynamic hourglass visual, it helps you showcase differentiation and low-cost strategies clearly. Perfect for business strategy sessions, growth planning, and innovation discussions. Fully editable in PowerPoint, Keynote, and Google Slides.


8 diapositivas
Travel Planning and Itinerary Overview Presentation
Pack your bags—this stylish template makes mapping adventures a breeze! Designed for trip overviews and itinerary planning, it includes world maps, must-see lists, weather forecasts, and schedules all in one layout. Perfect for travel agencies, bloggers, or wanderlust planners. Fully compatible with PowerPoint, Keynote, and Google Slides for easy customization.


21 diapositivas
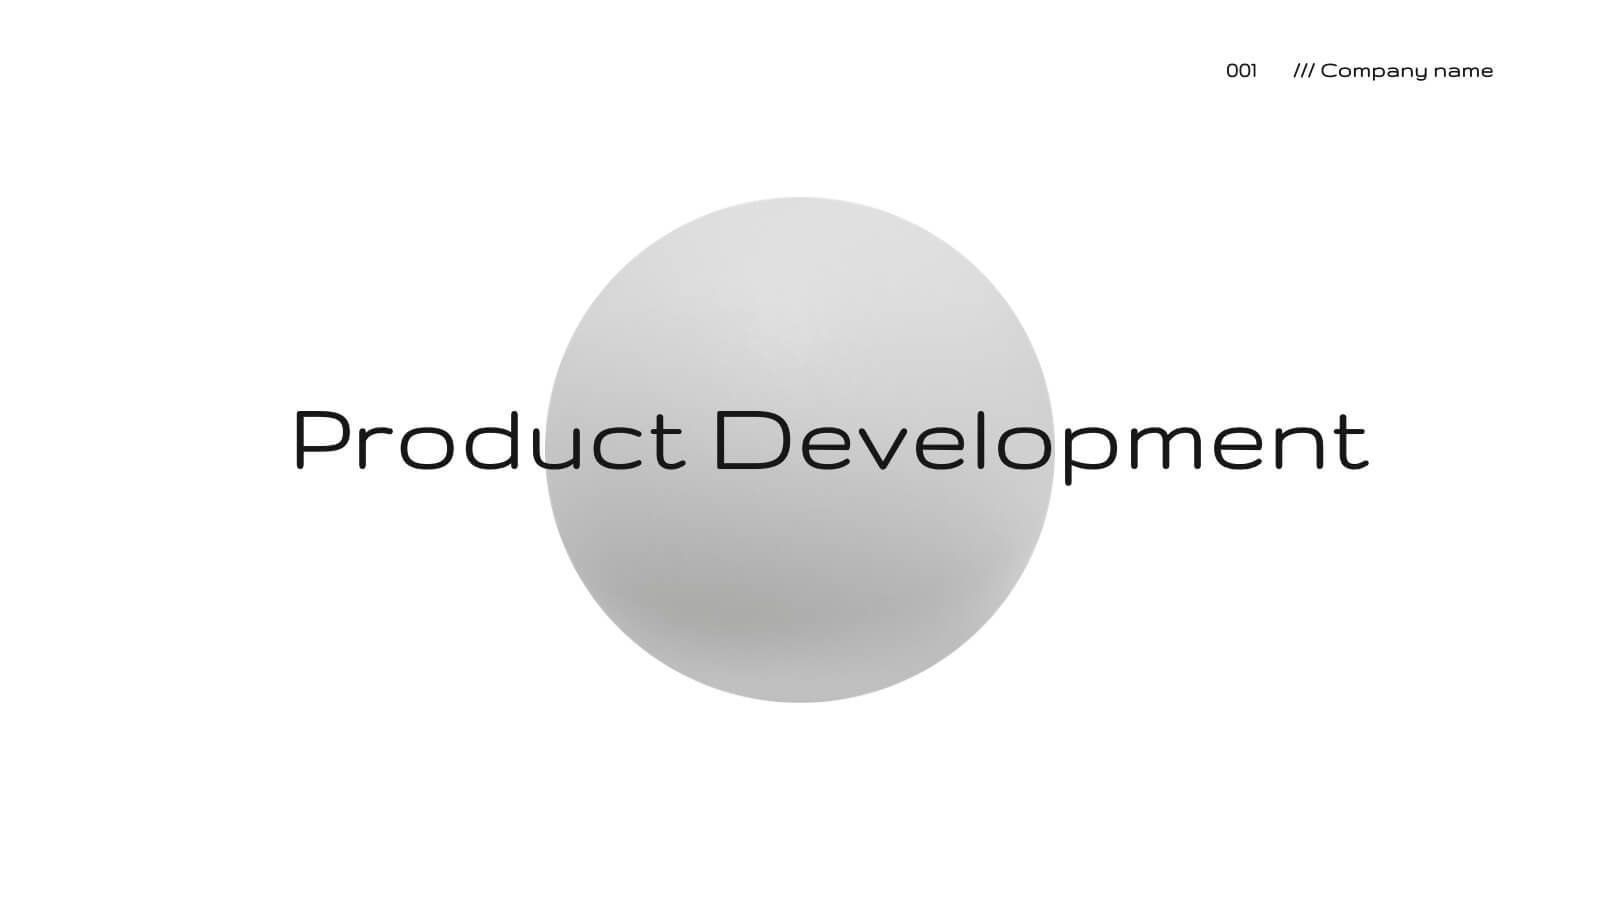
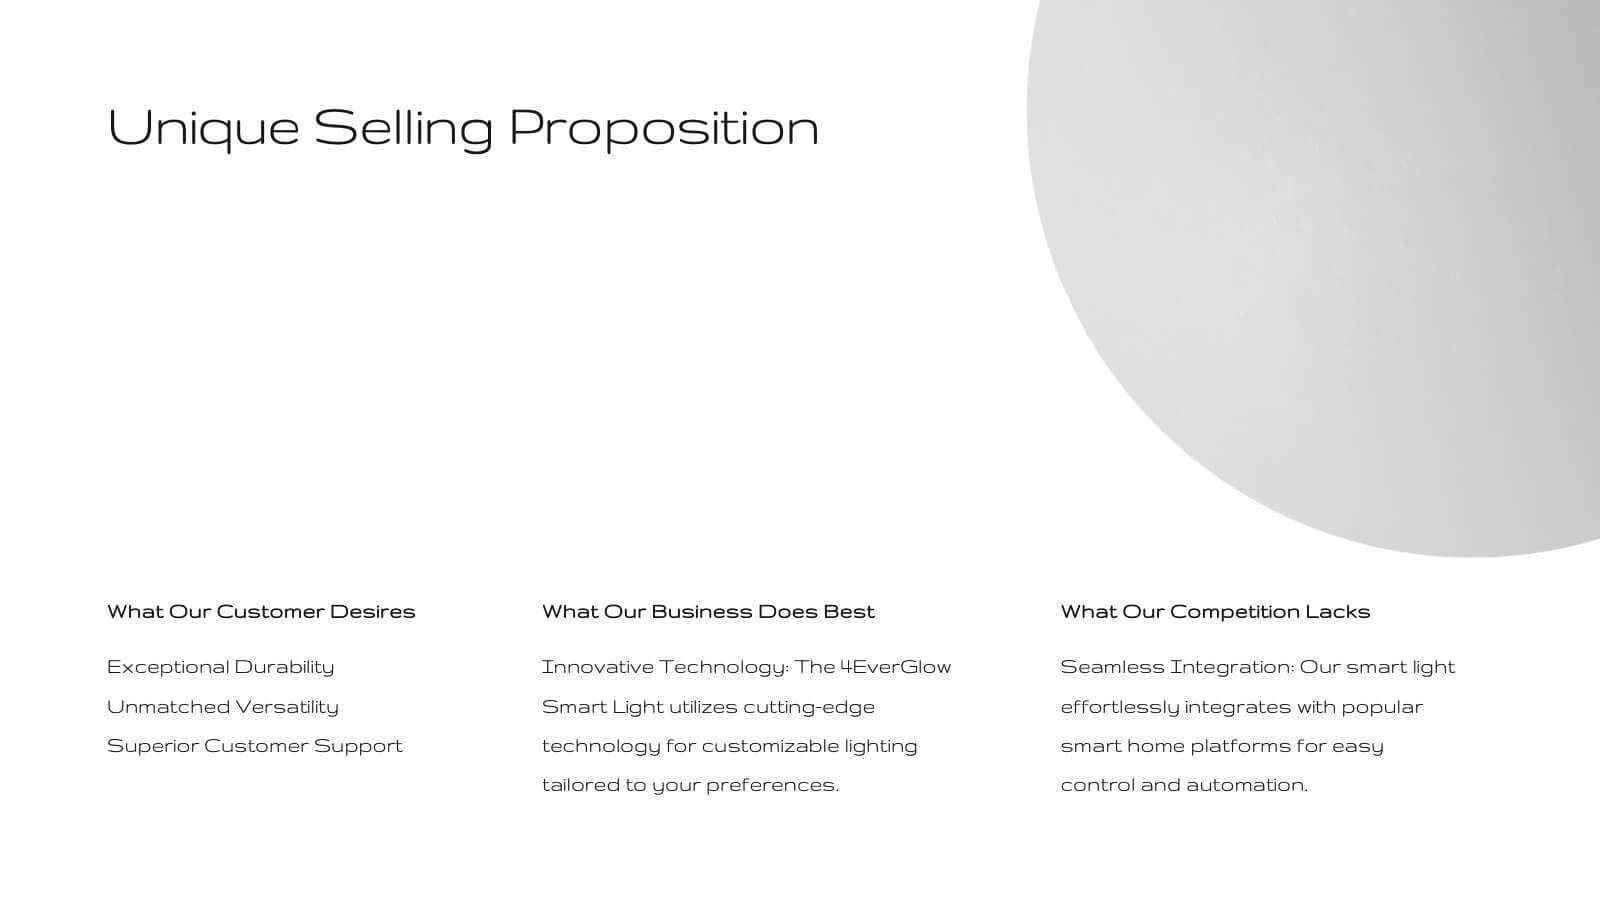
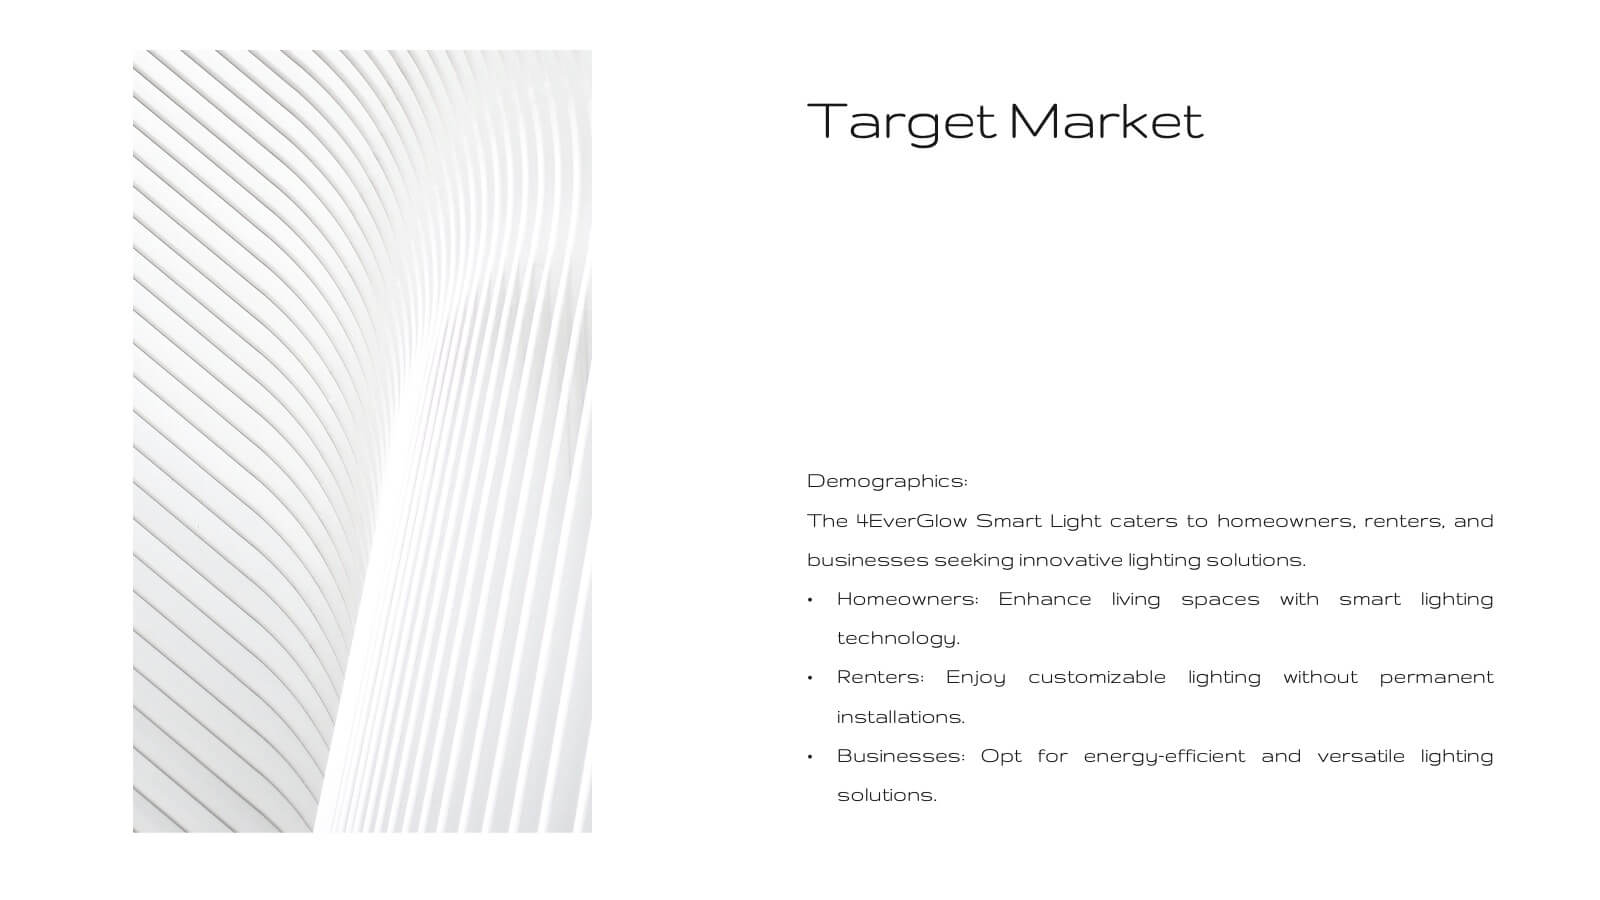
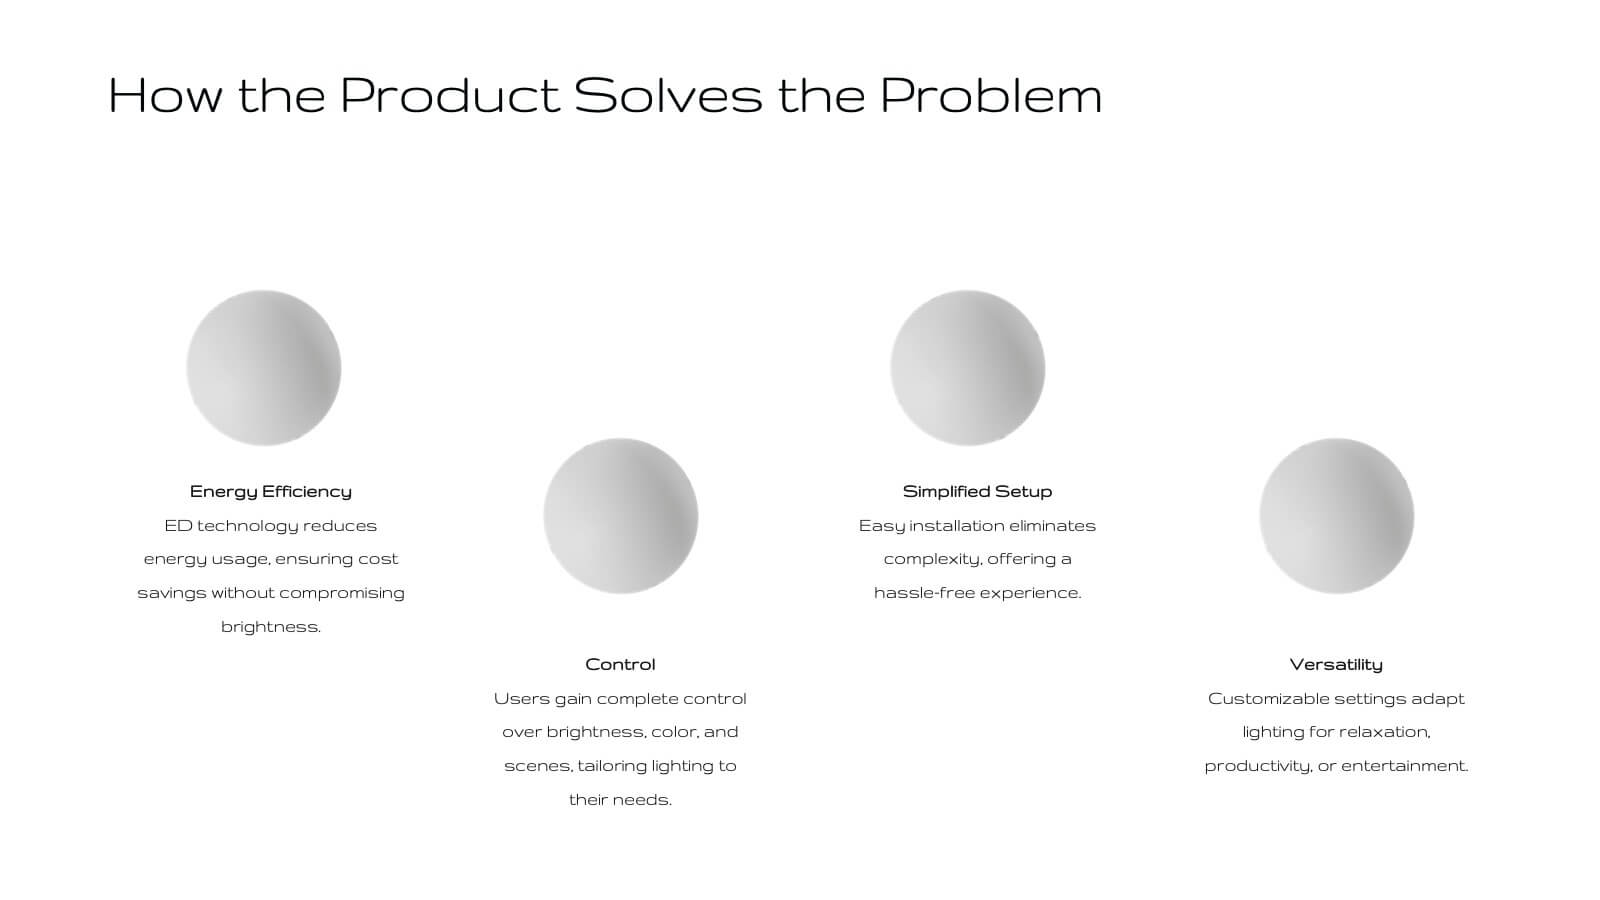
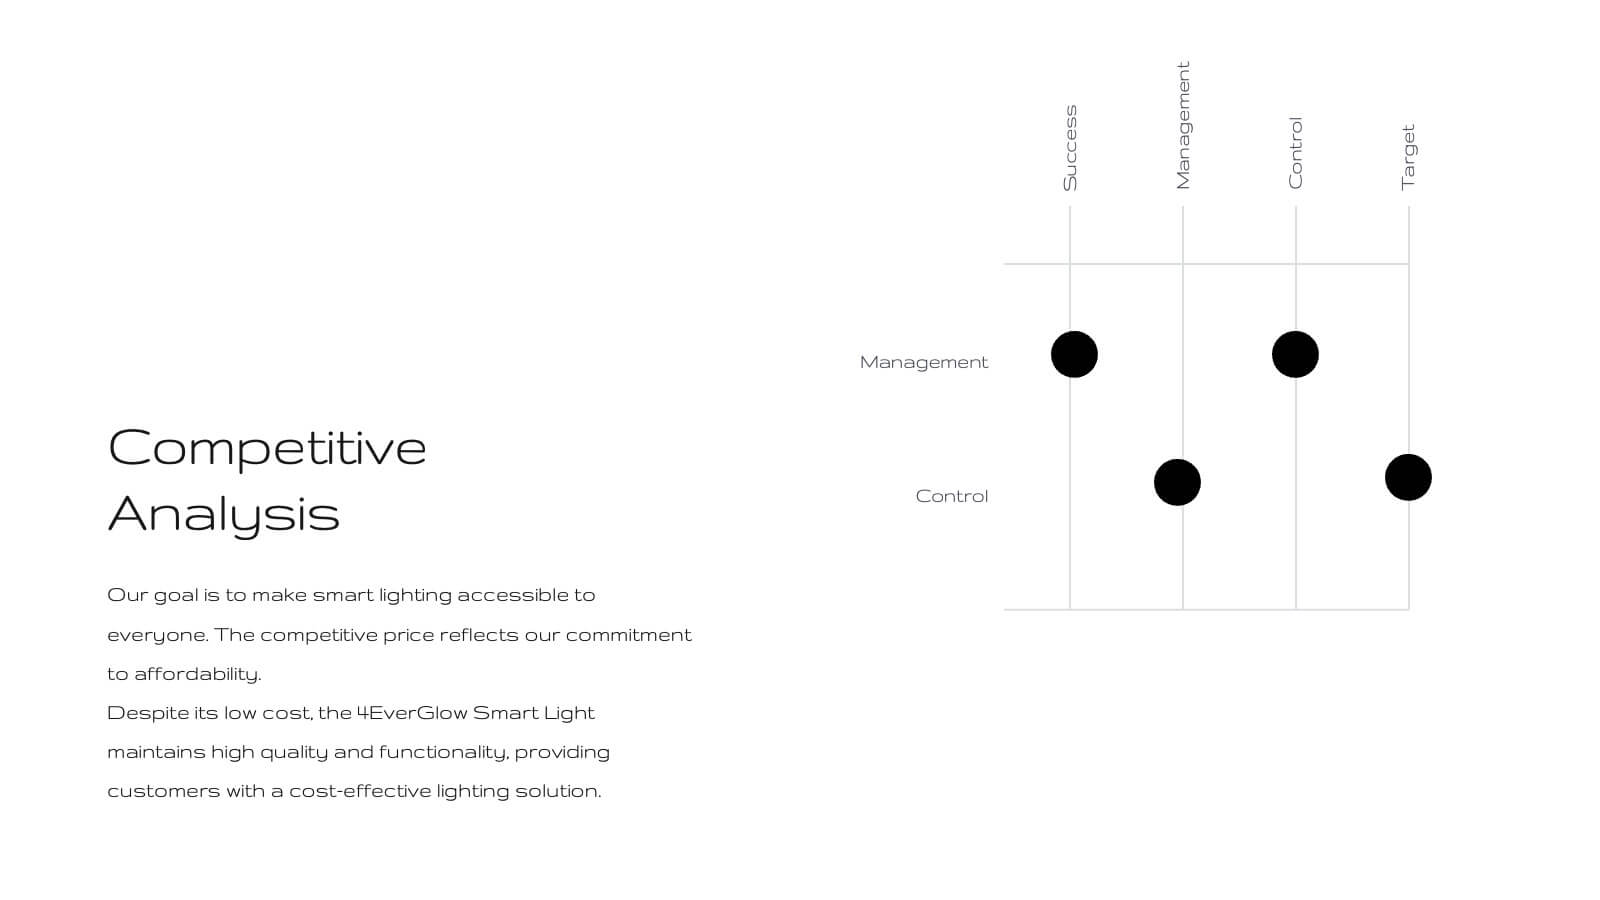
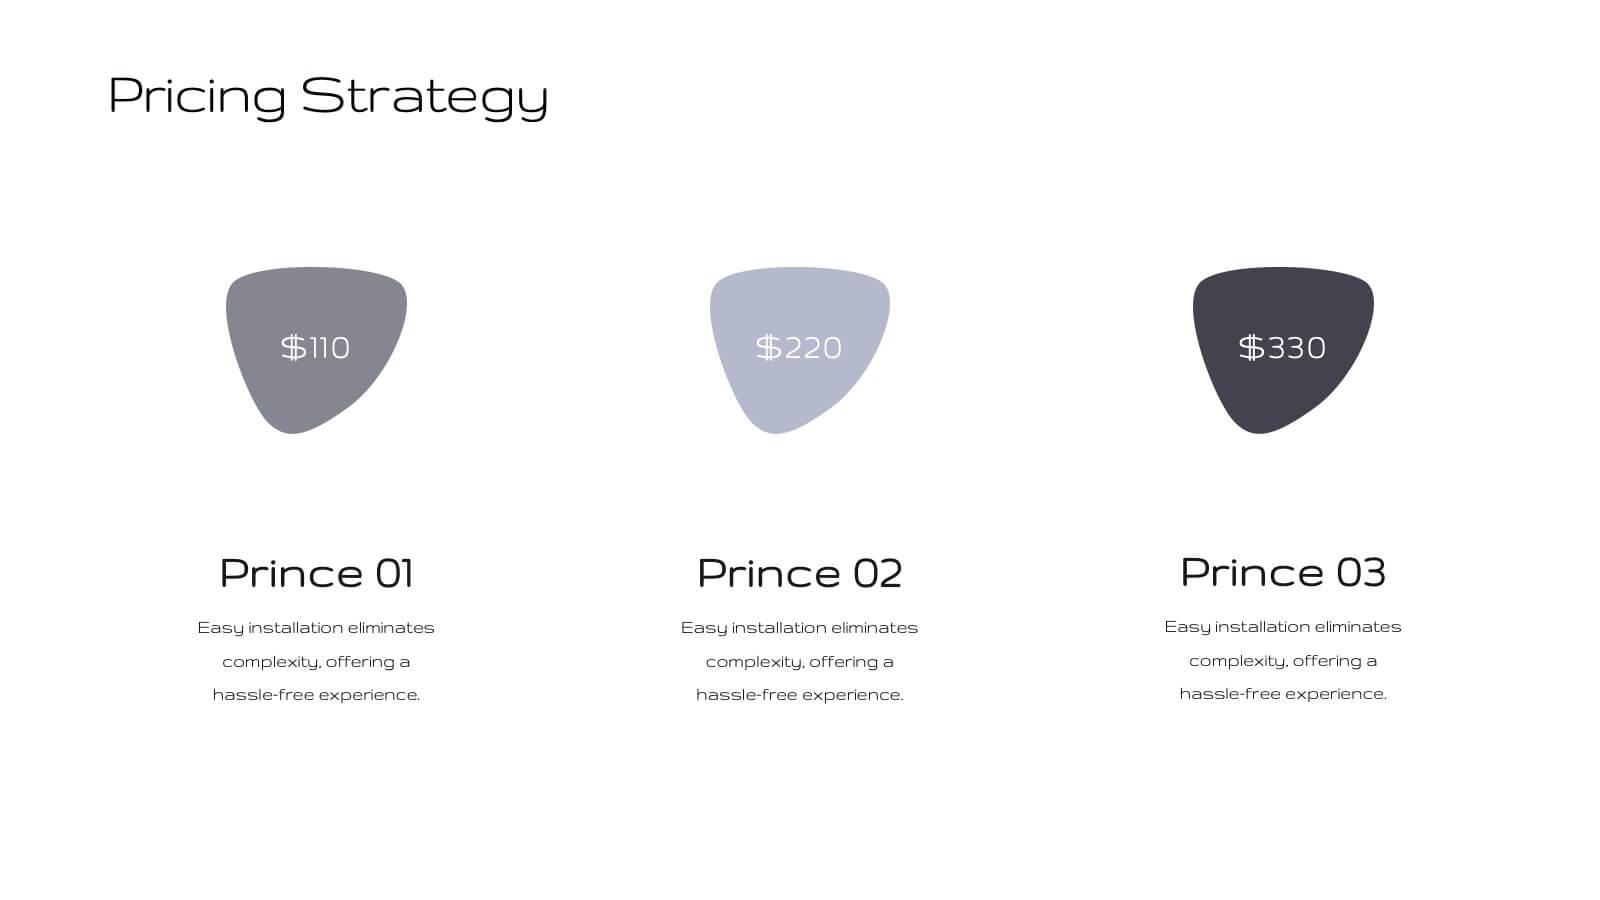
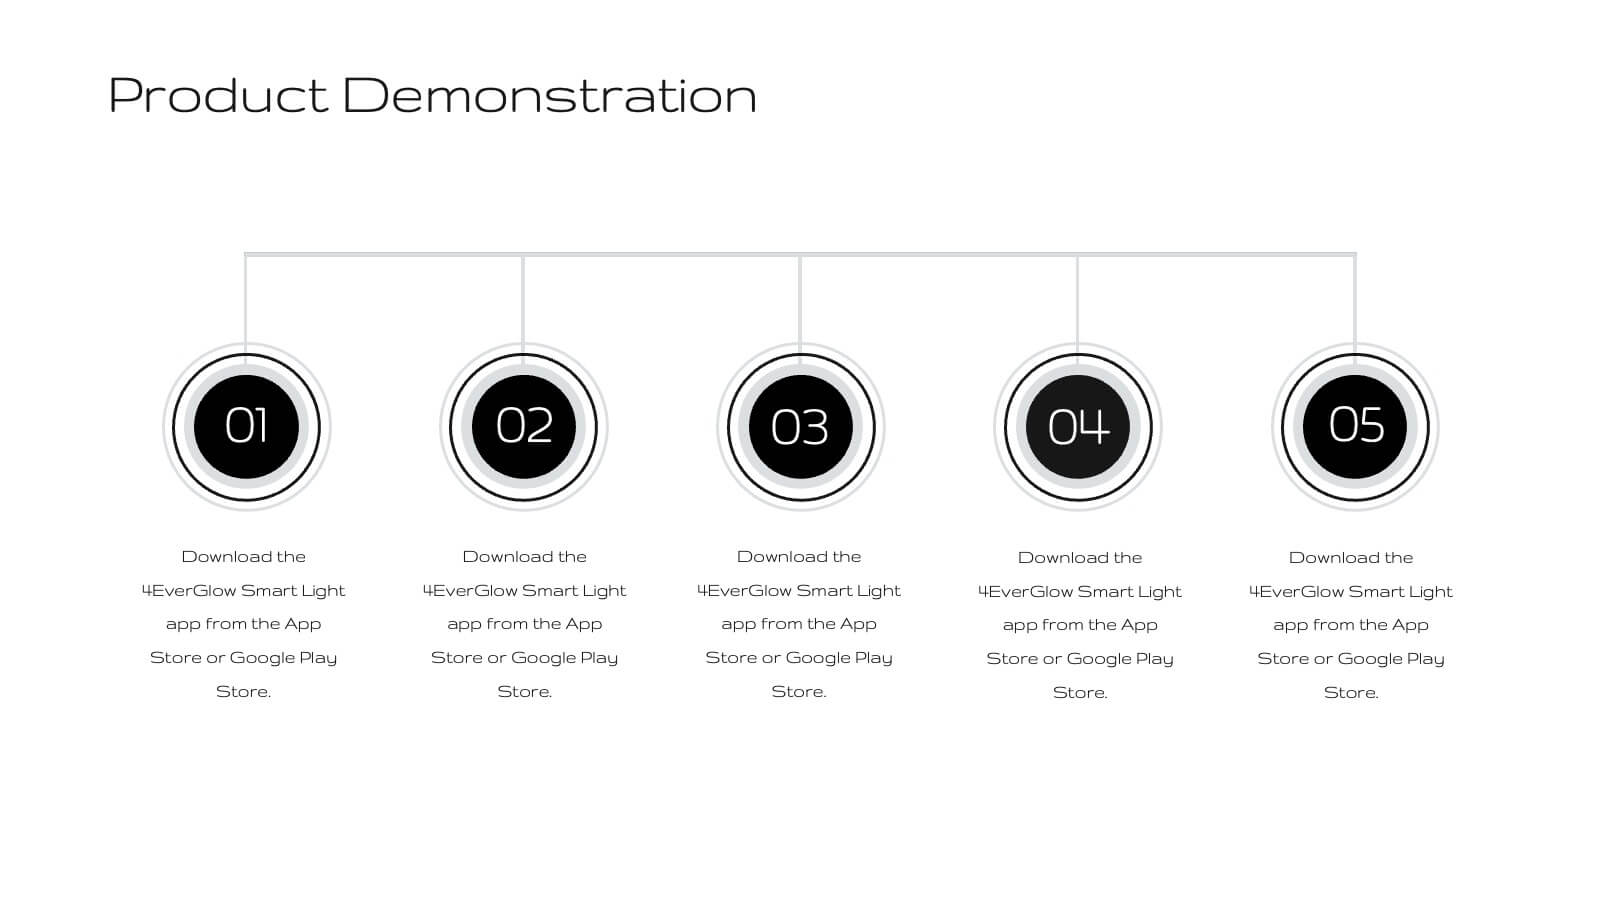
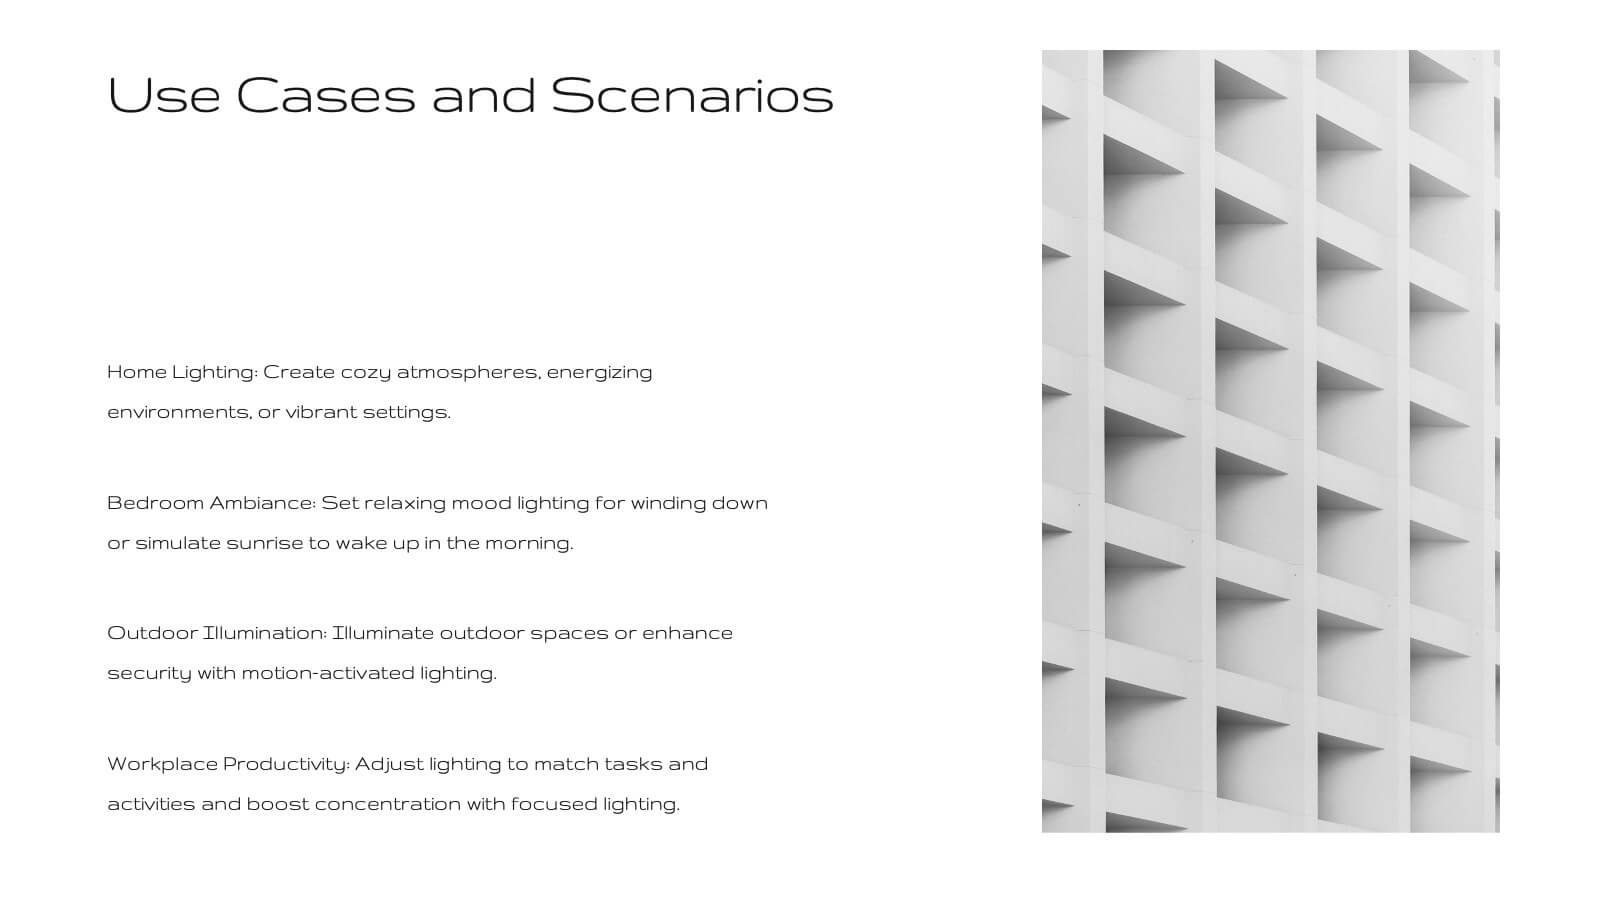
Fortuna Product Development Plan Presentation
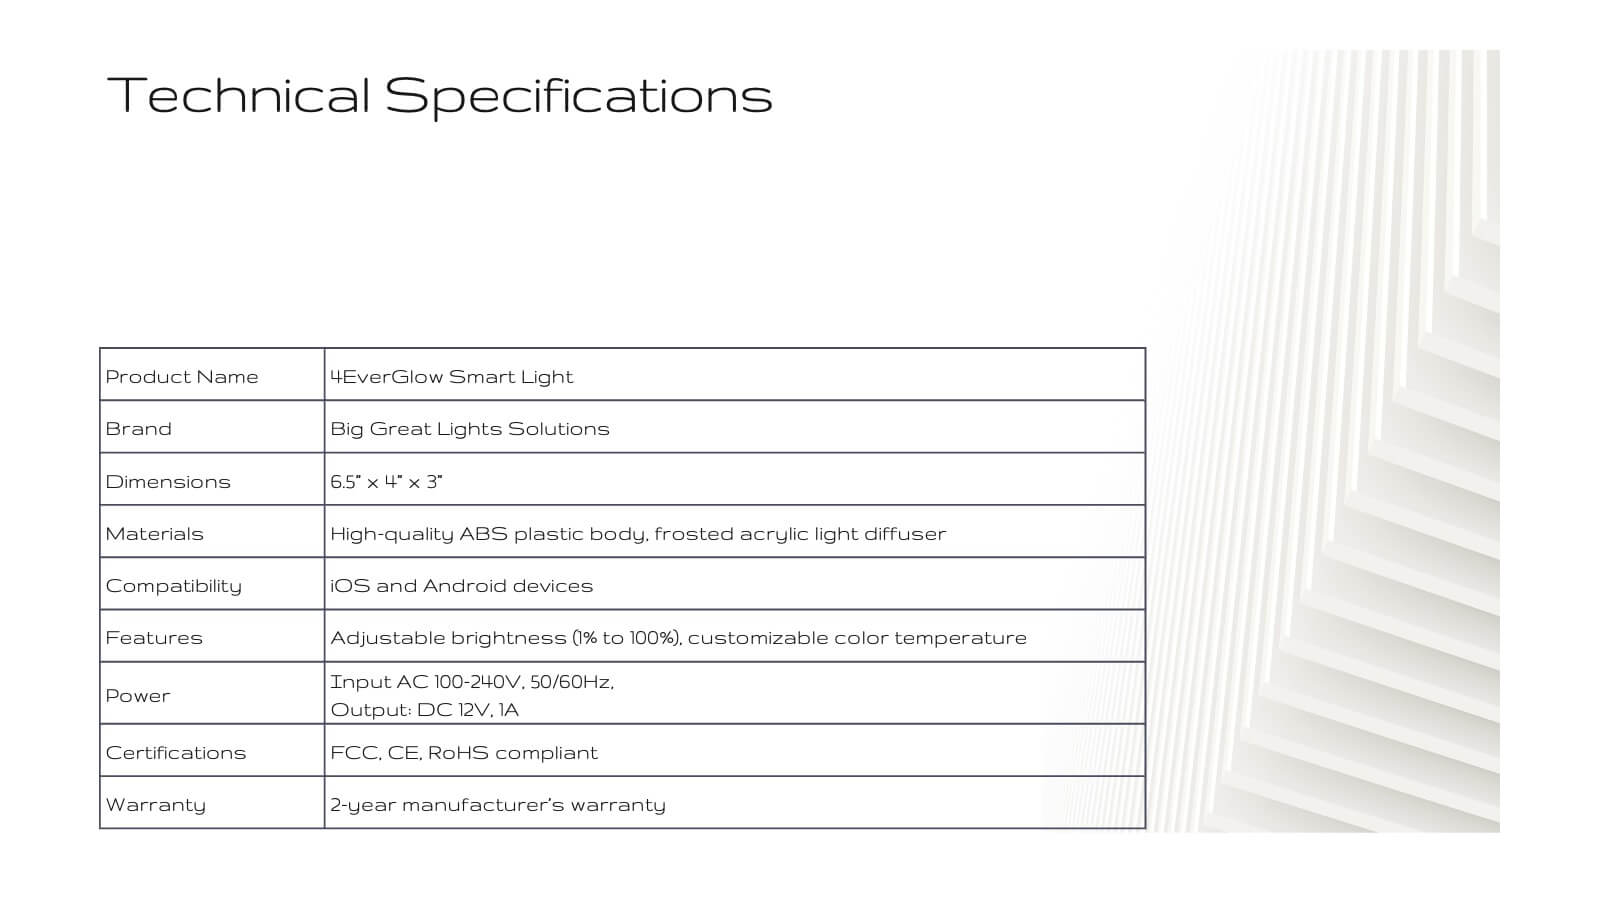
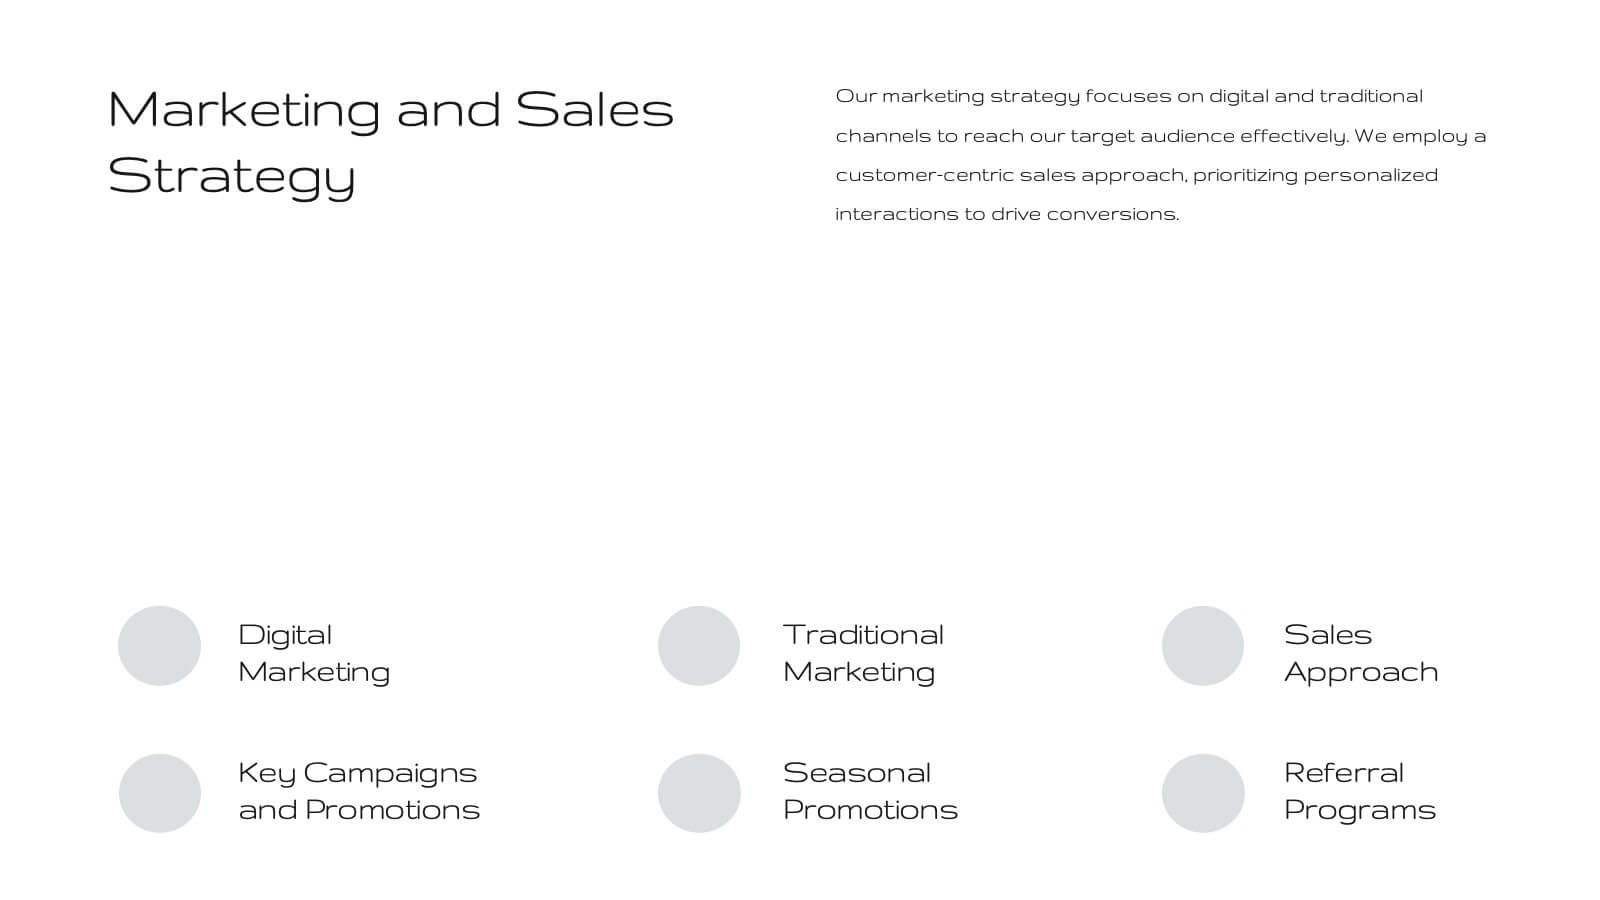
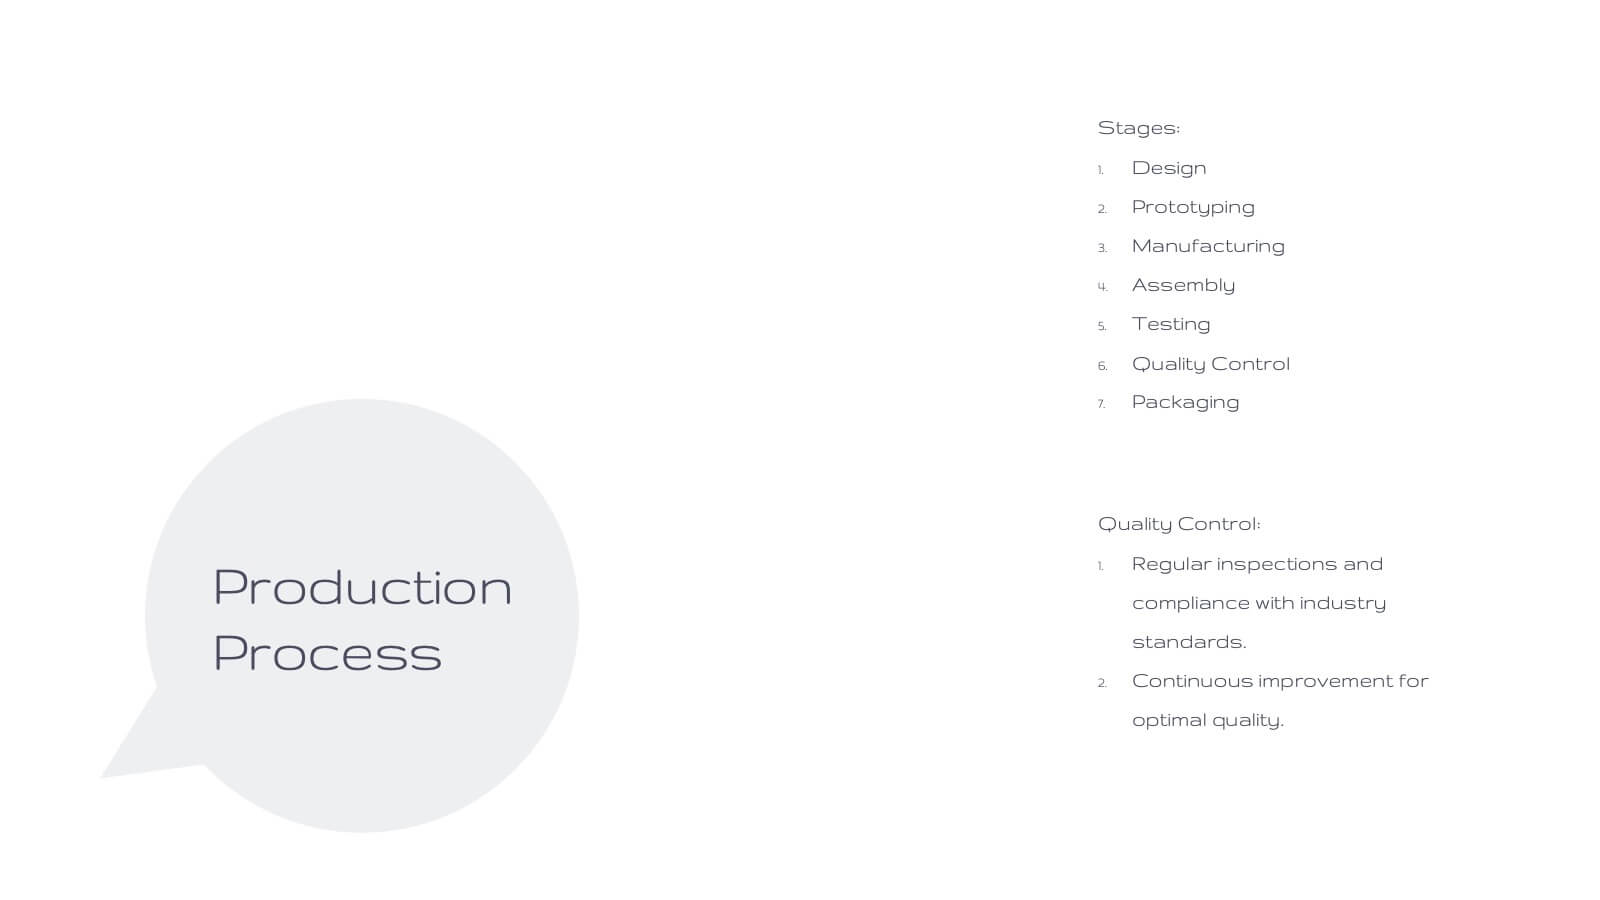
Unveil your product's potential with this elegant, minimalist presentation template. Perfect for detailing product development, features, and market strategies, it features a clean design that emphasizes clarity and professionalism. Highlight key aspects like customer pain points, competitive analysis, and pricing strategies to captivate your audience. Compatible with PowerPoint, Keynote, and Google Slides, it ensures seamless presentations on any platform.


4 diapositivas
Regional Economy Development in Oceania Map Presentation
Visualize development priorities across Oceania with this regional map template. Featuring three editable title blocks and icon-labeled highlights, it’s perfect for showcasing growth strategies, funding allocation, or policy focus areas. Fully compatible with PowerPoint, Keynote, and Google Slides for data-driven presentations in regional planning or economic development.


6 diapositivas
Governance Structure Overview Presentation
A clear, polished flow of ideas makes this slide instantly engaging, guiding viewers through each essential component with ease. This presentation explains how an organization structures oversight, responsibilities, and decision-making to ensure accountability and performance. Clean icons and balanced spacing keep everything easy to follow. Fully compatible with PowerPoint, Keynote, and Google Slides.


6 diapositivas
Public Healthcare System Strategy Presentation
Present key components of your medical or government plan with the Public Healthcare System Strategy Presentation. This clean and modern slide design uses a heart-centered layout with five surrounding icons to highlight core pillars—perfect for policy updates, strategy overviews, or health service workflows. Fully editable in Canva, PowerPoint, Keynote, and Google Slides.


5 diapositivas
Business Annual Report Summary Presentation
Clear, Concise, and Impactful! The Business Annual Report Summary Presentation template helps you present key performance indicators, financial metrics, and company growth in a professional and visually engaging way. Fully customizable and compatible with PowerPoint, Keynote, and Google Slides, it’s ideal for executives and analysts aiming for a compelling data-driven presentation.


7 diapositivas
Creative Tree Diagram Infographic
Unveil hierarchical structures or processes with our evocative tree diagram infographic. Set against a pristine white canvas and enriched with shades of trusty blue and organic green, this creative template epitomizes growth, interconnections, and systematic understanding. Embellished with crisp infographics, intuitive icons, and illustrative image placeholders, it effortlessly visualizes layered information. Perfectly tailored for Powerpoint, Keynote, or Google Slides. An indispensable resource for project managers, educators, business analysts, or any organization aiming to display branching information or decisions. Grow with clarity; let each slide branch out into a wealth of understanding.


5 diapositivas
Organizational Management Frameworks Overview Presentation
Clarify reporting lines and decision-making roles with the Organizational Management Frameworks Overview Presentation. This clean and color-coded hierarchy chart helps visualize team structure, leadership levels, or departmental breakdowns. Ideal for organizational design, onboarding, or strategic alignment discussions, each placeholder is fully customizable to reflect your company’s framework. Compatible with PowerPoint, Keynote, and Google Slides—perfect for HR professionals, managers, and consultants seeking structure and clarity.


5 diapositivas
Business Revenue and Expense Analysis Presentation
Present your financial growth and cost breakdowns with this 3D bar chart layout. Each bar is paired with clearly labeled sections to explain key revenue sources, expense categories, or profit margins. Ideal for business reviews, financial proposals, or investor reports. Fully editable in PowerPoint, Keynote, and Google Slides.


5 diapositivas
Risk and Return Investment Presentation
Navigate the high seas of finance with our captivating infographic presentation template, designed to visually break down the complex relationship between risk and return in investments. This template simplifies presenting key data points, making it ideal for financiers and investors looking to make informed decisions. Each slide is meticulously crafted to ensure clarity and impact, highlighting the balance of potential rewards against possible risks. Perfect for use in PowerPoint, Keynote, and Google Slides, this template is a must-have tool for anyone in the financial sector aiming to convey their strategy with precision and flair.


4 diapositivas
Communication Model and Channels Presentation
Illustrate how your messages move through various channels using this clean, visual communication model slide. Ideal for team briefings, marketing workflows, or internal training, it simplifies how information is shared across platforms. Fully editable in Canva, PowerPoint, and Google Slides for seamless customization to match your branding and messaging goals.


4 diapositivas
Environmental Sustainability Best Practices Presentation
Promote eco-friendly initiatives with the Environmental Sustainability Best Practices Presentation template. This clean and modern slide deck is designed to highlight sustainable business strategies, green initiatives, and environmental impact assessments. Featuring an intuitive layout with clearly defined sections, this fully editable design is ideal for corporate sustainability leaders, educators, and environmental advocates. Compatible with PowerPoint, Keynote, and Google Slides for seamless customization and presentation.


5 diapositivas
Employee Lifecycle Management Presentation
Visualize every stage of the employee journey with the Employee Lifecycle Management template. Featuring a streamlined process flow, this layout is ideal for showcasing recruitment, onboarding, development, retention, and offboarding strategies. Fully editable in Canva, PowerPoint, and Google Slides, allowing seamless customization to align with your HR goals and branding.


6 diapositivas
Problem-Solving with Design Thinking
Communicate your innovation process with clarity using the Problem-Solving with Design Thinking Presentation. This slide visualizes the six key phases of the design thinking methodology (e.g., Empathize, Define, Ideate, Prototype, Test, Implement) arranged in a dynamic hexagonal loop. Each section is color-coded and icon-labeled for easy navigation, with editable titles and space for explanatory text. Ideal for creative workshops, team brainstorming, innovation strategy, and agile process presentations. Fully editable in PowerPoint, Keynote, and Google Slides.