


Características


¿Tienes alguna pregunta?
Recomendar


7 diapositivas
Business Concept Mind Map Presentation
Visualize strategic thinking with the Business Concept Mind Map Presentation. This clear, central-diagram layout helps organize six core ideas around a business theme, making complex concepts easy to grasp. Ideal for planning, brainstorming, or presentations. Fully editable and compatible with PowerPoint, Keynote, and Google Slides for maximum flexibility.


21 diapositivas
Chrysolis Small Business Pitch Deck Presentation
Make your business stand out with a pitch deck that tells your story with clarity and confidence. Covering key elements like company policies, performance metrics, collaboration opportunities, and future projects, this presentation helps you impress stakeholders. Fully customizable and compatible with PowerPoint, Keynote, and Google Slides for a seamless pitch experience.


21 diapositivas
Kyanite Small Business Pitch Deck Presentation
Make your business pitch stand out with this vibrant and engaging presentation! Featuring sections like project overviews, team updates, performance metrics, and collaboration opportunities, it helps convey your ideas with clarity and impact. Whether for internal reviews or investor pitches, this template works seamlessly with PowerPoint, Keynote, and Google Slides.


20 diapositivas
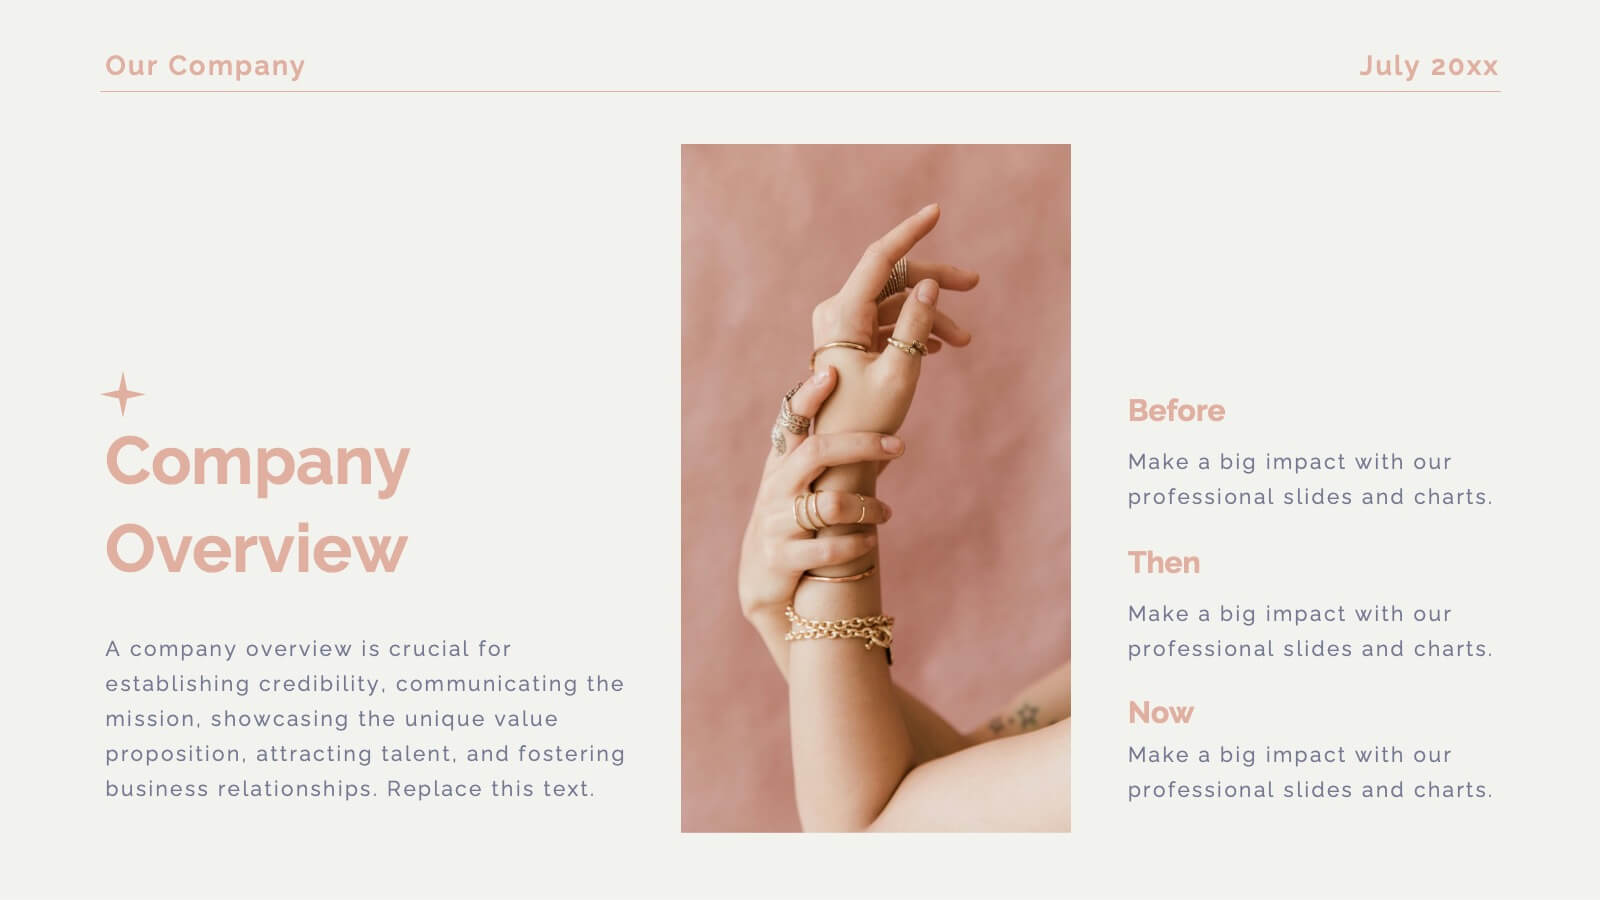
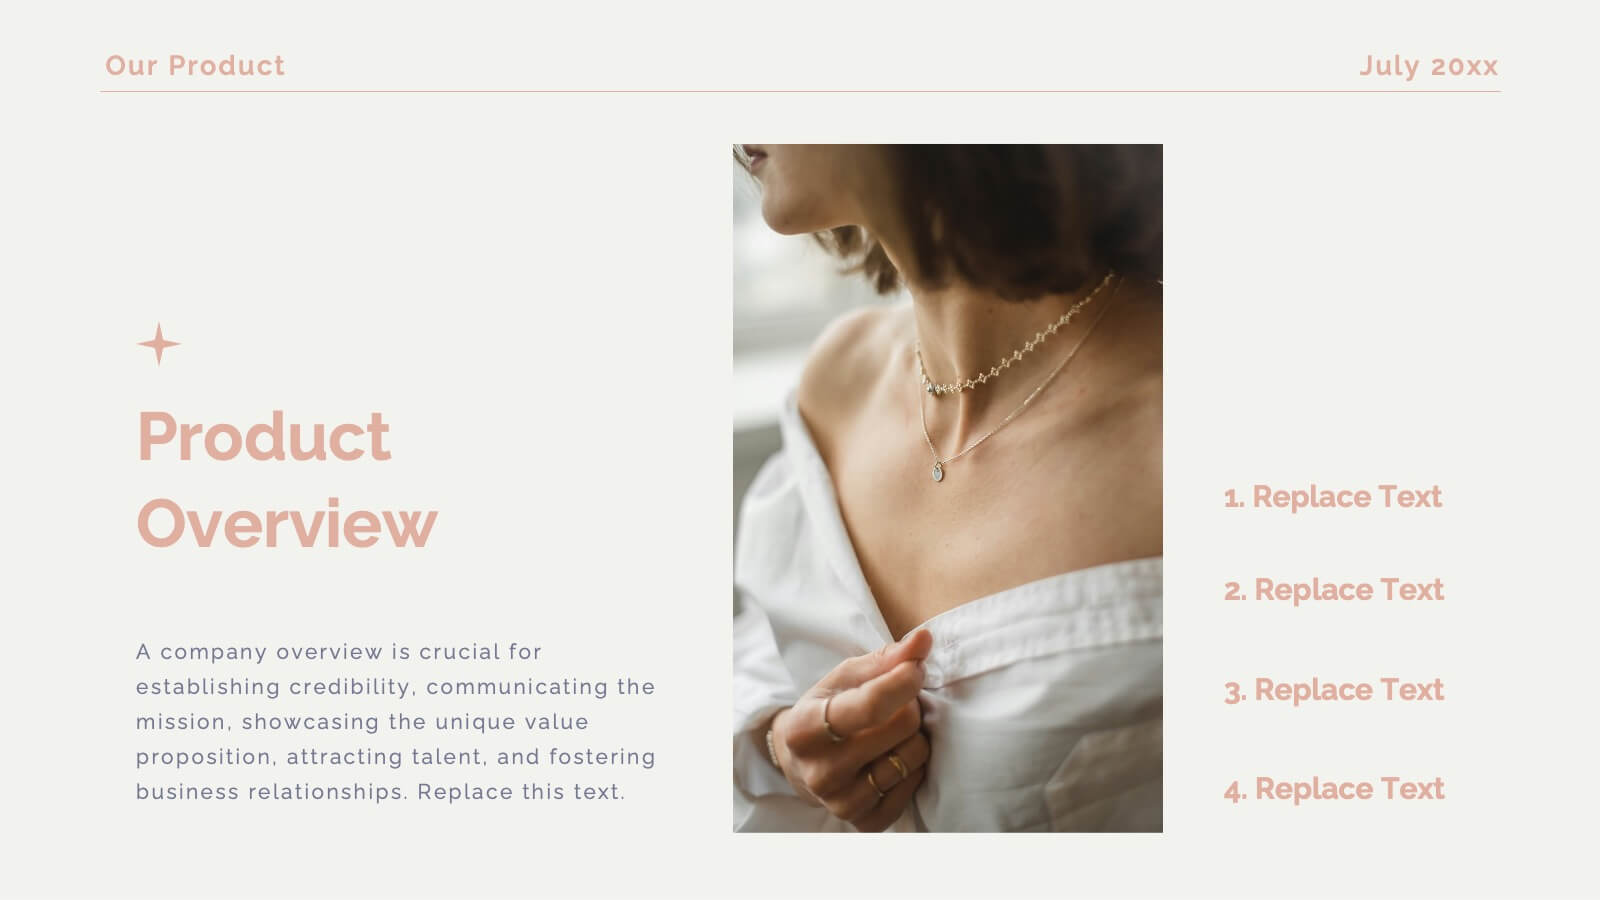
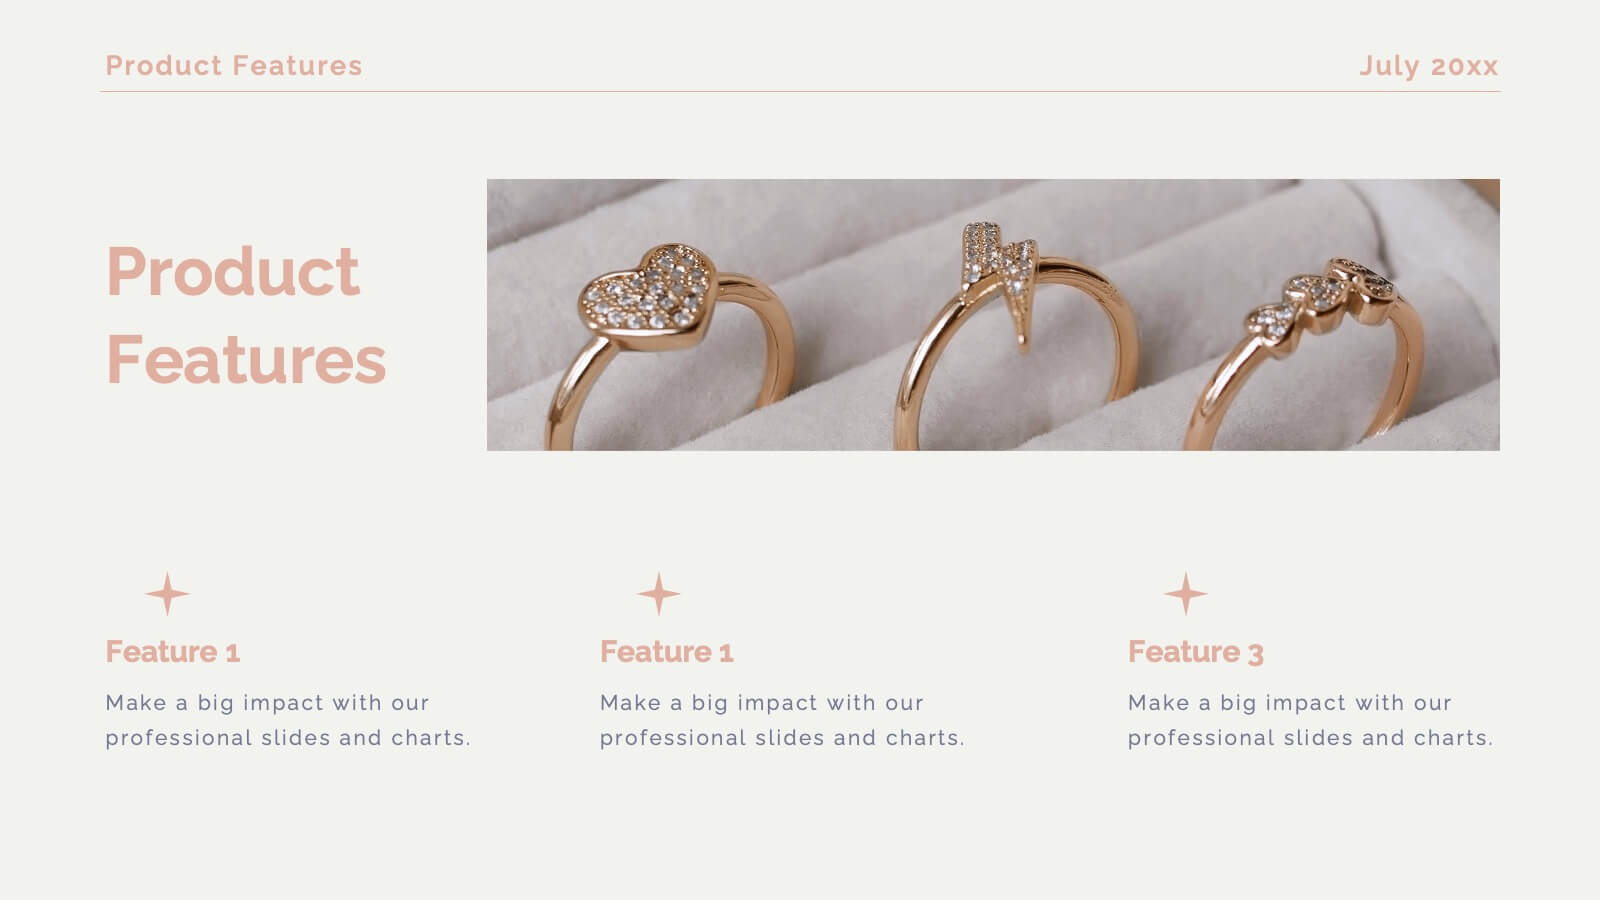
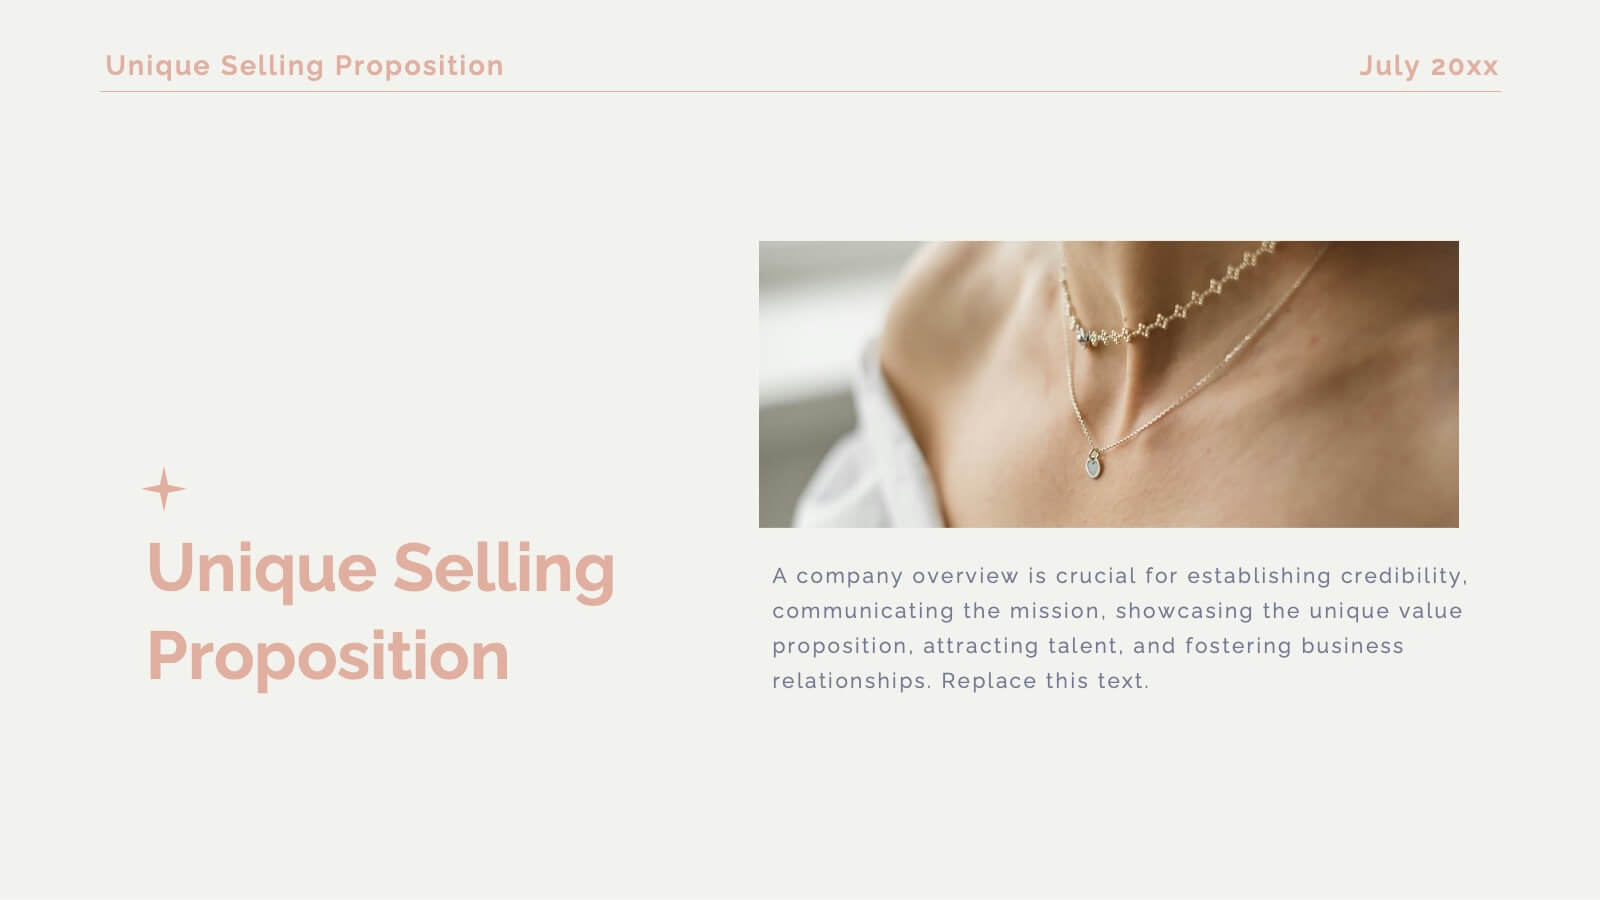
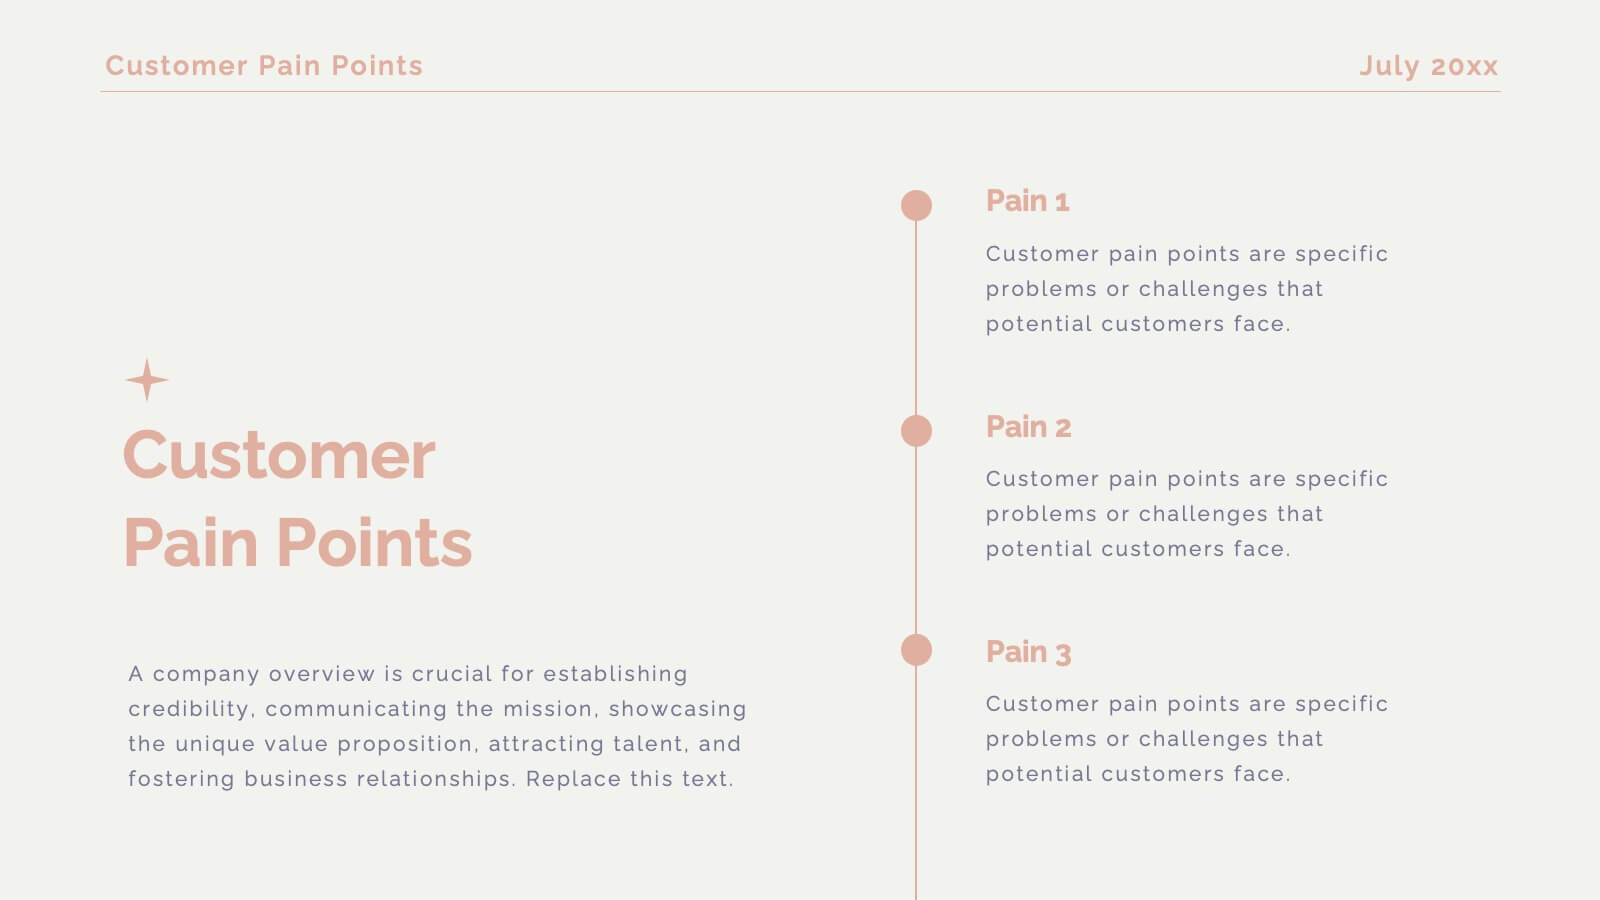
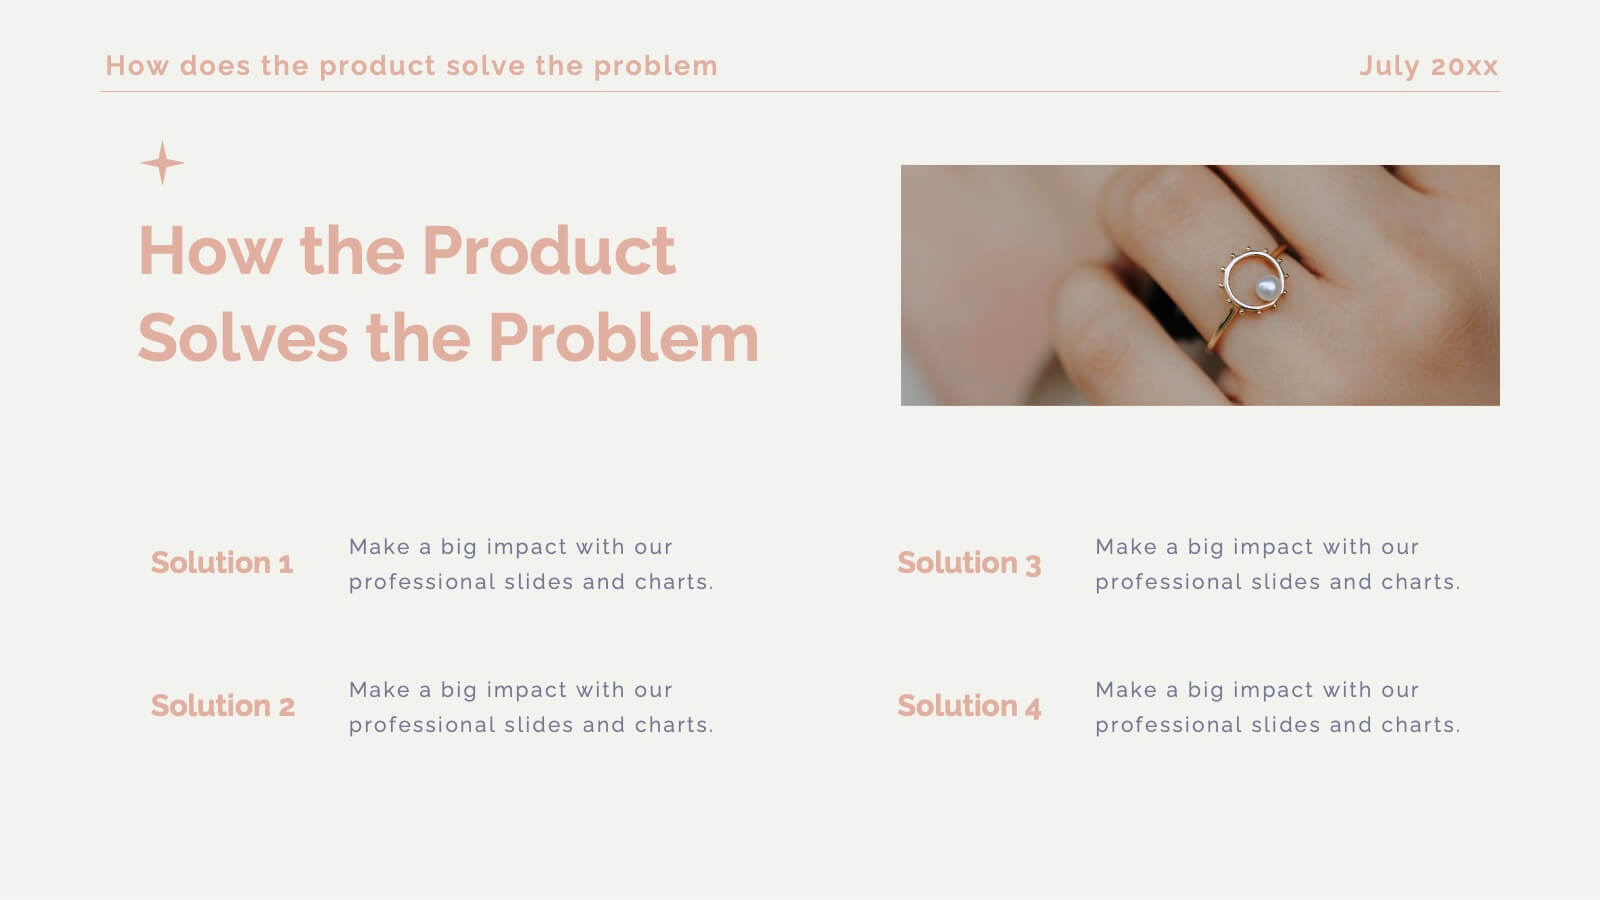
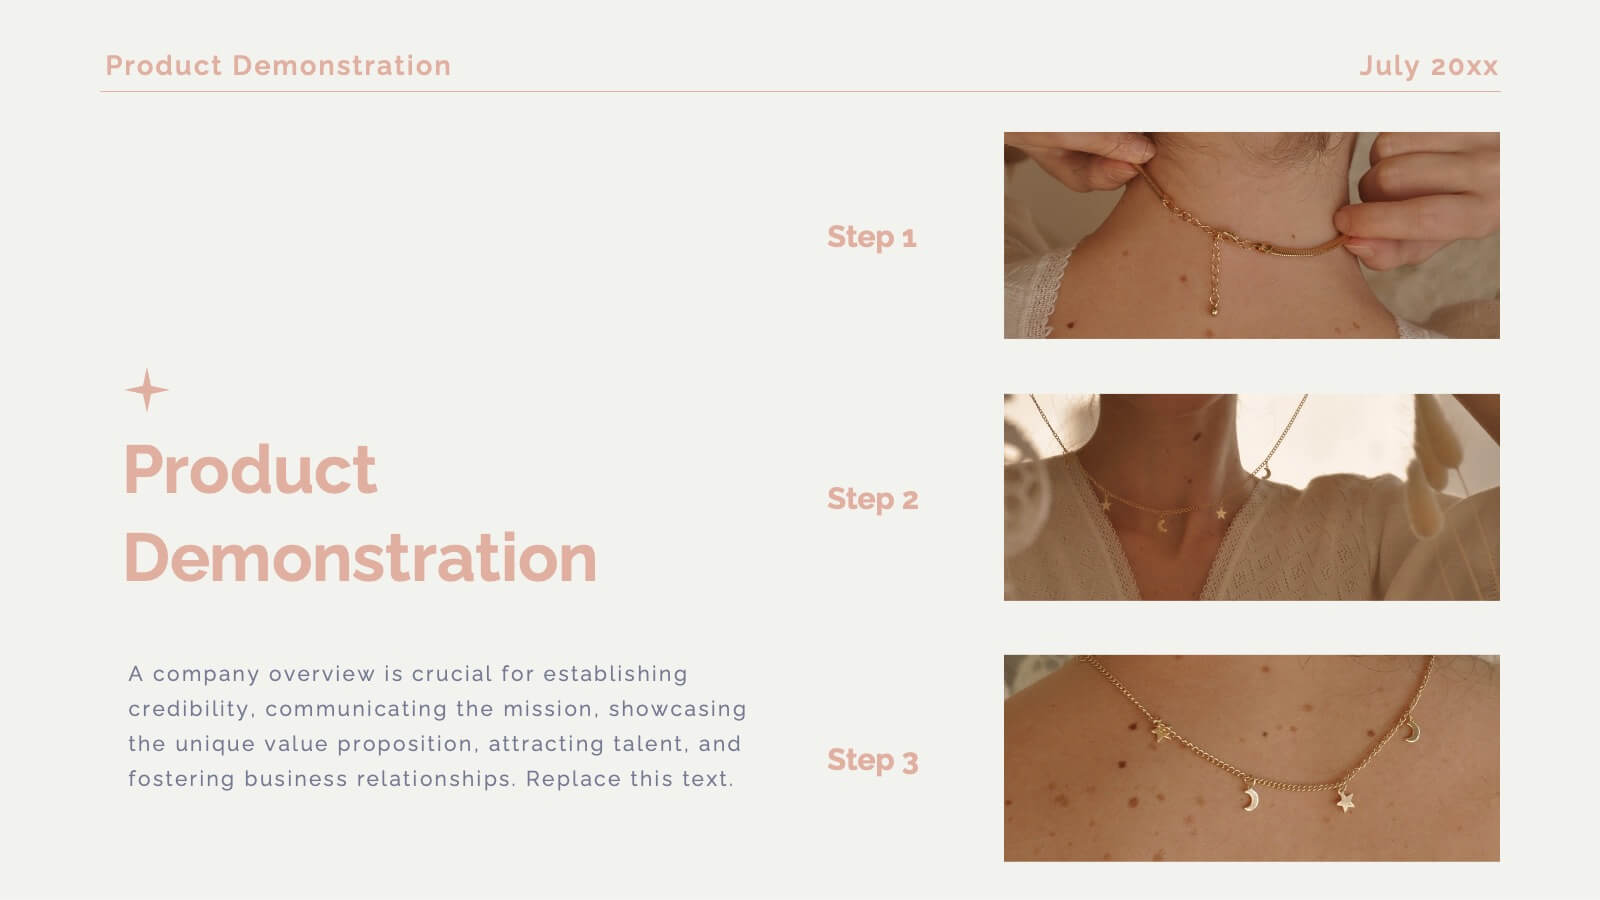
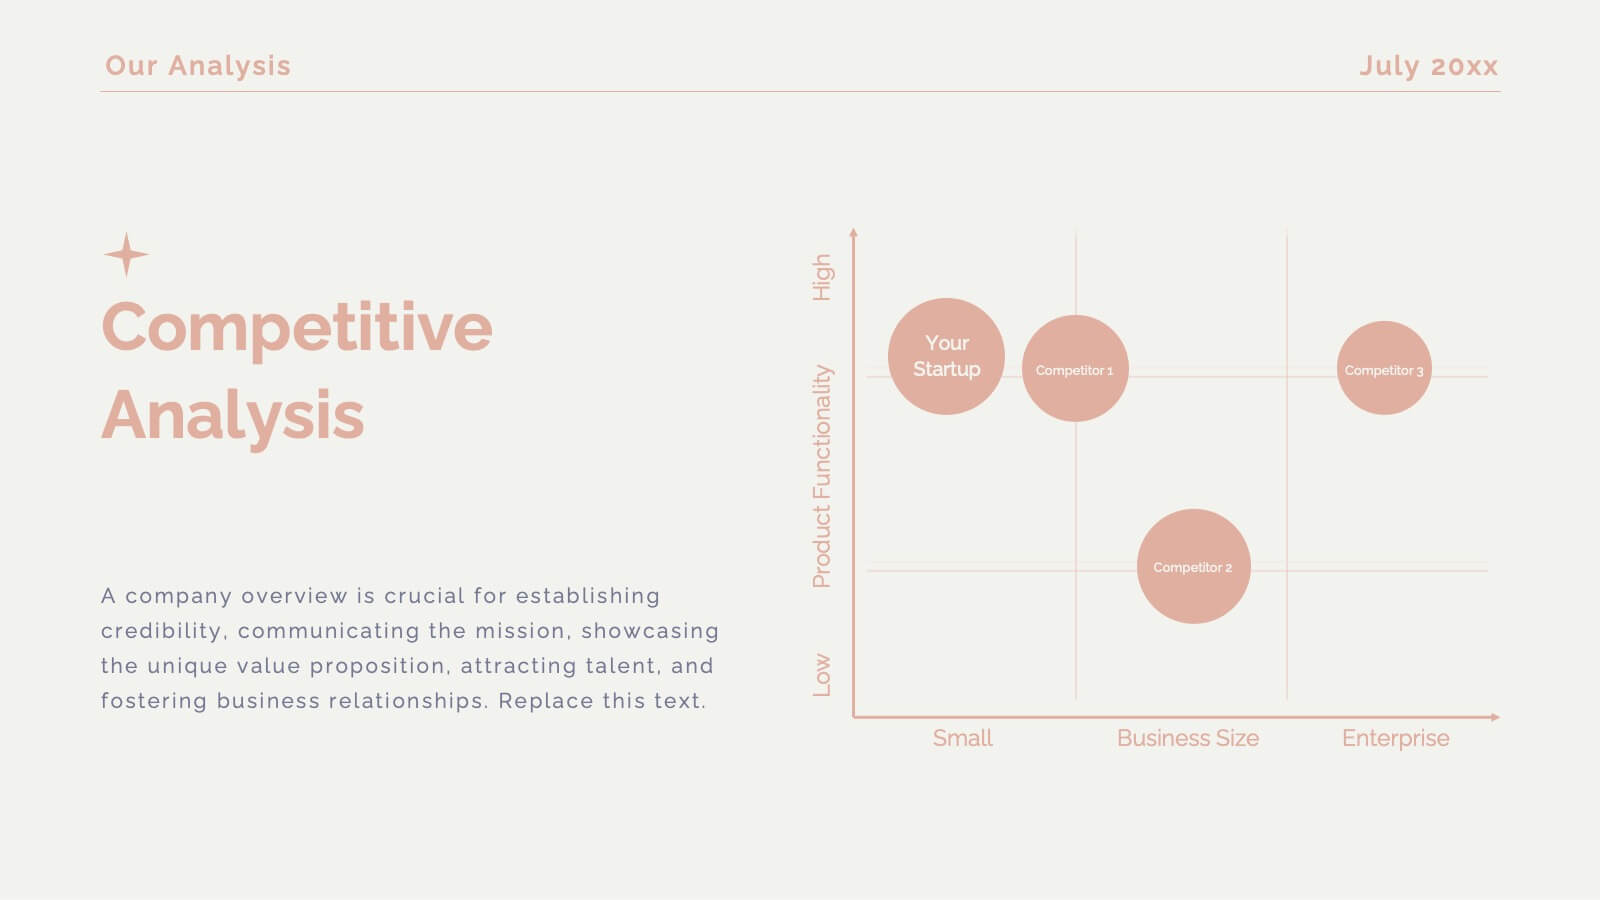
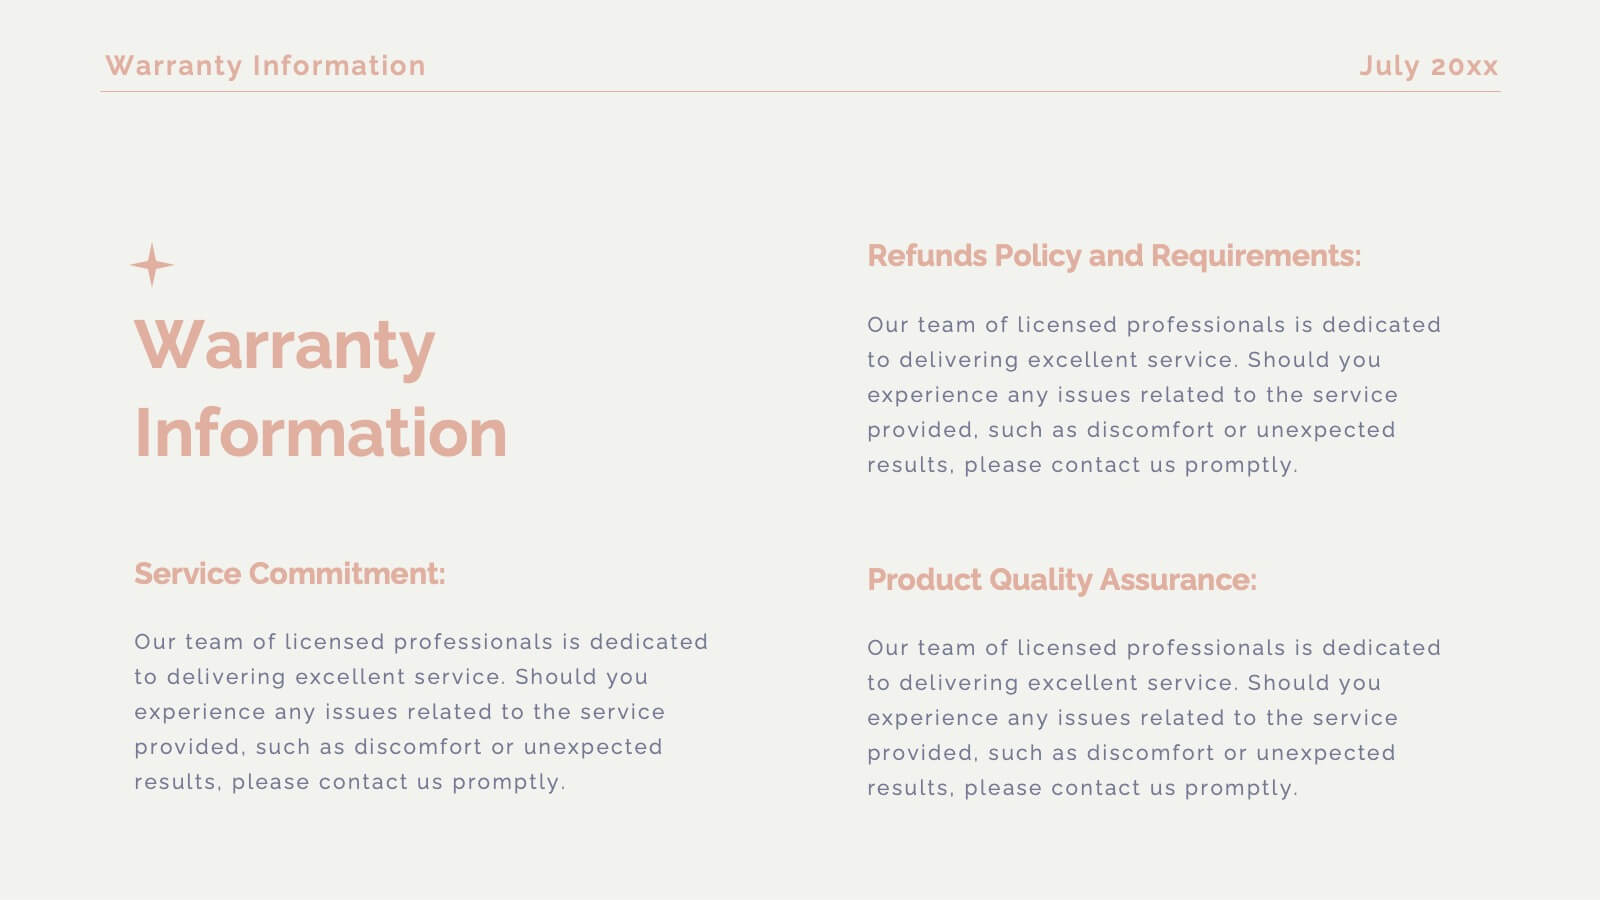
Legacy Product Launch Presentation
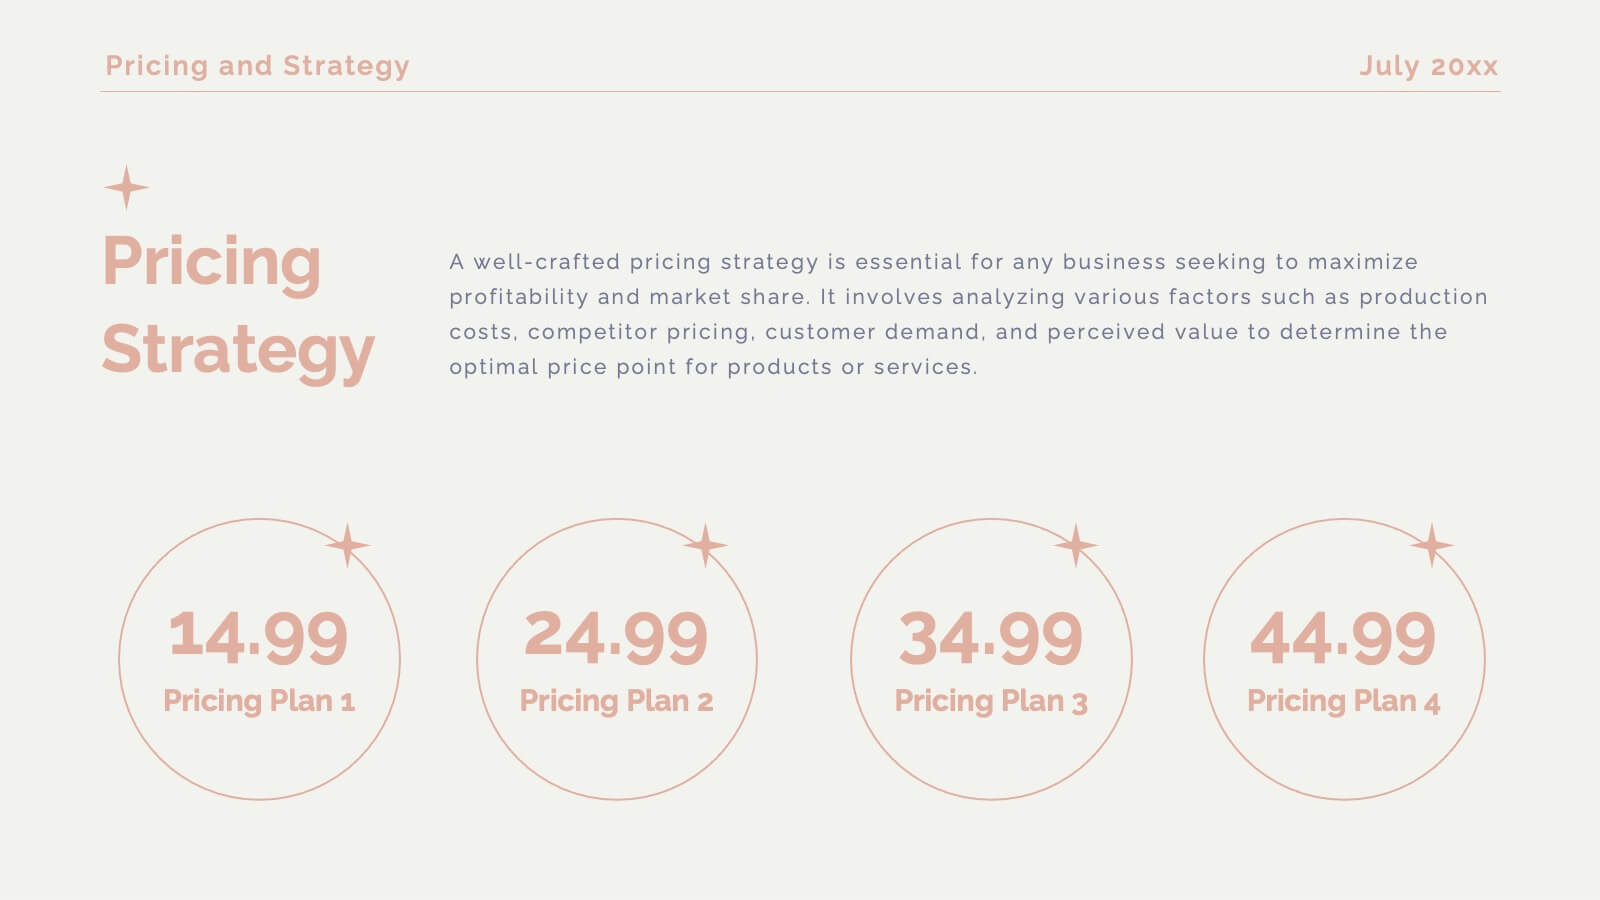
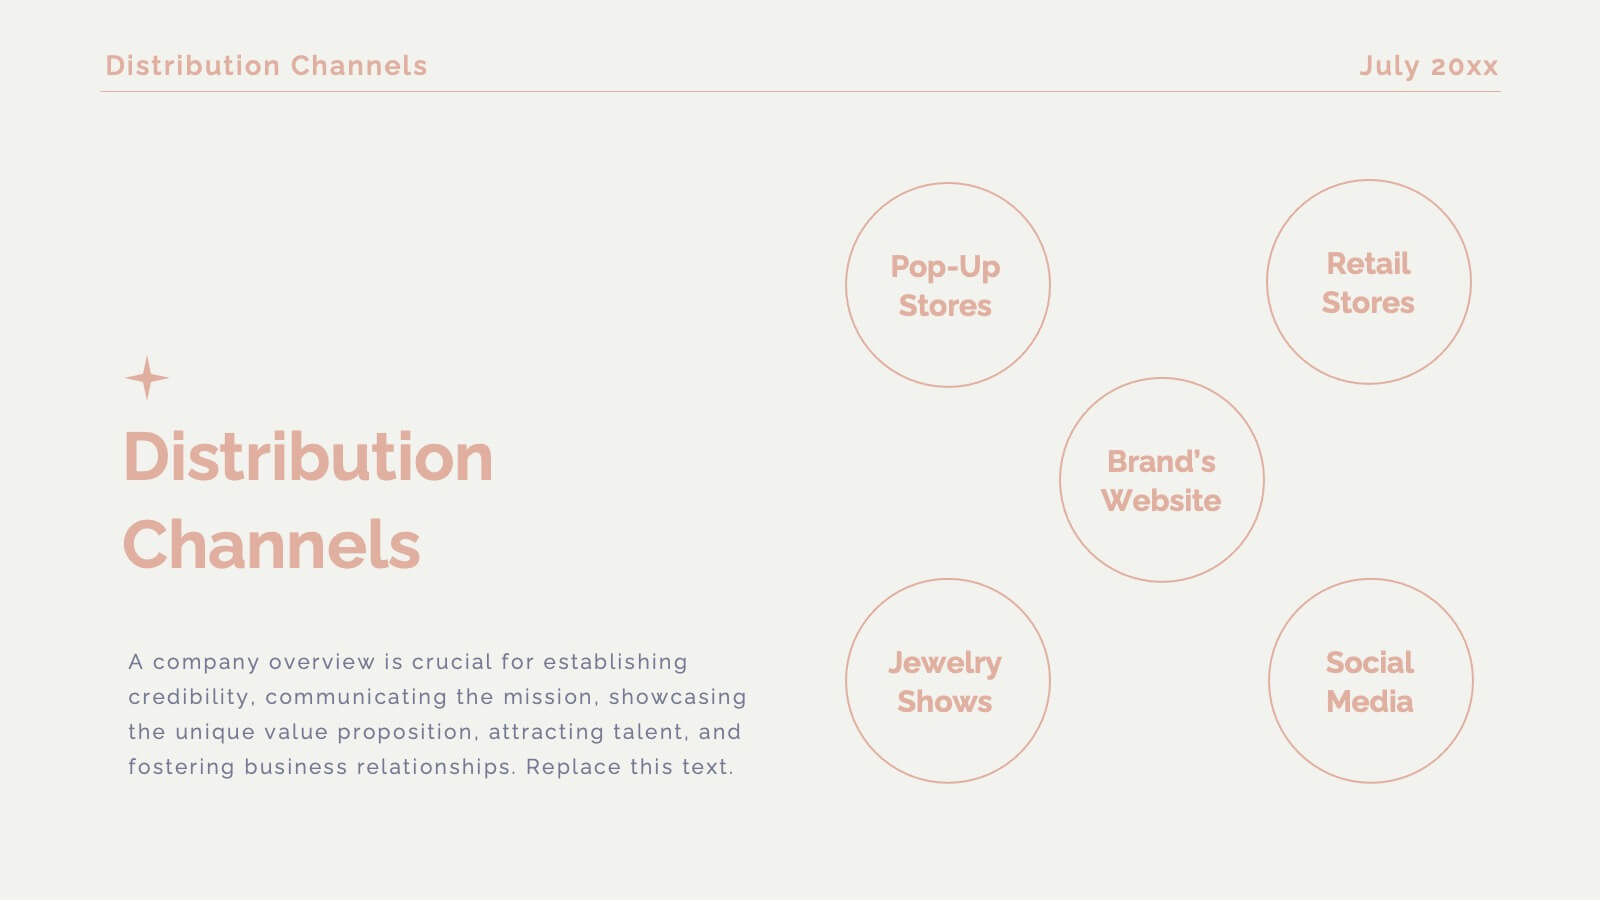
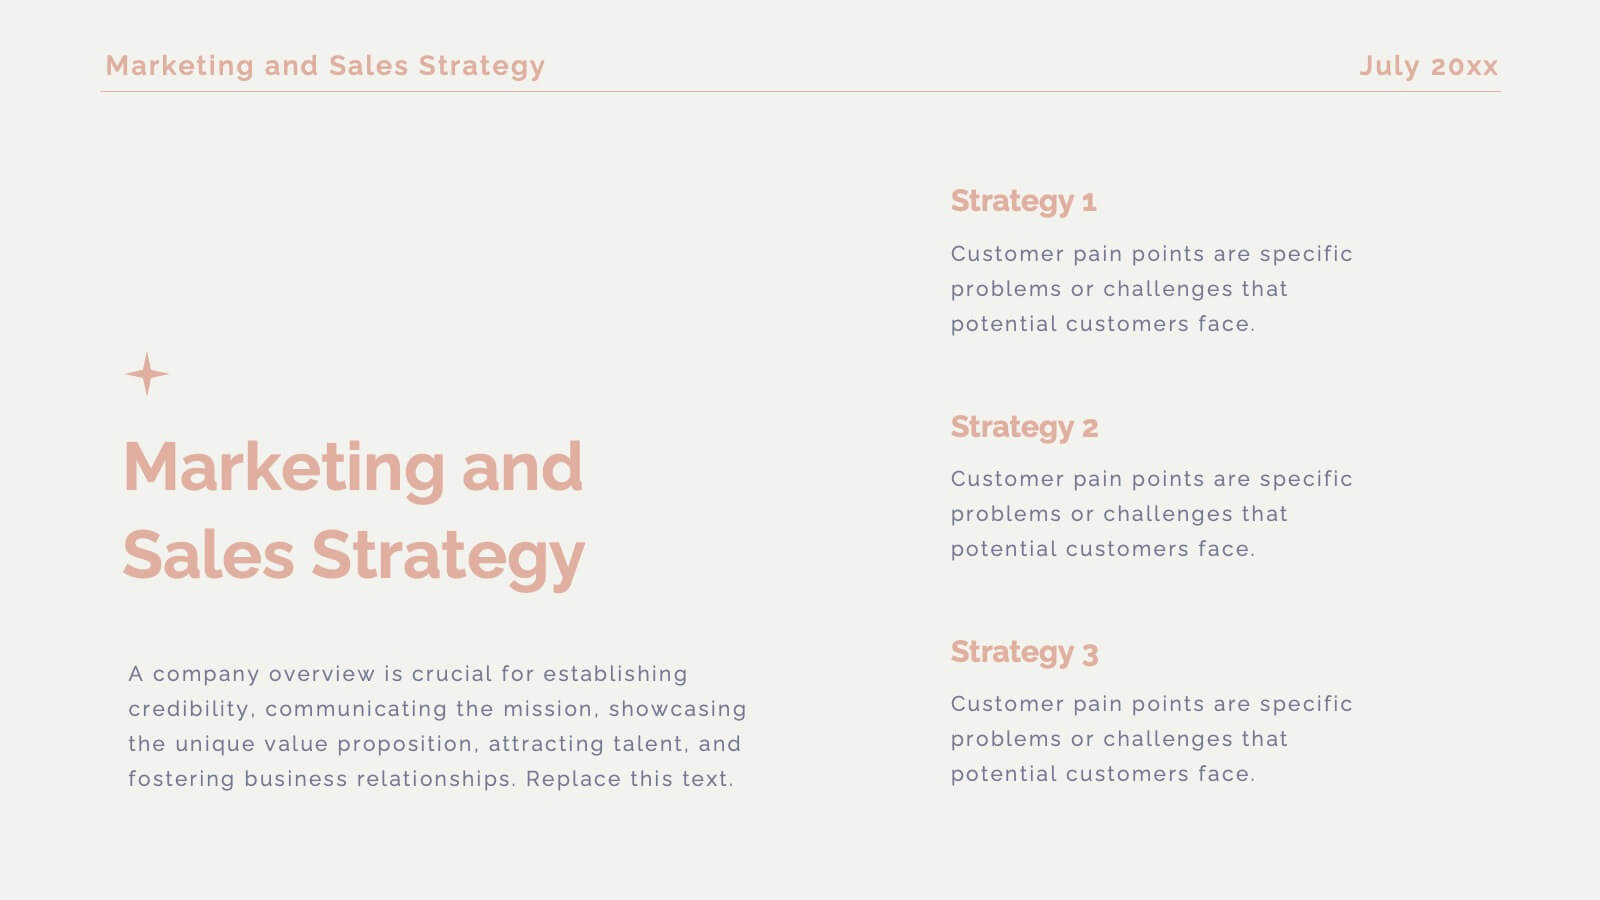
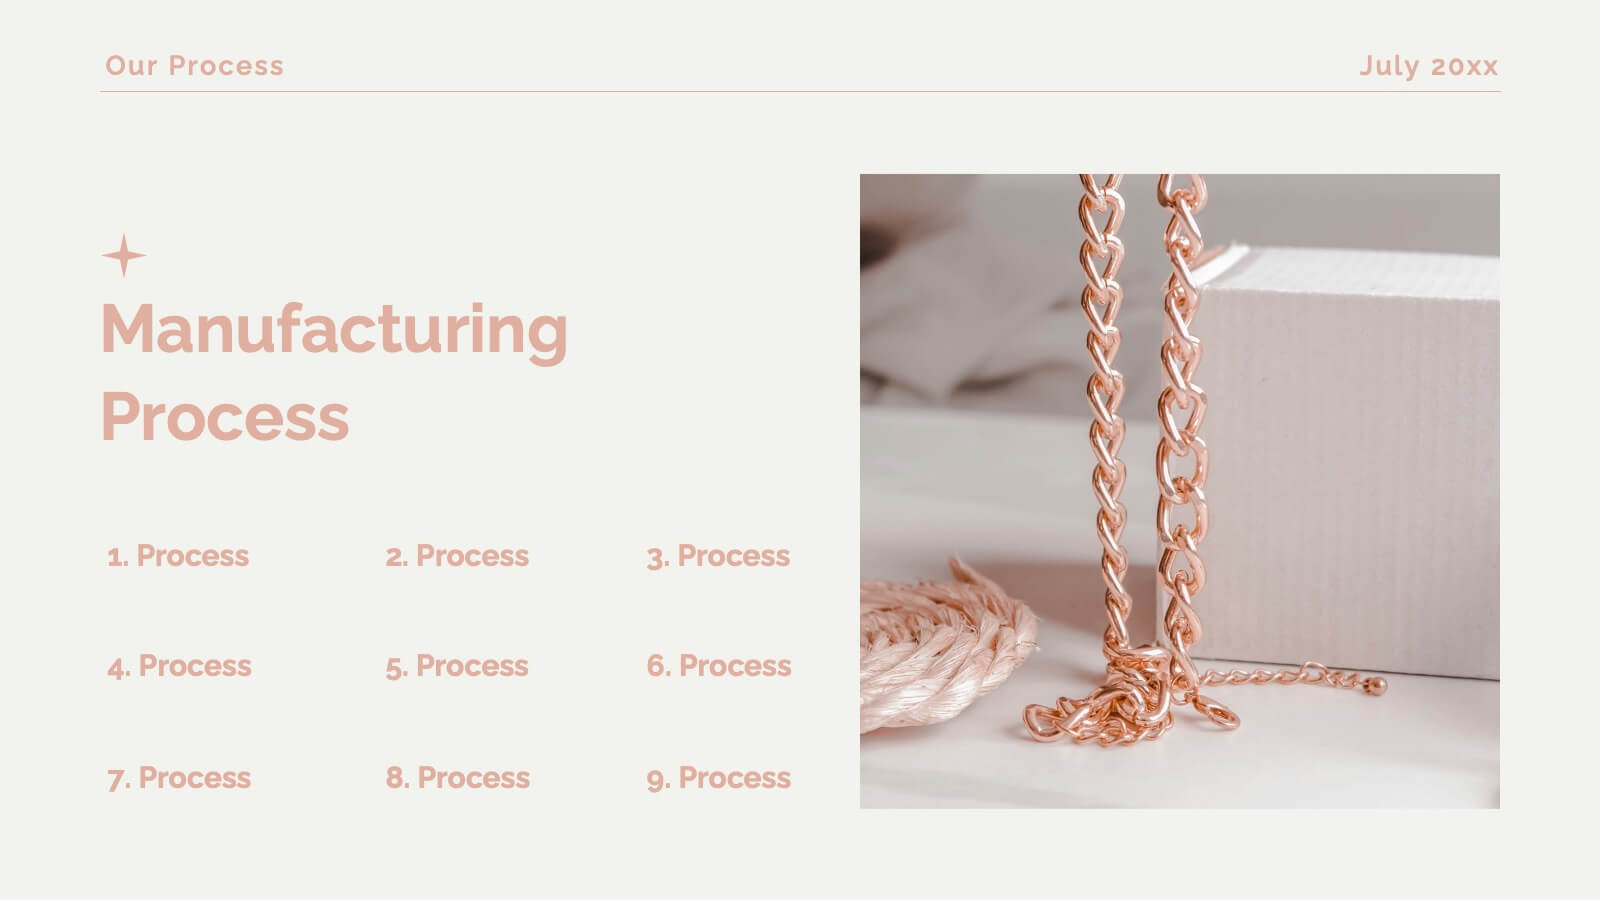
Get ready to unveil your product with a stunning and sophisticated launch template designed to captivate and convert! This template offers everything you need to present your product in the most compelling way possible, from an inviting welcome slide to an in-depth company overview that sets the stage for your brand’s story. The sleek design highlights key product features, unique selling propositions, and a thorough competitive analysis that positions your product as the market leader. With sections dedicated to customer pain points, solutions, and a powerful product demonstration, this template ensures your audience understands the value and impact of your offering. It also includes critical details like pricing strategy, distribution channels, and manufacturing processes, giving a full picture of your product’s journey from concept to market. Compatible with PowerPoint, Keynote, and Google Slides, this template is your ultimate tool for a successful product launch that leaves a lasting impression!


5 diapositivas
Corporate Annual Report Insights Presentation
Showcase Your Corporate Success! The Corporate Annual Report Insights Presentation delivers financial highlights, key performance indicators, and strategic insights in a structured, visually appealing format. Ideal for executives and stakeholders, this template ensures clarity and professionalism. Fully customizable and compatible with PowerPoint, Keynote, and Google Slides, it enhances impactful business storytelling.


5 diapositivas
Scalability and Sustainable Growth Model Presentation
Communicate long-term vision with the Scalability and Sustainable Growth Model Presentation. This layered mountain-style design is ideal for visualizing strategic phases, scaling challenges, or sustainable development milestones. Perfect for roadmap pitches, growth models, or financial projections—fully editable in PowerPoint, Keynote, and Google Slides.

21 diapositivas
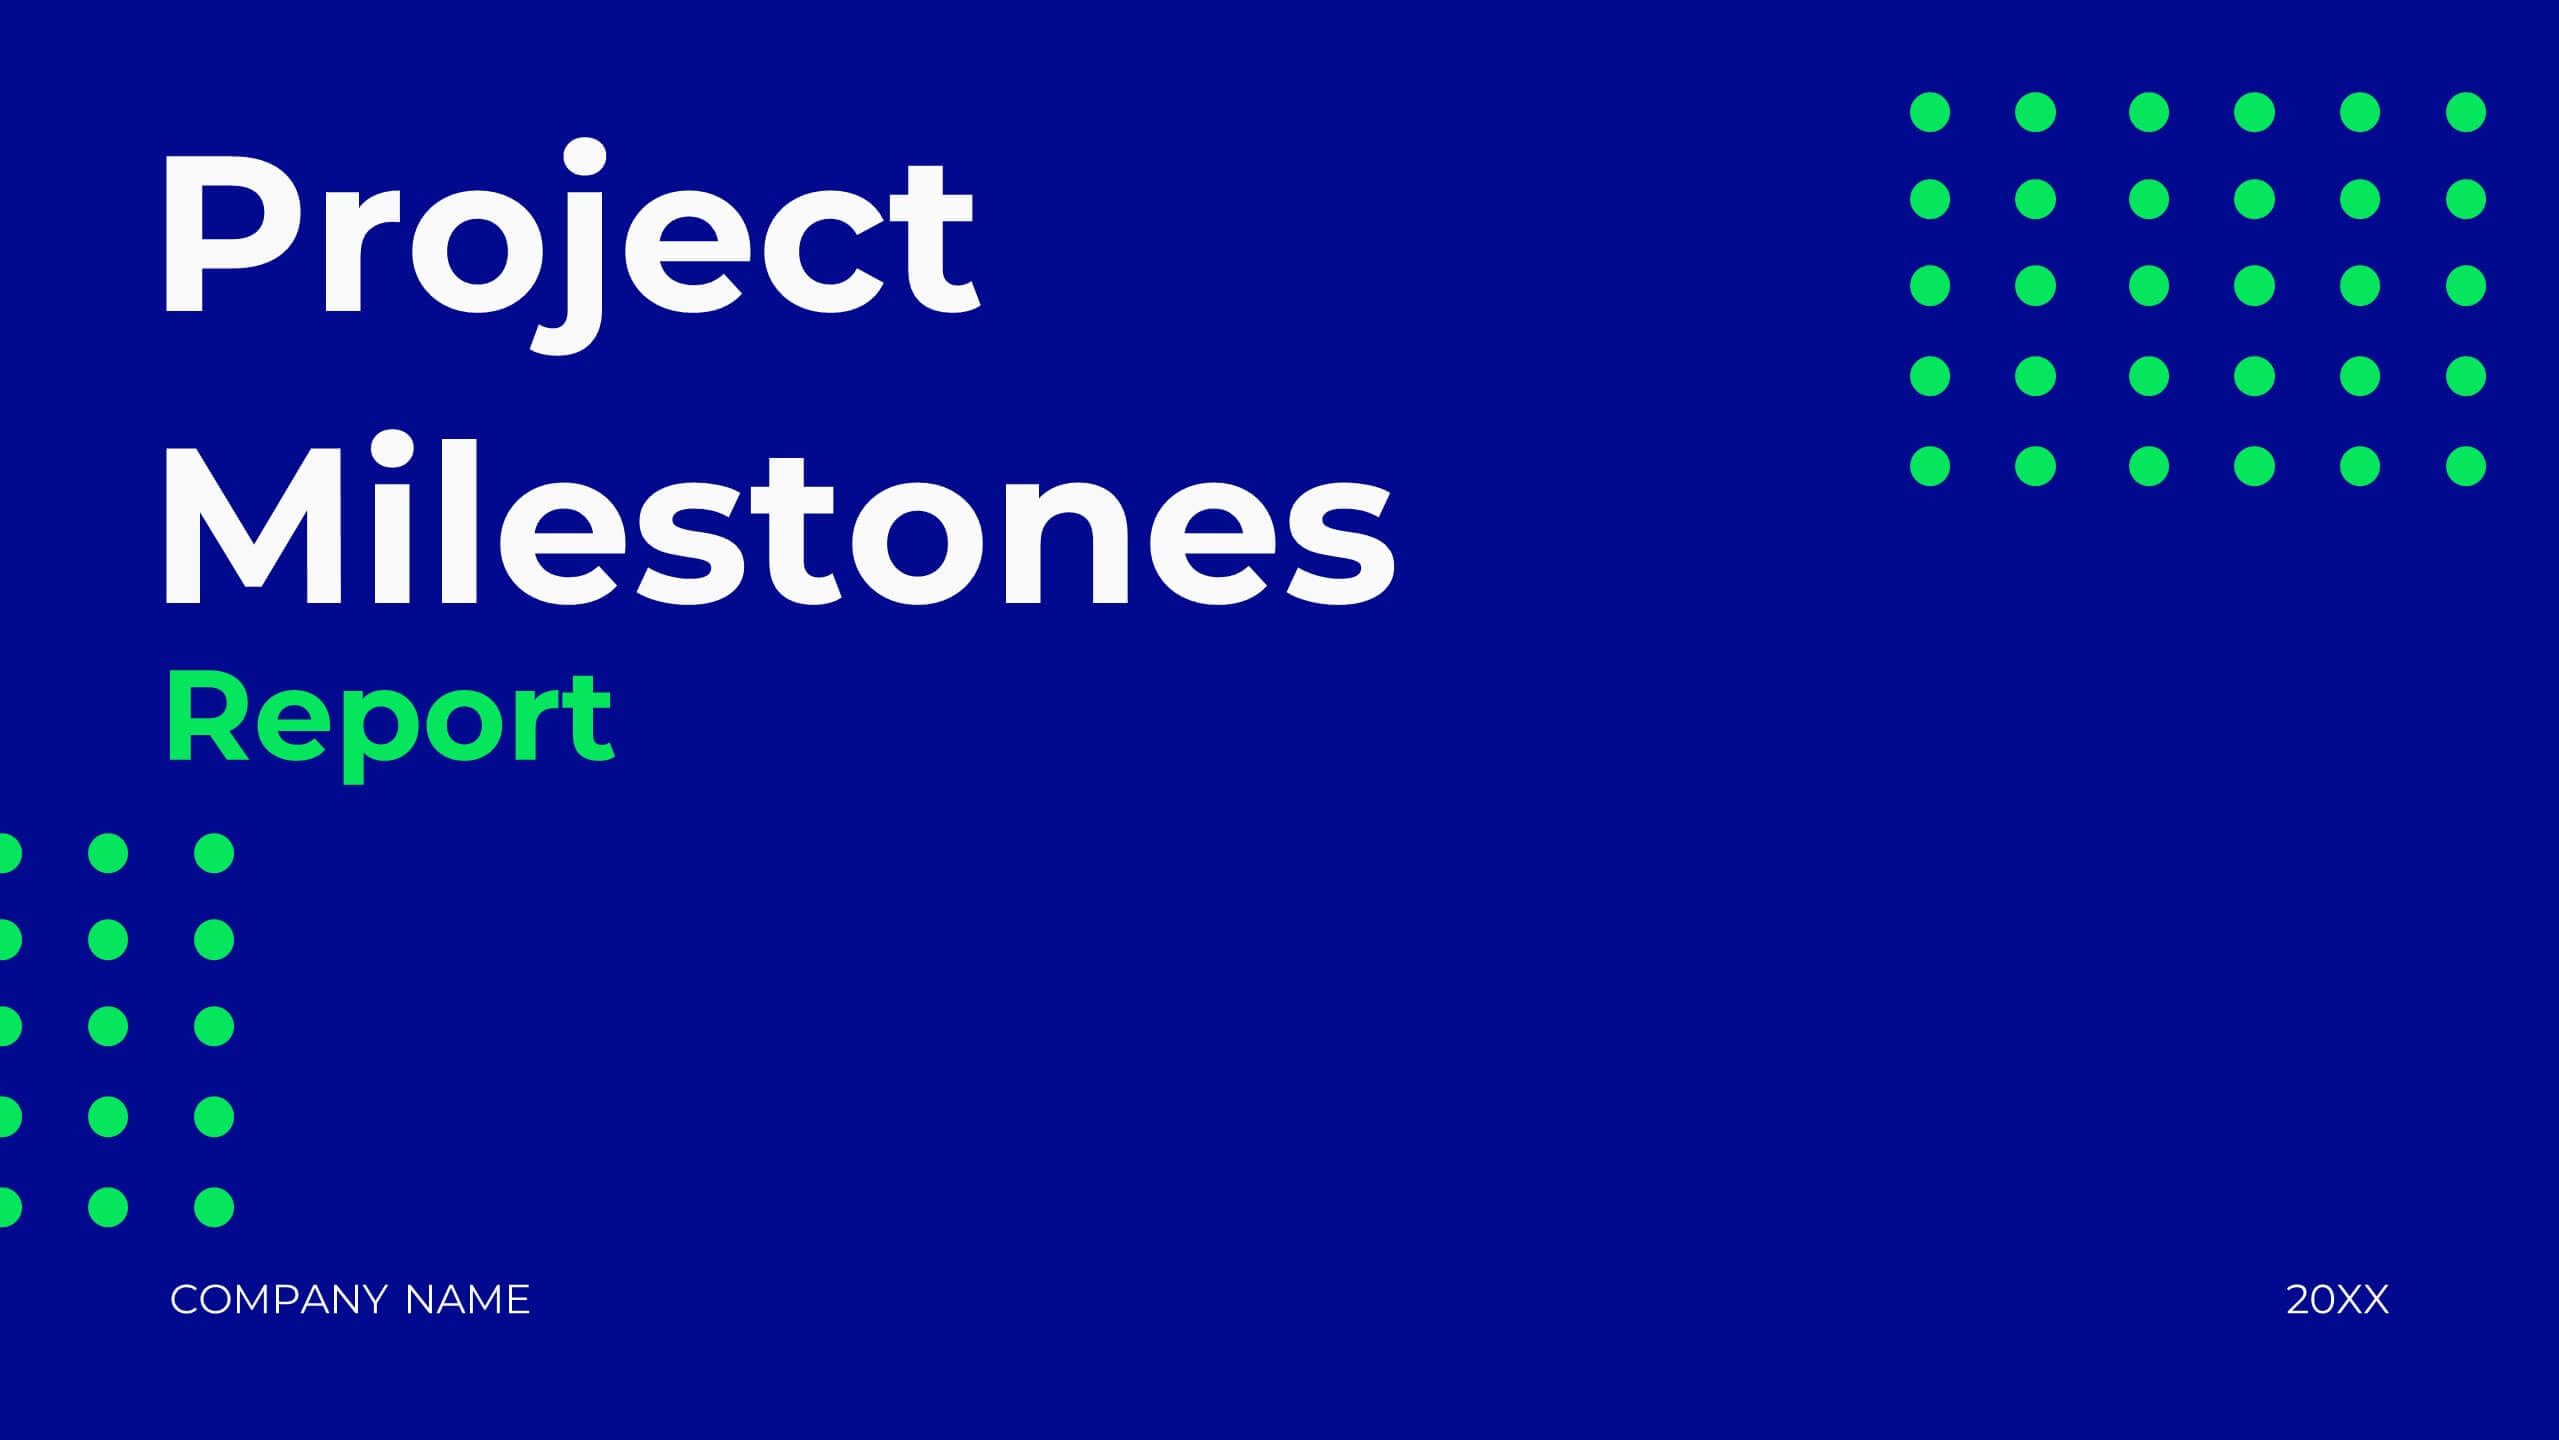
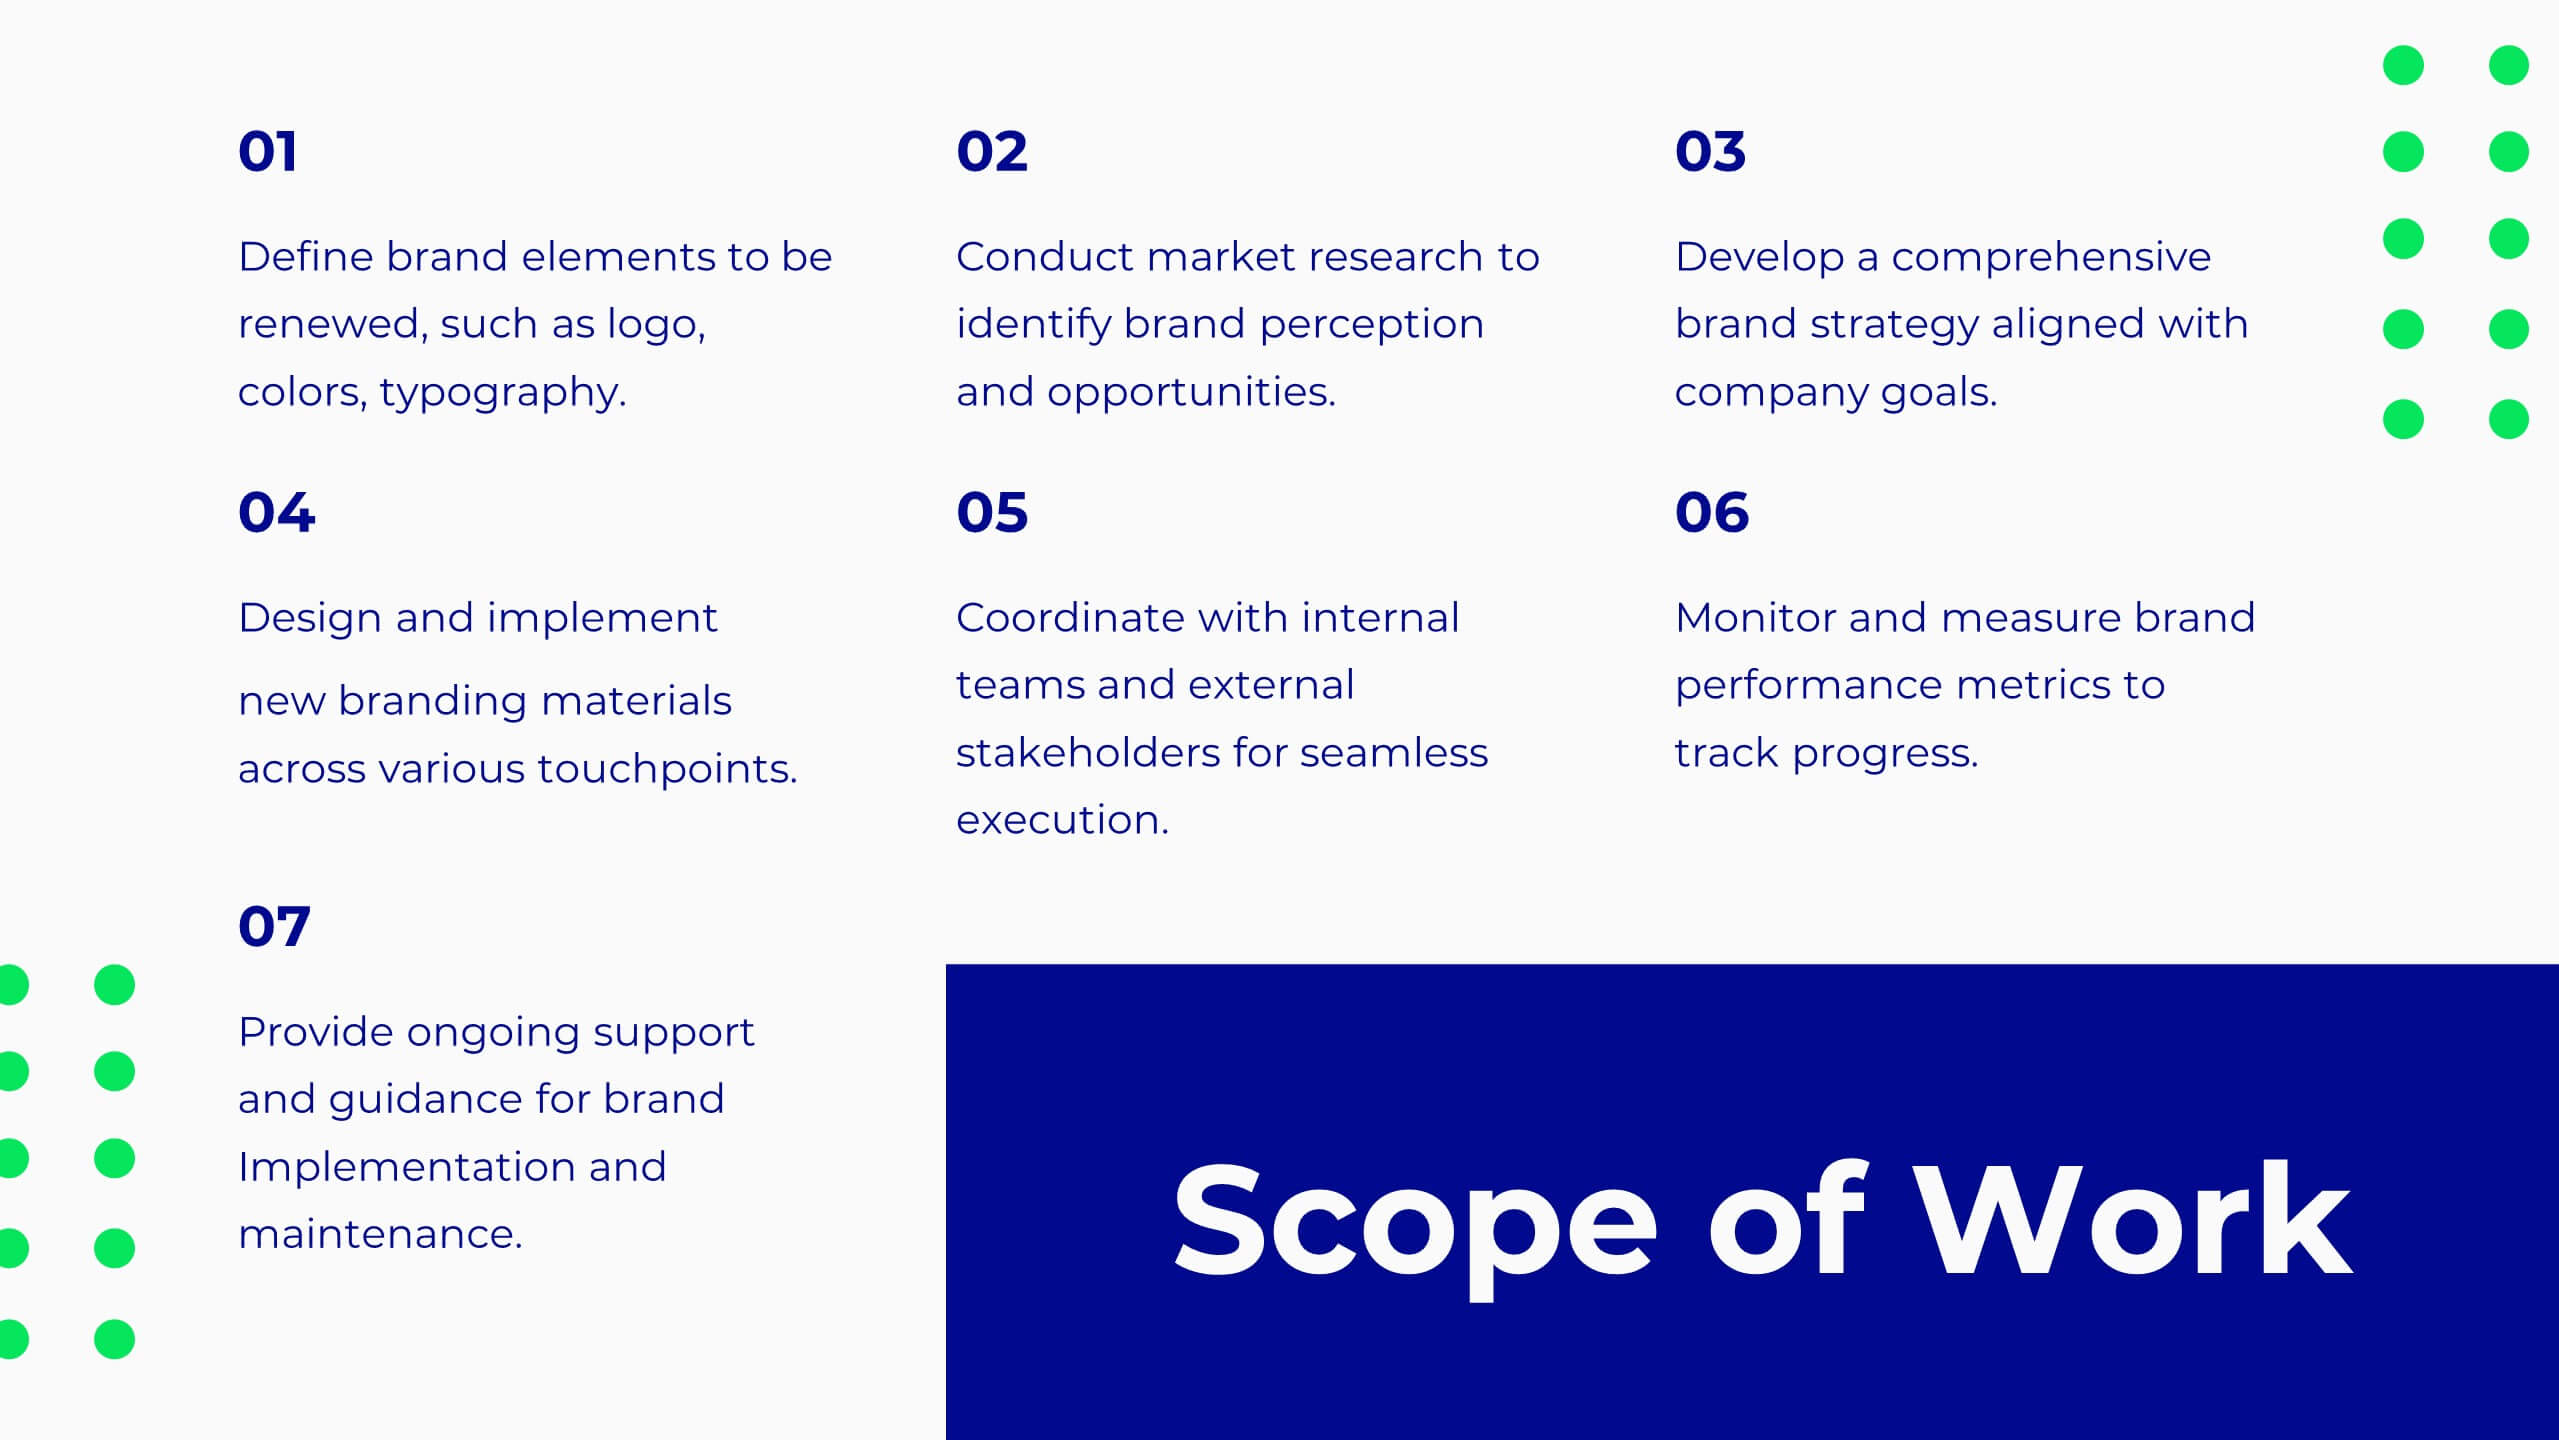
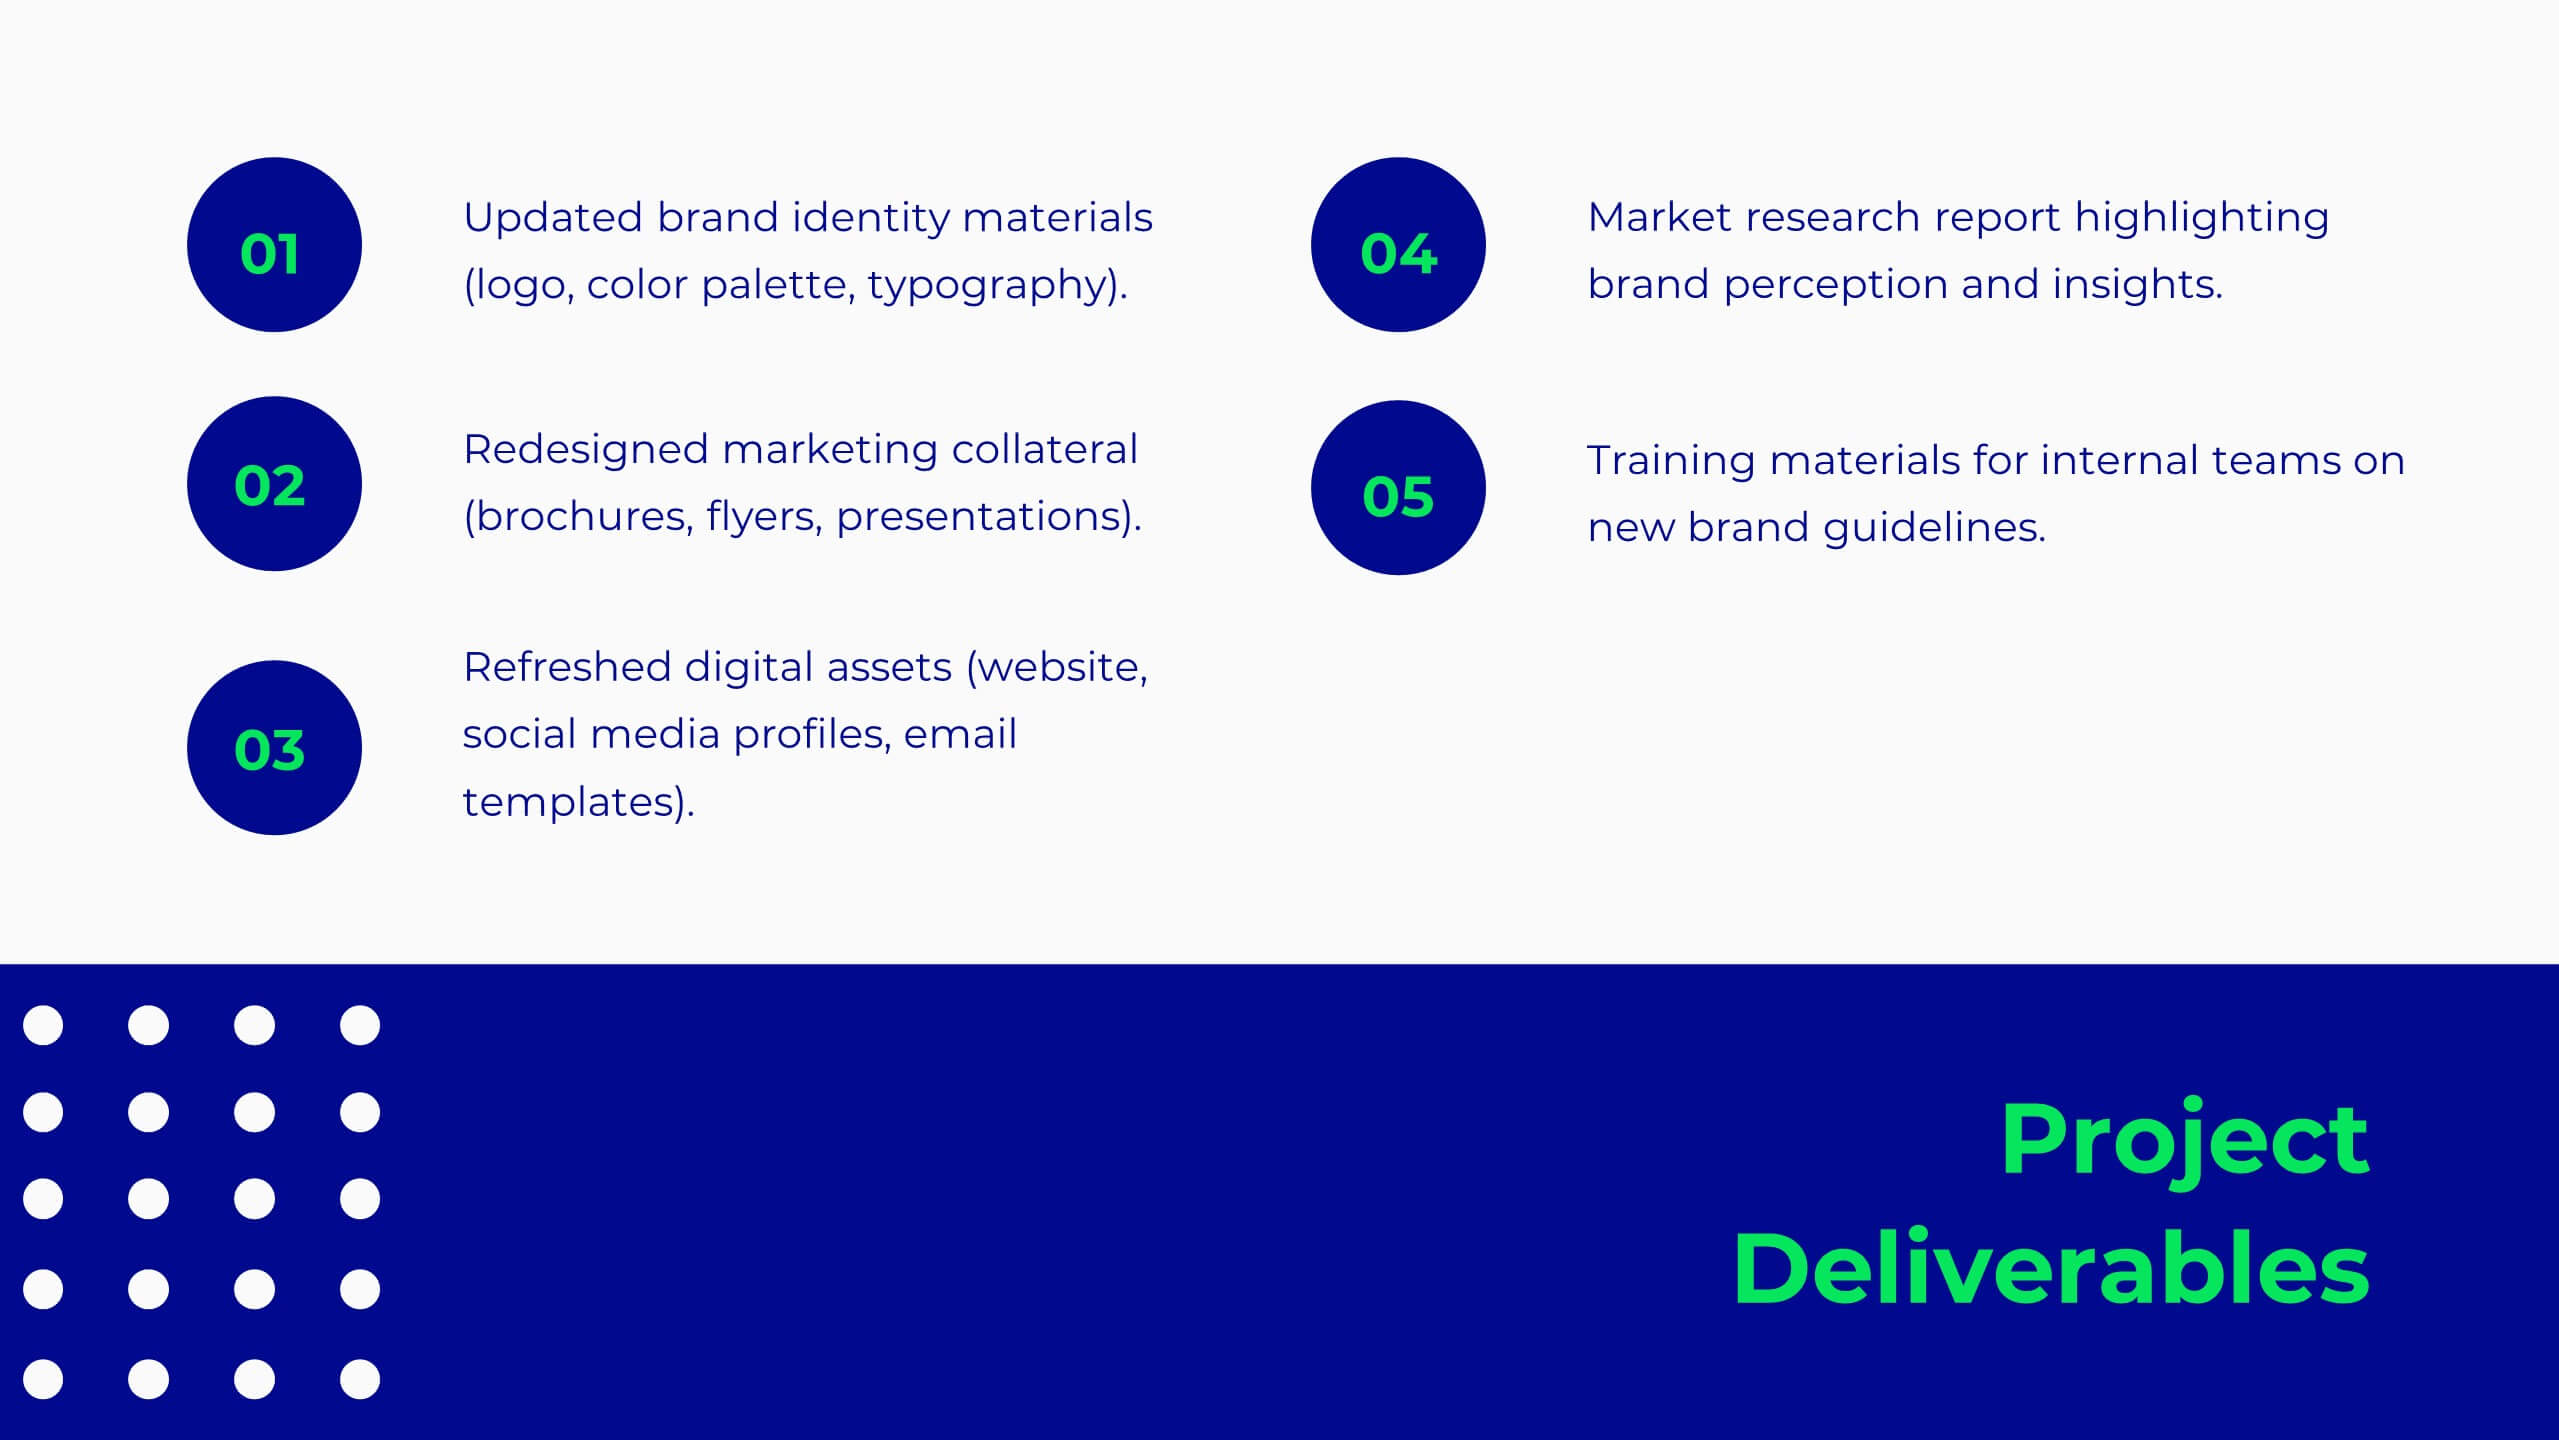
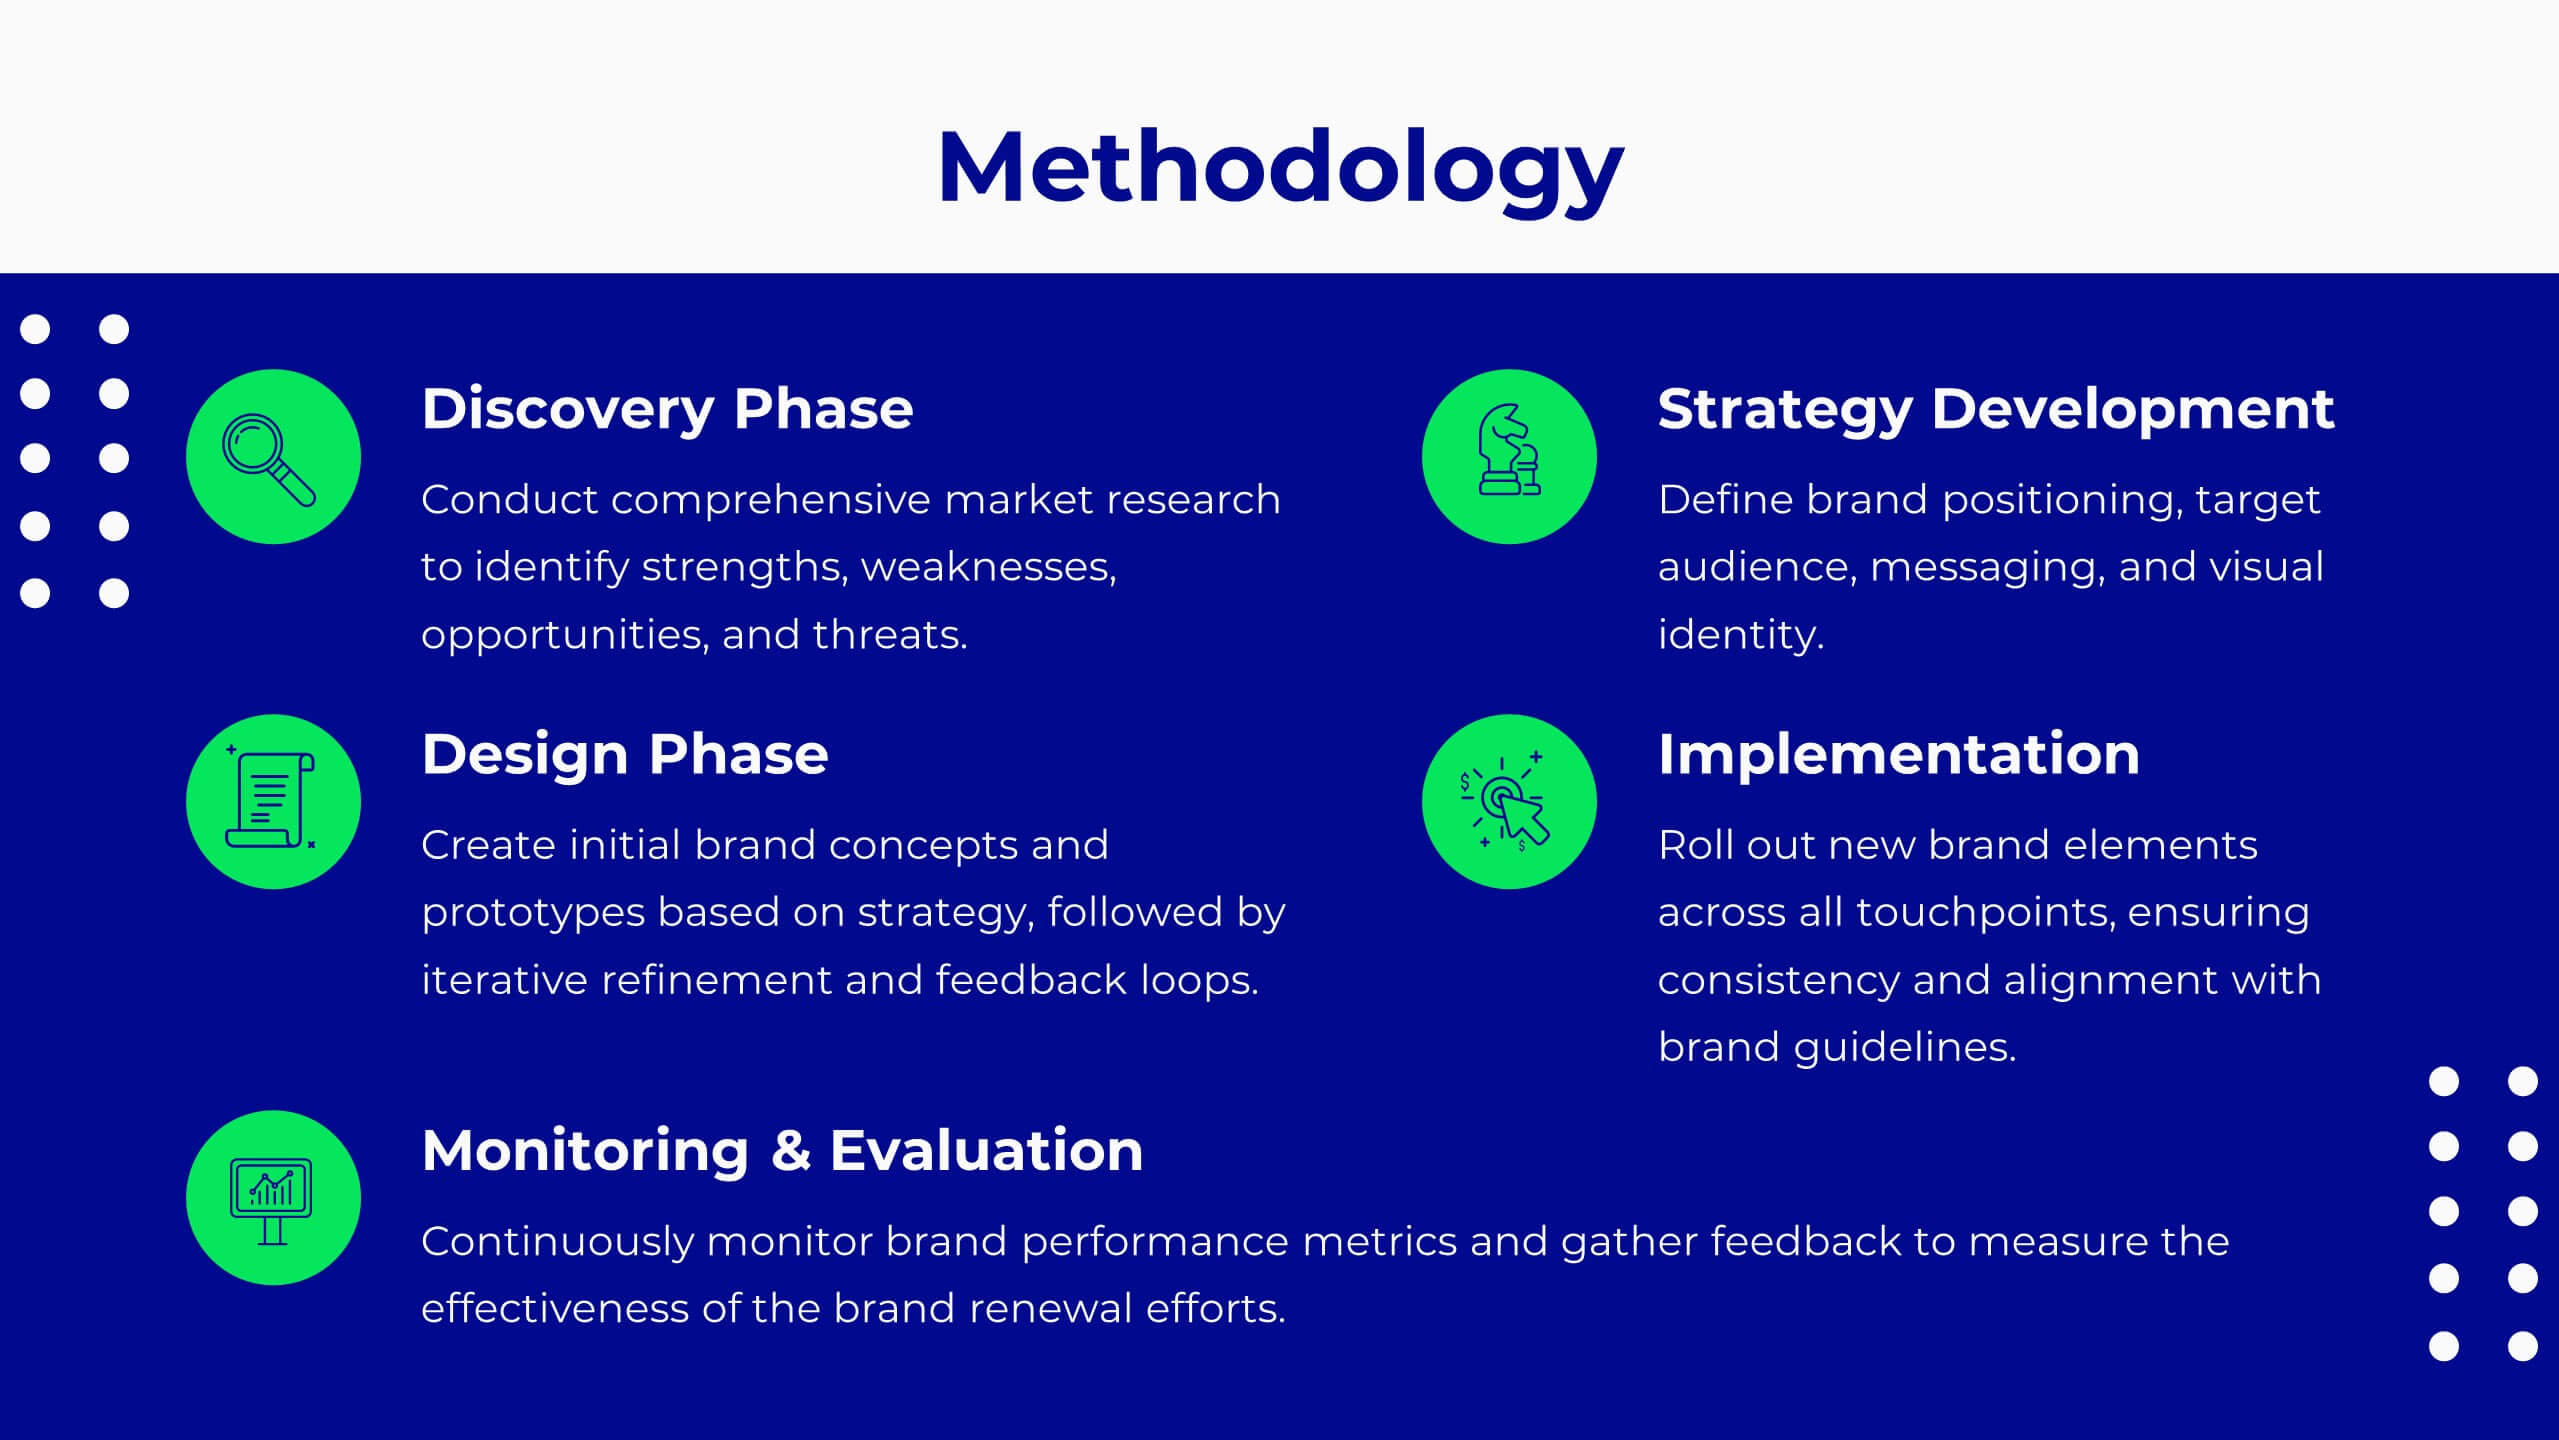
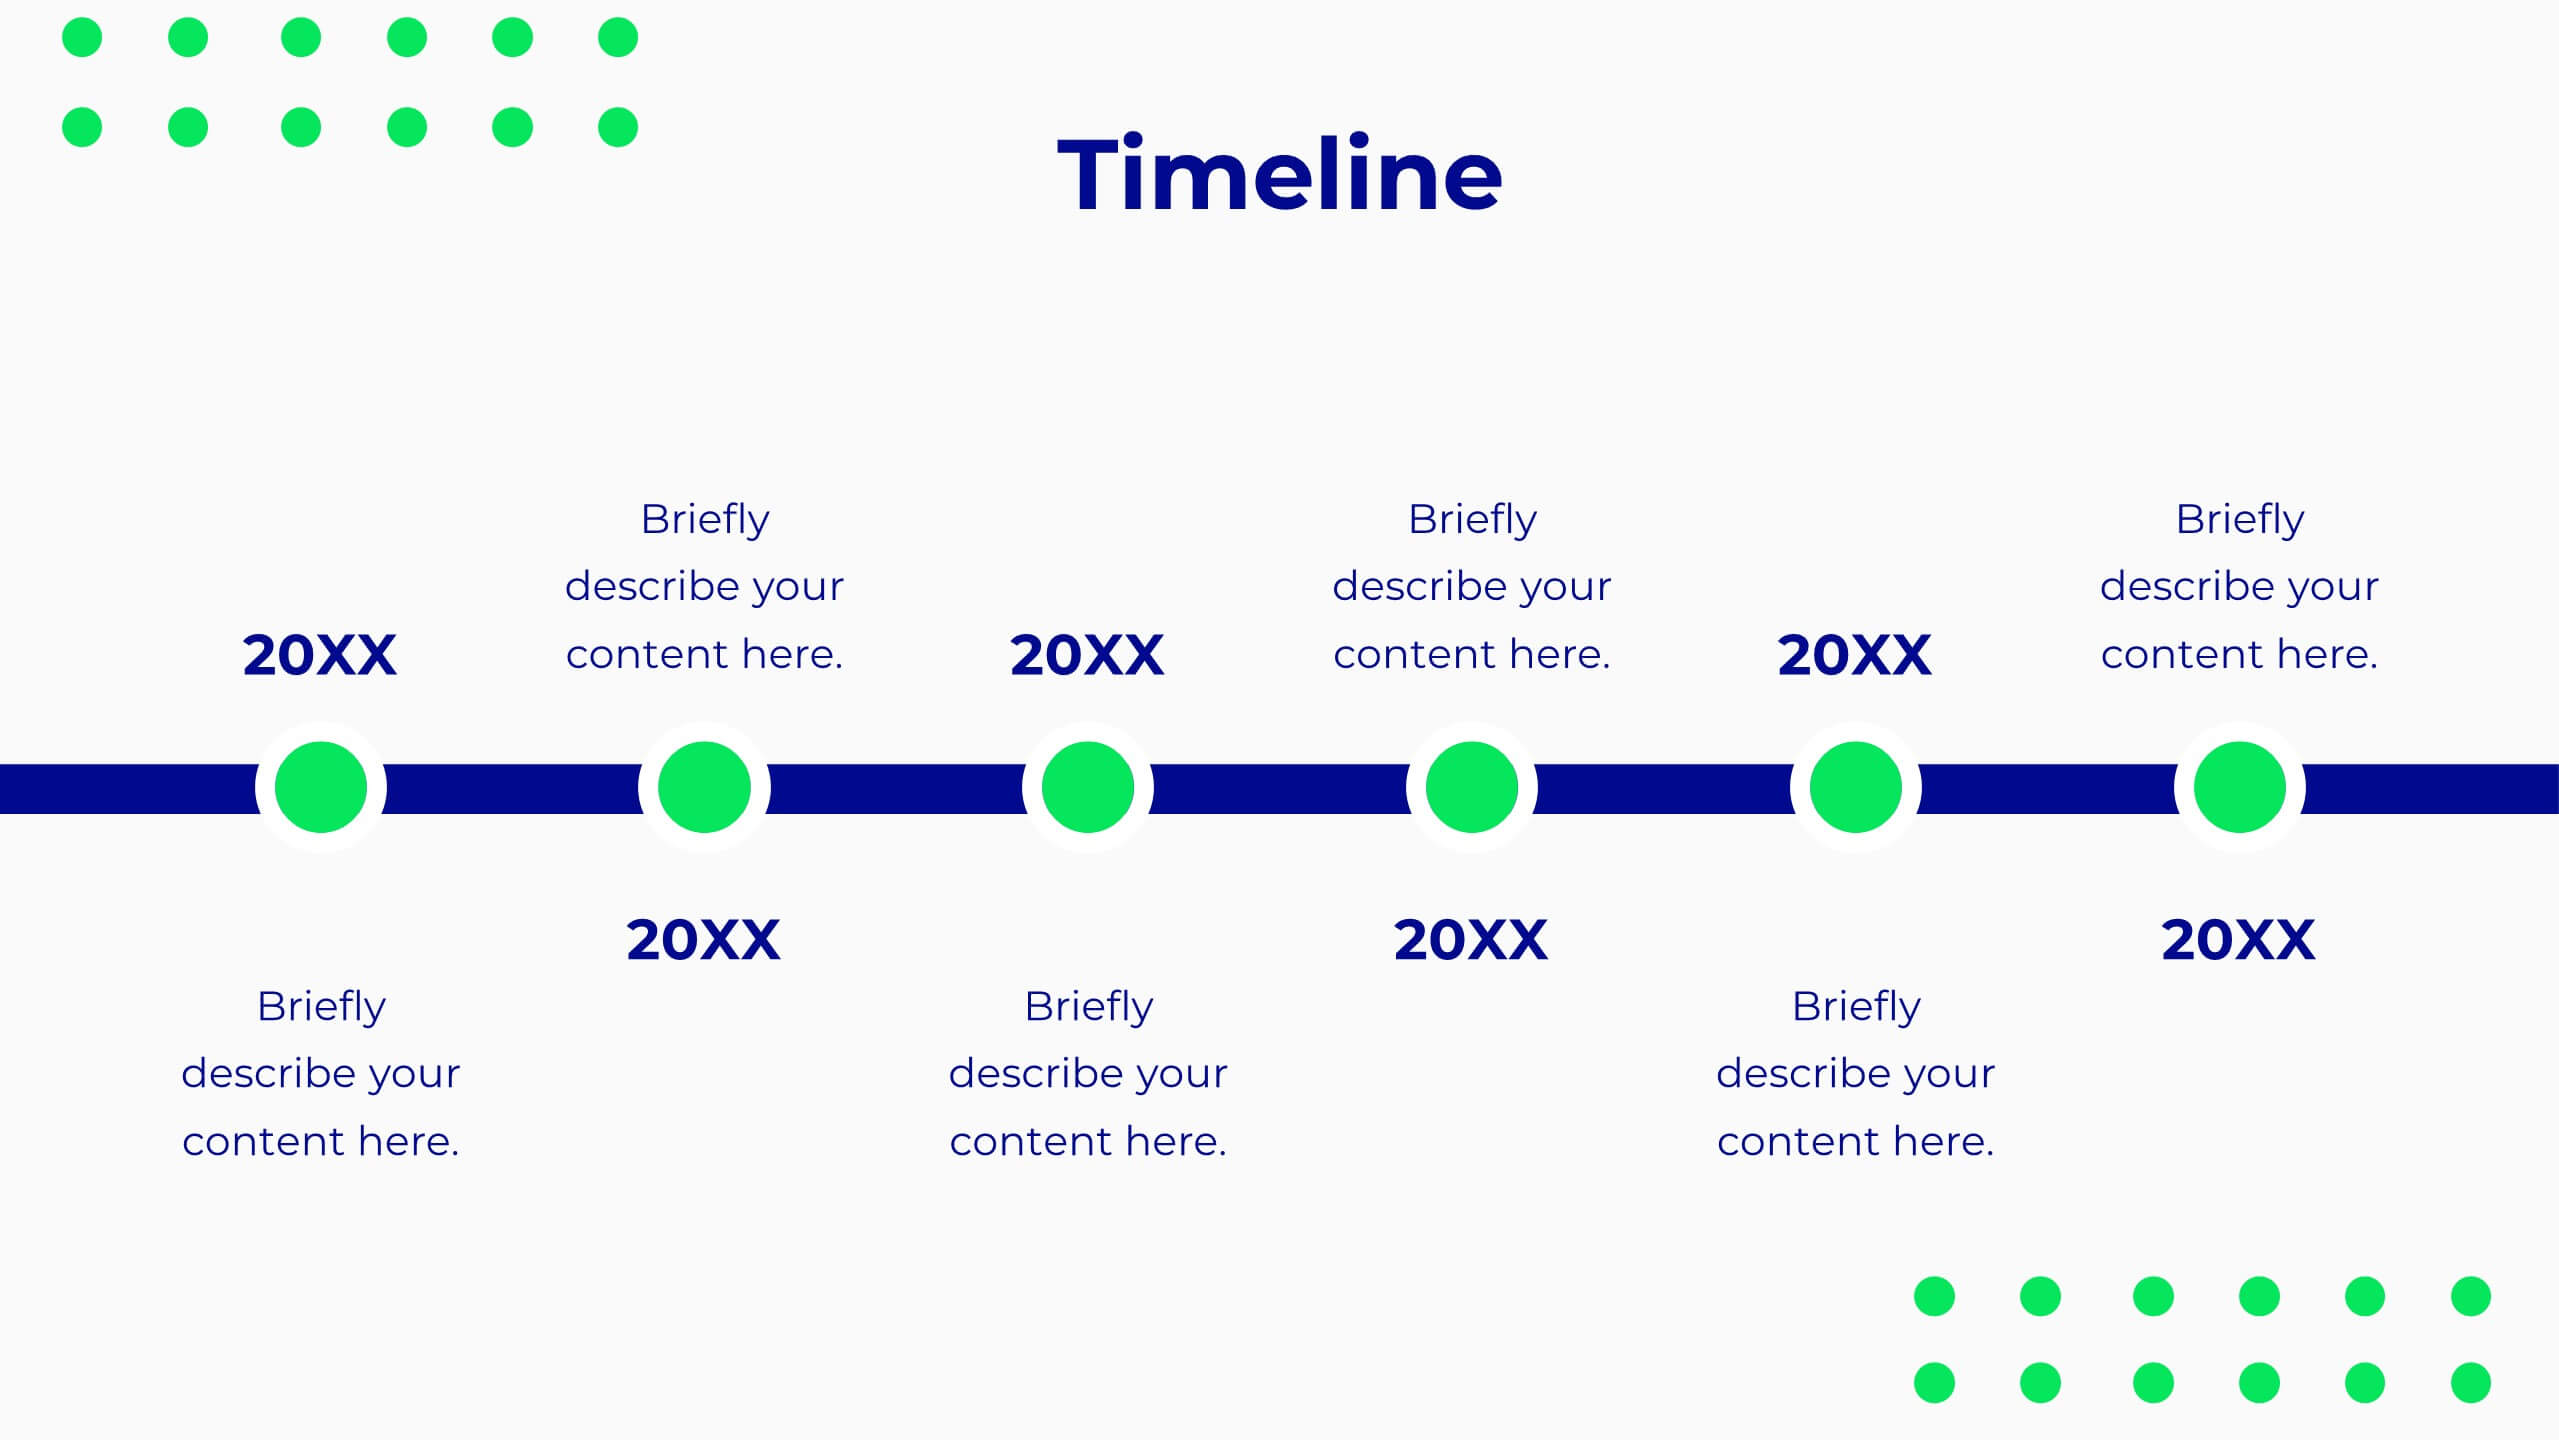
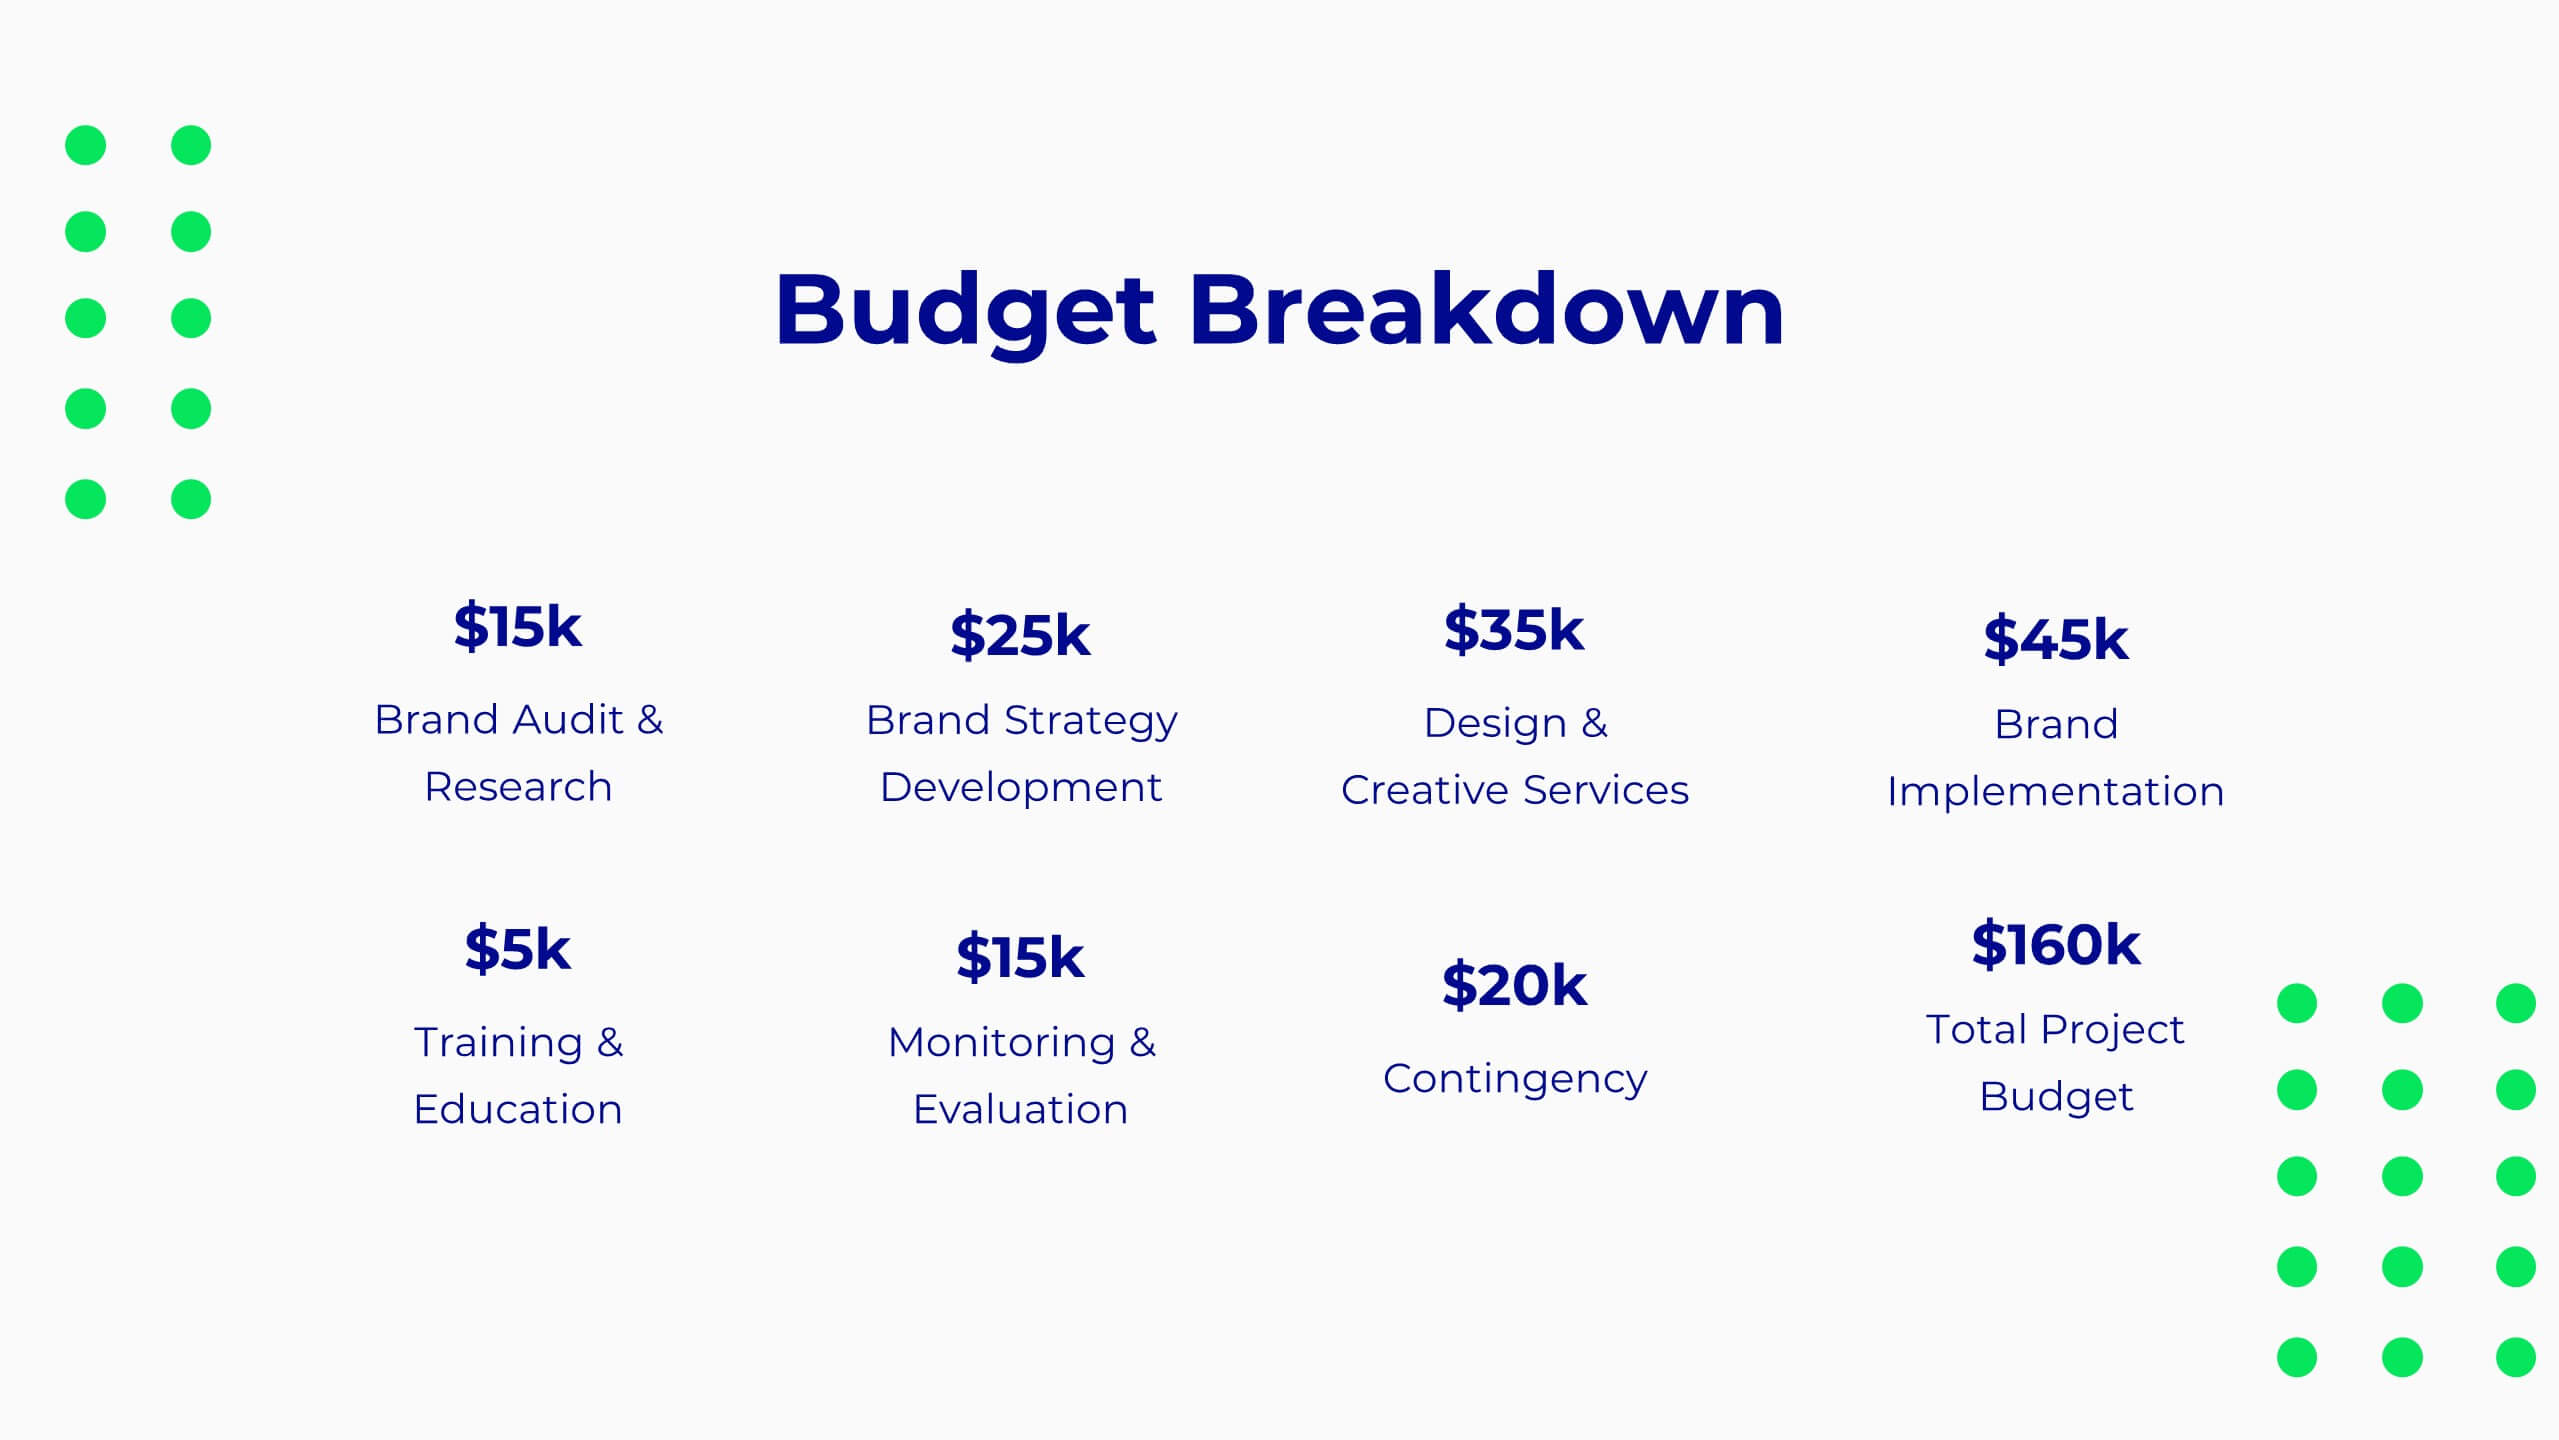
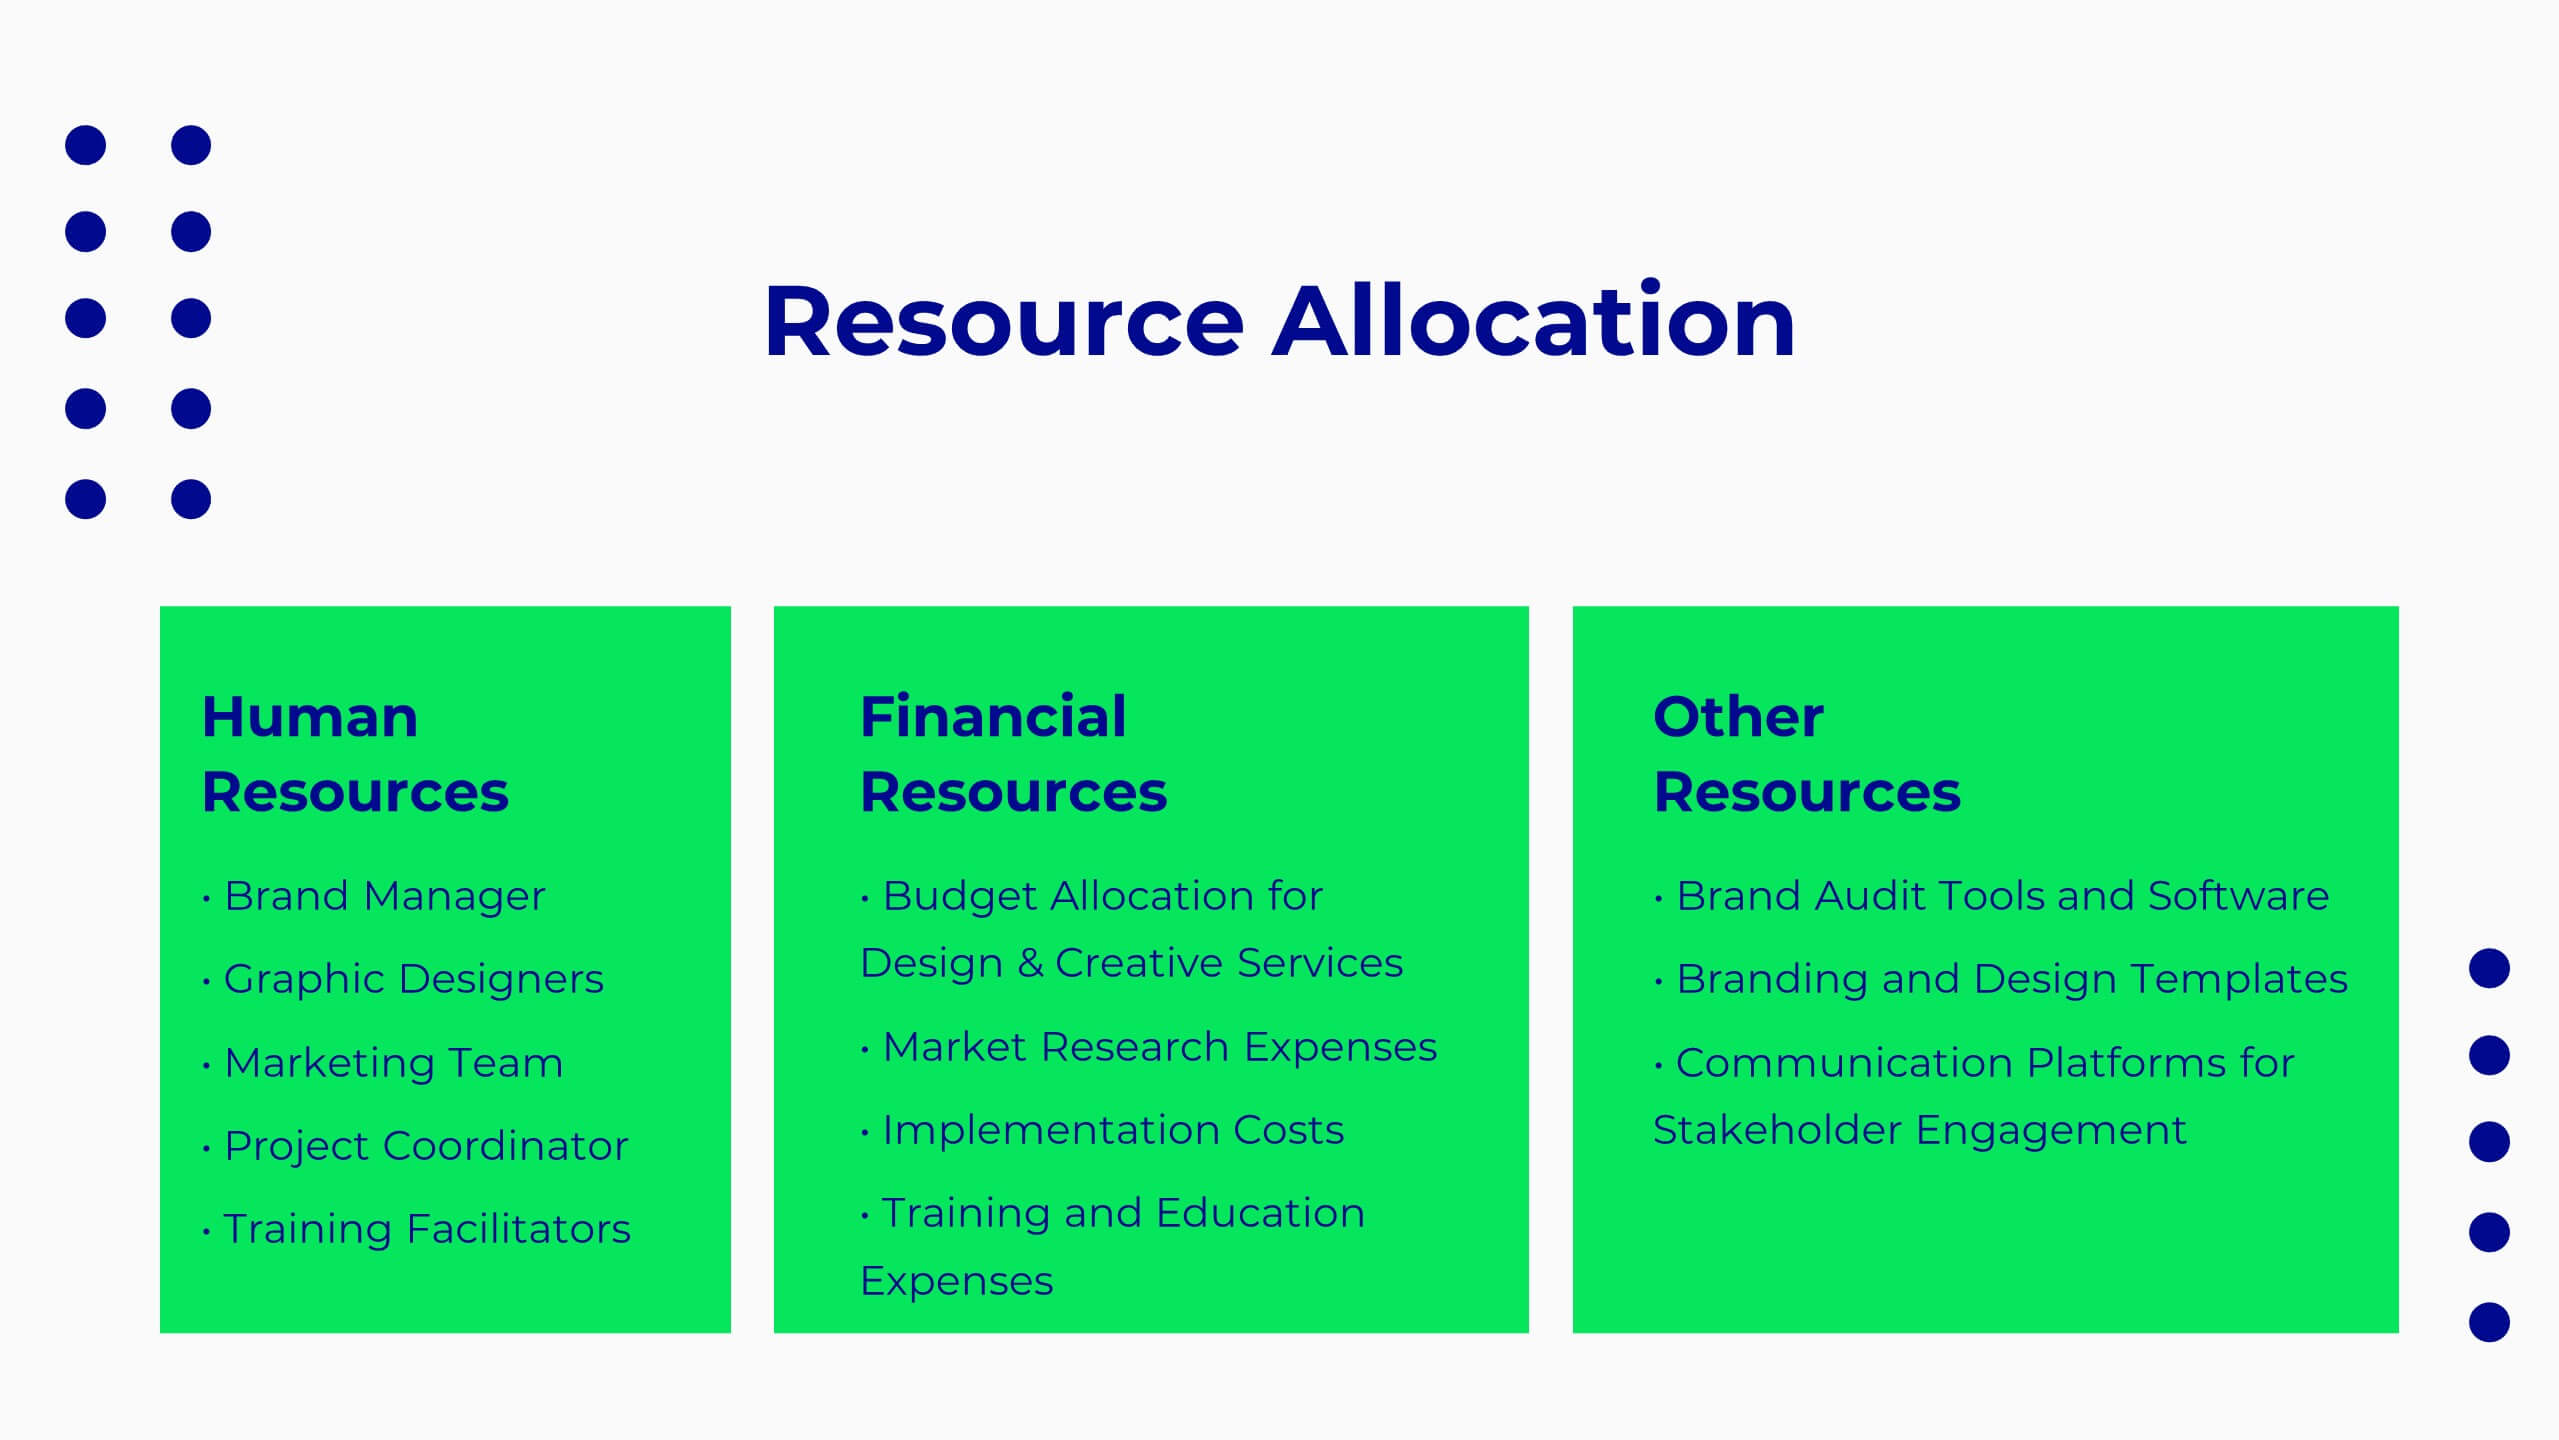
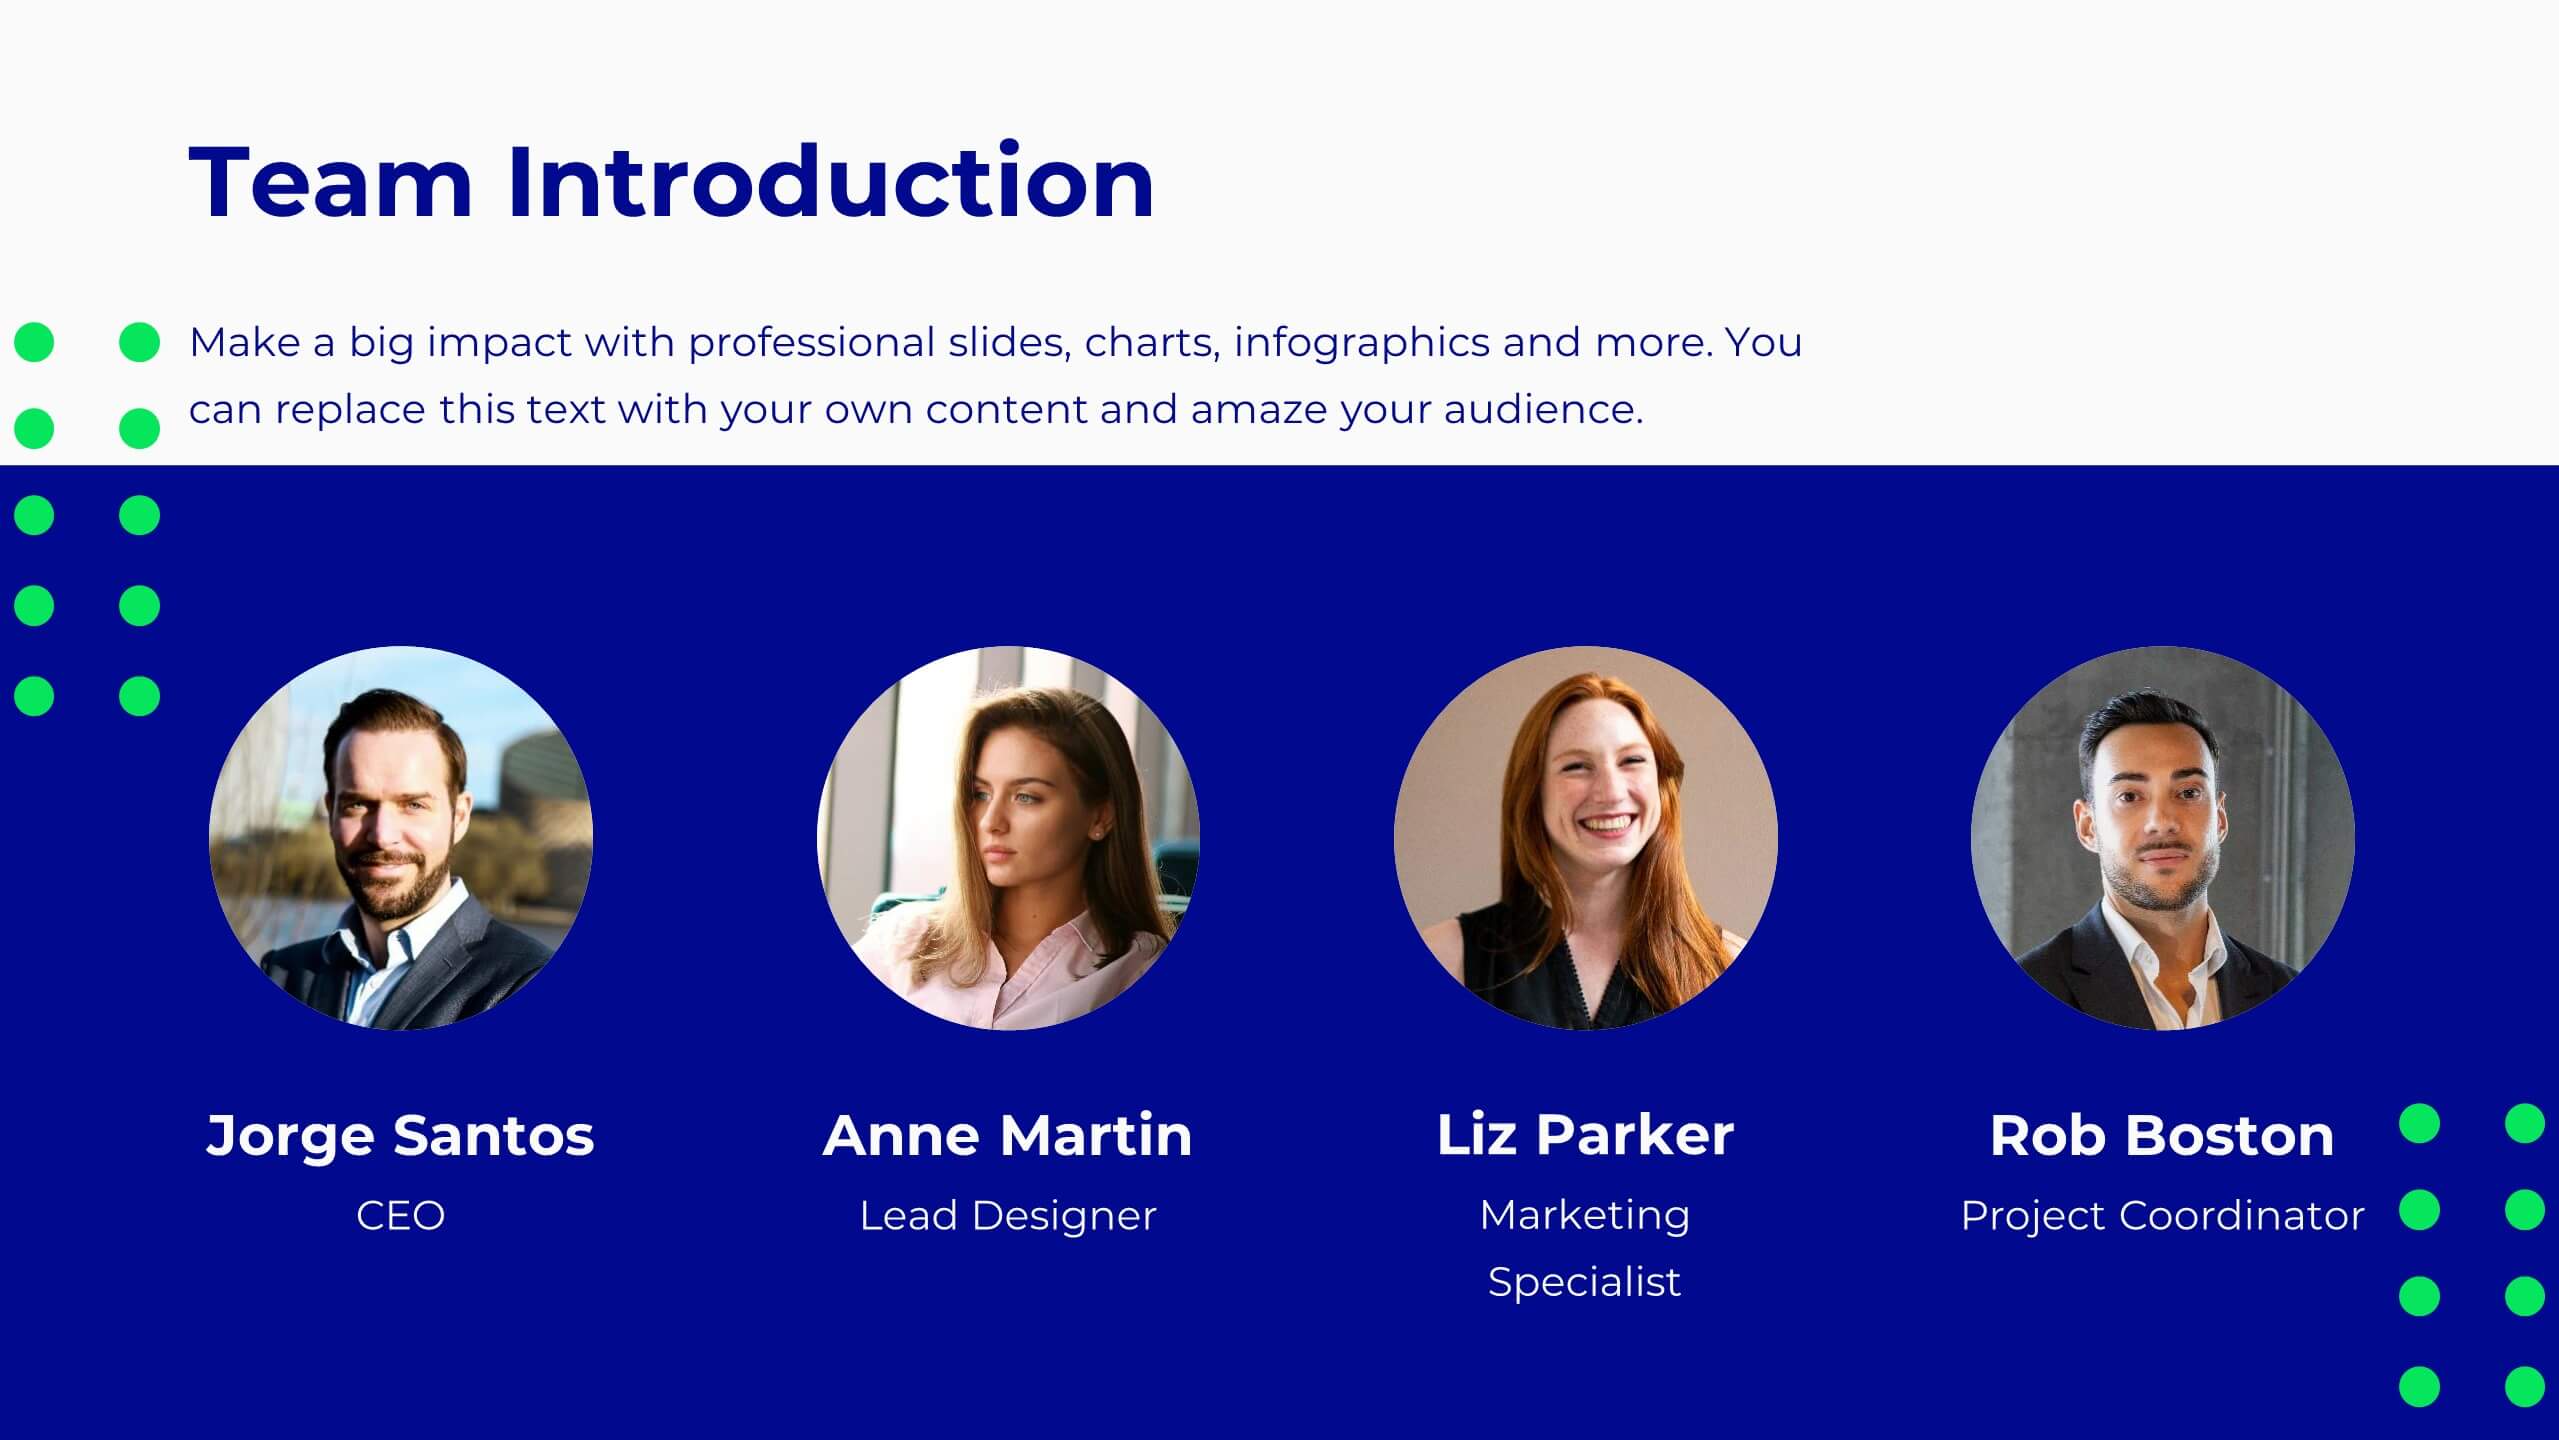
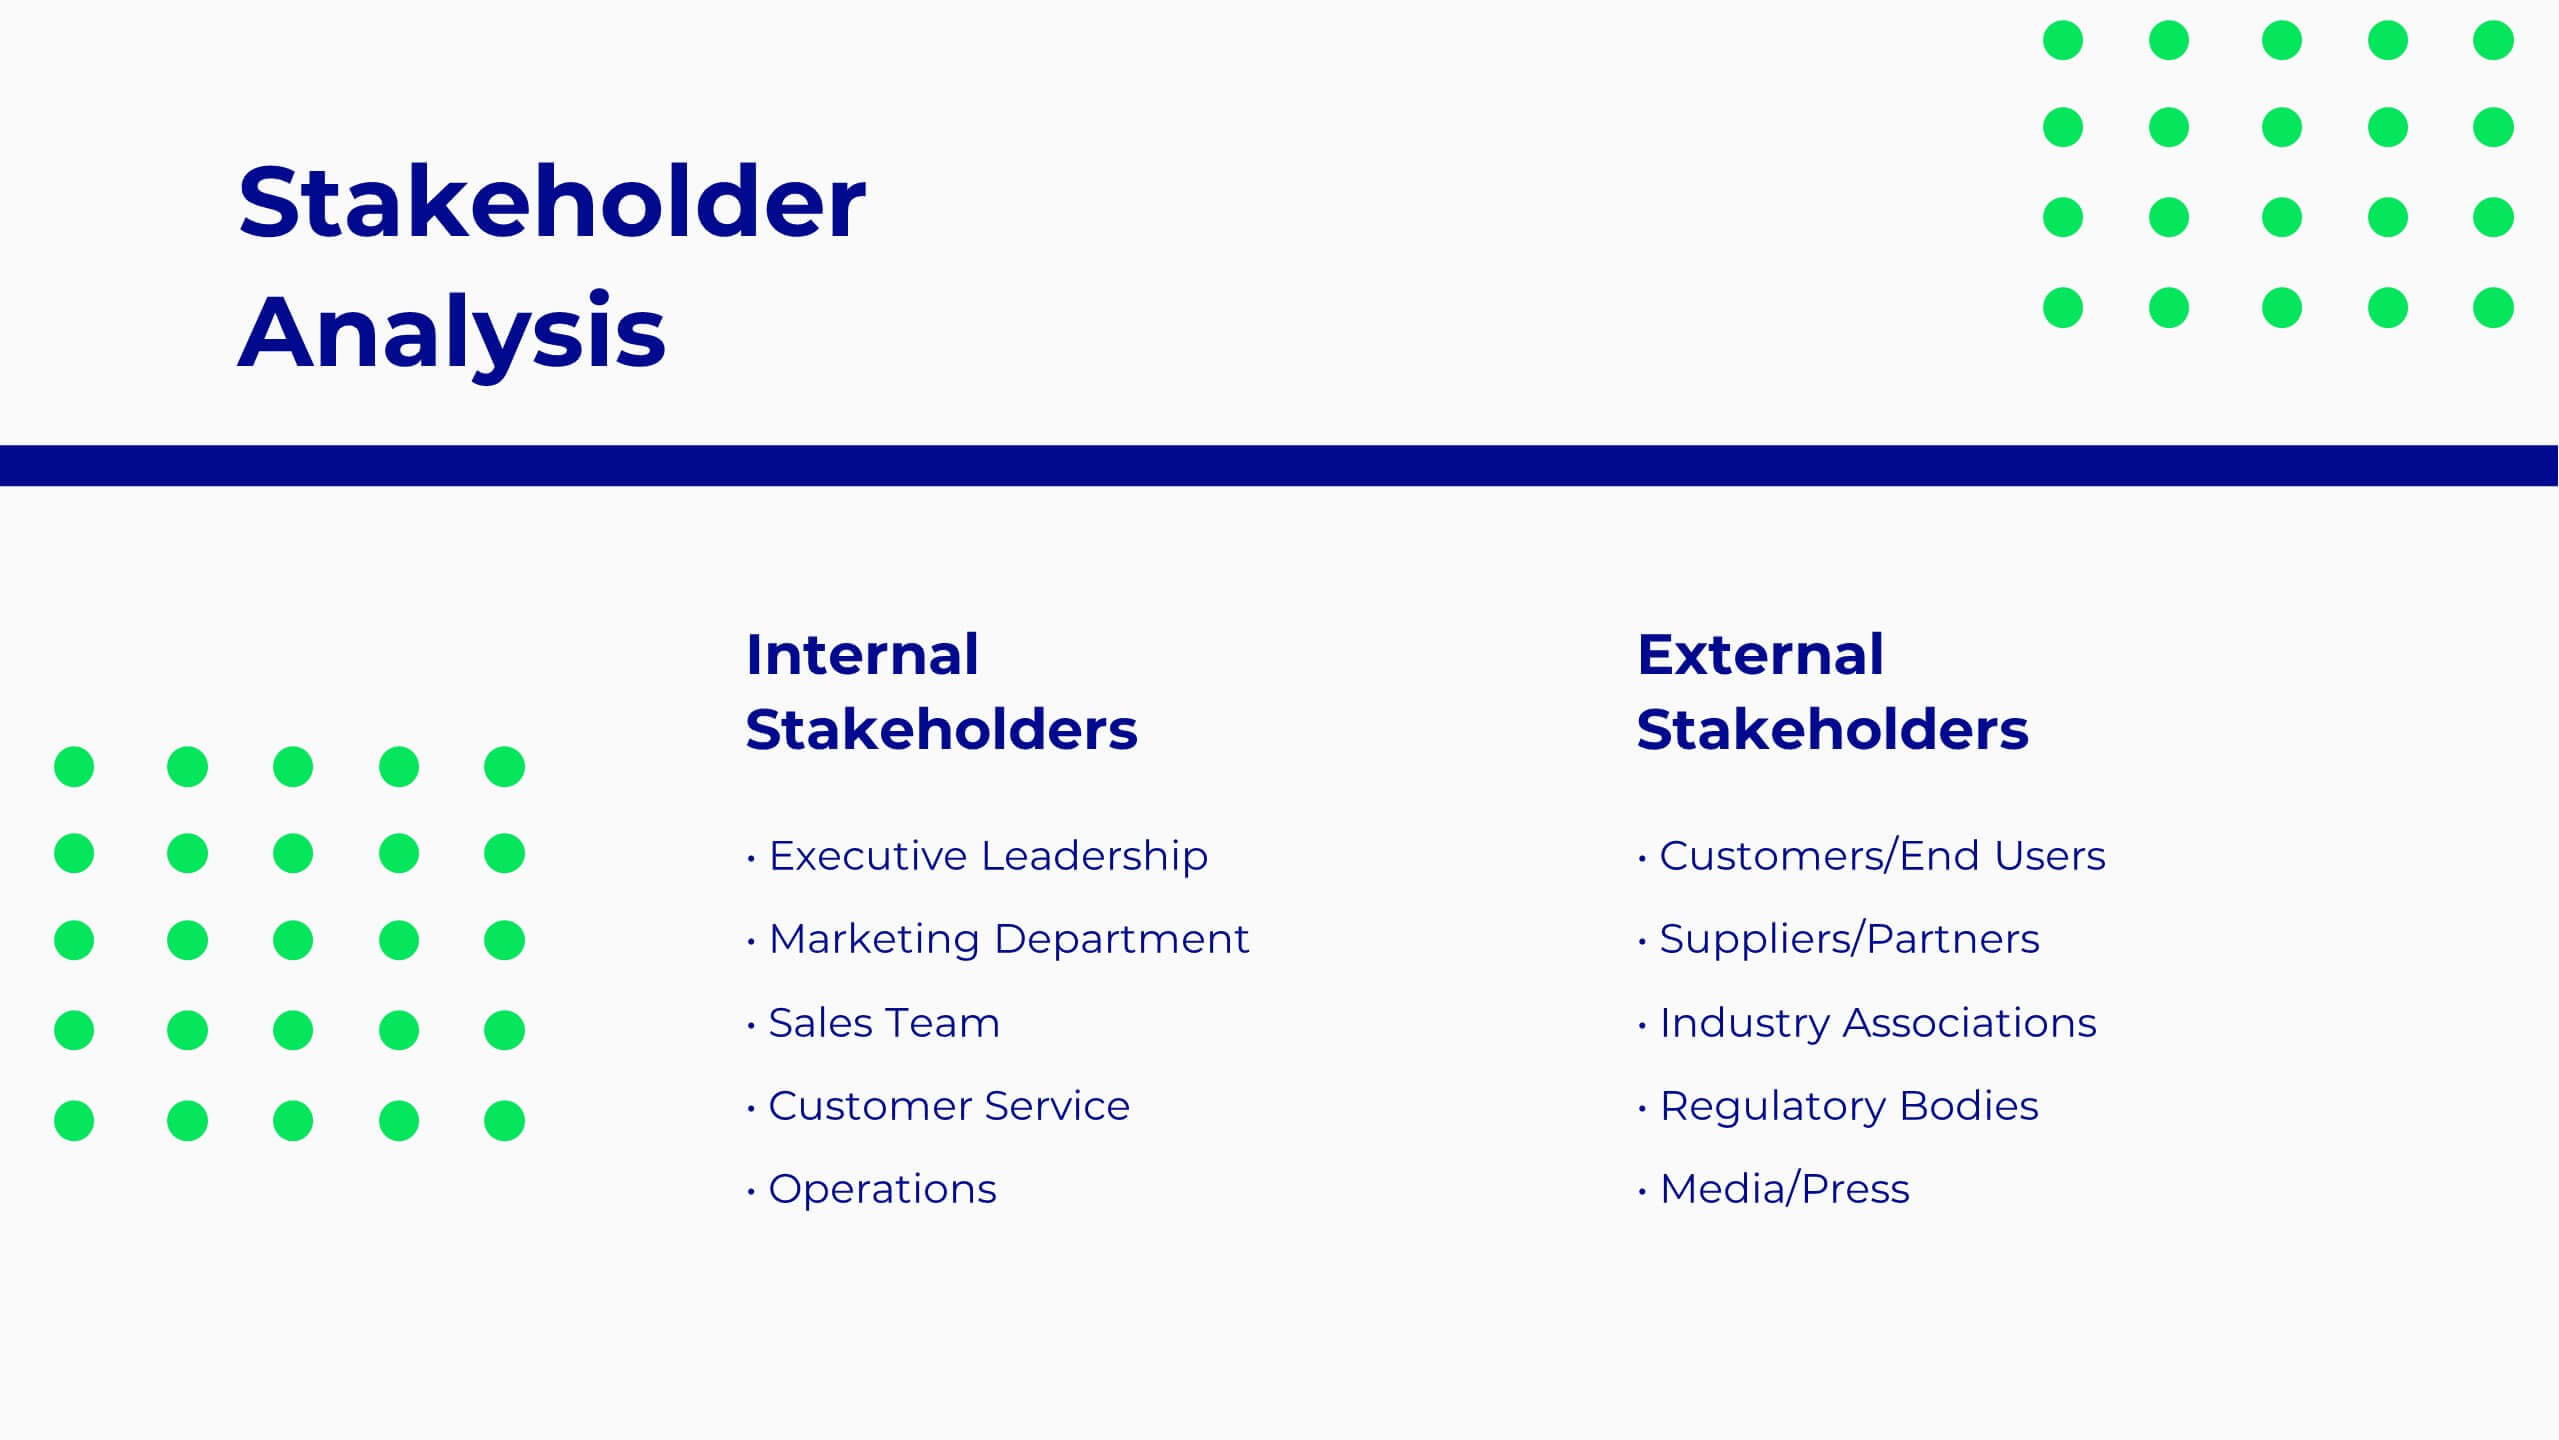
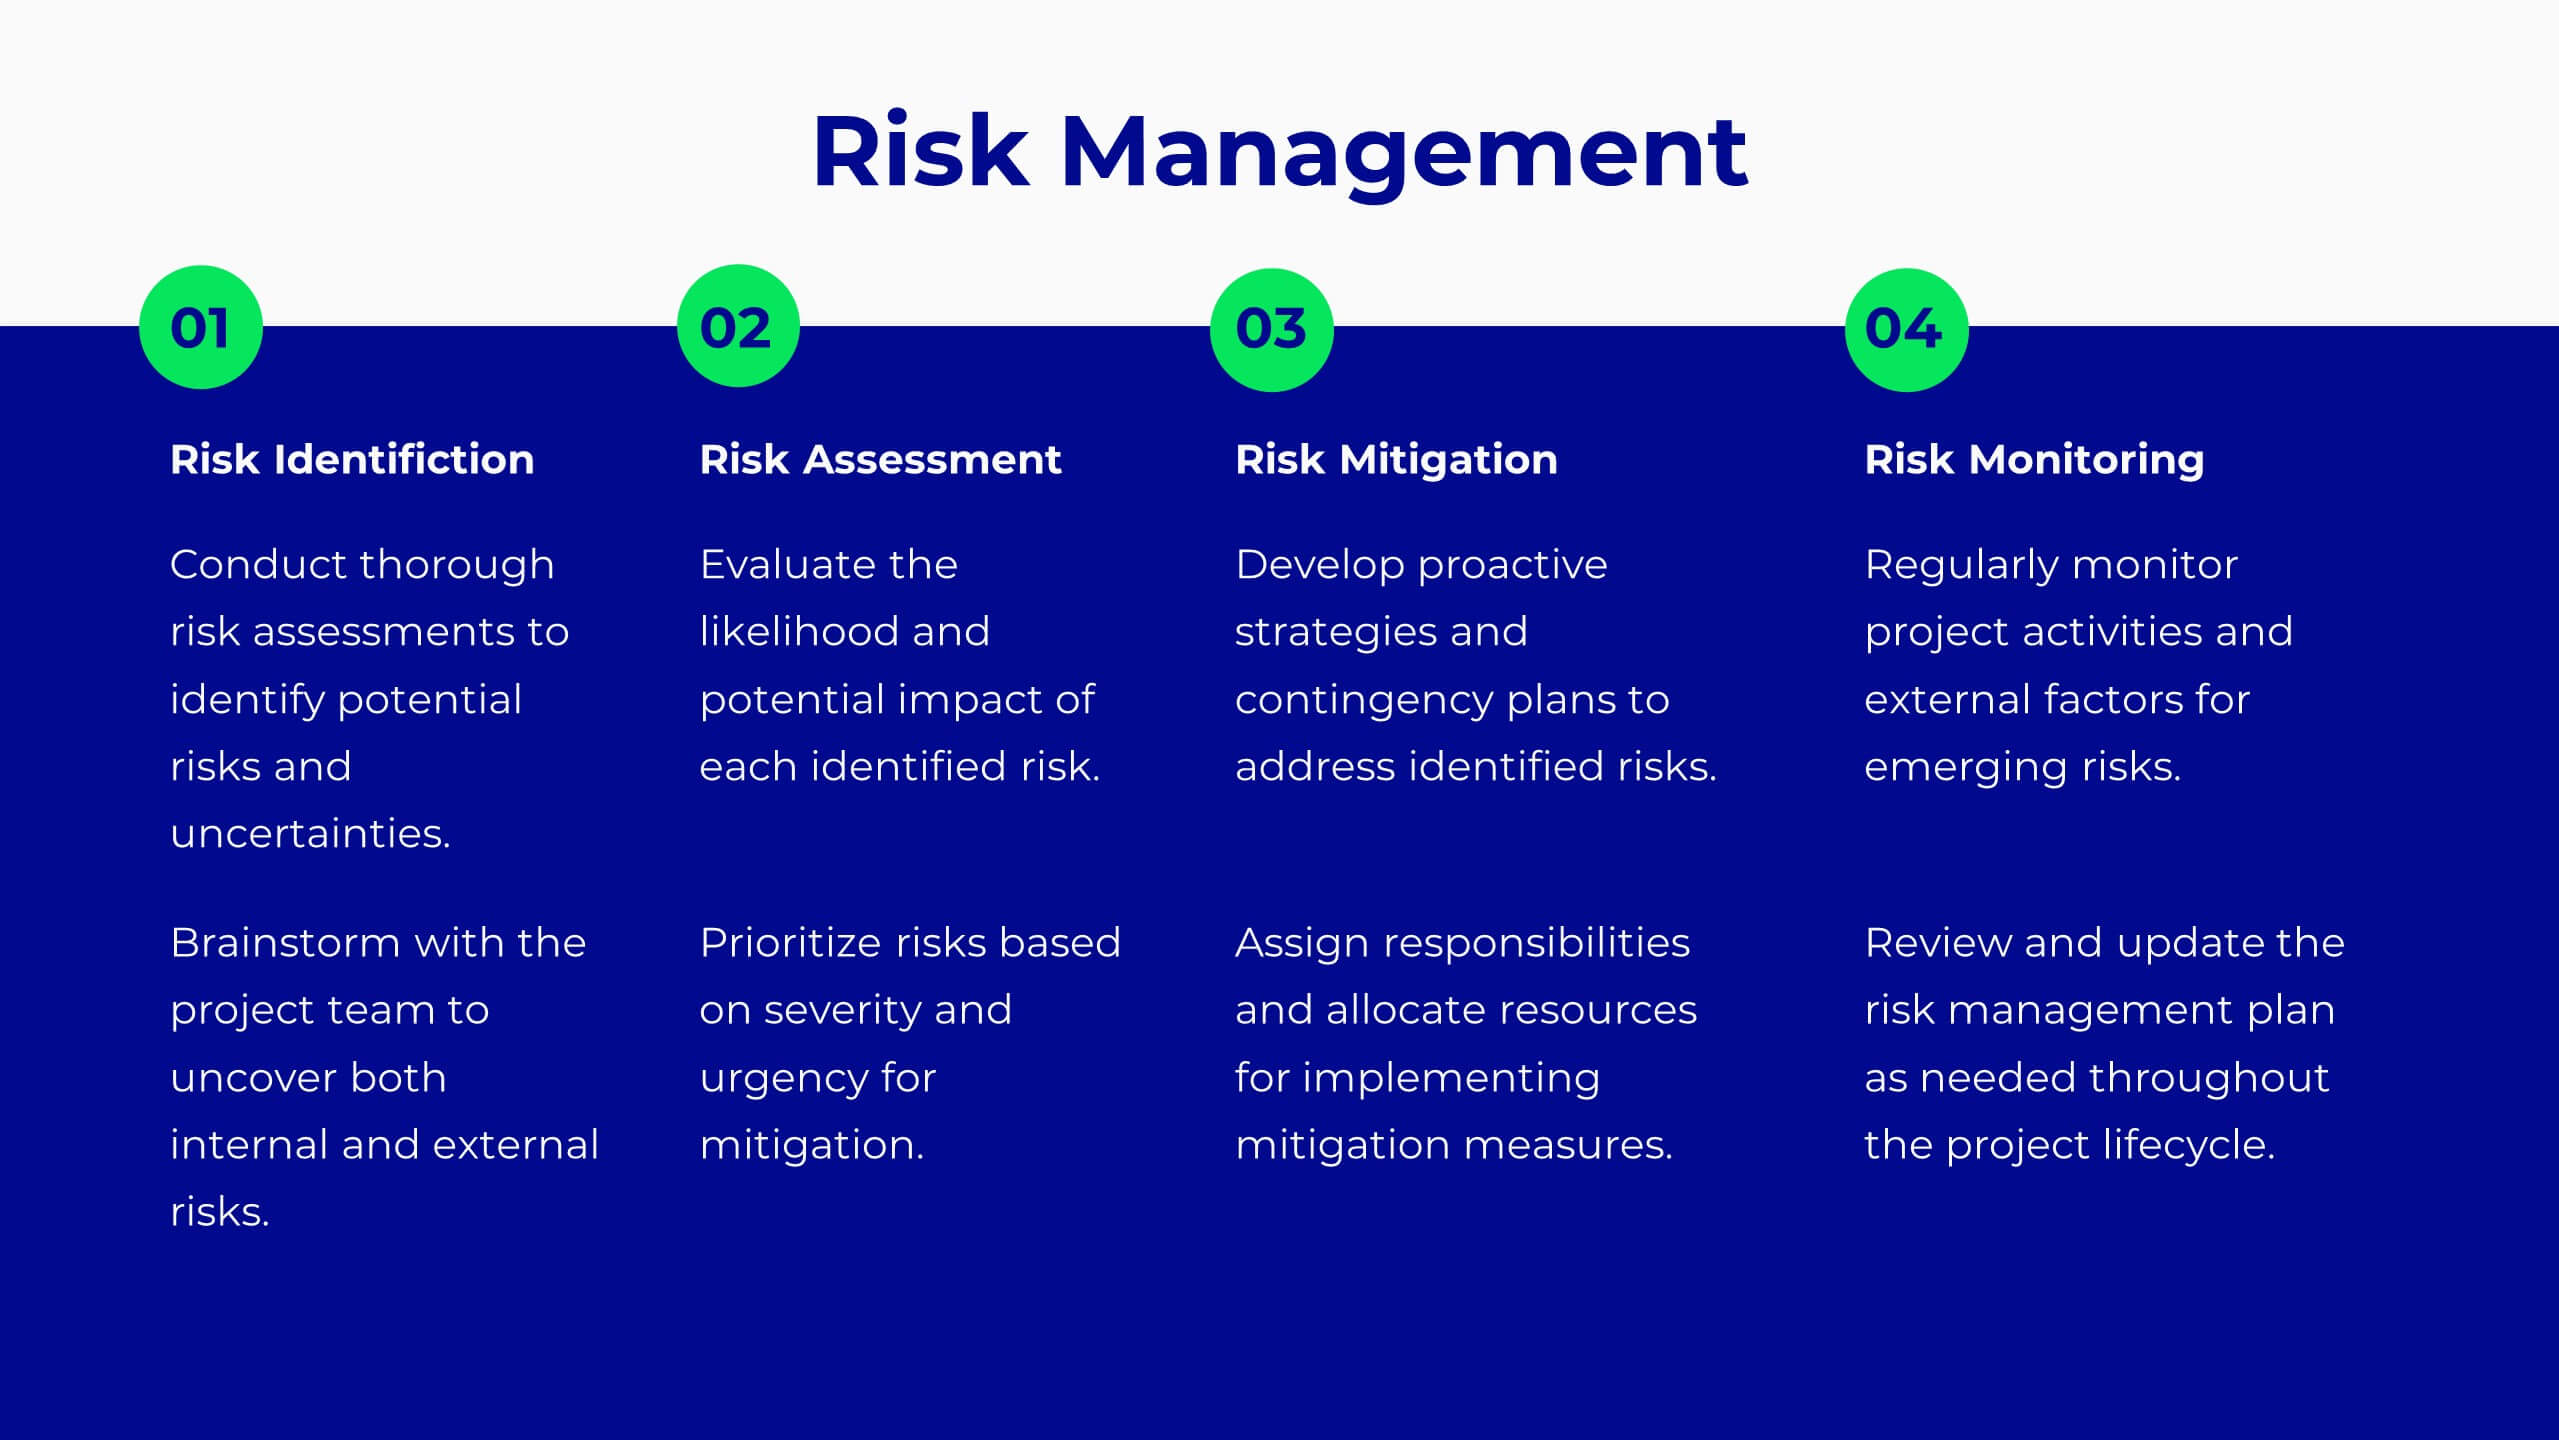
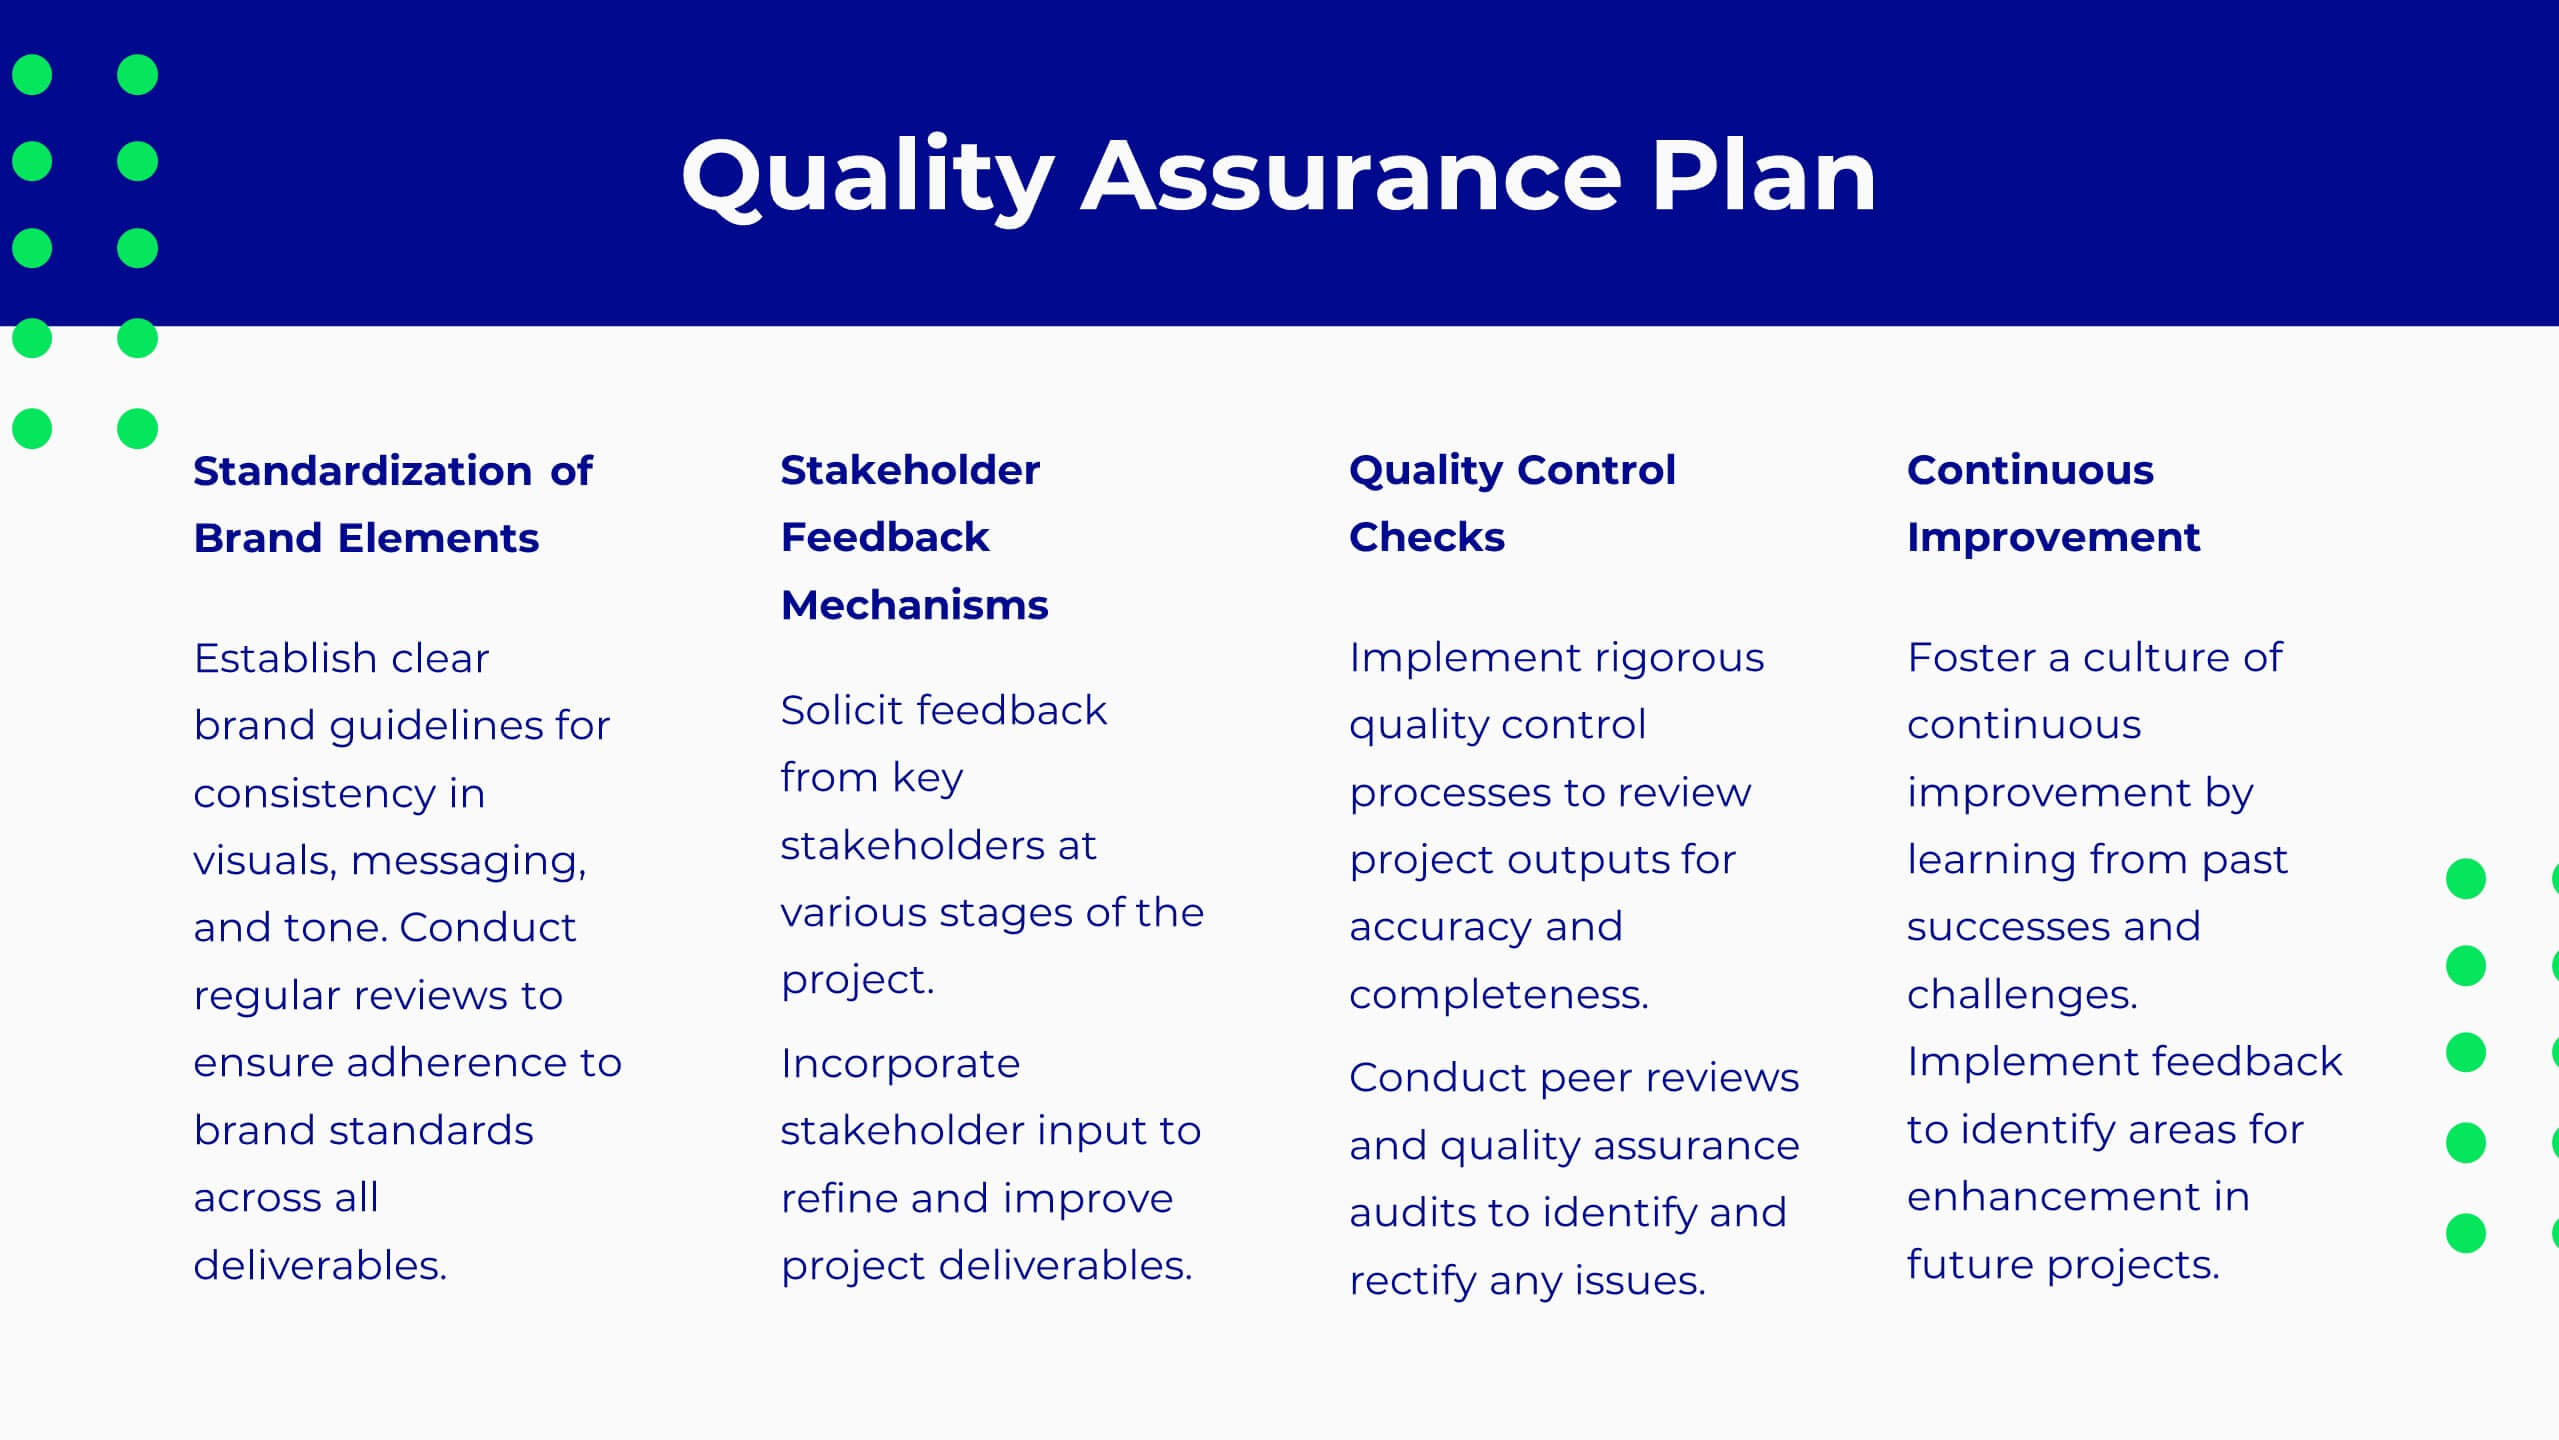
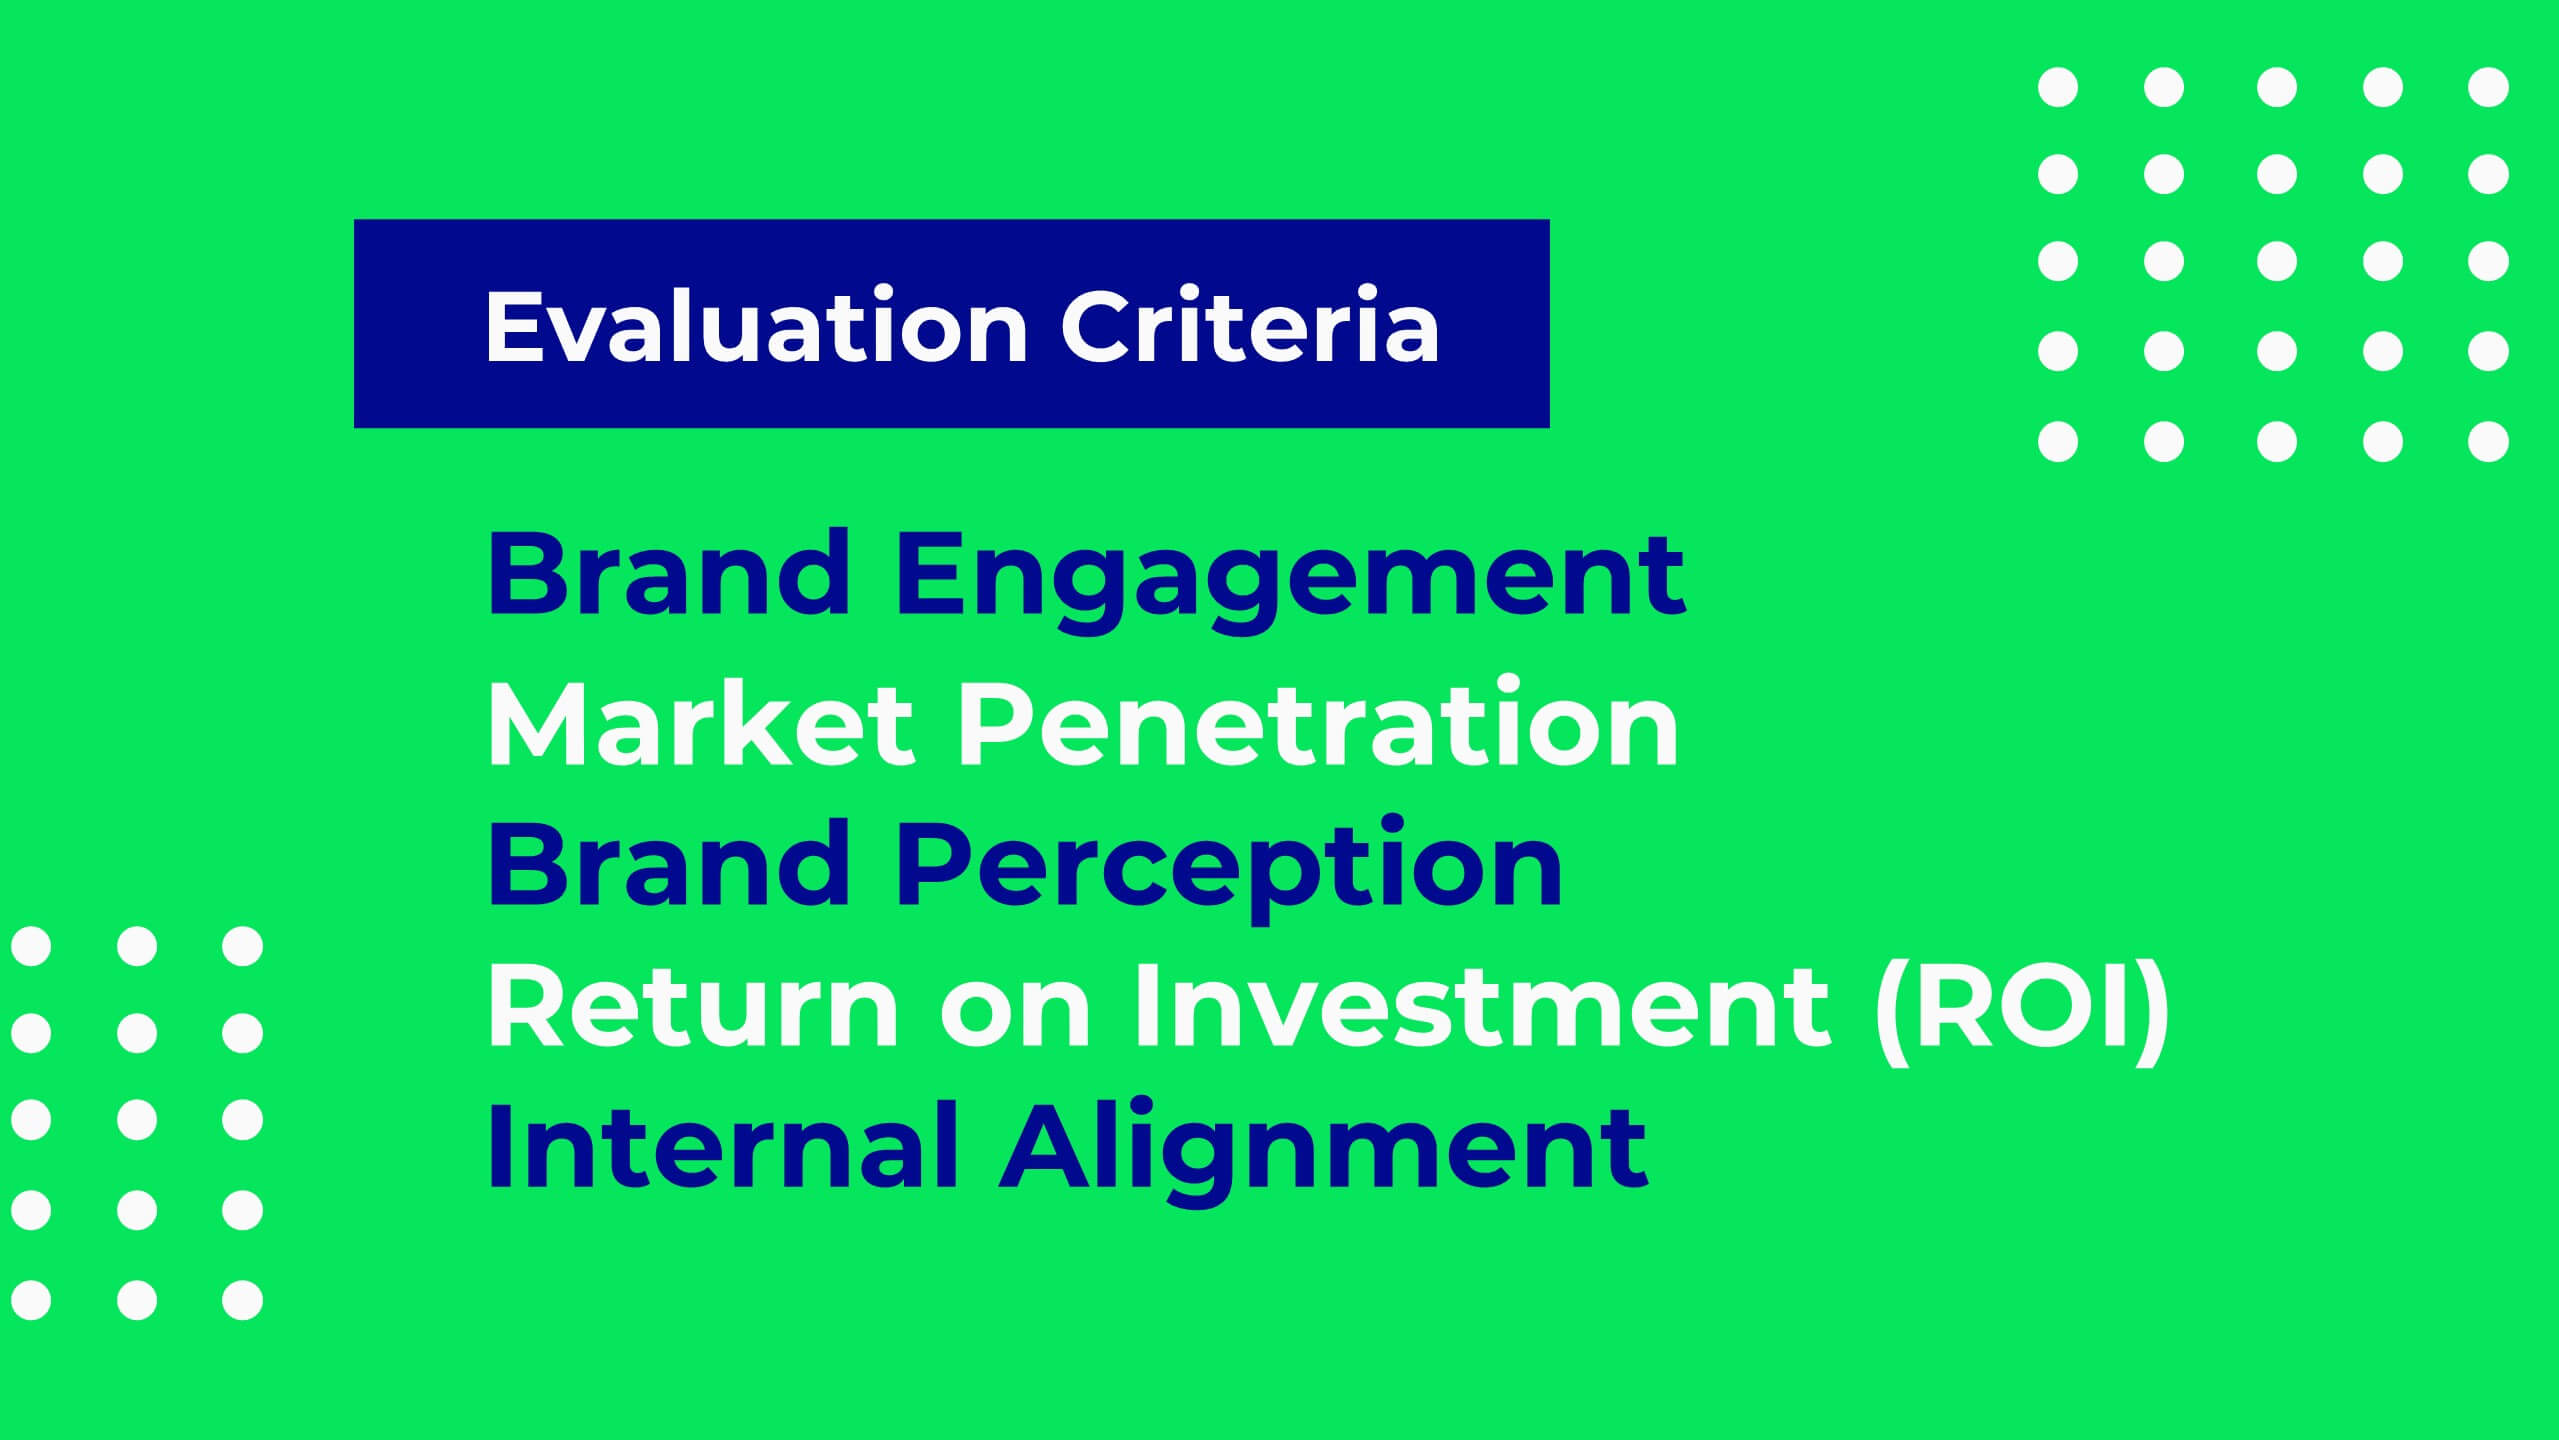
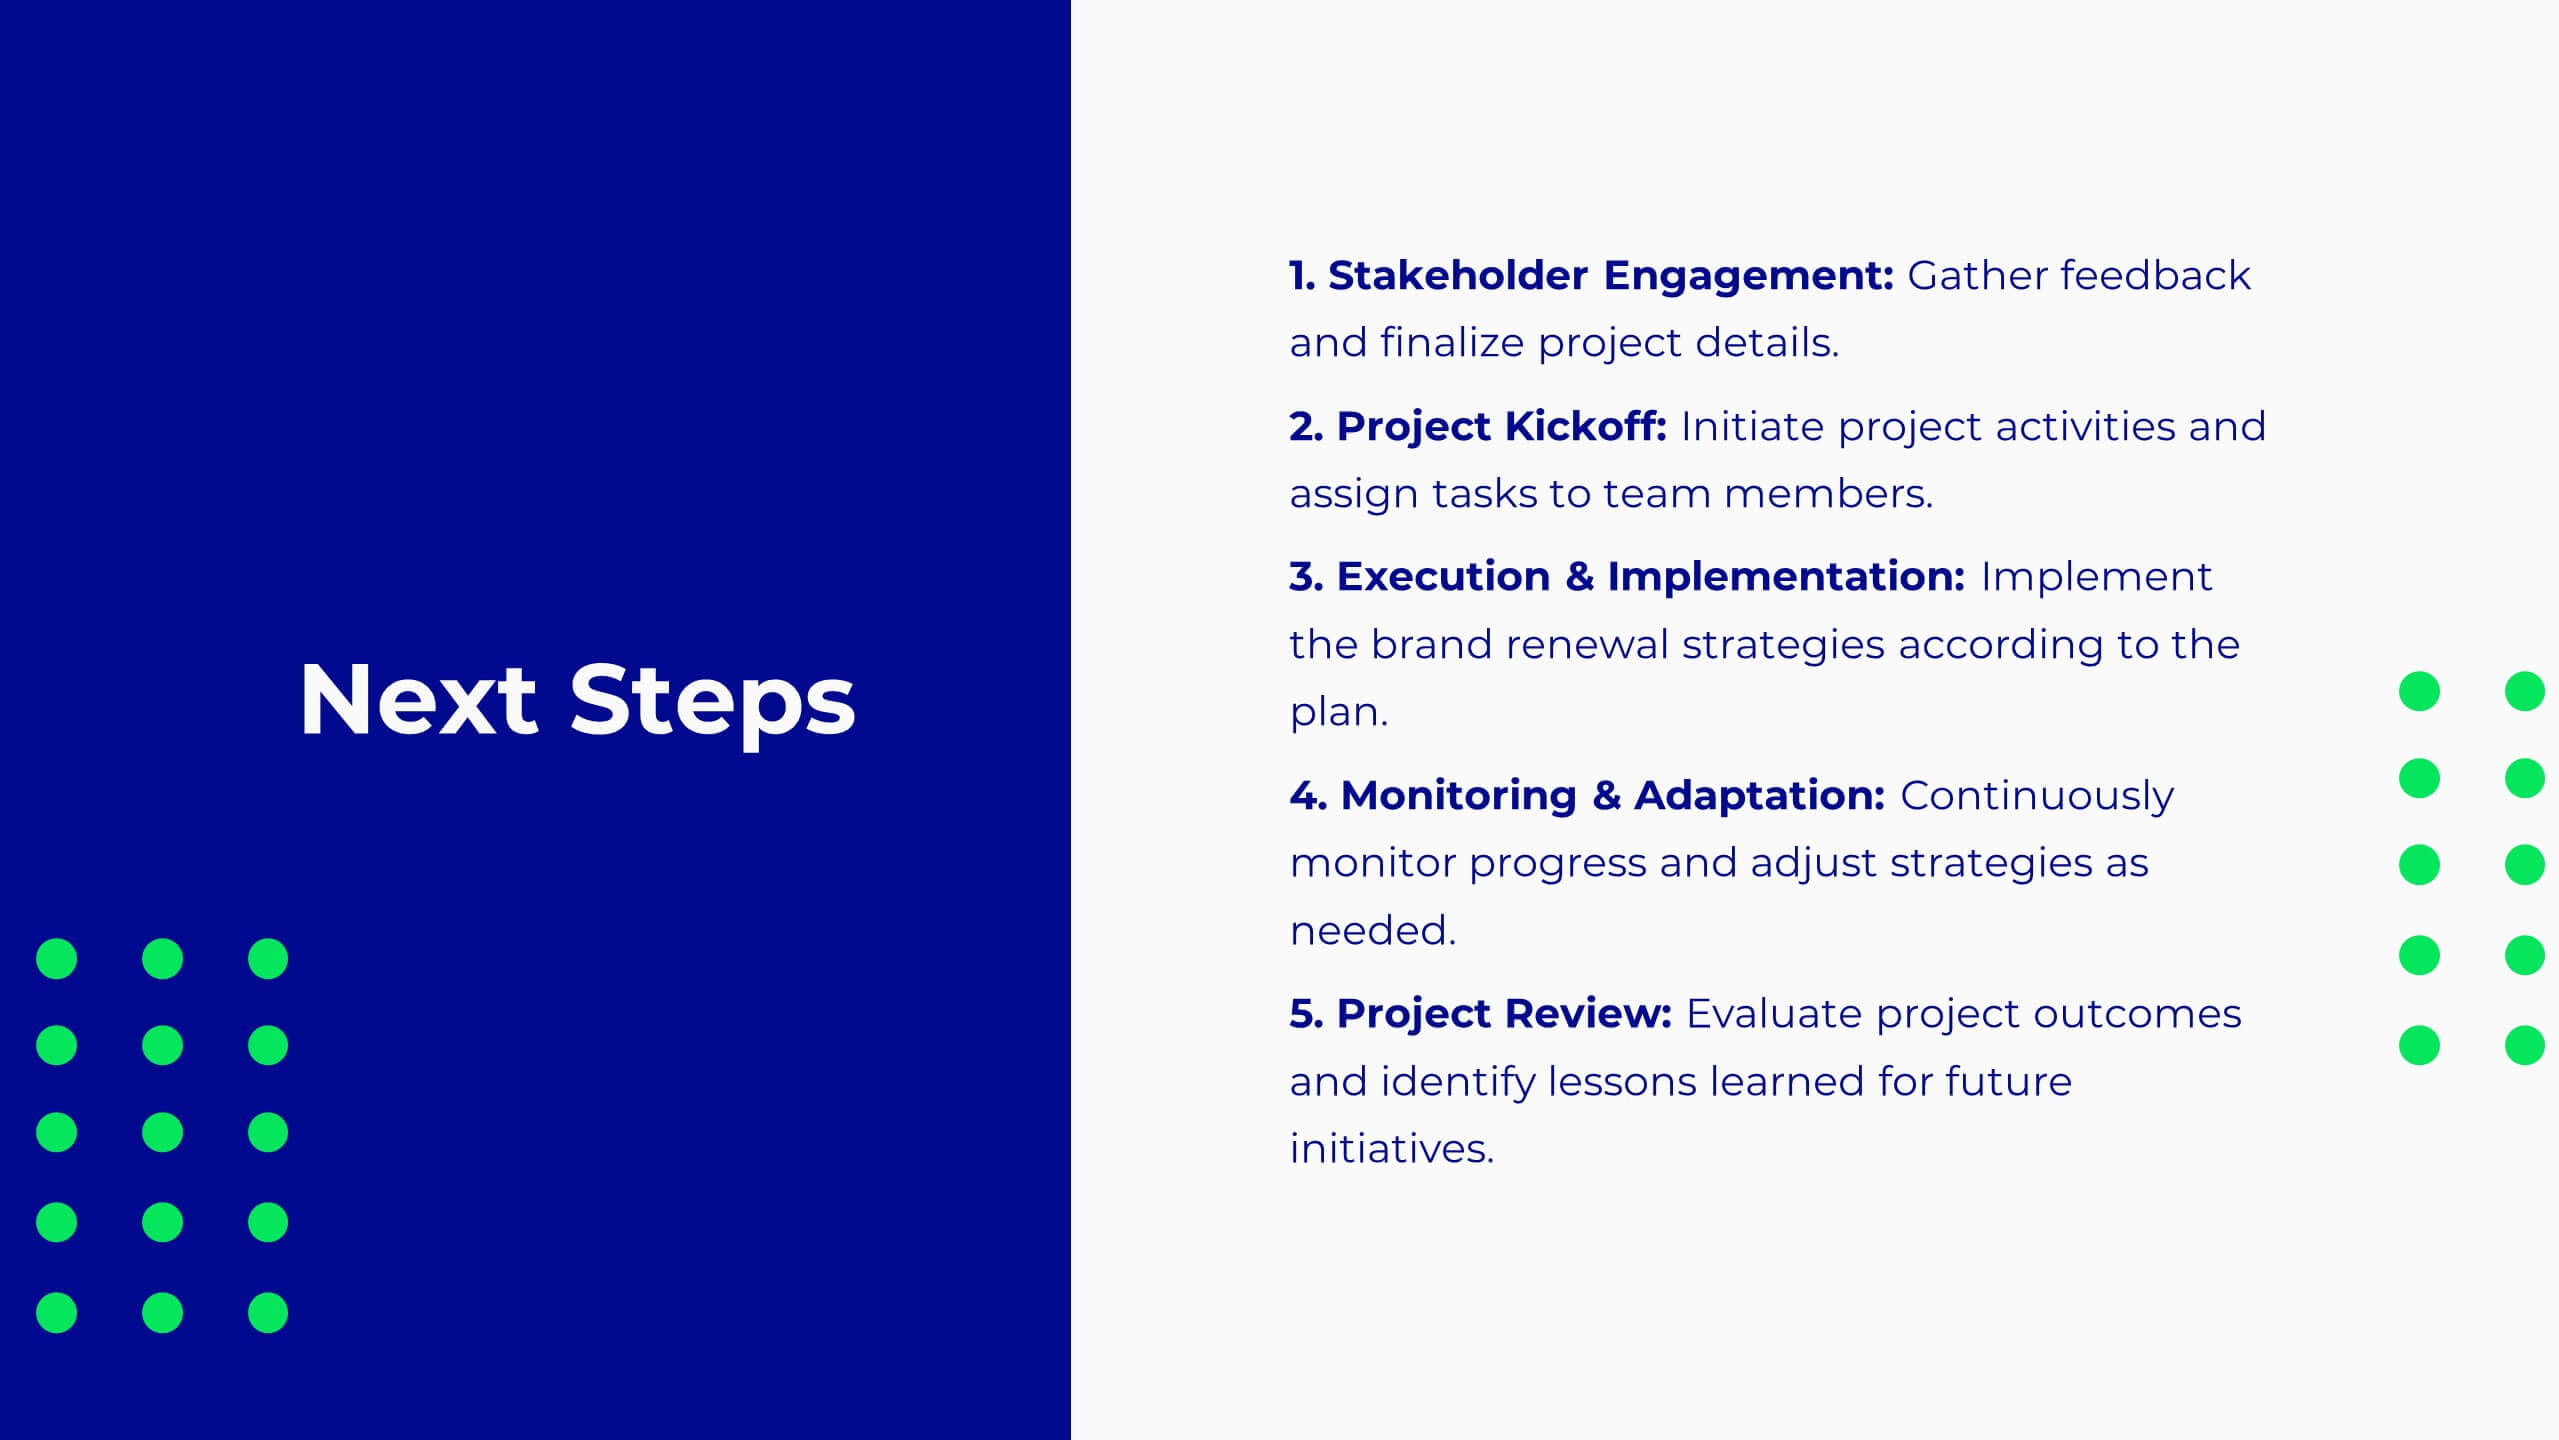
Pulse Project Milestones Report Presentation
Present project milestones effectively with this sleek, professional template. Cover project overview, timeline, and budget. Perfect for defining objectives, scope of work, and resource allocation. Highlight team introductions and stakeholder analysis. Ensure quality with risk management and assurance plans. Compatible with PowerPoint, Keynote, and Google Slides. Elevate your presentations today!


6 diapositivas
Simple TOC Layout for Deck Navigation Presentation
Guide your audience effortlessly with this Simple TOC Layout for Deck Navigation template. Featuring a clean, vertical flow with numbered icons and clear section markers, it’s ideal for organizing multi-part presentations. Fully customizable in Canva, PowerPoint, and Google Slides to match your brand colors and ensure professional, seamless navigation.


2 diapositivas
Client-Oriented Project Proposal Deck Presentation
Deliver polished, persuasive proposals with the Client-Oriented Project Proposal Deck Presentation. Designed to balance visual appeal and clarity, this layout is perfect for consultants, agencies, or freelancers presenting solutions to clients. Includes space for project overviews, photos, and key value points. Fully editable in PowerPoint, Keynote, and Google Slides.


26 diapositivas
Customer Service Bold Presentation
Step into a world where every interaction is more than a service; it's an experience, artfully portrayed in a dynamic series highlighting the essence of customer relations. This vibrant presentation is a bold statement in customer service excellence, where each slide is a burst of sunshine in hues of optimism, communicating the core principles of attentiveness and care. The visuals are a striking blend of modern design and functional aesthetics, spotlighting the human touch that underlies the digital interactions of today's customer-centric landscapes. From the empathetic smiles of service agents to the infographic elucidation of response strategies, the narrative captures the spirit of connection between brand and consumer. It's a testament to the seamless melding of efficiency and warmth, showcasing the art of turning every customer journey into a tale of satisfaction and loyalty. This is the celebration of customer service—not just as a duty, but as a craft, where every detail contributes to a masterpiece of memorable experiences.


5 diapositivas
Dynamic SWOT Quadrant Assessment Presentation
Present your strategy with clarity using the Dynamic SWOT Quadrant Assessment Presentation. This clean, four-quadrant layout organizes your Strengths, Weaknesses, Opportunities, and Threats in a visually balanced format, perfect for strategic reviews and planning workshops. The bold quadrant visuals help guide the audience’s focus while allowing for detailed commentary alongside each factor. Fully customizable in PowerPoint, Keynote, and Google Slides.


8 diapositivas
Concept Mapping with Bubble Map Presentation
Create a visually engaging Concept Mapping with Bubble Map presentation to organize ideas, processes, or strategies effectively. This customizable template enhances clarity in brainstorming sessions, strategic planning, and educational content. Compatible with PowerPoint, Keynote, and Google Slides.


5 diapositivas
Strategic Planning Canvas for Growth
Build a clear roadmap to success with the Strategic Planning Canvas for Growth Presentation. This slide uses a curved timeline layout to showcase five progressive steps, ideal for outlining growth phases, initiatives, or planning milestones. Each stage is paired with a modern icon and text area for key insights. Fully editable in PowerPoint, Keynote, and Google Slides.


6 diapositivas
Career Goals Infographic
Career goals refer to the professional objectives and aspirations that individuals set for themselves to achieve in their chosen careers. This infographic template serves as a powerful tool for individuals to map out their career aspirations, create a clear roadmap, and communicate their goals effectively. This template is designed to articulate and communicate your career aspirations and goals. This infographic provides a clear and organized overview of career objectives, steps for achieving those goals, and key milestones along the way. Compatible with Powerpoint, Keynote, and Google Slides.


7 diapositivas
Team Meeting Infographic Presentation
Are you looking for a fun and engaging way to present your next business meeting? Look no further than our new team meeting infographics template! With our template, you can add a touch of creativity to your presentation with a colorful illustration infographics. Whether you're student making a business presentation or a manager looking to engage your workers in your next meeting. With these simple easy to use infographics, you'll be able to create a top-quality presentation in no time with great engaging visuals. So why wait? Take your team meetings to the next level with our amazing template today!


7 diapositivas
Project Management Tools Infographic
Project management is the discipline of planning, organizing, securing, and managing resources to achieve specific goals within a defined time frame and budget. This visually appealing and informative template allows you to represent project lifecycles, key milestones, team roles, and more, making complex project data easily digestible. Fully customizable and compatible with Powerpoint, Keynote, and Google Slides. Illustrate the project lifecycle from initiation to completion for a comprehensive understanding. Utilize this template to effectively show project progress and objectives, ensuring your audience is informed throughout the project's lifecycle.


6 diapositivas
Employee Welcome and Orientation Guide Presentation
Welcome new hires with clarity using the Employee Welcome and Orientation Guide Presentation. Featuring a timeline-style layout with flag icons, this design helps outline key onboarding stages—from introductions and training to policies and first-week expectations. Easy to customize in Canva, PowerPoint, Keynote, or Google Slides for a smooth employee experience.