


Características


¿Tienes alguna pregunta?
Recomendar


26 diapositivas
From Side Projects to Startups Presentation Template
Elevate your entrepreneurial journey with this vibrant and adaptable presentation template, designed to take your side project to startup success. Featuring bold colors and clean layouts, the slides are crafted to effectively highlight your ideas, strategies, and progress. The template includes infographics, timelines, and charts to present complex information clearly and concisely. It also offers dedicated sections for team introductions, market analysis, and financial projections, ensuring a comprehensive narrative. Fully customizable to match your branding, you can adjust fonts, colors, and layouts to reflect your unique vision. This template is compatible with PowerPoint, Google Slides, and Keynote, offering flexibility and ease of use across platforms. Ideal for pitching to investors, presenting at events, or structuring your internal plans, this tool helps you communicate your message with clarity and style. Turn your vision into reality with a design that inspires confidence and drives impact.


7 diapositivas
Remote Work Guidelines and Setup Presentation
Bring clarity to your remote work setup with this sleek visual guide—designed to communicate processes, tools, and best practices in one easy-to-follow layout. Whether you're onboarding a team or streamlining operations, this slide helps break it all down step by step. Fully compatible with PowerPoint, Keynote, and Google Slides.


4 diapositivas
Fishbone Diagram for Root Cause Analysis
Dive into the source of any problem—literally. This fishbone diagram template offers a smart and visual way to map out causes leading to a business issue, helping teams brainstorm solutions effectively. Ideal for workshops, meetings, and audits. Easily editable in PowerPoint, Keynote, and Google Slides.


5 diapositivas
Customer Feedback and Review Presentation
Showcase customer feedback trends with the Customer Feedback and Review infographic. Featuring a dynamic timeline with emotion-based ratings, this template helps visualize satisfaction levels, key insights, and areas for improvement. Fully customizable and compatible with PowerPoint, Keynote, and Google Slides.


7 diapositivas
Market Research Data Insights
Present insights with impact using this Market Research Data Insights slide. Featuring six circular data points with icons and space for strategic commentary, it's ideal for showcasing key findings, trends, or survey results. Fully editable in PowerPoint, Keynote, and Google Slides for versatile use.


4 diapositivas
Artificial Intelligence Strategy Map Presentation
Step into the future with a clean, modern layout that makes complex technology easy to grasp and exciting to explore. This presentation helps you break down emerging innovations, real-world applications, and industry opportunities using clear visuals and structured sections. Fully customizable and compatible with PowerPoint, Keynote, and Google Slides.


7 diapositivas
Positive Feedback Infographic Presentation
A Feedback Infographic presents information related to feedback, including what it is, why it is important, and how to provide and receive it effectively. Feedback is important to help understand performance or behavior and make improvements. This template is designed to help you effectively communicate the importance of feedback and provide tips and strategies for giving and receiving it. This template is compatible with Powerpoint, Keynote, and Google Slides, allowing you to easily add your images and data to illustrate your points, and customize content to fit your specific needs.


5 diapositivas
5-Level Smile Rating Presentation
Give your audience a fun, visual way to understand sentiment with this colorful rating slide. Perfect for feedback summaries, project reviews, or performance insights, it displays five clear emotion levels in a simple, engaging format. Easy to customize and fully compatible with PowerPoint, Keynote, and Google Slides.


5 diapositivas
Meeting Schedule and Agenda Layout Presentation
Plan, track, and communicate multi-day meetings with this Meeting Schedule and Agenda Layout presentation. Ideal for organizing conference sessions, workshops, or internal team agendas, this layout lets you present key topics by day and time. Clean, structured, and fully editable in Canva, PowerPoint, and Google Slides for easy customization.


20 diapositivas
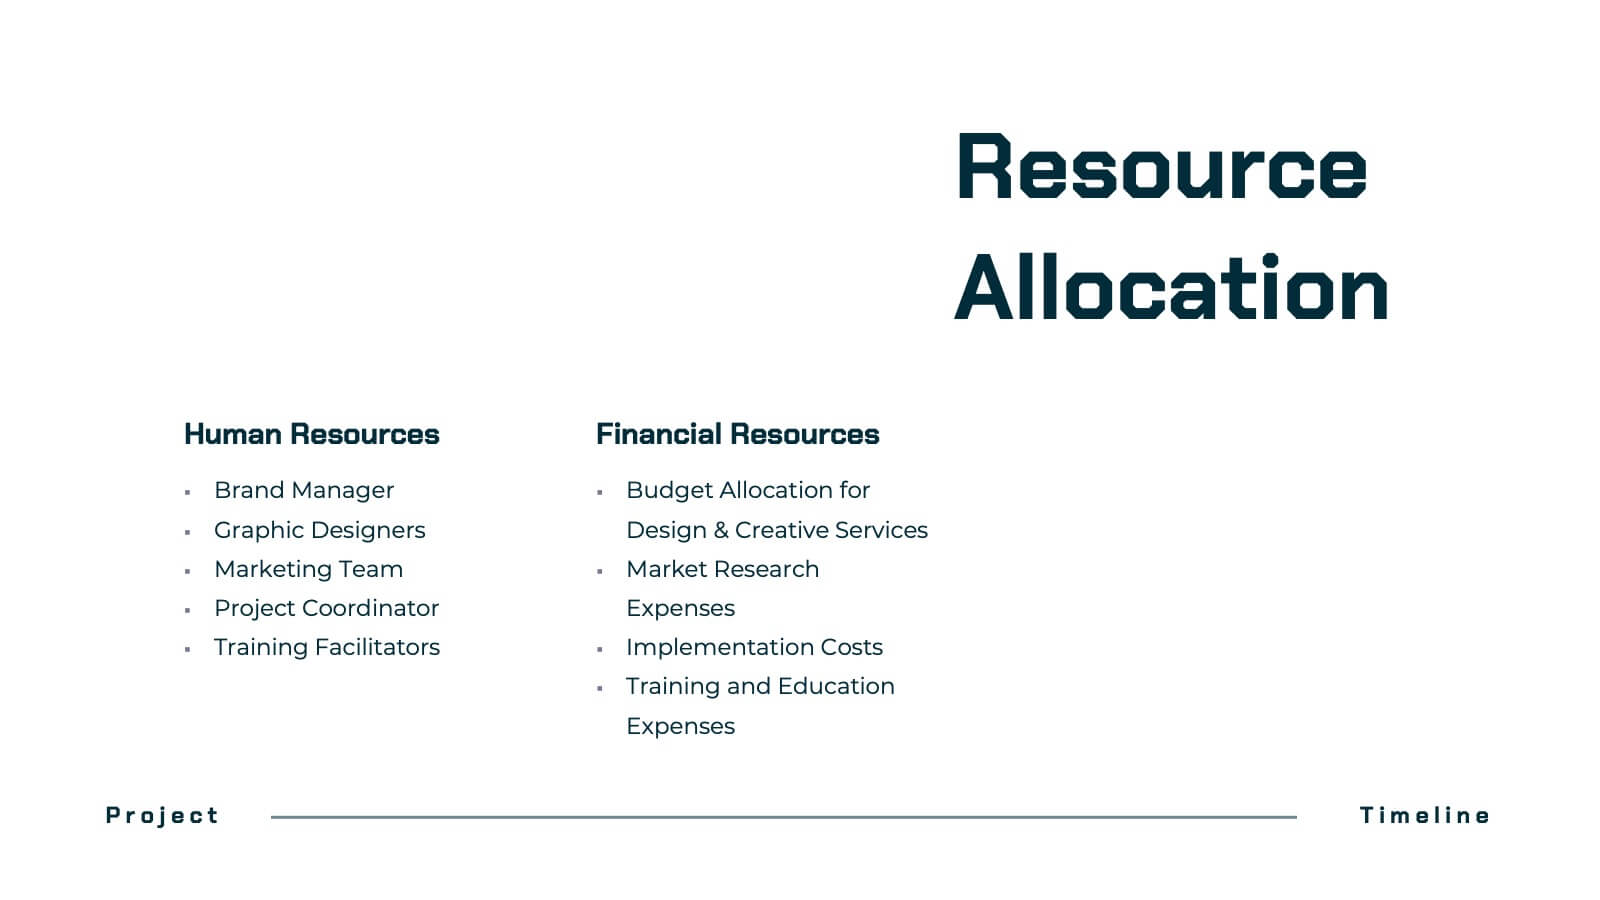
Dynastream Project Timeline Presentation
Stay on track with this detailed and well-organized project plan presentation designed for success! Covering essential areas like scope, objectives, timeline, budget breakdown, and risk management, it ensures every aspect of your project is clear and actionable. Perfect for team meetings or stakeholder updates, this template is fully compatible with PowerPoint, Keynote, and Google Slides.


6 diapositivas
3D Diagram Slide Presentation
Bring your ideas to life with this modern 3D visual layout that adds depth and clarity to any concept. Ideal for breaking down complex information into four connected sections, it enhances understanding through visual hierarchy. Fully customizable and compatible with PowerPoint, Keynote, and Google Slides for effortless use.


6 diapositivas
Safety Department Infographics
Promote safety awareness with our Safety Department infographic template. This template is fully compatible with popular presentation software like PowerPoint, Keynote, and Google Slides, allowing you to easily customize it to illustrate and communicate the role and functions of a safety department within an organization. The Safety Department infographic template offers a visually engaging platform to highlight the responsibilities, goals, and initiatives of a safety department. Whether you're a safety officer, HR professional, business leader, or interested in workplace safety, this template provides a user-friendly canvas to create informative presentations and educational materials. Enhance safety practices and awareness with this SEO-optimized Safety Department infographic template, thoughtfully designed for clarity and ease of use. Customize it to showcase safety protocols, training programs, incident reporting, and the importance of a safety-focused culture, ensuring that your audience understands the critical role of the safety department. Start crafting your personalized infographic today to promote a safer work environment.


5 diapositivas
Pillar-Based Marketing Strategy Presentation
Visualize the foundations of your marketing efforts with our Pillar-Based Marketing Strategy presentation template. This layout helps you define and discuss the critical elements that uphold your marketing campaigns, ensuring clear communication of strategies to your team or stakeholders.


5 diapositivas
Construction Budgeting and Resource Allocation Presentation
Visualize your construction budget layer by layer with the Construction Budgeting and Resource Allocation Presentation. This pyramid-style infographic breaks down costs and resources—from materials and labor to safety infrastructure—making it easy to communicate project allocations. Fully editable in PowerPoint, Keynote, and Google Slides.


6 diapositivas
Business Triangle Model Presentation
Visualize the core components of business success with the Business Triangle Model template. This structured framework highlights three interconnected elements, making it ideal for strategic planning, risk assessment, and performance analysis. Customize it effortlessly to suit your needs. Compatible with PowerPoint, Keynote, and Google Slides for seamless integration.


12 diapositivas
Customer Demographics Map Presentation
Showcase customer demographics effectively with our "Customer Demographics Map Presentation" template. This infographic is crafted to display the geographical distribution of customer data across the United States, using a color-coded map for clarity. Each state is marked to represent varying metrics like age, income, or product preference, facilitating easy visual comparisons and insights into market trends. Ideal for marketers, business analysts, and data scientists, this template simplifies complex demographic data for strategic presentations. It enhances understanding of customer bases and market segmentation. Compatible with PowerPoint, Keynote, and Google Slides, it's essential for detailed demographic analysis in any professional presentation.


10 diapositivas
Human Resources Process Diagram
The "Human Resources Process Diagram" presentation template is designed to streamline the visualization of the HR process from analysis to evaluation. This template allows for a detailed display of the stages involved in HR processes, such as analyzing, designing, developing, implementing, and evaluating, making it ideal for training sessions, strategic HR presentations, and management meetings. The circular flow of the diagram emphasizes the continuous and interconnected nature of HR activities, facilitating better understanding and communication of complex processes. Each segment is color-coded for easy identification and reference, enhancing both the aesthetic appeal and the functionality of the presentation.