


Características


¿Tienes alguna pregunta?
Recomendar


5 diapositivas
Teaching Strategy for Classrooms Presentation
Make classroom planning more engaging with the Teaching Strategy for Classrooms Presentation. This stacked book-style layout is ideal for outlining instructional steps, lesson phases, or teaching priorities. Perfect for teachers, education trainers, or curriculum planners. Fully editable in PowerPoint, Keynote, Canva, and Google Slides.


6 diapositivas
Medical Technologies Infographics
Explore the forefront of medical technology with this informative and sleek infographic template, tailored for professionals and students in the medical field. This template effectively presents key advancements and projects in medical technology, using a modern and clear design that is easy to follow. The slides are organized to detail different aspects of technology in healthcare, such as innovation in patient care, technological integration into existing systems, and future trends in the industry. Each section uses vibrant graphics and concise text to highlight important data and statistics, ensuring the information is both accessible and engaging. The color scheme is professionally chosen to represent trust and clarity, utilizing shades of blue and red to differentiate topics effectively. This not only enhances readability but also aligns with the themes of healthcare and technology. This template is a perfect tool for presenting at conferences, in educational settings, or during professional meetings where understanding the impact of technology on healthcare is crucial. It helps to convey complex information in a structured and visually appealing manner, making it an invaluable resource for anyone involved in the health technology sector.


6 diapositivas
Six Sigma Process Infographic
Dive into the world of process improvement with our six sigma process infographic. Crafted with a harmonious blend of blue, yellow, and white, this infographic elucidates the principles of Six Sigma methodology in an engaging manner. Ideal for business analysts, quality assurance teams, and corporate trainers, it delineates the DMAIC process in vivid detail. The design encapsulates the rigorous methodology of Six Sigma, providing clarity and fostering knowledge retention. This versatile template is a perfect fit for PowerPoint, Keynote, and Google Slides, making your presentations both captivating and insightful.


6 diapositivas
Building Strong Business Relationships Presentation
Forge successful partnerships with the Building Strong Business Relationships template, crafted to effectively communicate the key elements of corporate collaboration and networking. With structured content areas and dynamic graphic elements, this template effectively presents business strategies. It's compatible with PowerPoint, Keynote, and Google Slides, making it versatile for various professional settings.


7 diapositivas
Tables of Content Infographic Presentation Template
A table of contents infographic can serve as a visual representation of the content outline and help to convey the overall structure and organization of the information. This template displays the headings and subheadings of the document, along with the page numbers or slide numbers, in an easy-to-follow format. The purpose of our table of contents infographic template is to provide an overview of the content and help you navigate the presentation more efficiently. It is often used in academic papers, reports, magazines, and books, and can also be used in digital documents and presentations.


6 diapositivas
Platinum Credit Card Benefits Infographics
The "Platinum Credit Card Benefits" infographic template is a perfect blend of elegance and functionality, designed for PowerPoint, Keynote, and Google Slides. This template is ideal for financial institutions, credit card companies, and financial advisors presenting the advantages of platinum credit cards to clients and customers. This sophisticated template highlights key benefits such as reward points, travel perks, insurance benefits, and exclusive offers associated with platinum credit cards. Its sleek design and clear layout make it easy for presenters to convey the premium features of the card in a way that is both appealing and easy to understand. The design features a color scheme with metallic tones and luxurious accents, reflecting the high-end nature of platinum credit cards. This not only enhances the visual appeal of the presentation but also aligns with the premium status of the product being discussed. Whether it's used in client meetings, marketing presentations, or financial workshops, this template ensures that the premium benefits of platinum credit cards are presented in a professional and attractive manner.


4 diapositivas
Internal Meeting Agenda and Notes Presentation
Stay organized and aligned with the Internal Meeting Agenda and Notes presentation template. Designed for clarity and productivity, this layout includes dedicated sections for meeting topics, notes, action items (to-do list), brainstorming, and extra comments. Ideal for team check-ins, project syncs, and internal reviews. Fully editable and compatible with PowerPoint, Keynote, and Google Slides.


5 diapositivas
Tech Stack and IT Infrastructure Presentation
Visualize your systems with this Tech Stack and IT Infrastructure Presentation. Featuring a vertical ribbon layout with five clearly defined segments, it's perfect for illustrating architecture layers, development pipelines, or infrastructure components. Easily editable in Canva, PowerPoint, or Google Slides to match your brand and IT strategy.


5 diapositivas
Digital Marketing Plan Presentation
Build momentum for your online strategy with a clean, structured layout that turns complex ideas into clear, stackable steps. This presentation helps outline goals, channels, and campaign actions in a visual flow that’s easy to follow and adapt. Fully customizable for PowerPoint, Keynote, and Google Slides.


5 diapositivas
Customer Perceived Value Analysis Presentation
Capture the essence of customer perception with this visually engaging template. Designed for businesses aiming to assess and enhance value propositions, it breaks down key insights into digestible segments. Perfect for marketing strategies and consumer behavior analysis, this template is fully compatible with PowerPoint, Keynote, and Google Slides for seamless customization.


5 diapositivas
Demographic and Psychographic Segments Presentation
Break down your audience with clarity using the Demographic and Psychographic Segments Presentation. This slide is ideal for showcasing four key consumer dimensions through a centered circular layout and quadrant icons. Perfect for marketing campaigns, branding strategies, and audience targeting. Fully editable in Canva, PowerPoint, Keynote, or Google Slides.


4 diapositivas
Strategic Triangle Model Slide
Visualize your core pillars with this Strategic Triangle Model Slide Presentation. Featuring a clean triangular layout with three editable segments, this template is perfect for showcasing frameworks such as mission-vision-values, policy-strategy-impact, or key business objectives. Each point of the triangle is paired with an icon and customizable text, making complex concepts easy to digest. Ideal for strategy planning, leadership discussions, or consulting proposals. Fully editable in PowerPoint, Google Slides, and Keynote.


8 diapositivas
Training and Development Onboarding Presentation
Streamline the training and development process for new hires with a structured onboarding funnel. This Training and Development Onboarding template provides a clear, step-by-step visualization of how employees progress through the learning process. Perfect for HR managers, trainers, and corporate educators. Fully editable and compatible with PowerPoint, Keynote, and Google Slides for easy customization.


22 diapositivas
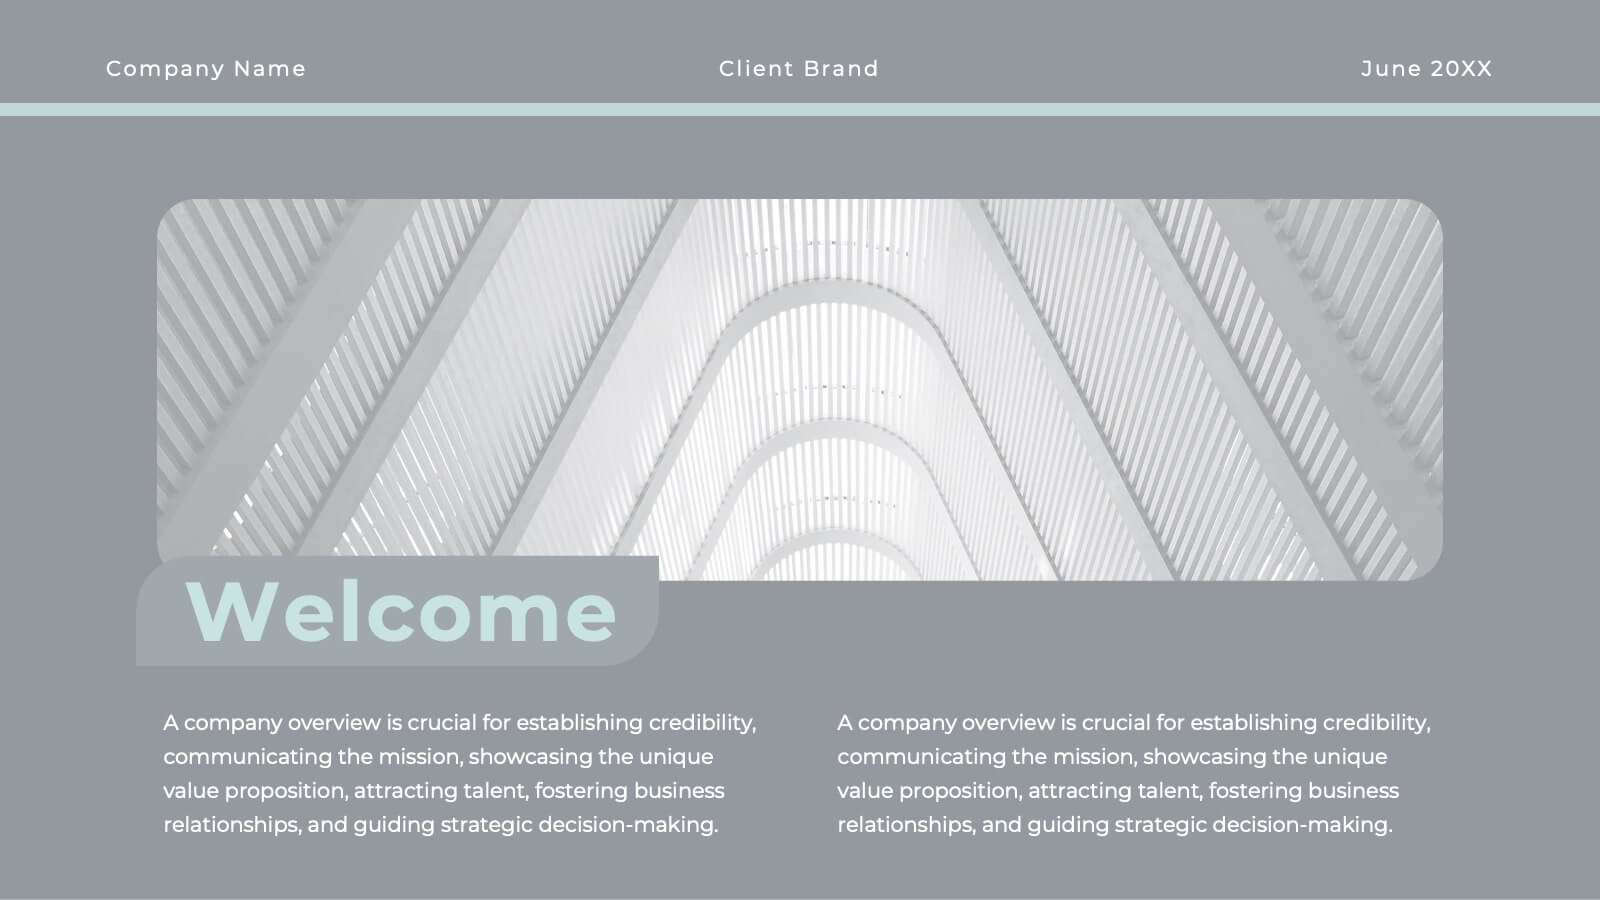
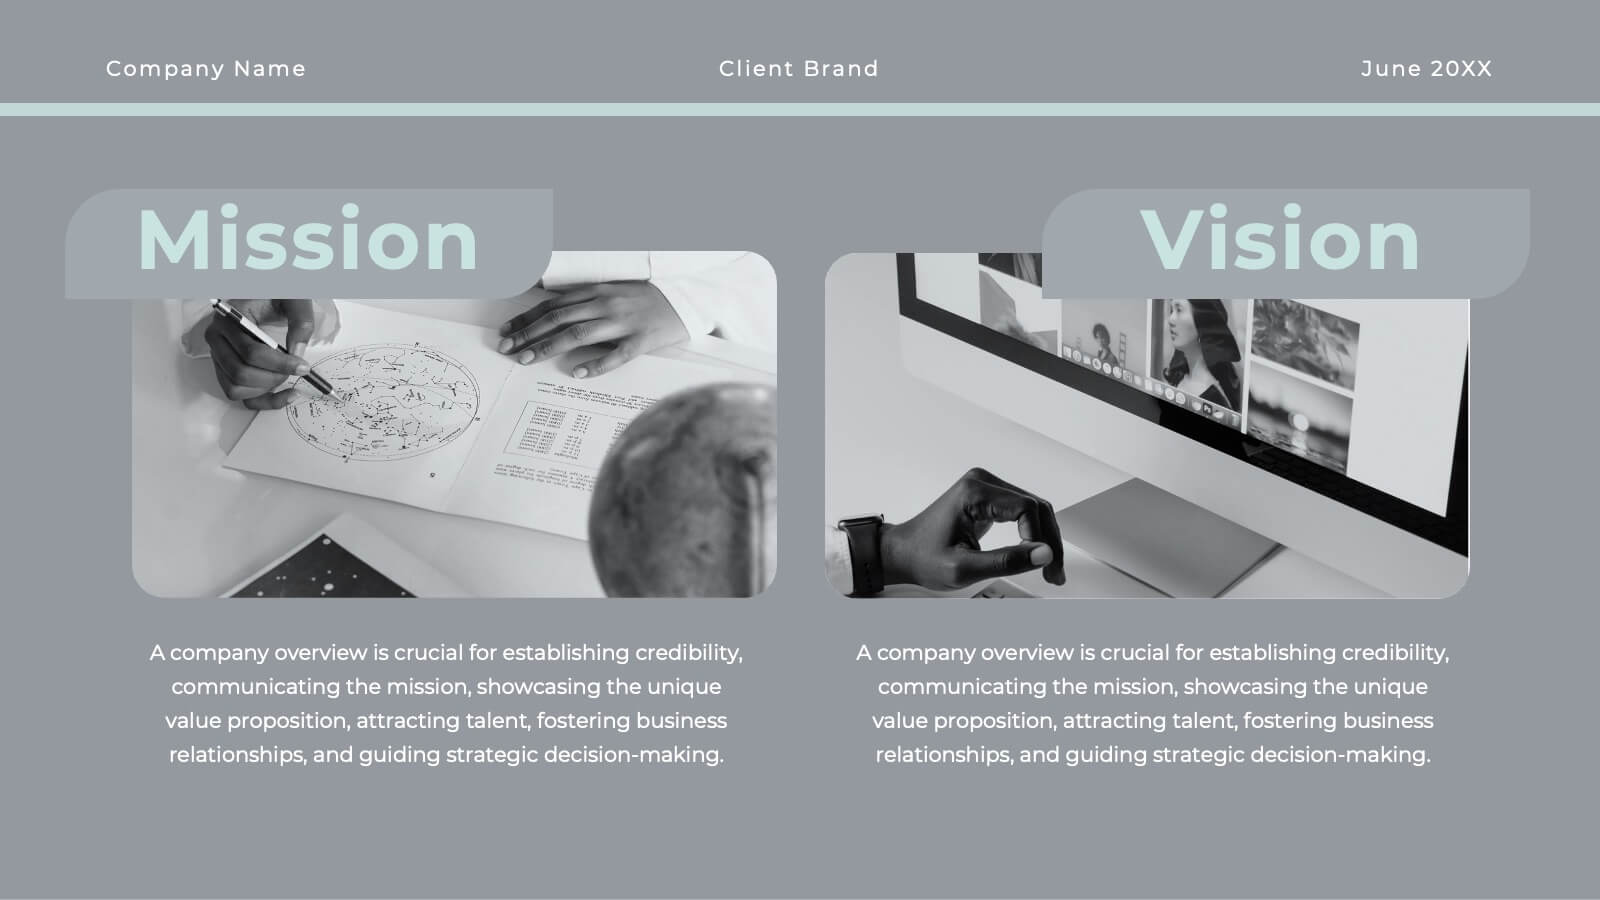
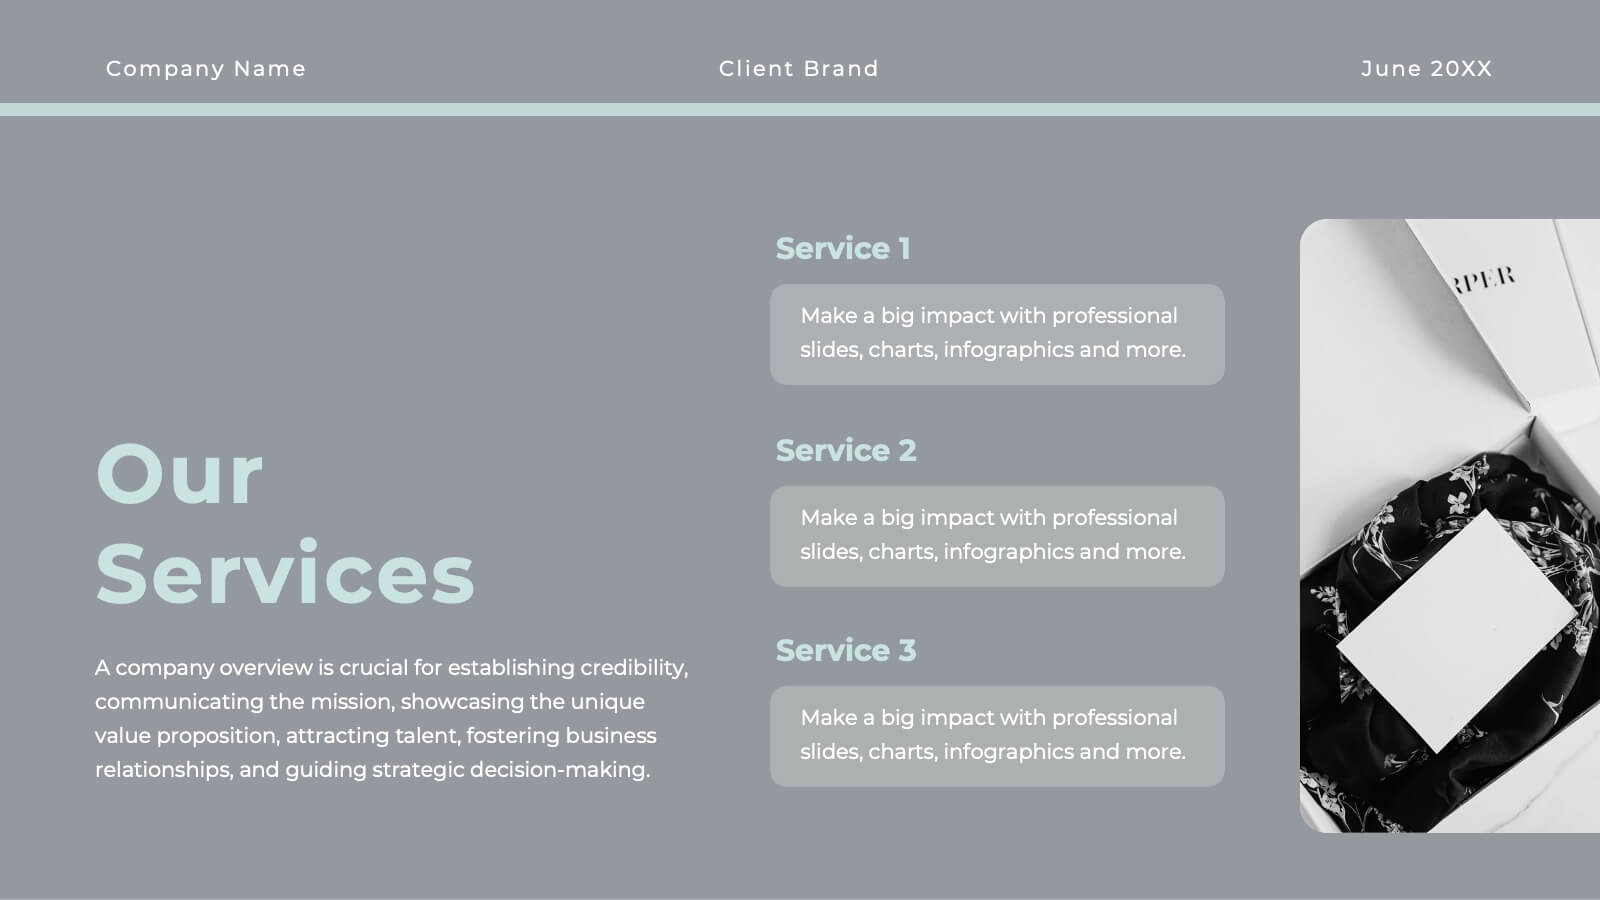
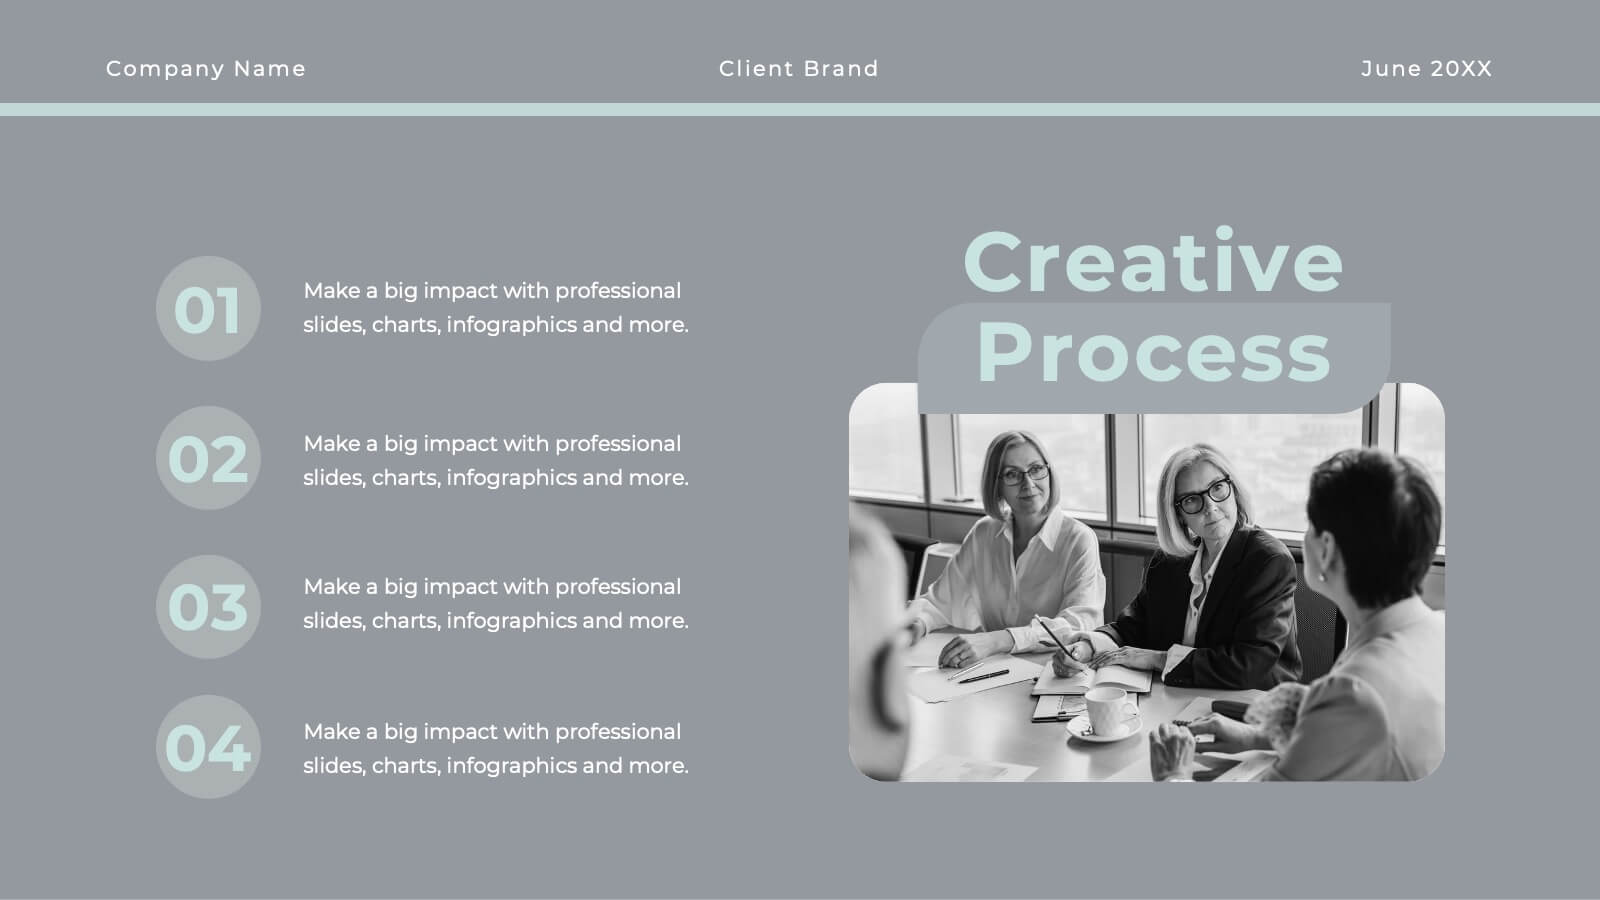
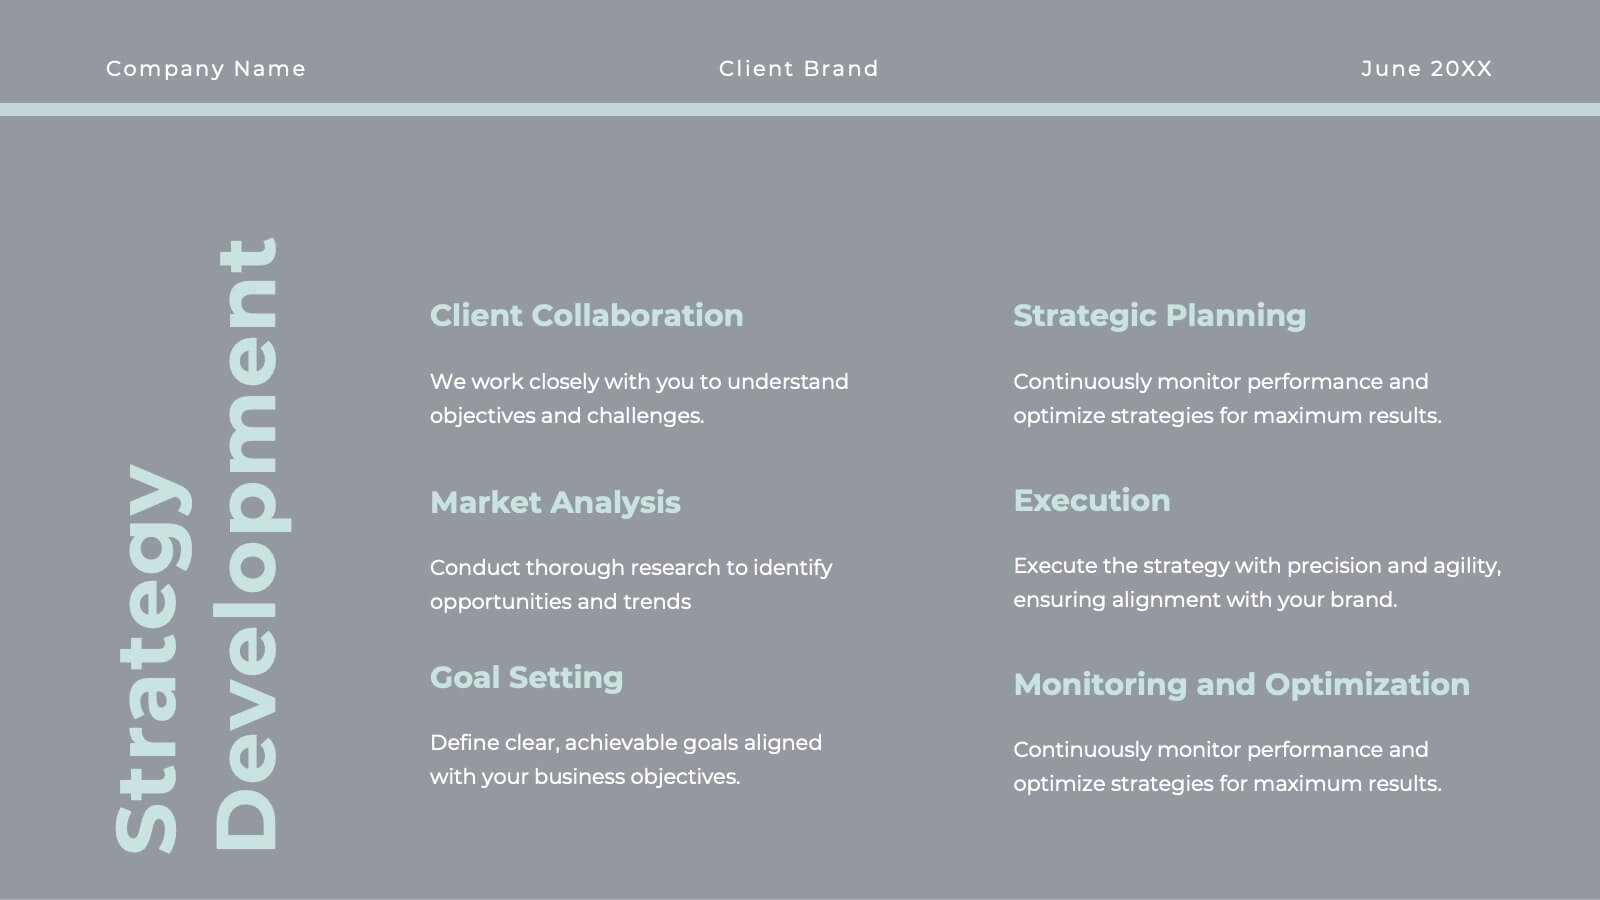
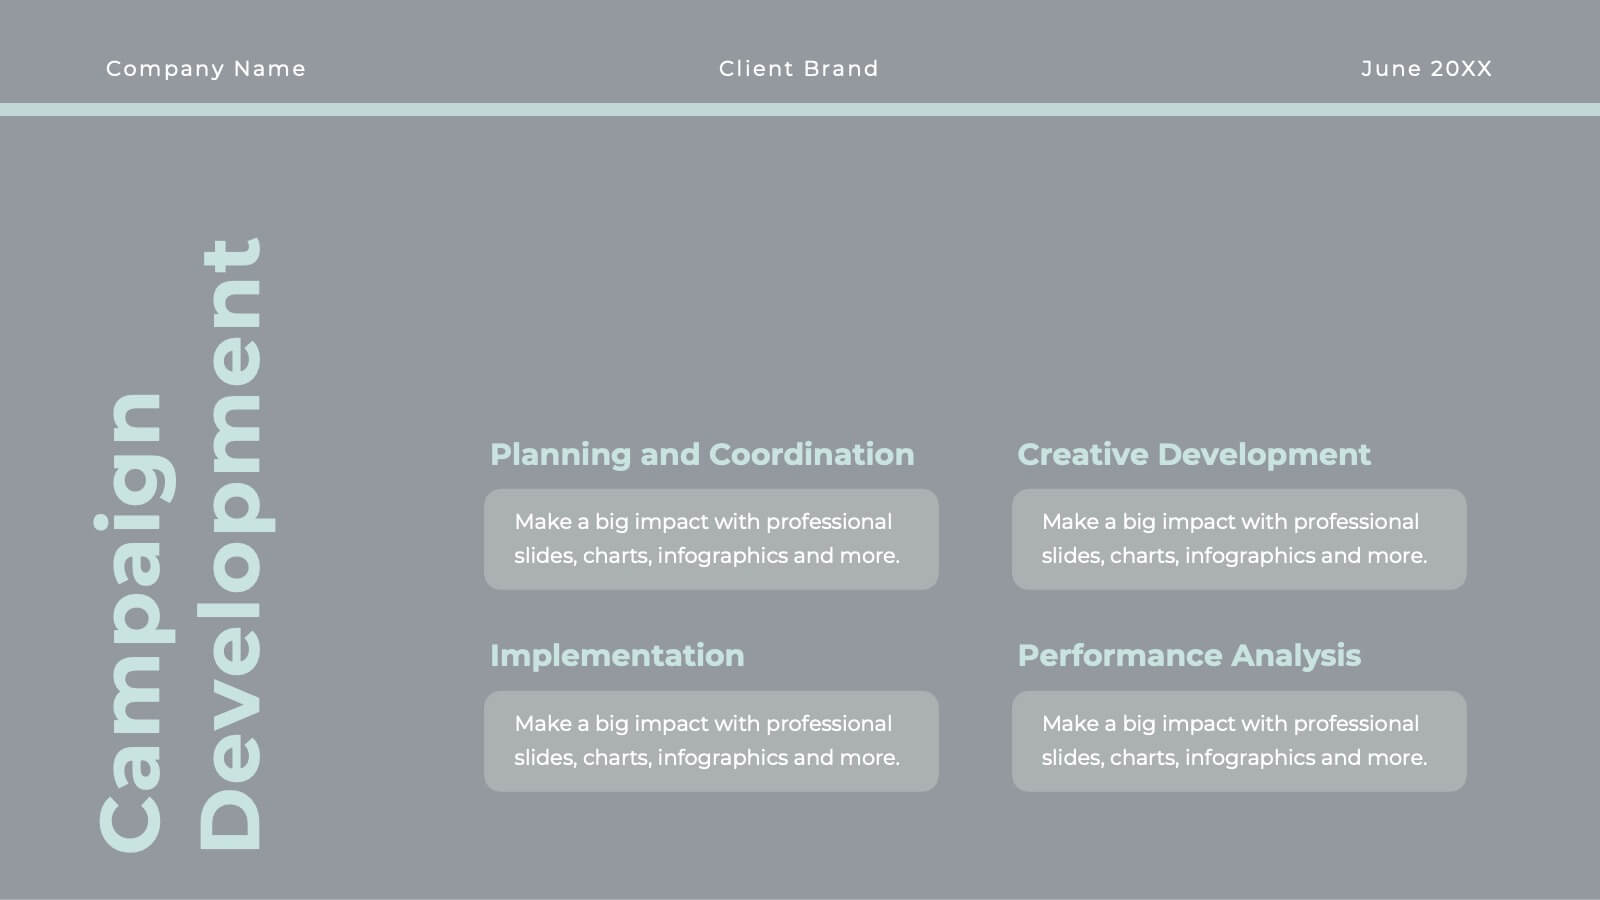
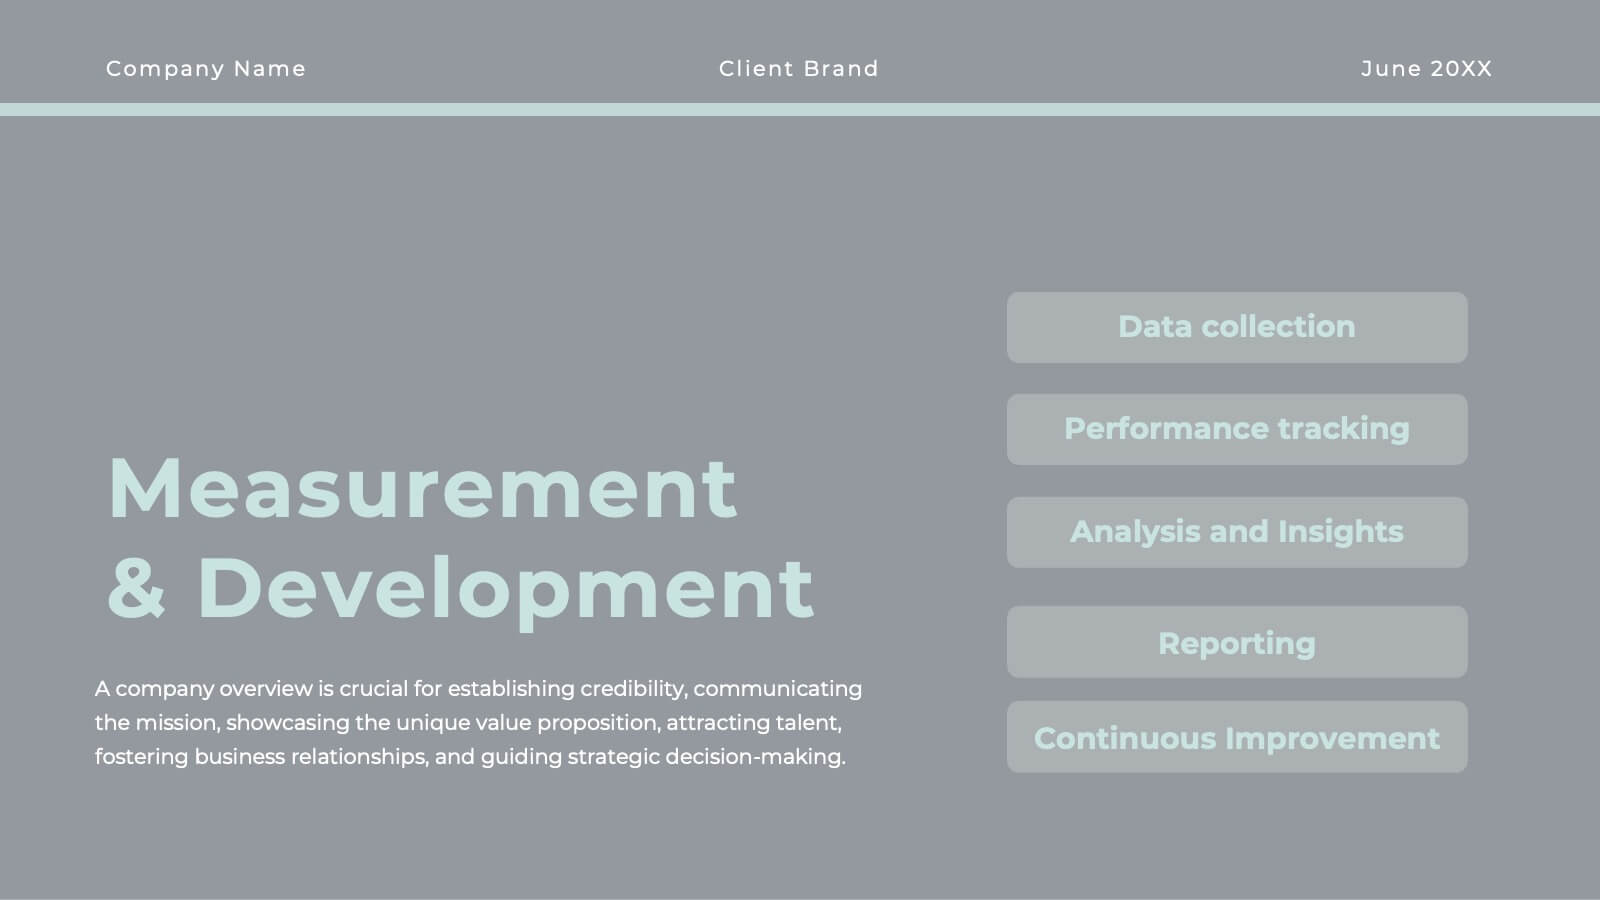
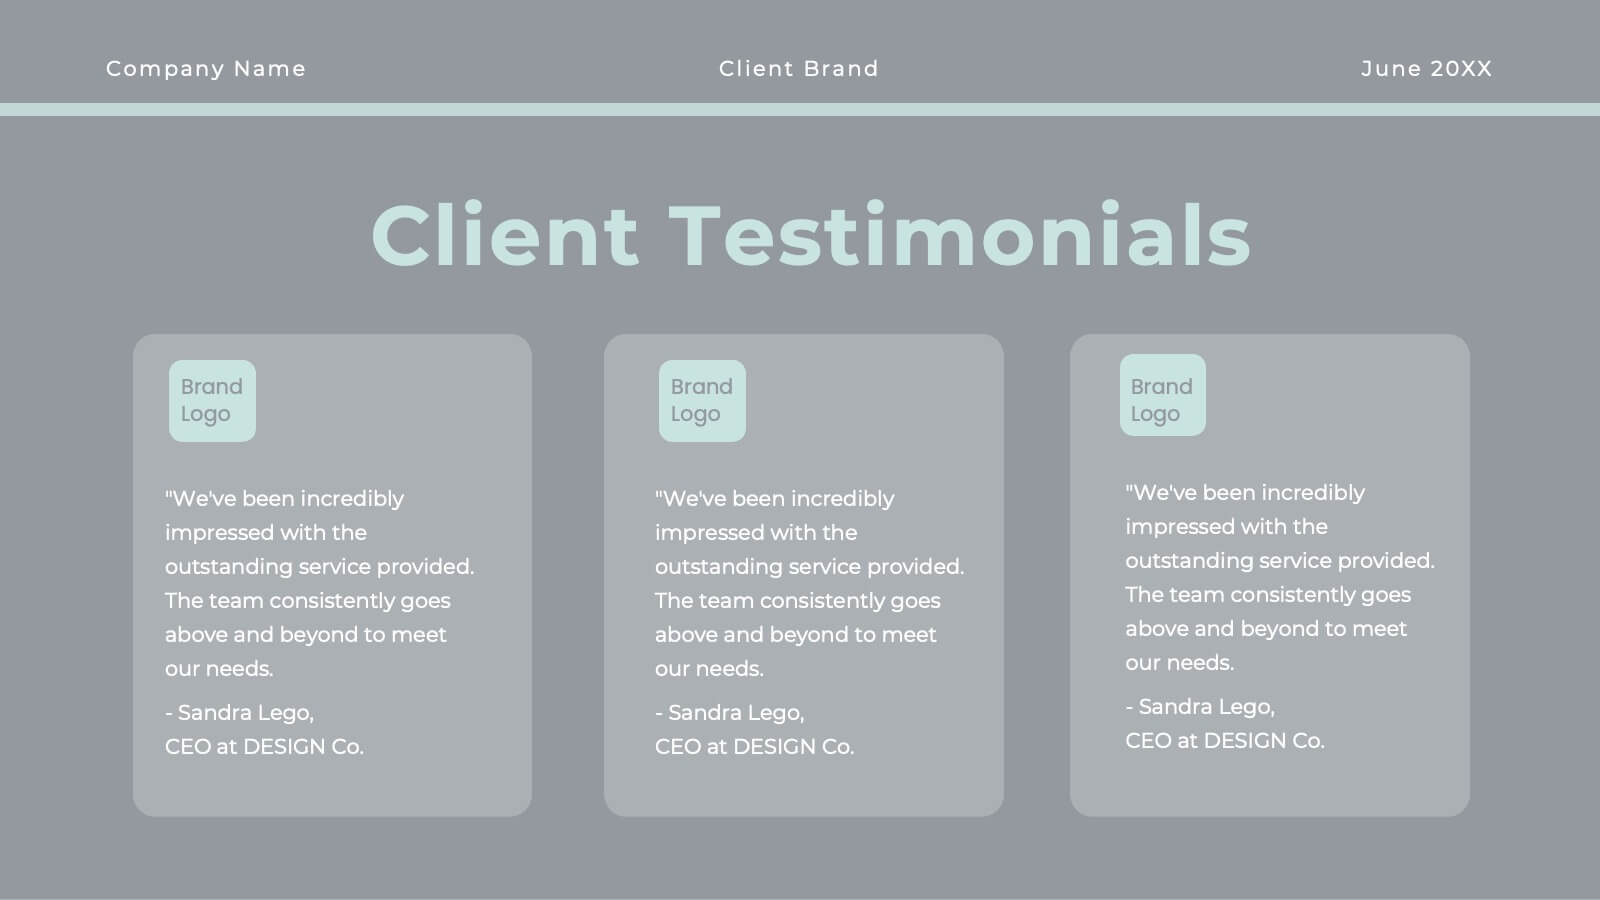
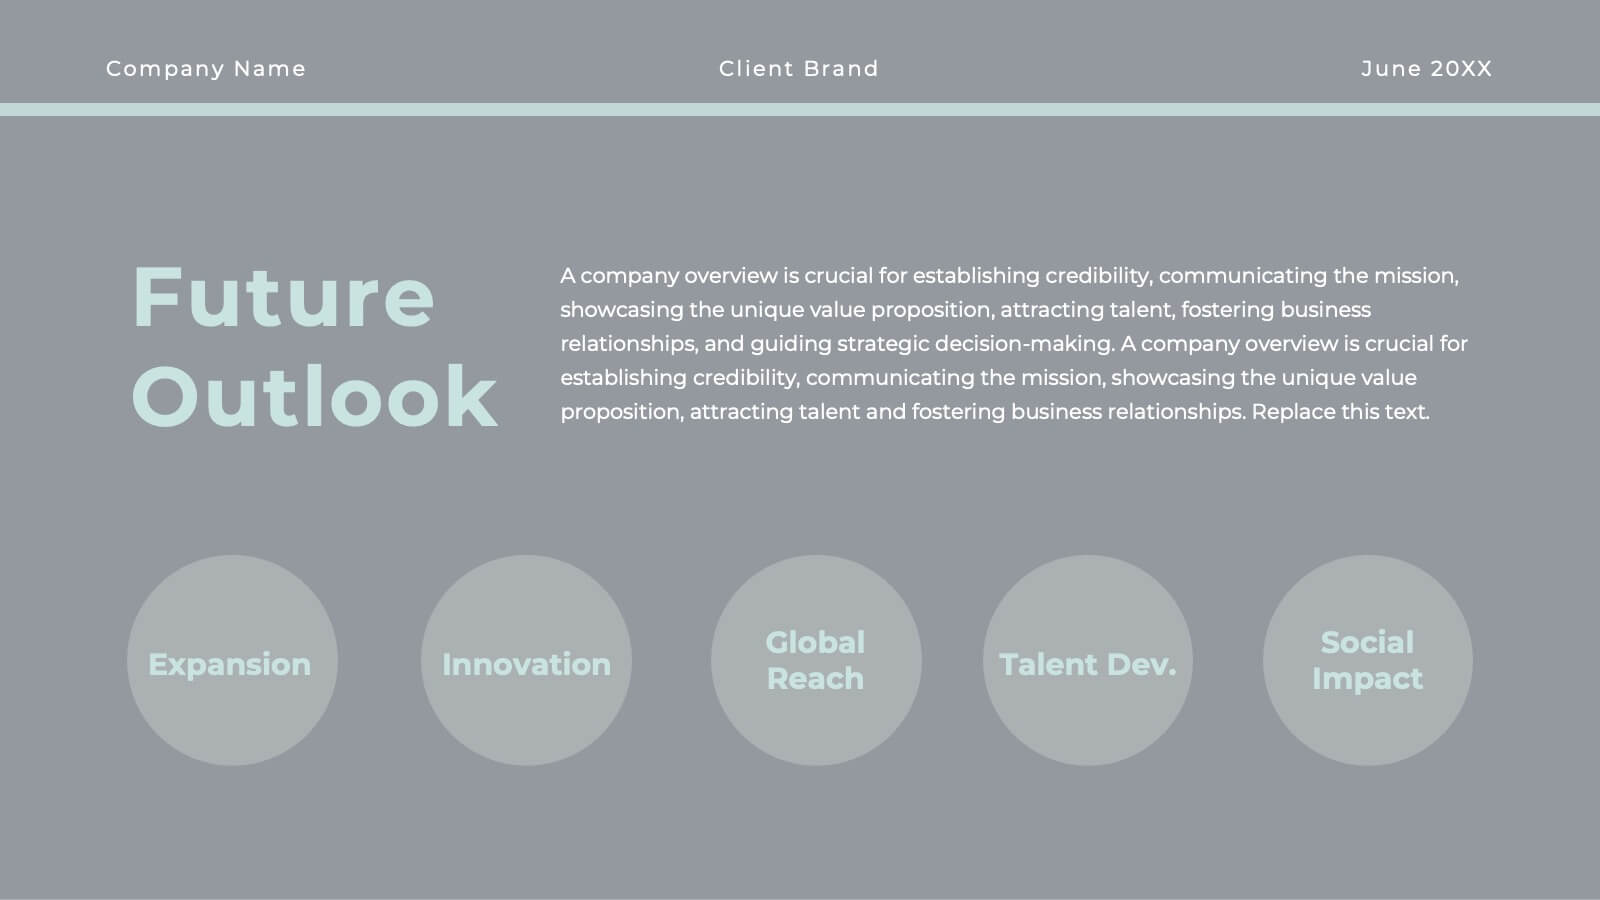
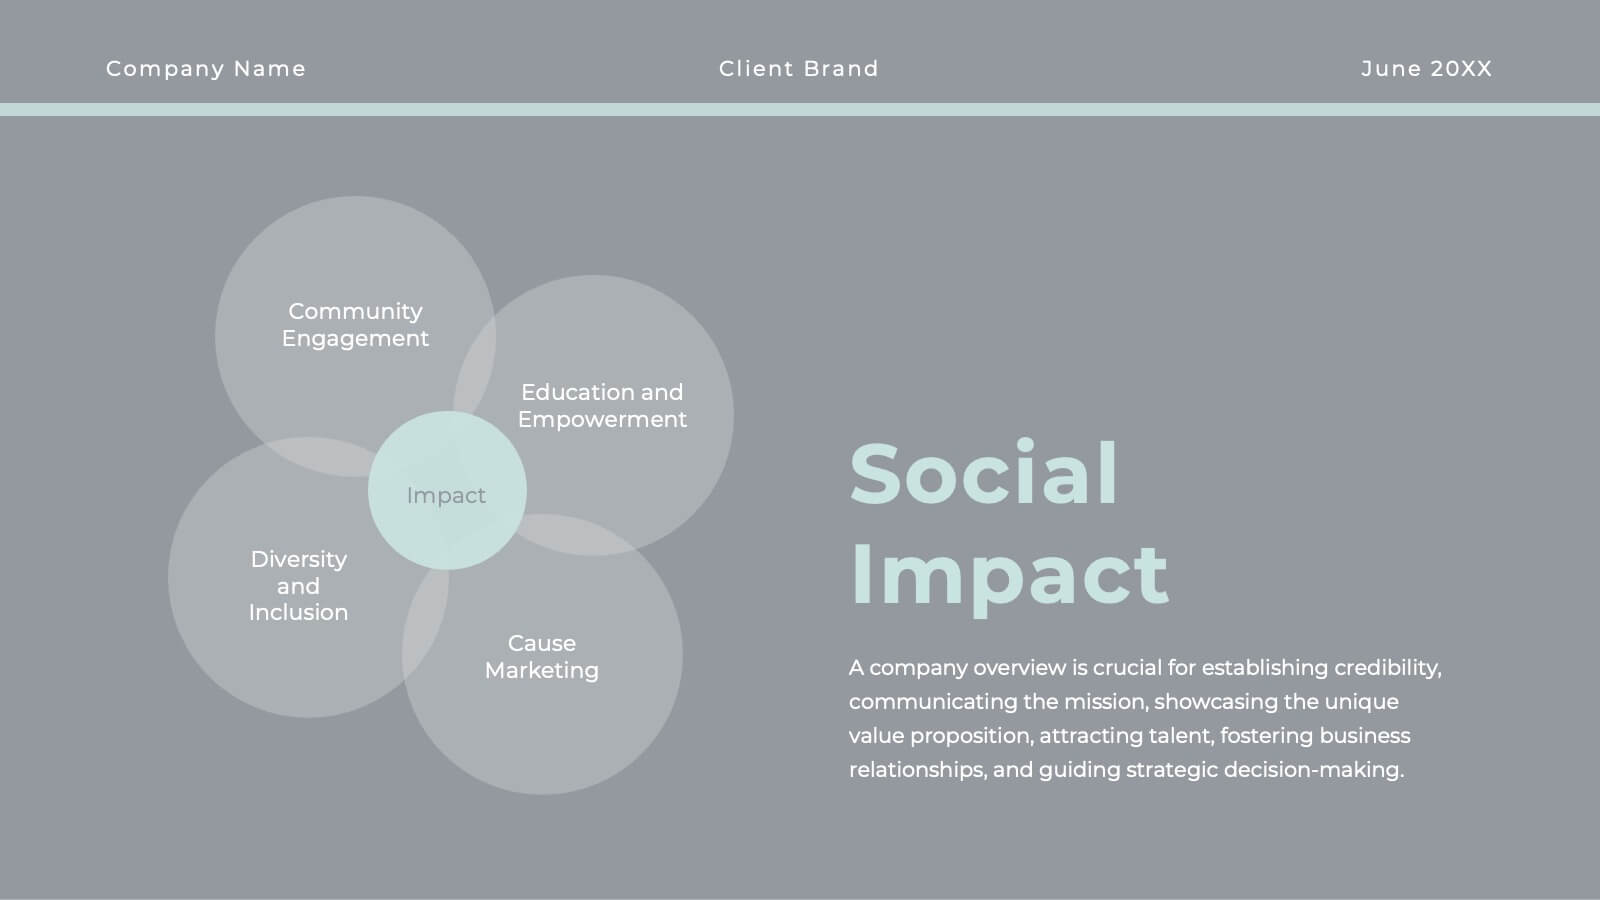
Whirlwind Advertising Agency Proposal Presentation
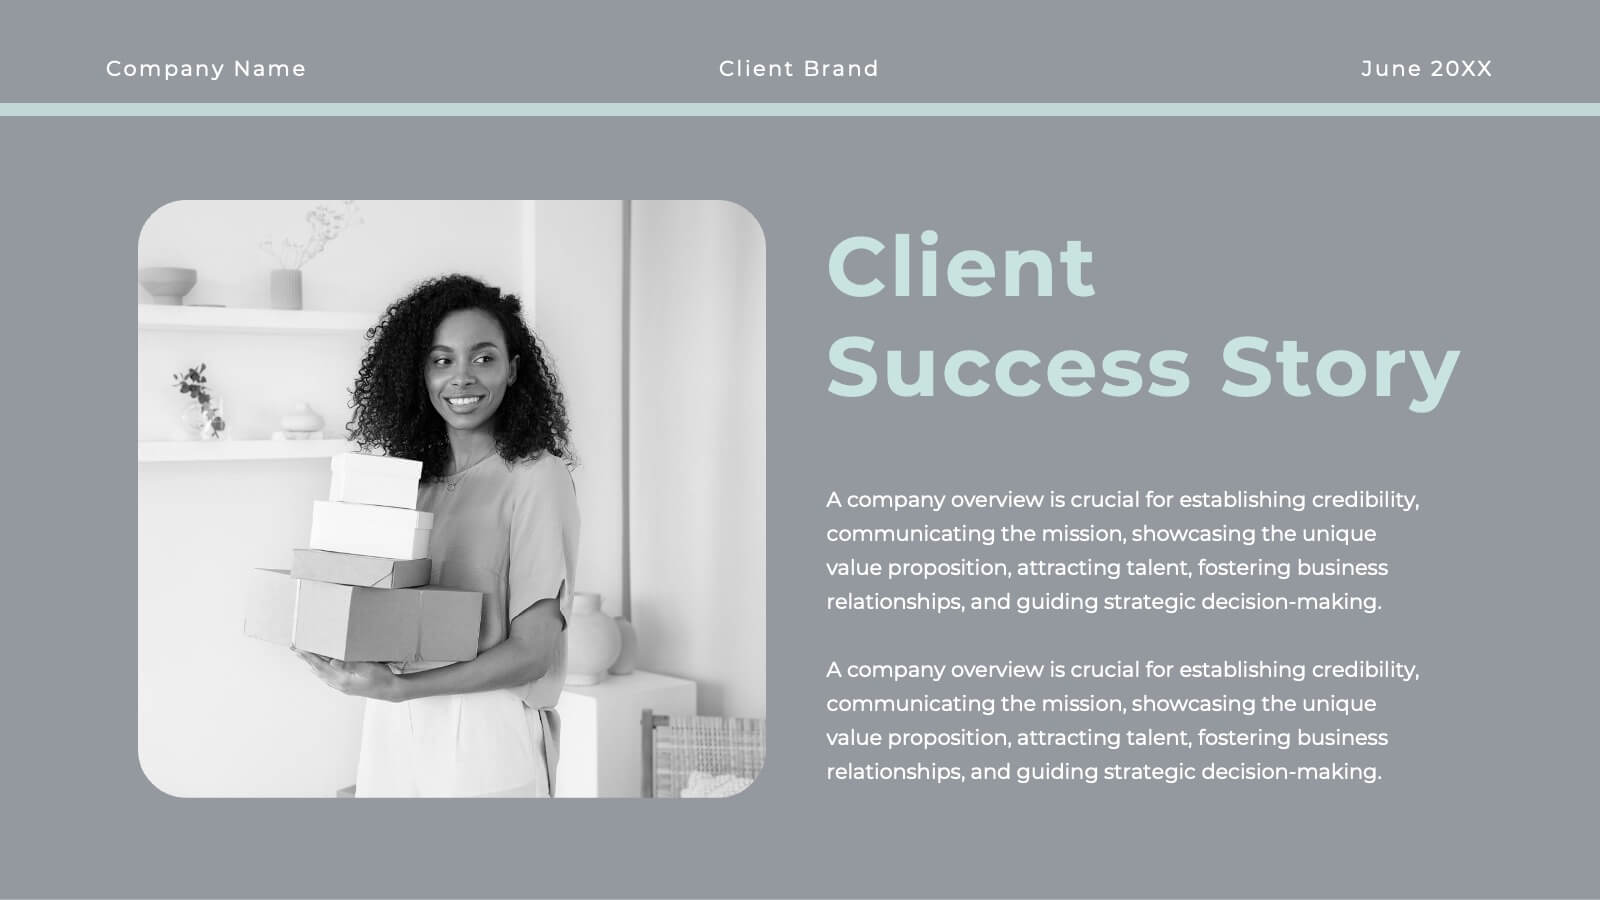
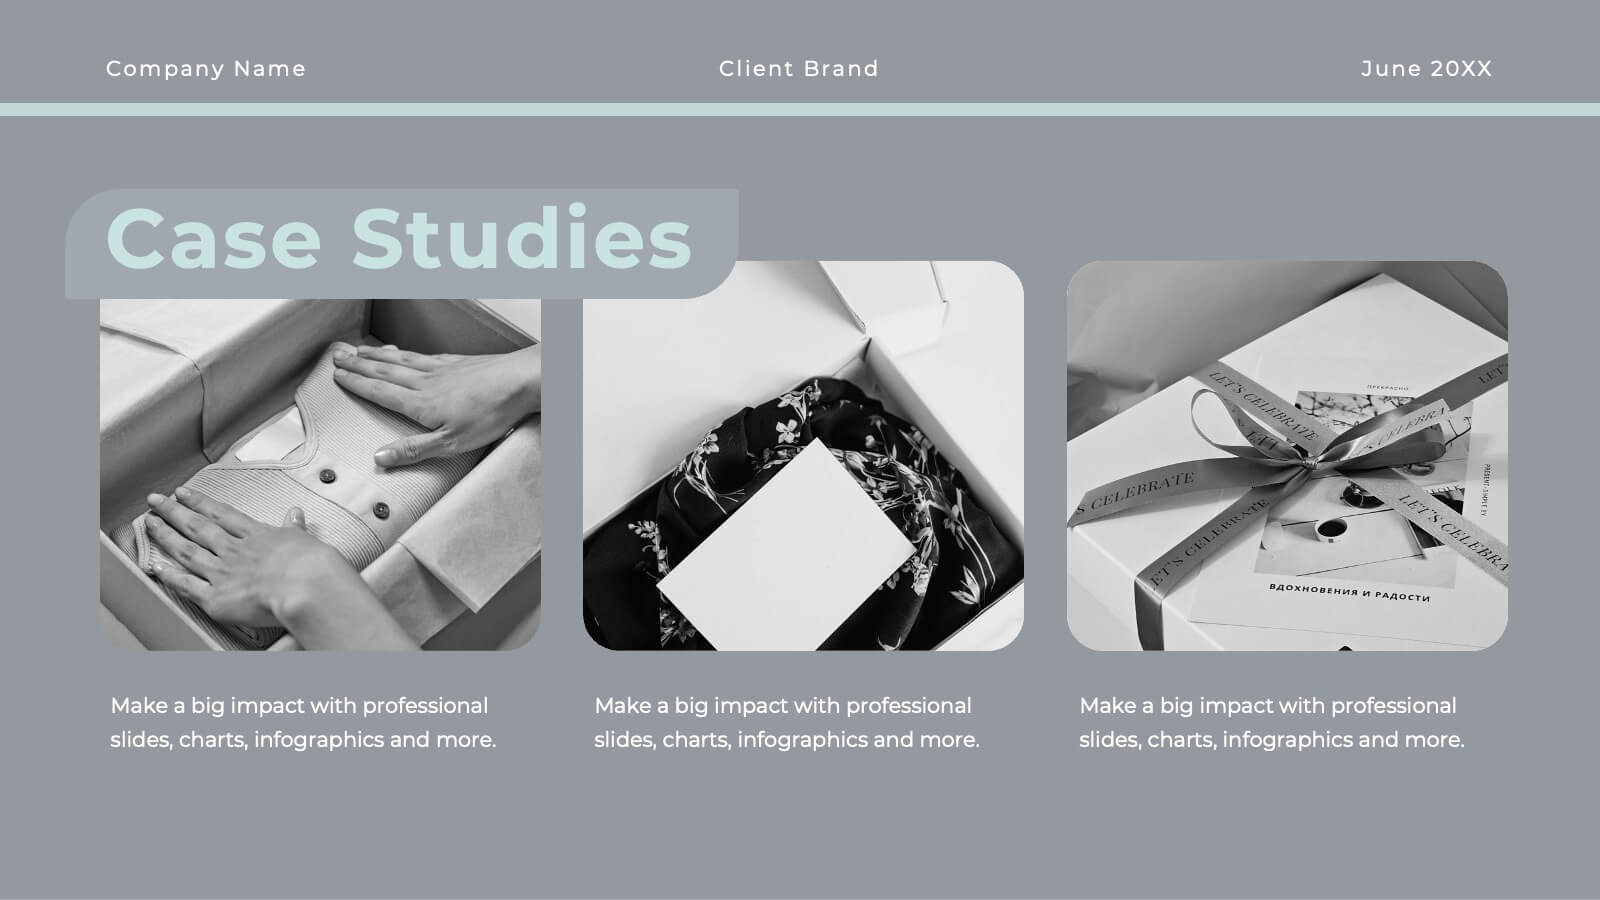
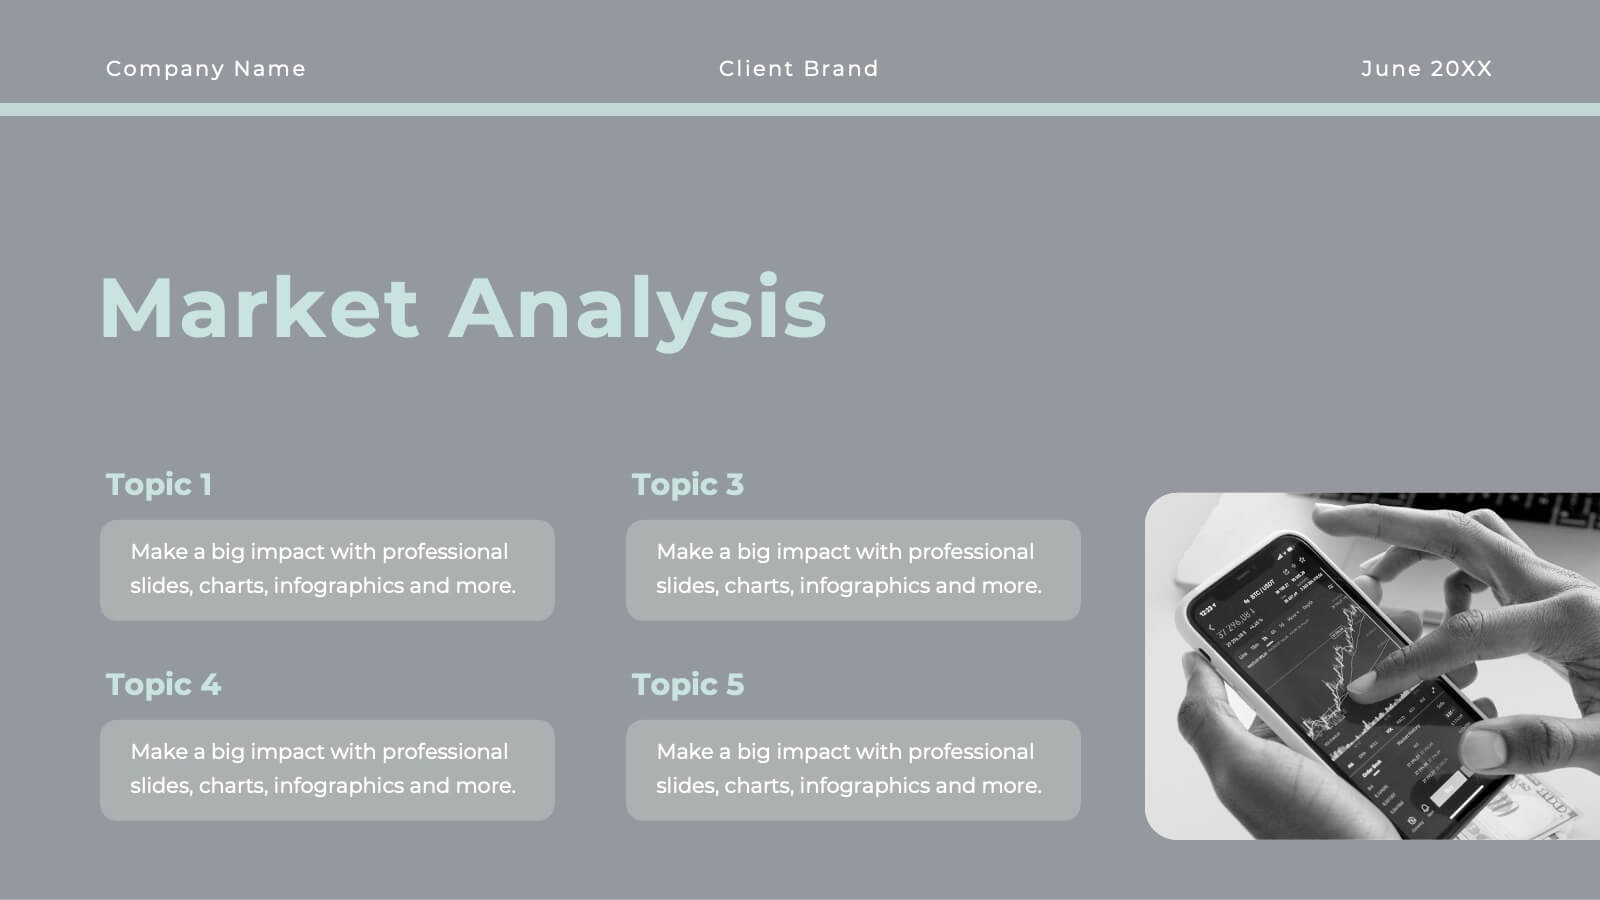
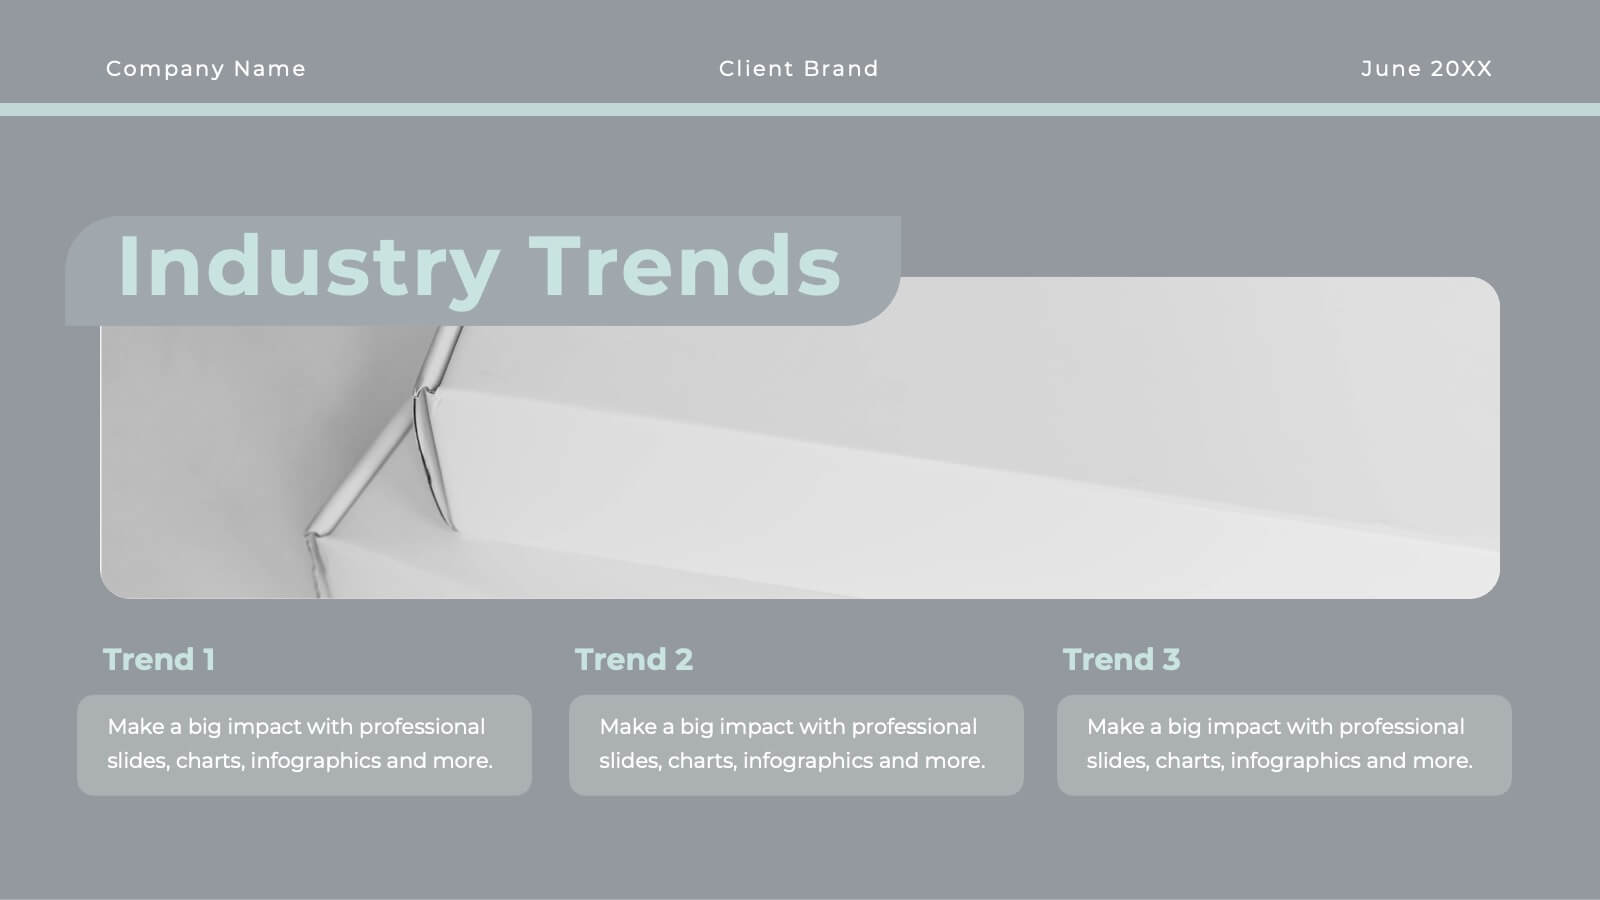
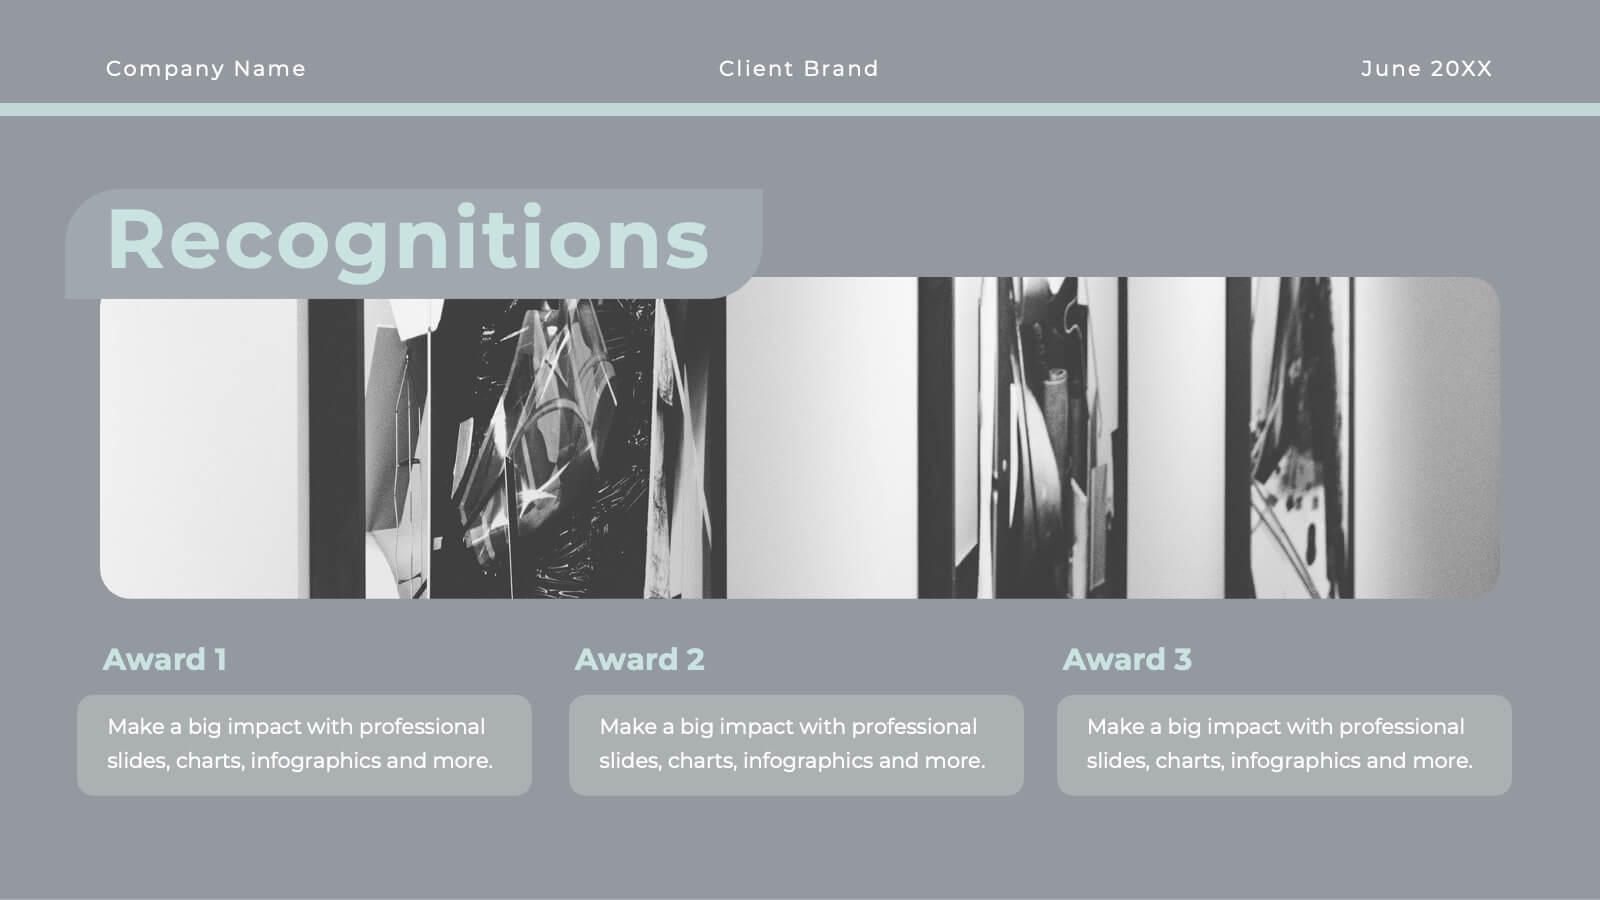
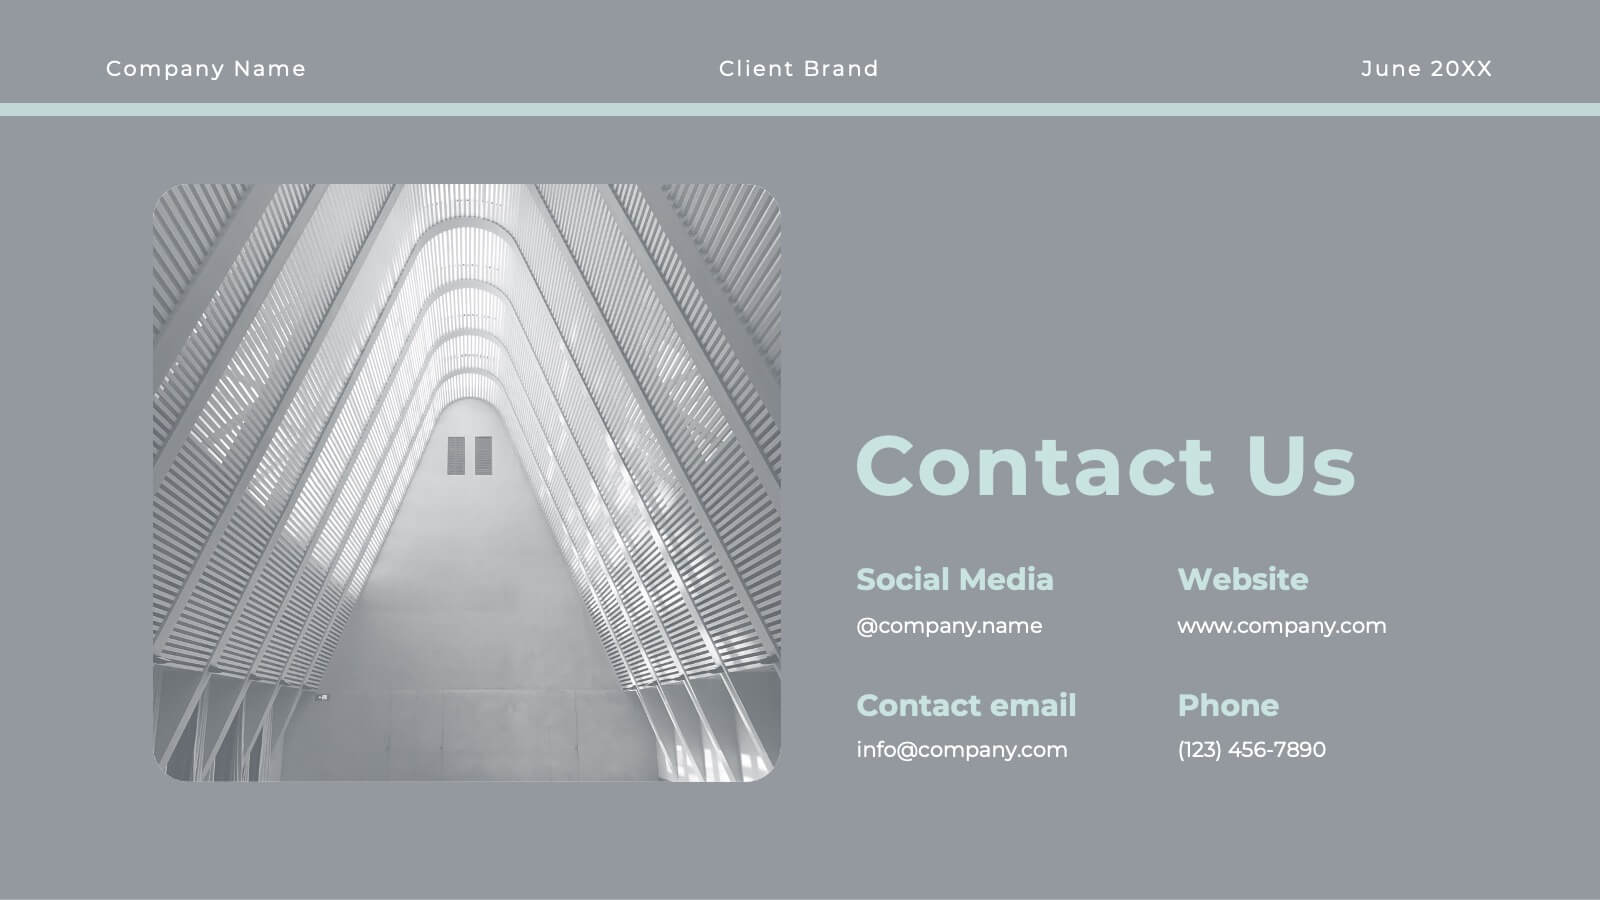
Get ready to elevate your agency’s game with a proposal template that’s as polished as your services! This sleek and sophisticated design is crafted to make a lasting impression on your clients and partners. From introducing your team’s expertise to showcasing successful case studies, every slide is meticulously designed to reflect professionalism and creativity. The clean, modern layout helps you present your market analysis, industry trends, and strategic approach with clarity and impact. With dedicated sections for client testimonials, campaign development, and partnership opportunities, this template ensures your agency’s value proposition is communicated with confidence and style. Perfectly adaptable to PowerPoint, Keynote, and Google Slides, this proposal template is your go-to tool for sealing deals and building lasting relationships. Your agency’s vision and mission will shine through in a presentation that’s both powerful and persuasive, making your proposals truly unforgettable!


6 diapositivas
Market Research Case Study
Visualize your research findings with this step-by-step arrow-style case study slide. Ideal for outlining research methodology, key findings, and conclusions across six distinct phases. This layout is perfect for marketing reports, academic presentations, or business insights. Fully editable in PowerPoint, Keynote, and Google Slides.


12 diapositivas
Business Event Planning Schedule Presentation
Optimize your event planning with the Business Event Planning Schedule template, which streamlines your organization efforts by providing a clear timeline from January to June. It's perfect for entering key business insights or data at various stages. Designed for adaptability, this template ensures your planning remains concise and relevant. Compatible with PowerPoint, Keynote, and Google Slides, it integrates effortlessly into your workflow.


7 diapositivas
Flow Chart Infographic Presentation Template
A Flow Chart Infographic uses shapes and lines to show the flow of information, steps in a process, or the relationship between different ideas. Flow Charts are often used in business, education, and technology to show the steps in a process, decision-making flow, or to illustrate the relationship between different pieces of information. This template is perfect for showing how things work or how to do something step by step. This flowchart infographic includes a variety of different charts and description boxes that you can customize with your information to make it work for you.