


Características


¿Tienes alguna pregunta?
Recomendar


5 diapositivas
Side-by-Side Features Comparison Presentation
Clearly compare product or service features with the Side-by-Side Feature Comparison Presentation. This layout is perfect for showcasing pros and cons, plan differences, or feature breakdowns across two options. With a clean visual structure and customizable labels, it's ideal for decision-making slides. Compatible with Canva, PowerPoint, Keynote, and Google Slides.


6 diapositivas
Fishbone Concept Infographic
Dissect complex issues with our Fishbone Concept Infographic, ideal for Powerpoint, Google Slides, and Keynote. This infographic, also known as the Ishikawa or cause-and-effect diagram, is designed for problem-solving and root cause analysis. This template features a series of branching arrows leading to a central spine, enabling you to map out multiple cause-and-effect relationships. Each ‘bone’ represents a category of causes that you can customize to fit your specific analysis needs. With this fishbone infographic, you can effectively organize and present complex data, making it easier for your audience to understand and engage with the content of your presentation.


7 diapositivas
Data Governance Infographic
Navigate the world of data management with our governance infographic. Painted in a thoughtful blend of orange, white, and blue, this template simplifies the multifaceted realm of data governance for its viewers. Perfectly tailored for IT professionals, data analysts, business strategists, and educators, it breaks down the key components of data governance in a visually compelling manner. Enriched with custom graphics, icons, and dedicated image placeholders, this tool can transform any presentation into a memorable one. And with compatibility spanning PowerPoint, Keynote, and Google Slides, it’s designed for universal appeal.


4 diapositivas
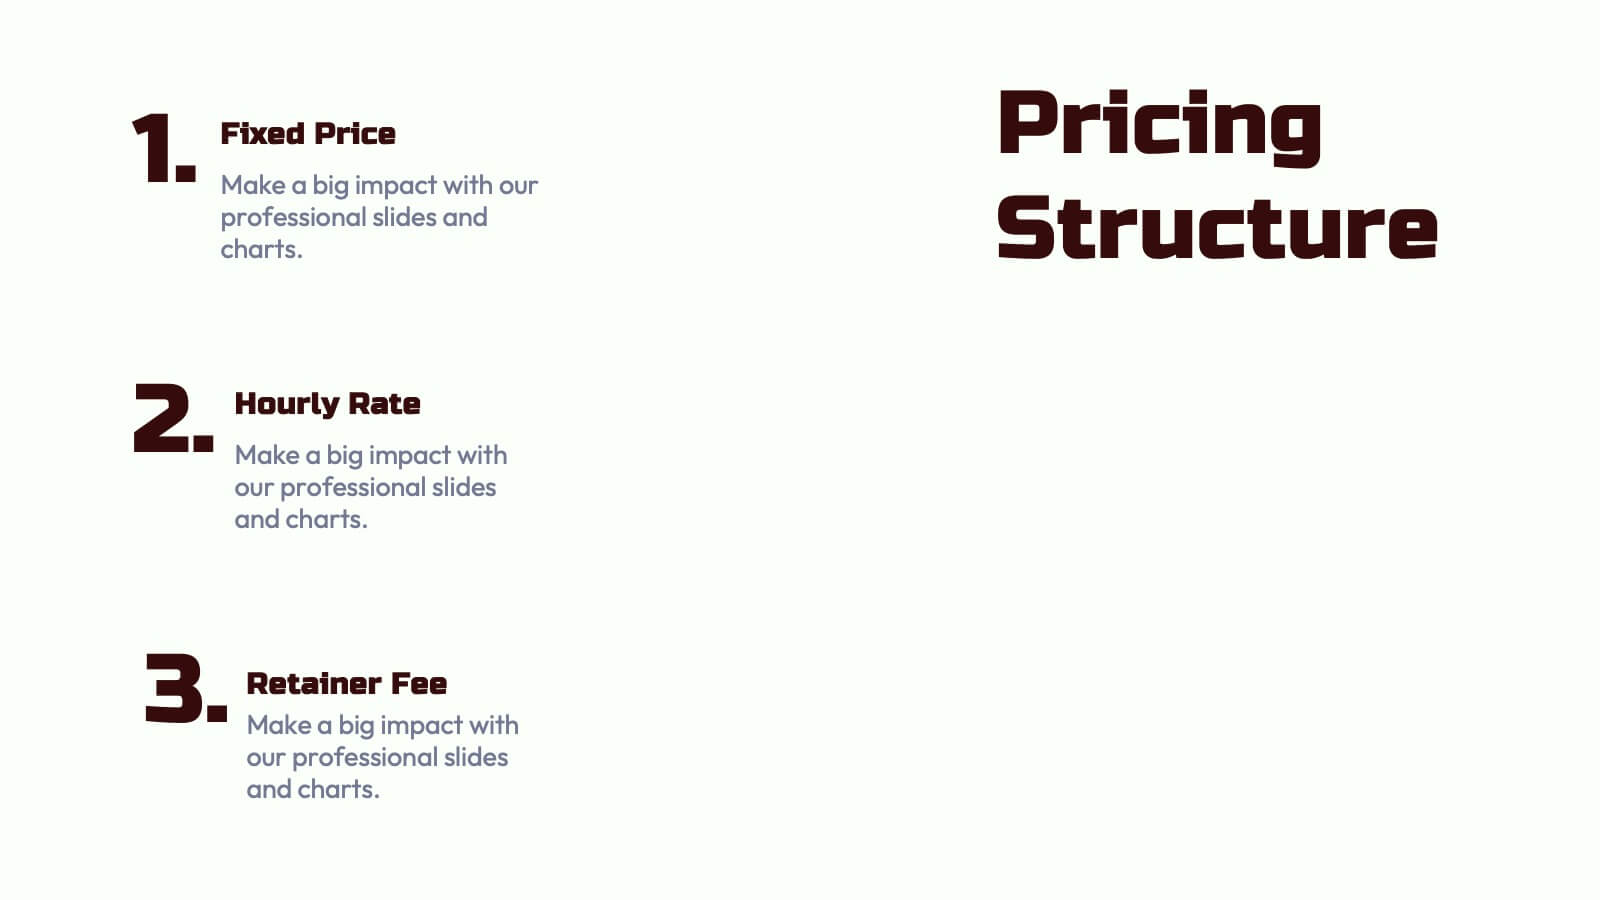
3-Tier Pricing Table Layout Presentation
Make your pricing pitch pop with this bold and modern layout! This presentation template is perfect for showcasing product or service plans with clear comparisons across three tiers. Designed to streamline pricing communication, it’s ideal for SaaS, consulting, or digital services. Fully compatible with PowerPoint, Keynote, and Google Slides.


5 diapositivas
New Hire Orientation Program
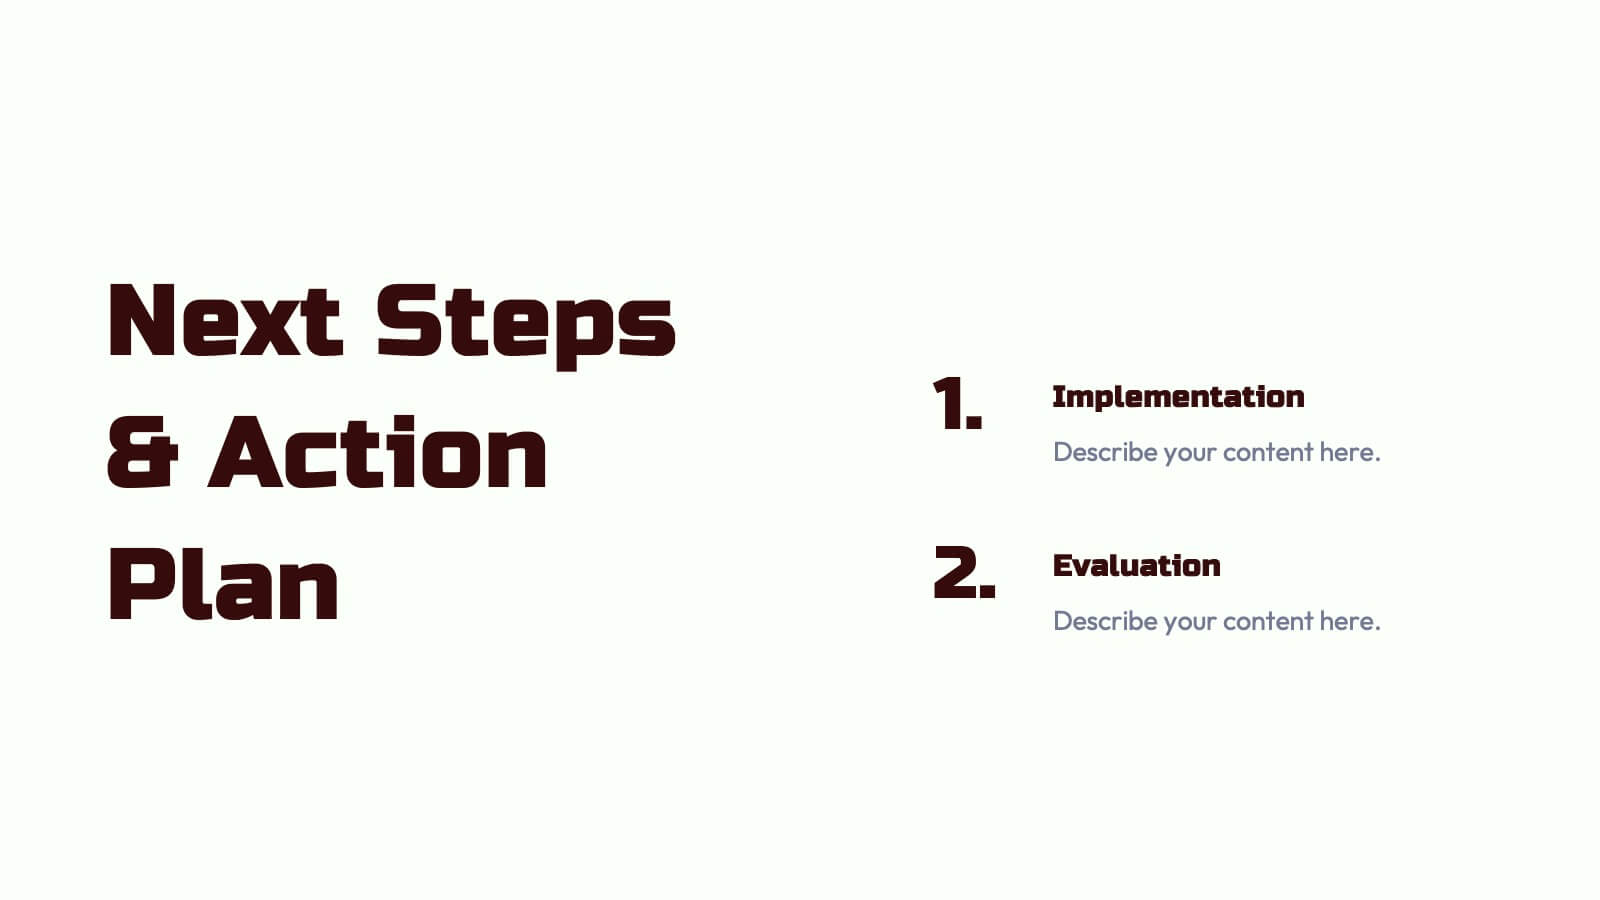
Welcome new employees with confidence using the New Hire Orientation Program Presentation. This step-by-step slide is designed to outline your company’s onboarding journey in five clear, structured stages. With labeled “Step 01” through “Step 05” banners, icon placeholders, and editable text boxes, this template is ideal for HR teams, managers, or team leads introducing company values, processes, or benefits. Available in both full-color and progressive highlight variations, it's fully customizable in PowerPoint, Keynote, and Google Slides.


21 diapositivas
Sonicwave Market Analysis Report Presentation
A vibrant, modern template designed for market analysis presentations. Covers agenda, key highlights, metrics, financial summaries, competitor insights, and strategic initiatives. Ideal for professionals presenting data-driven insights on trends and performance. Fully customizable in PowerPoint, Keynote, and Google Slides for business, marketing, and analytical reporting needs.


20 diapositivas
Aether Marketing Research Report Presentation
The Marketing Research Report Presentation Template offers a sleek design with 20 fully customizable slides, ideal for presenting in-depth marketing insights. This template features sections for industry analysis, consumer behavior, emerging technologies, and marketing trends like SEO, social media, and influencer strategies. It also highlights e-commerce trends, personalization, sustainability, and storytelling techniques. The modern black-and-gold gradient aesthetic adds sophistication, making it perfect for professional reports. Compatible with PowerPoint, Keynote, and Google Slides, this template ensures a polished and engaging presentation experience.


7 diapositivas
Construction Site Infographic
Elevate your project presentations with our Construction Site Infographic, an essential tool for construction managers, engineers, and stakeholders. This infographic offers a visual breakdown of the construction process, stages, and key tasks, ensuring a comprehensive understanding of project progression and components. Our Construction Site Infographic is designed to detail various phases such as planning, foundation work, structural development, and finishing touches. It helps in communicating the complexity and sequence of construction activities, making it easier to track milestones and manage resources effectively. With customizable elements, you can represent specific site operations, timelines, and the deployment of labor and materials. This SEO-optimized infographic is crafted to aid in reporting, project tracking, and stakeholder briefings, making it a valuable asset for any construction-related project. Utilize this infographic to provide a clear and structured overview of your construction project, promoting transparency and aiding in the efficient management of your site operations.


20 diapositivas
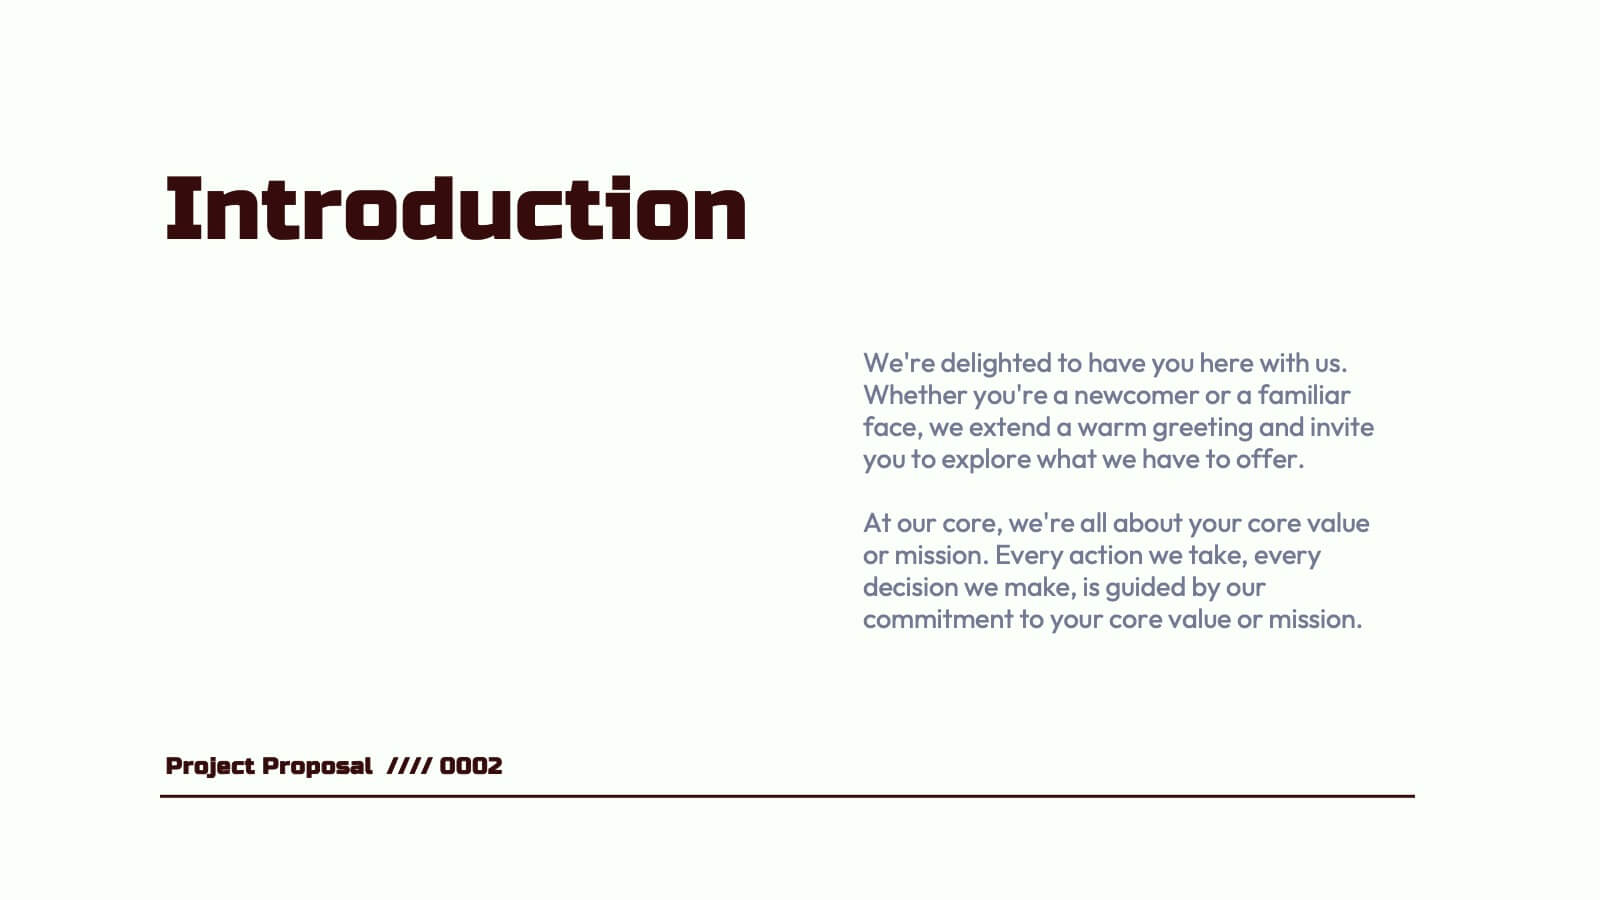
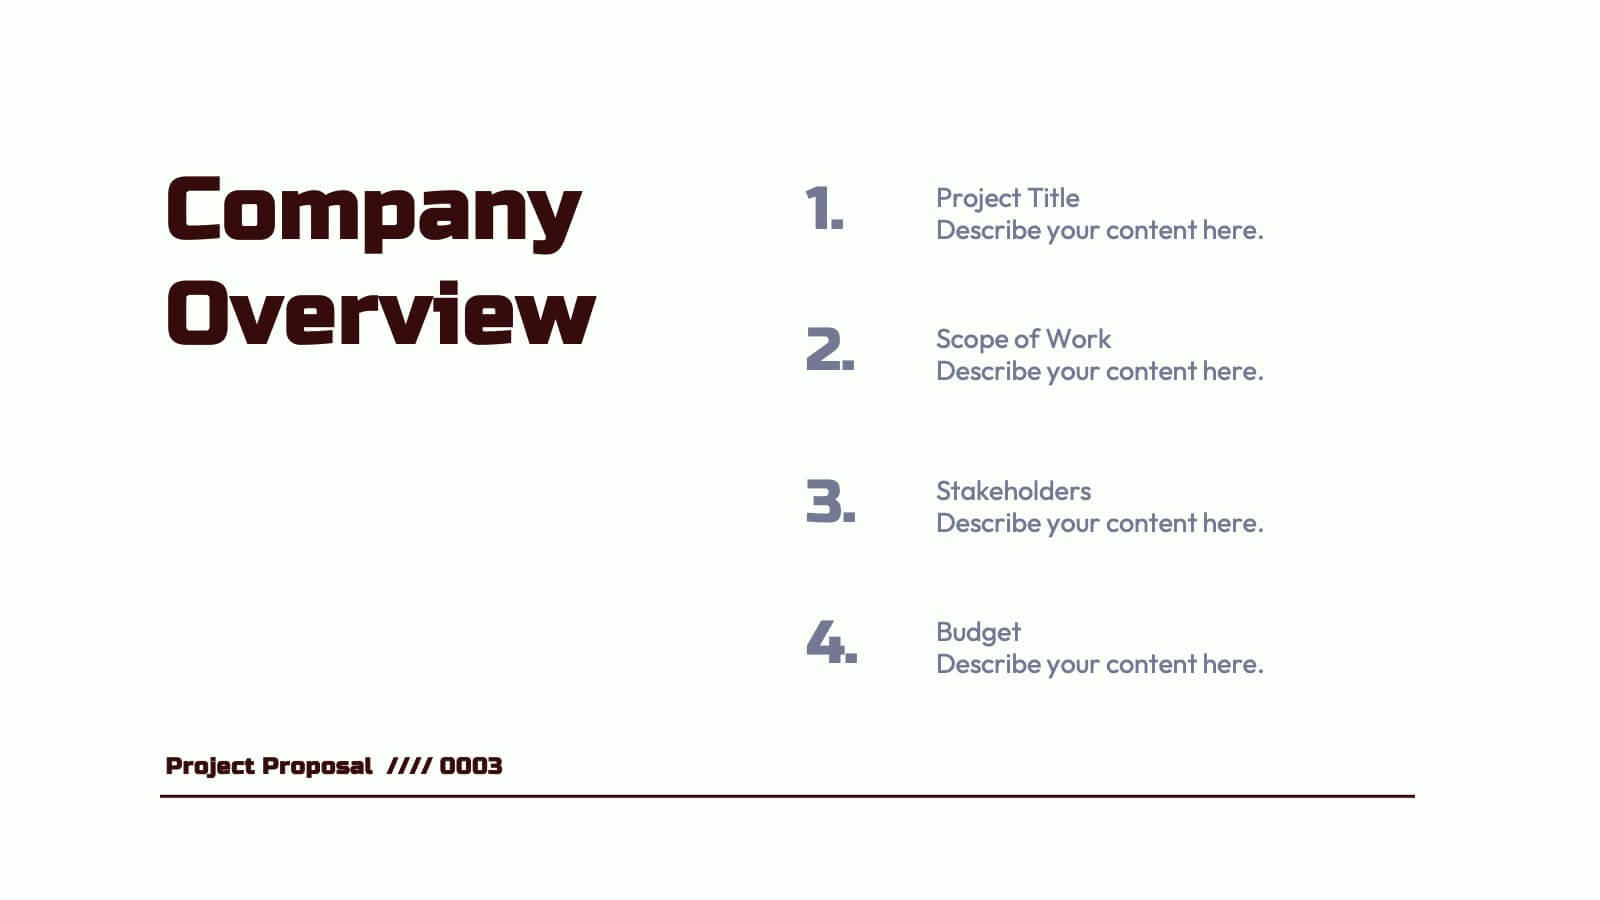
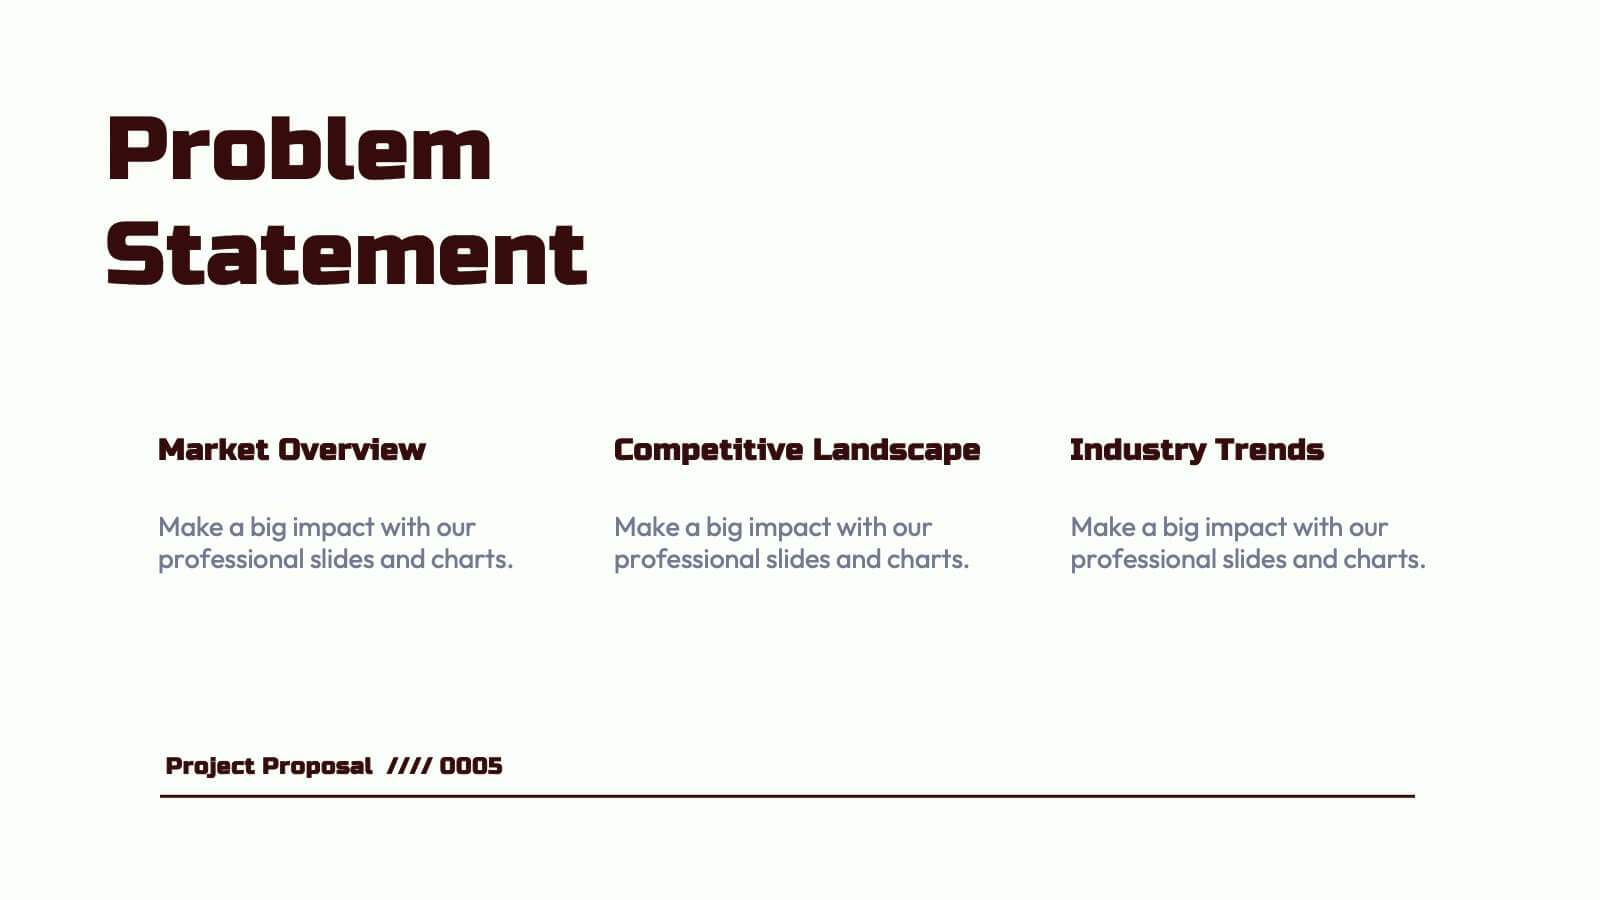
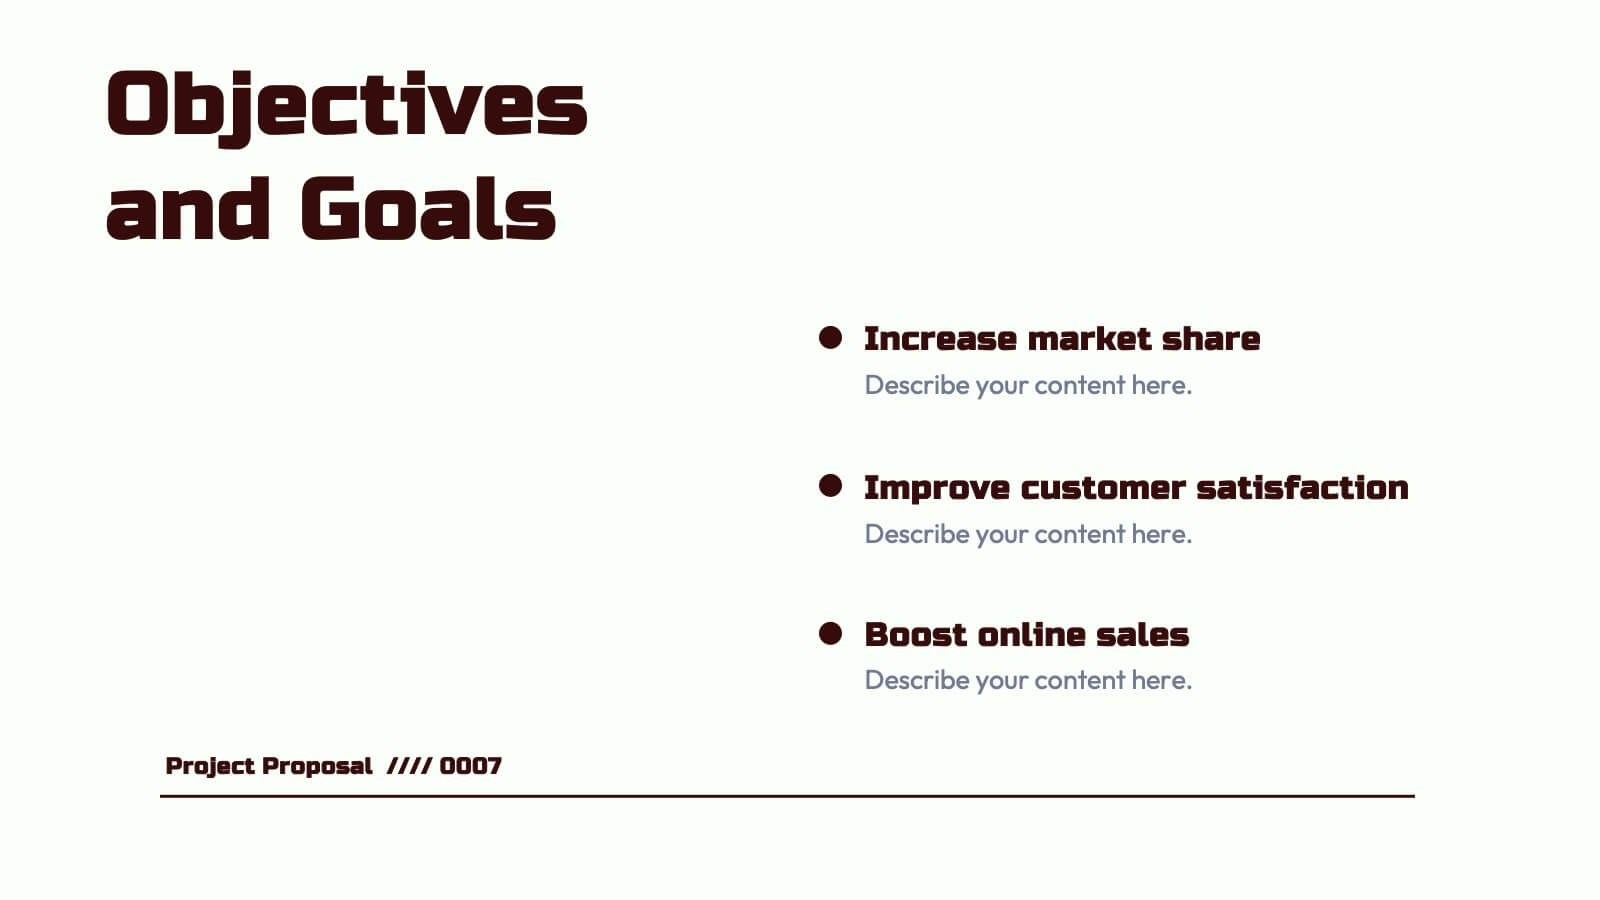
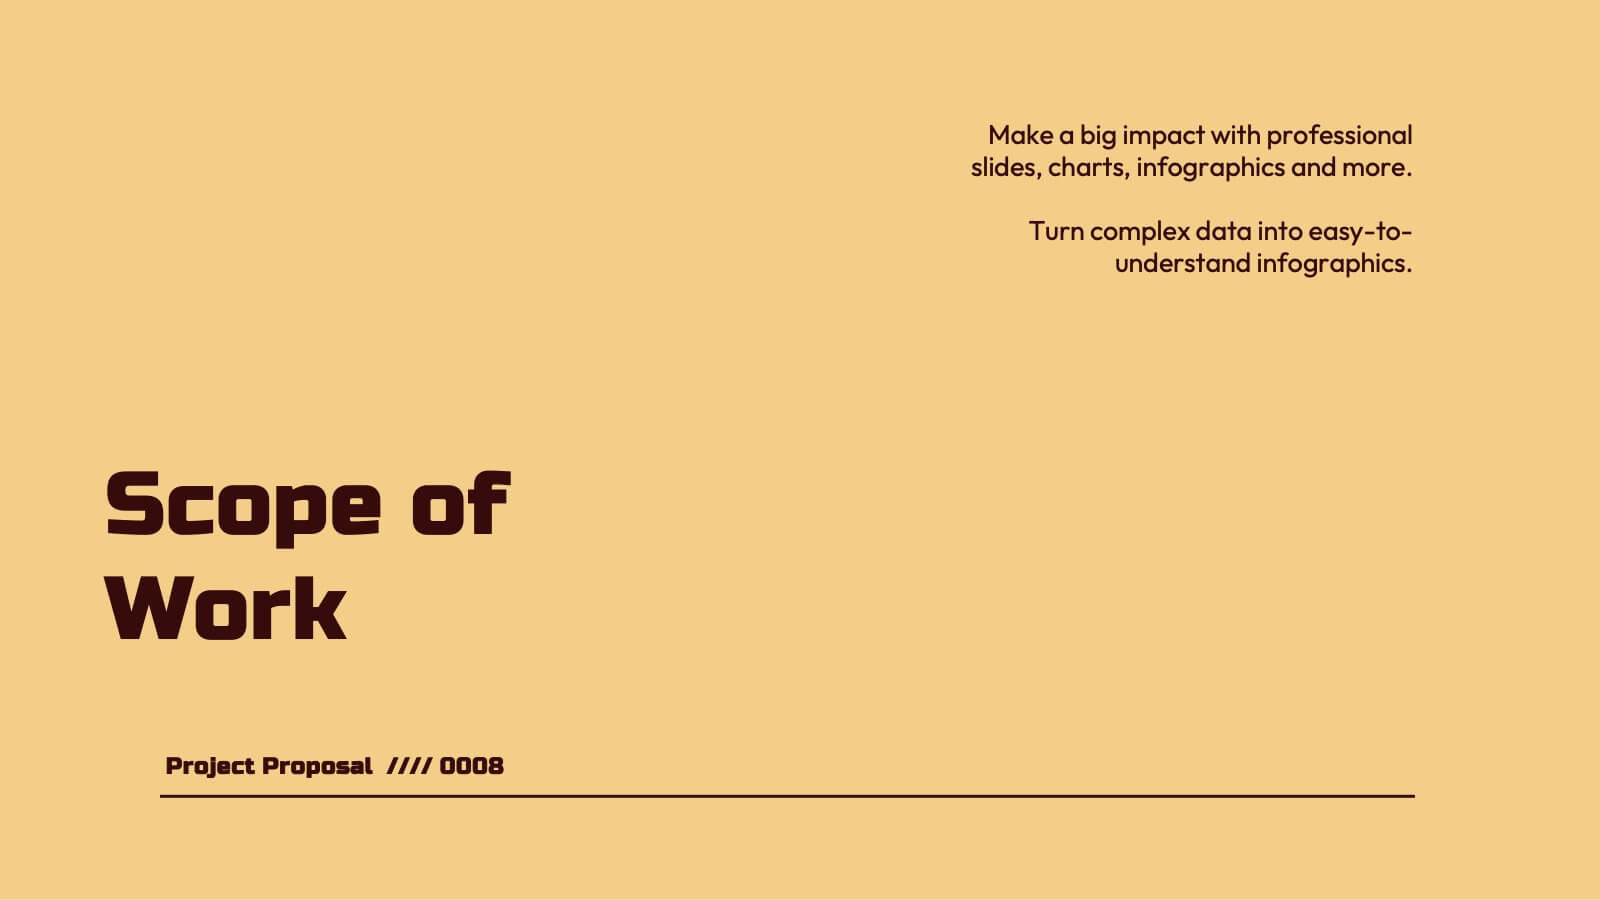
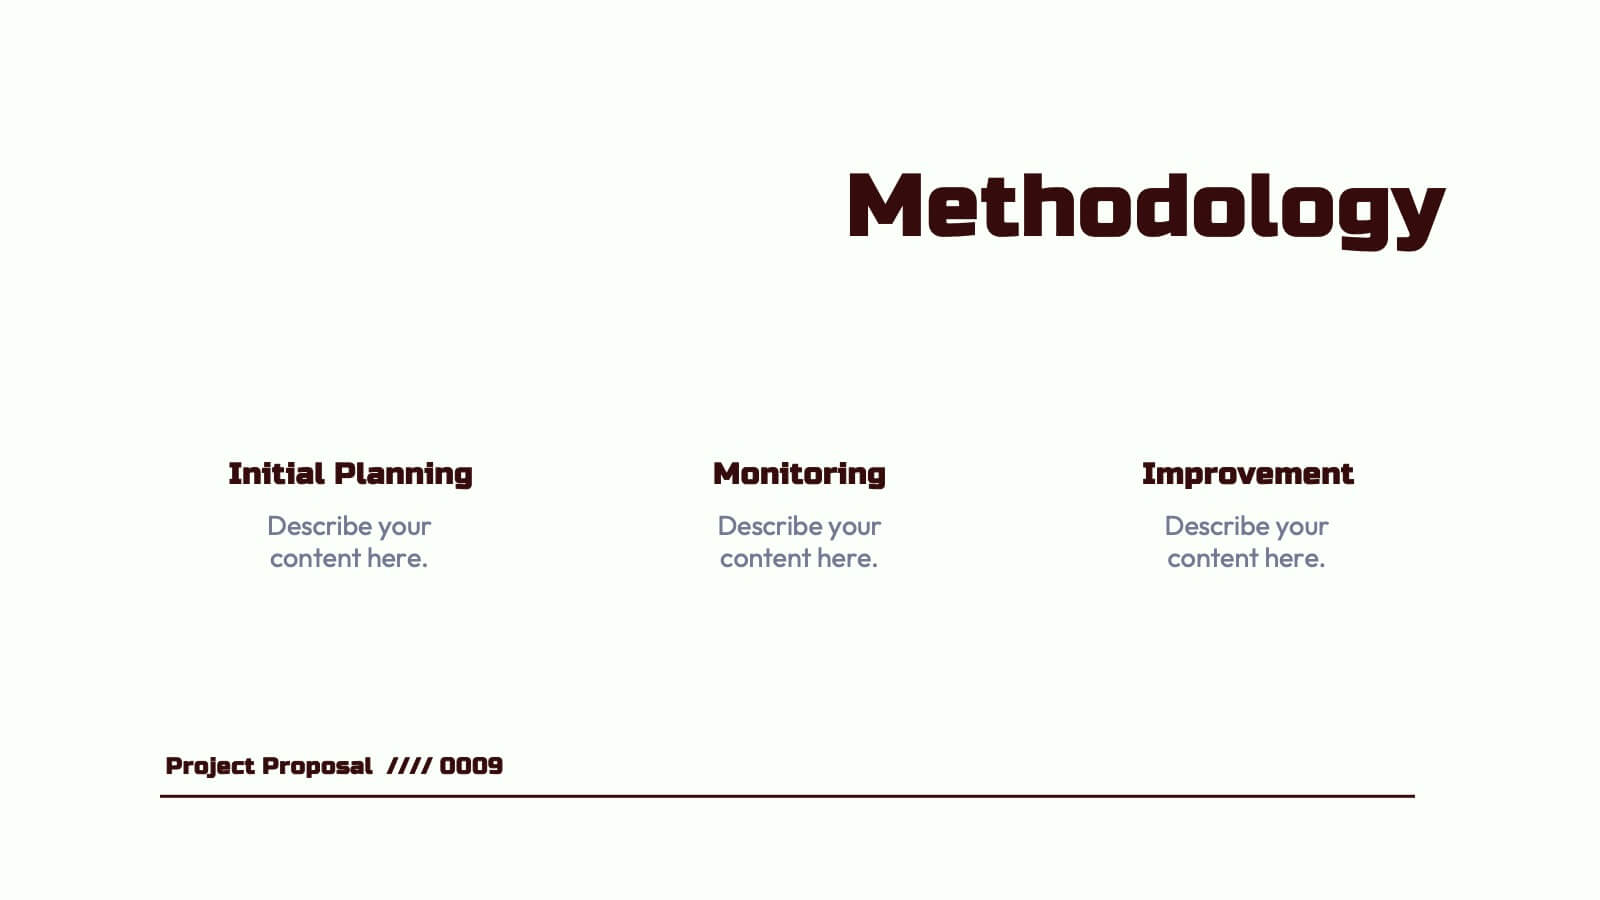
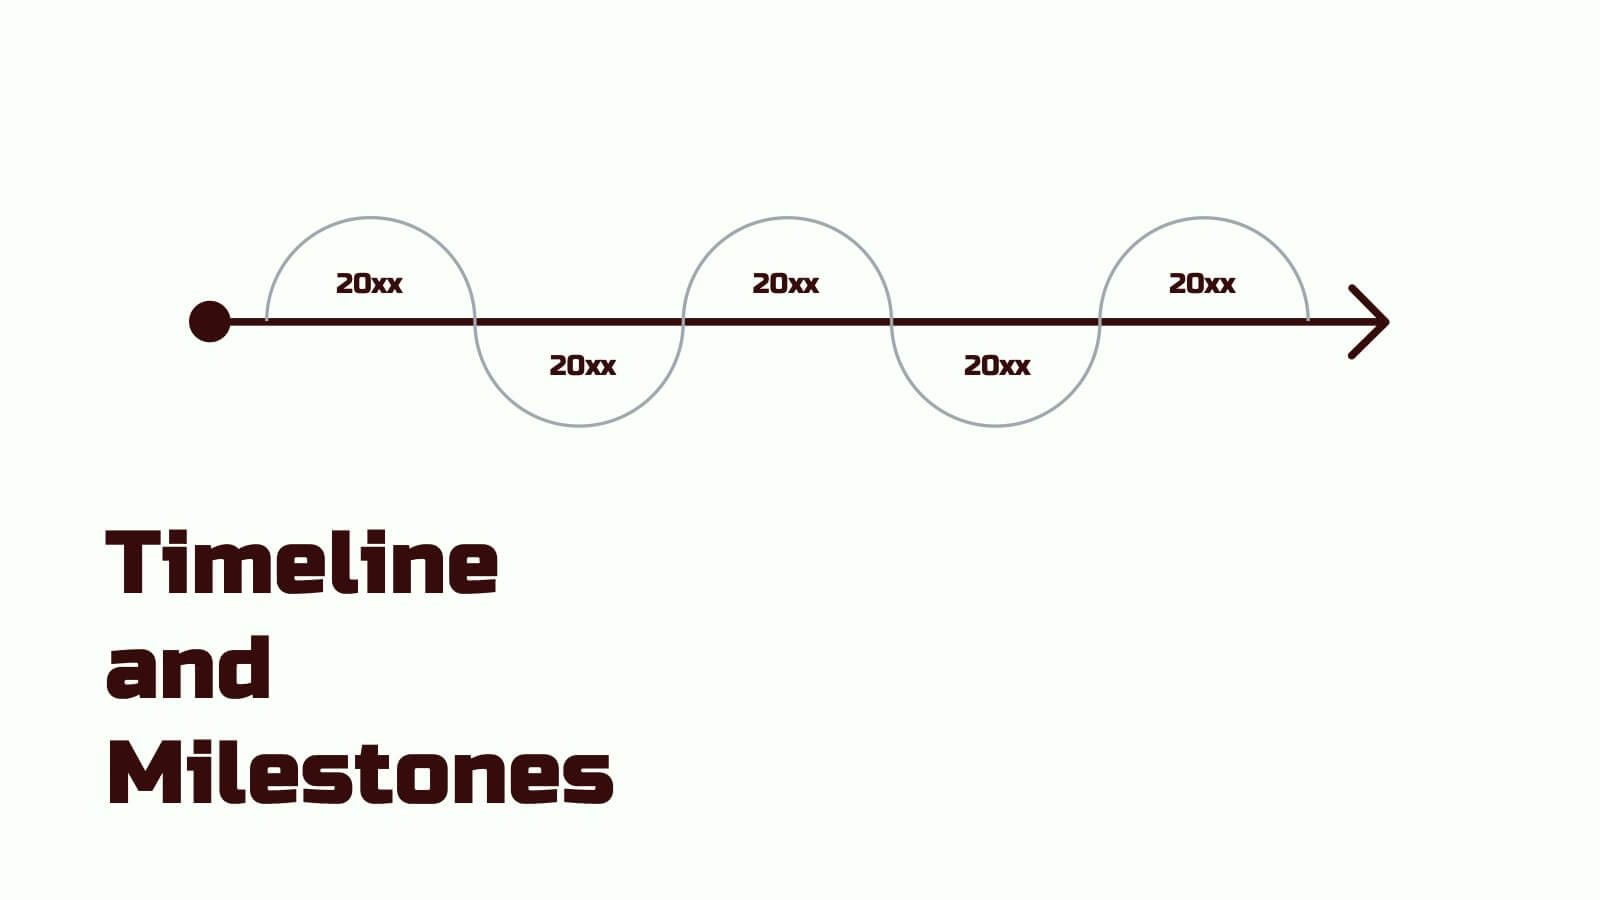
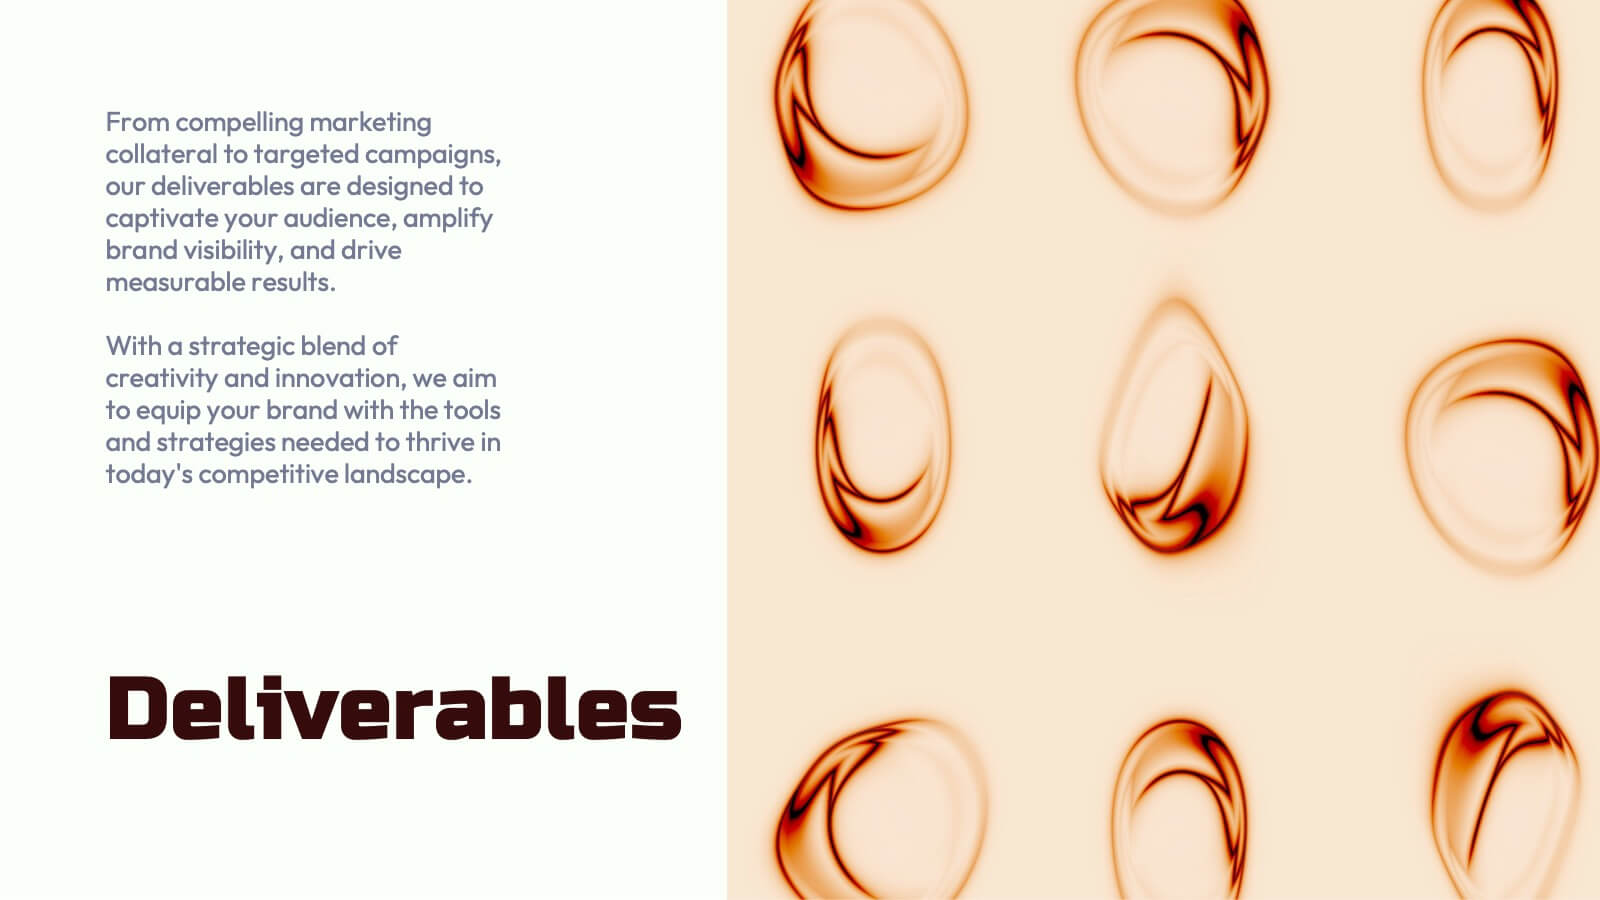
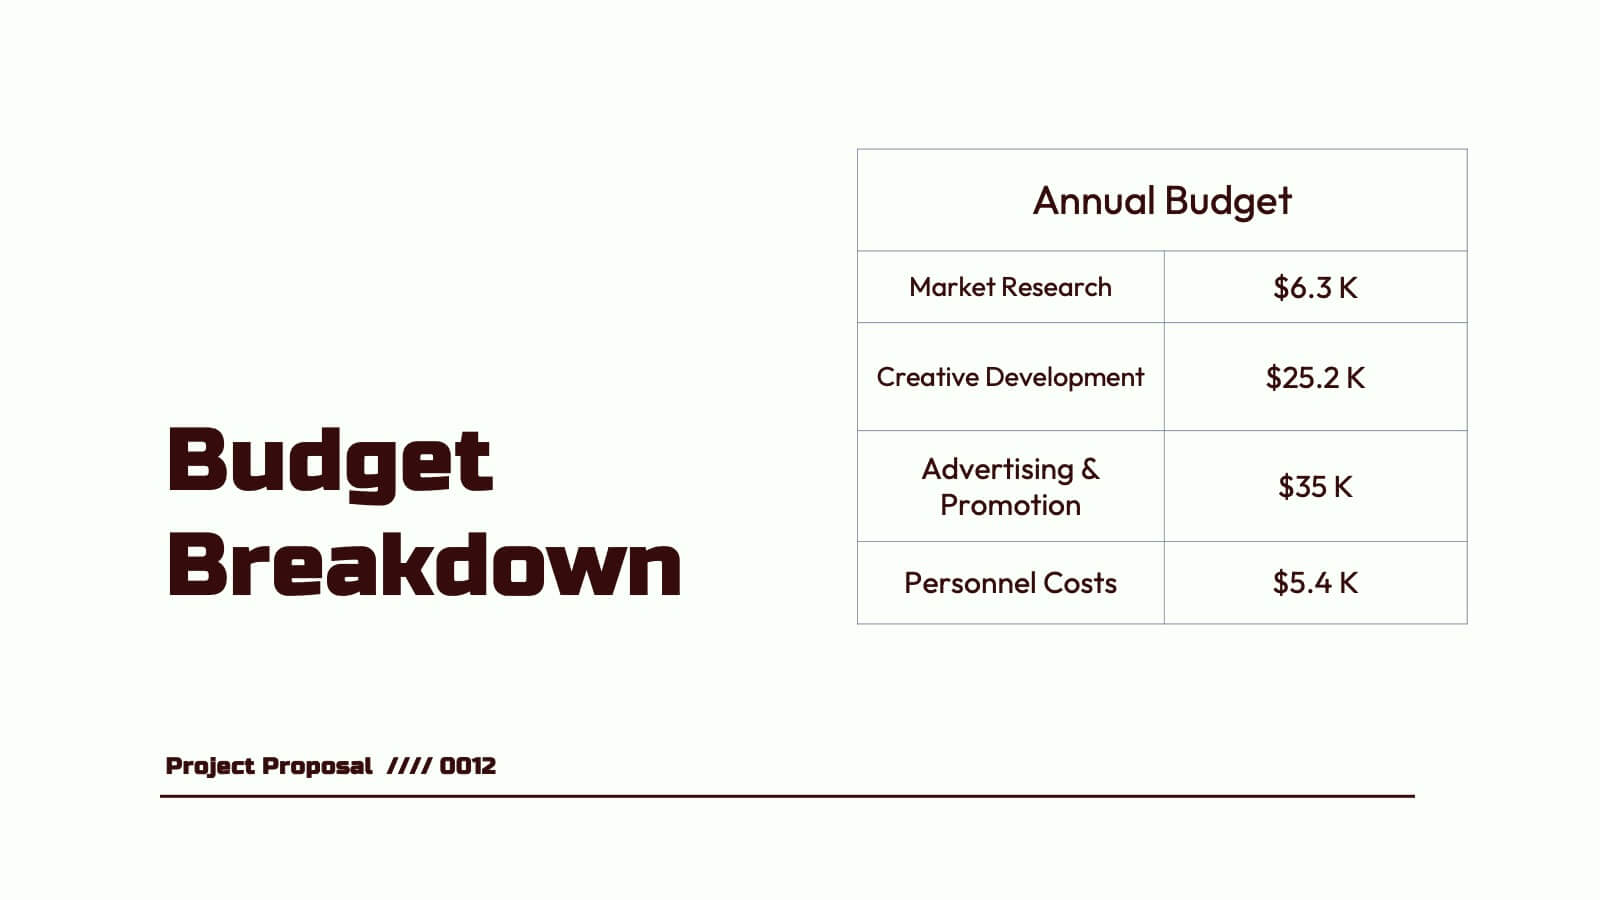
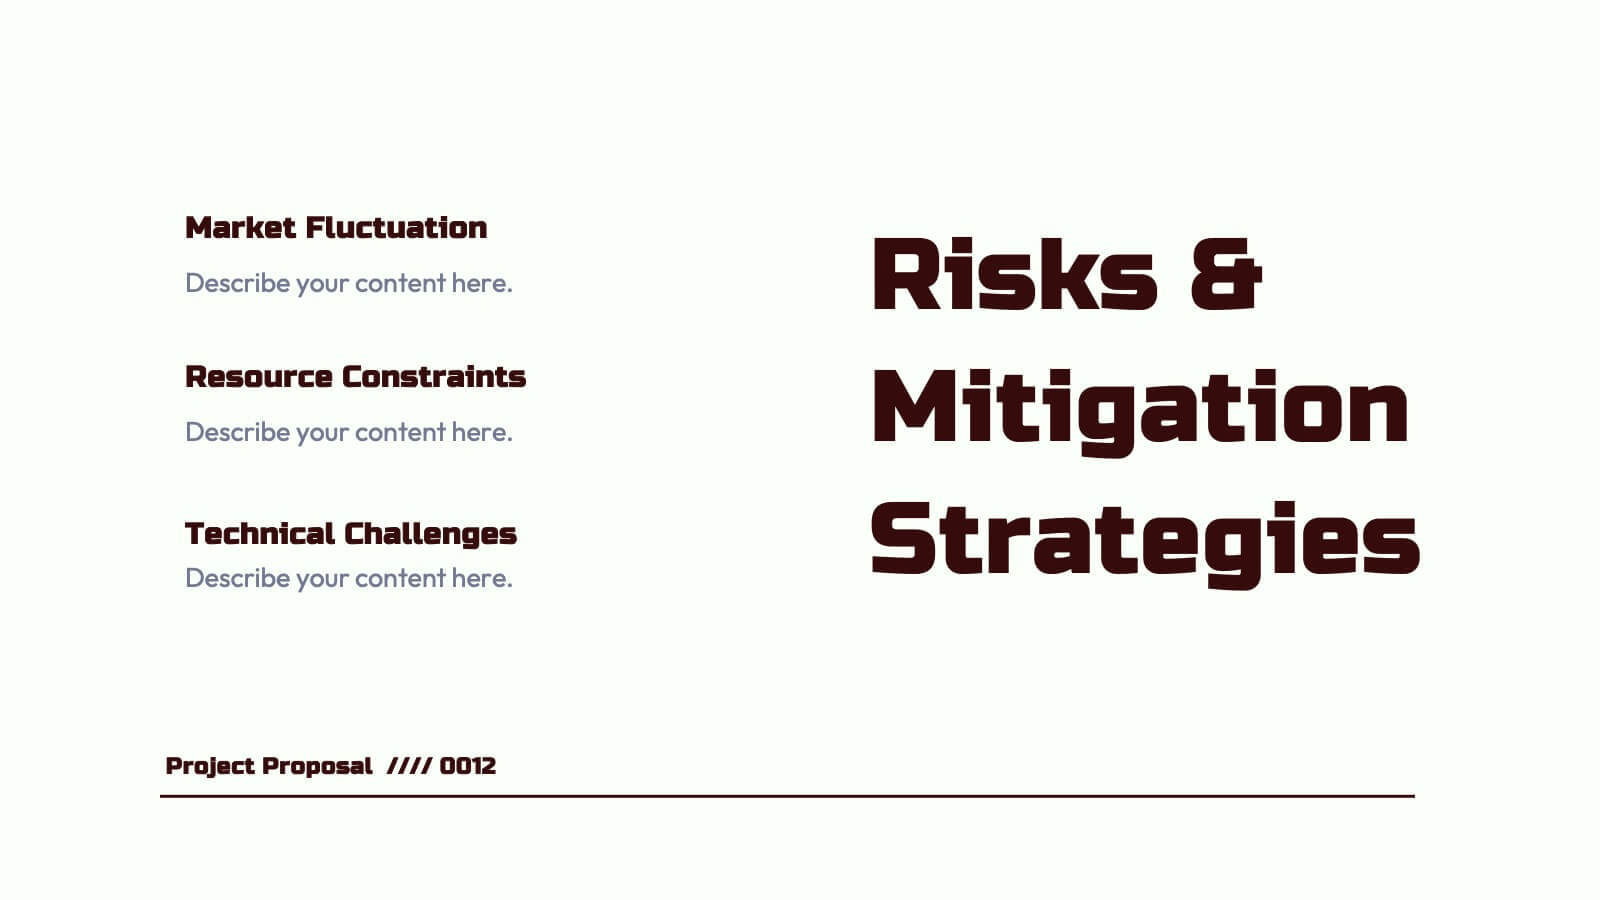
Nebula Project Proposal Presentation
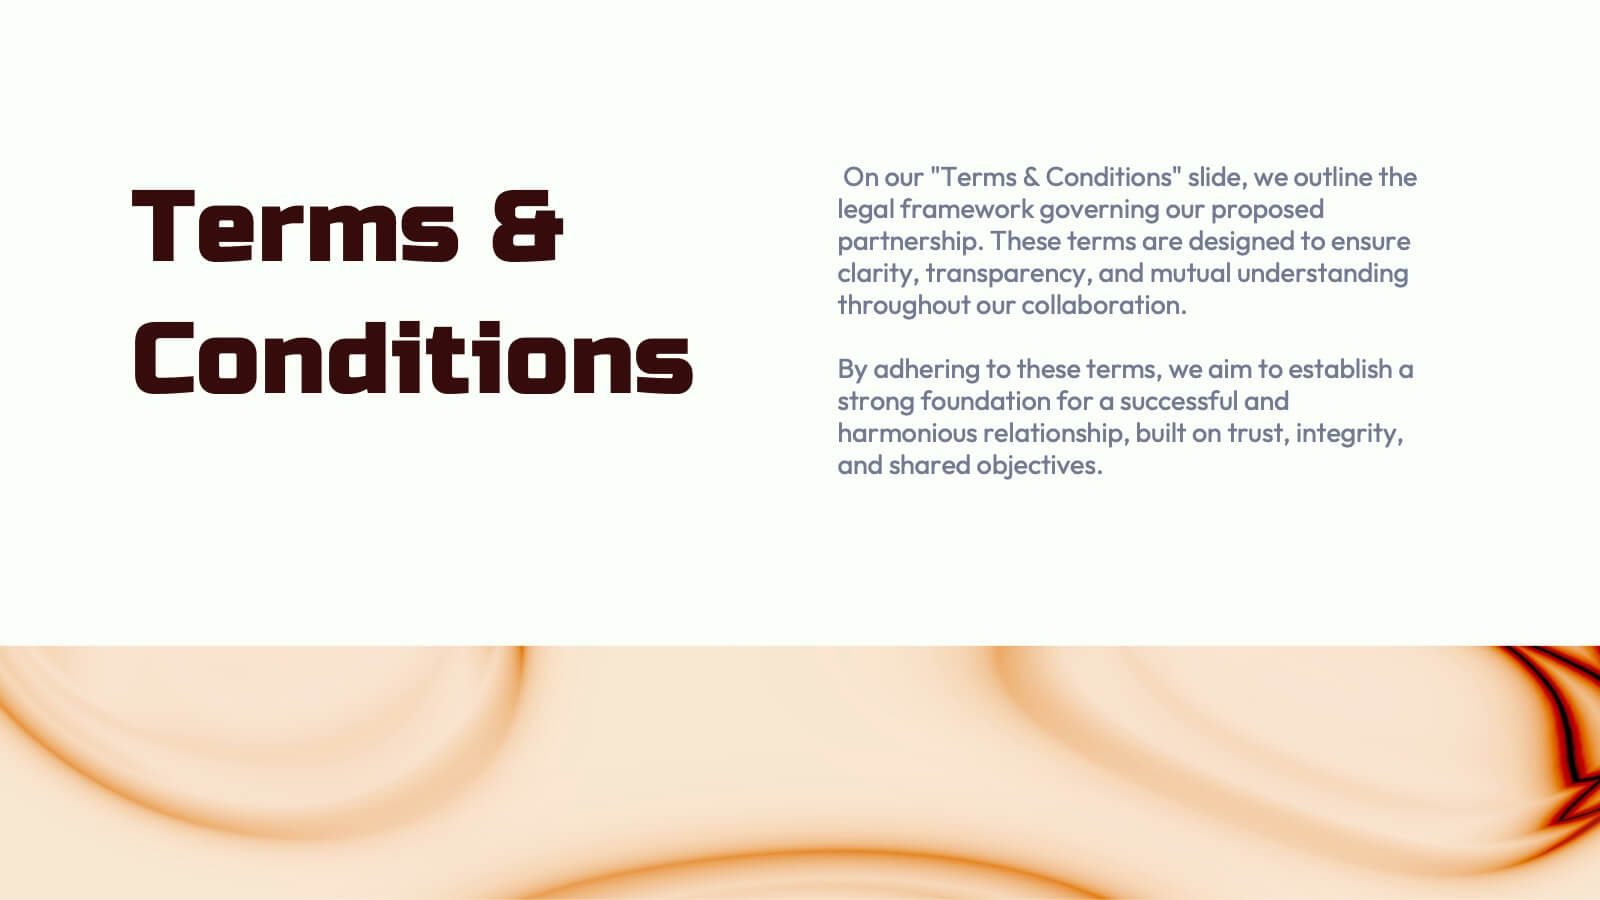
Create a compelling project proposal with this structured, professional template! It includes sections for problem statements, proposed solutions, goals, timelines, and pricing. Perfect for organizing your ideas clearly and professionally, it's fully customizable and compatible with PowerPoint, Keynote, and Google Slides. This template makes it easy to present your proposals effectively and win clients.


5 diapositivas
Real Estate Requirements Infographics
Real Estate Infographics can be an effective way to convey information about the real estate industry in a visually appealing and simple manner. This infographic template is perfect to showcase market trends, statistics, and data in a clear and concise way, making it easier for your audience to interpret the information. As well as educating and informing your clients, investors, and other stakeholders about various aspects of the real estate market. Overall, these infographic will help you communicate information about the real estate industry and help your clients make informed decisions about buying, selling, or investing in property.


22 diapositivas
Galvonic Research Proposal Presentation
Present research insights professionally with this comprehensive proposal template. Covering objectives, methodology, findings, and implications, it provides a clear structure for academic or market research projects. Compatible with PowerPoint, Keynote, and Google Slides, it’s ideal for presenting detailed analysis, conclusions, and future directions.


7 diapositivas
Productivity Comparison Infographic
Step into the dynamic realm of efficiency with our Productivity Comparison Infographic. Set against a pristine white backdrop, the palette dances with the invigorating energy of orange, the reliability of blue, and the fervor of red. This lively template boasts engaging infographics, custom-designed icons, and adaptable image placeholders that vividly illustrate the highs and lows of productivity metrics, tools, and strategies. Expertly crafted for Powerpoint, Keynote, or Google Slides. A must-have for business analysts, team leads, productivity coaches, or any professional keen on spotlighting productivity contrasts.


6 diapositivas
Leadership Development Infographics
Foster leadership growth with our Leadership Development infographic template. This template is fully compatible with popular presentation software like PowerPoint, Keynote, and Google Slides, allowing you to easily customize it to illustrate and communicate various aspects of leadership development. The Leadership Development infographic template offers a visually engaging platform to explore and explain the principles, strategies, and practices related to nurturing leadership skills within individuals and organizations. Whether you're an HR professional, business leader, educator, or aspiring leader, this template provides a user-friendly canvas to create informative presentations and educational materials. Enhance your knowledge of Leadership Development with this SEO-optimized infographic template, thoughtfully designed for clarity and ease of use. Customize it to highlight key leadership competencies, training methods, coaching approaches, and the impact of effective leadership on organizational success. Ensure that your audience gains valuable insights into the world of leadership development. Start crafting your personalized infographic today to empower leadership growth.


8 diapositivas
Airline Business Strategy Presentation
Leverage key insights into the aviation sector with the "Aviation Industry Market Analysis" presentation template. This design allows professionals in the aviation industry to effectively communicate market trends and forecasts. Its compatibility with PowerPoint, Keynote, and Google Slides ensures a versatile use across different platforms, making it ideal for industry analyses, investor meetings, or internal strategy discussions.


21 diapositivas
Cineris Product Roadmap Presentation
Present your product vision and strategy with this professional and modern product roadmap presentation template. Covering key aspects such as product overview, features, competitive analysis, pricing strategy, and production process, this template helps you communicate your plan effectively. Designed for easy customization, it’s perfect for internal team alignment, stakeholder presentations, and strategic planning. Compatible with PowerPoint, Keynote, and Google Slides.


10 diapositivas
Organizational Hierarchy Infographic Presentation
Clearly define your Organizational Hierarchy with this structured infographic template. Designed for business presentations, HR teams, and corporate strategy, this visual layout simplifies reporting structures, leadership roles, and team organization. Fully customizable and easy to edit in PowerPoint, Keynote, and Google Slides, making it perfect for internal communications and management reports.


10 diapositivas
Projects Completion Checklist Presentation
Keep every milestone visible and celebrate progress with a clean, structured layout designed to track project achievements. This presentation helps teams communicate goals, timelines, and completed tasks clearly and professionally. Fully customizable and compatible with PowerPoint, Keynote, and Google Slides for seamless editing and polished project reporting.