


Características


¿Tienes alguna pregunta?
Recomendar


22 diapositivas
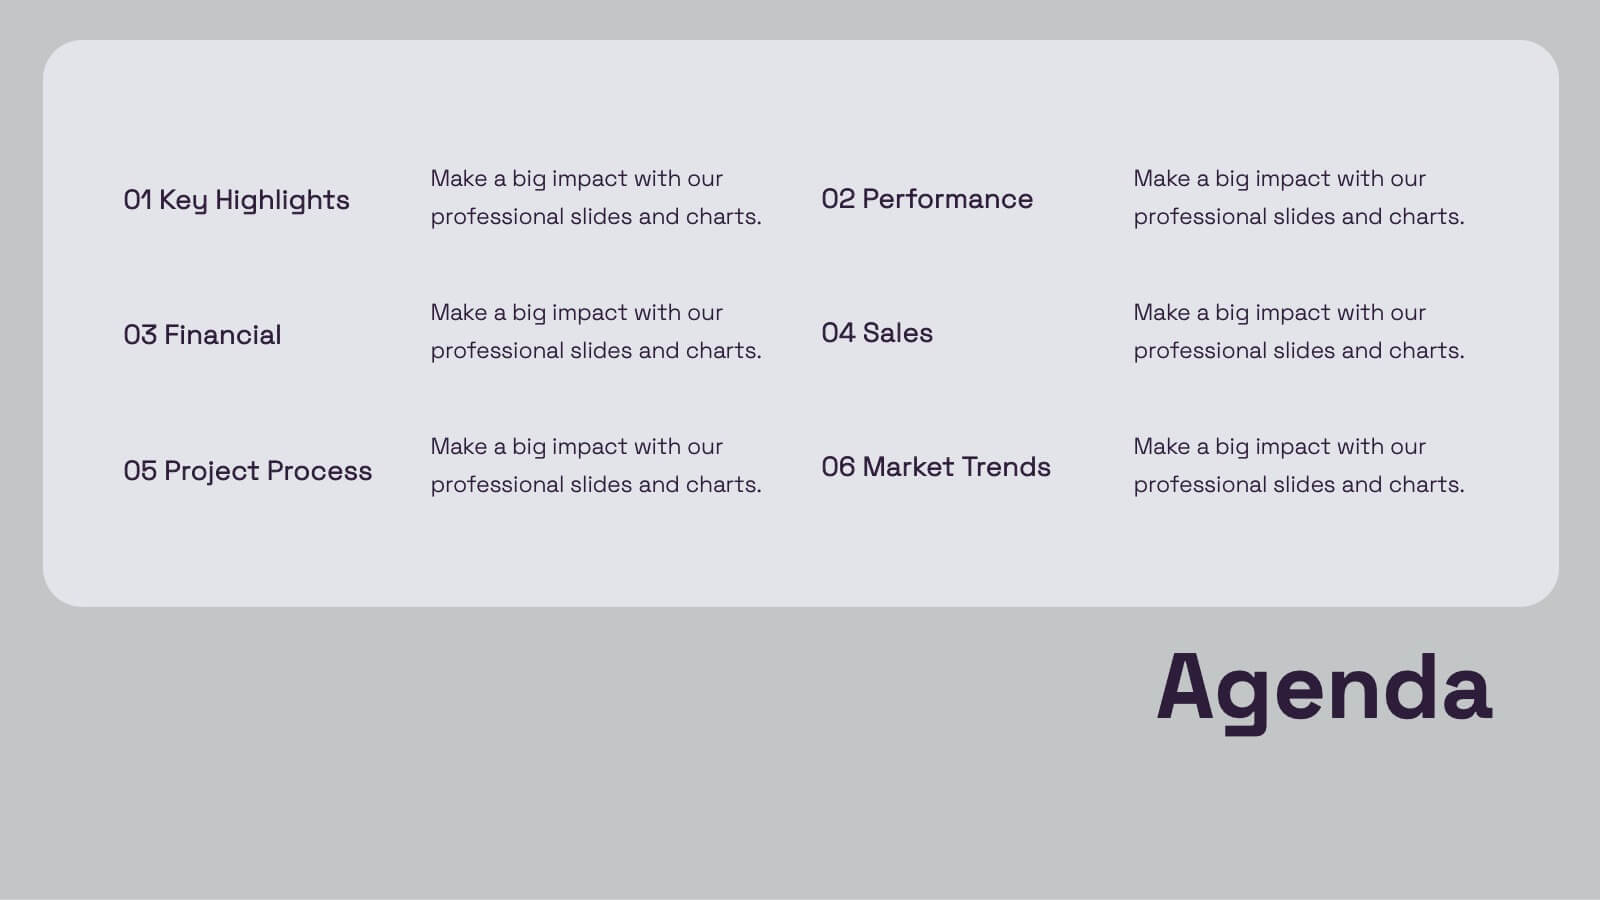
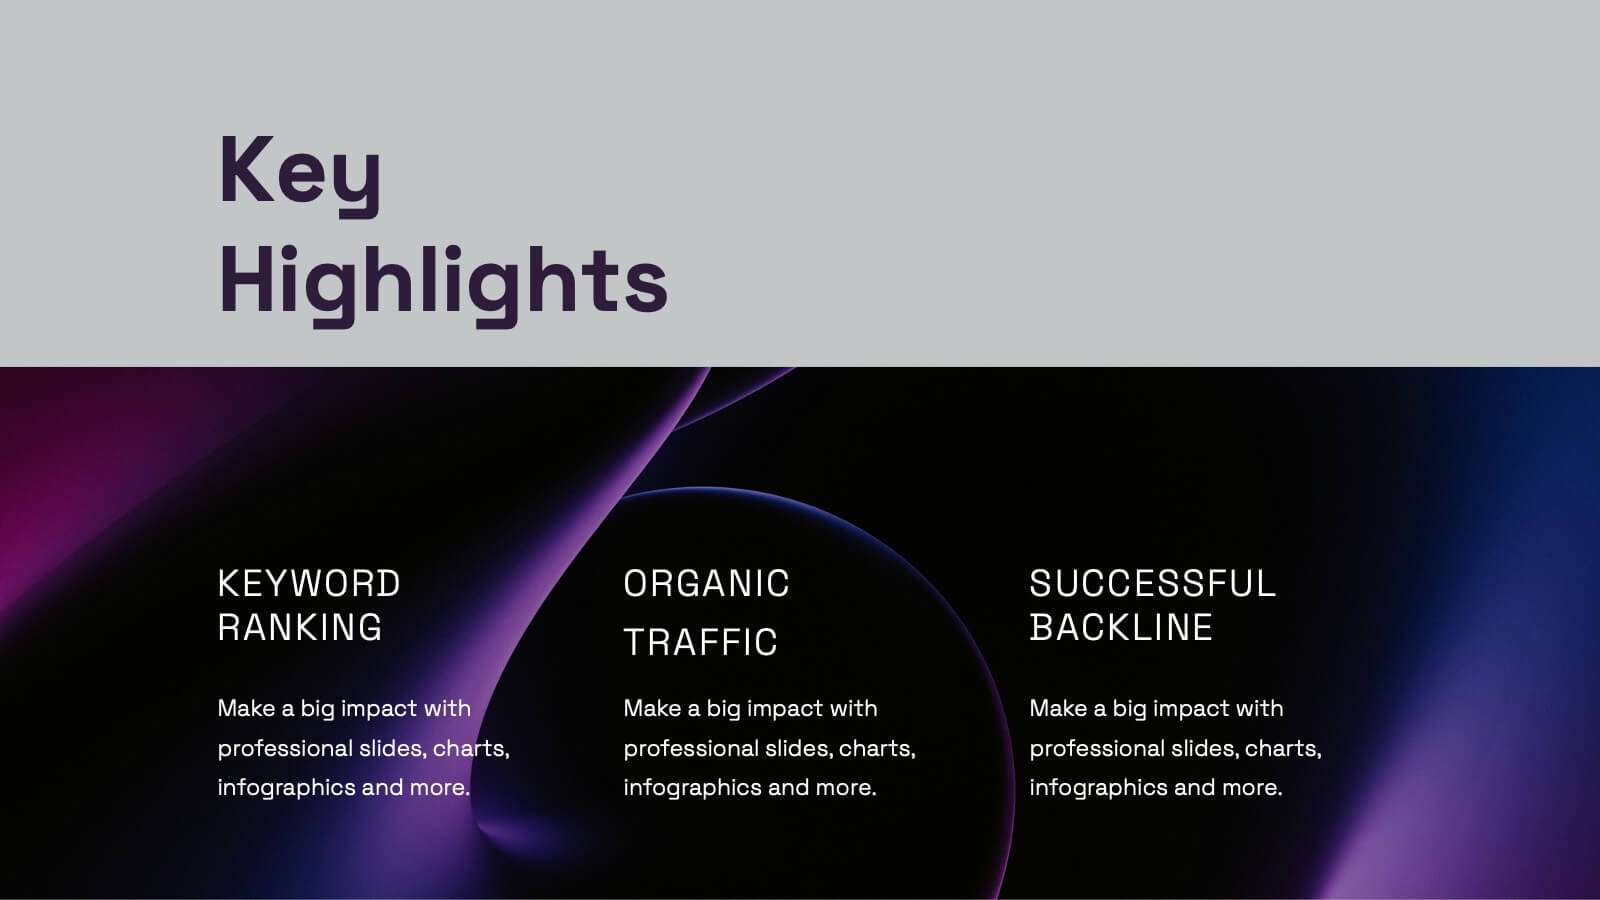
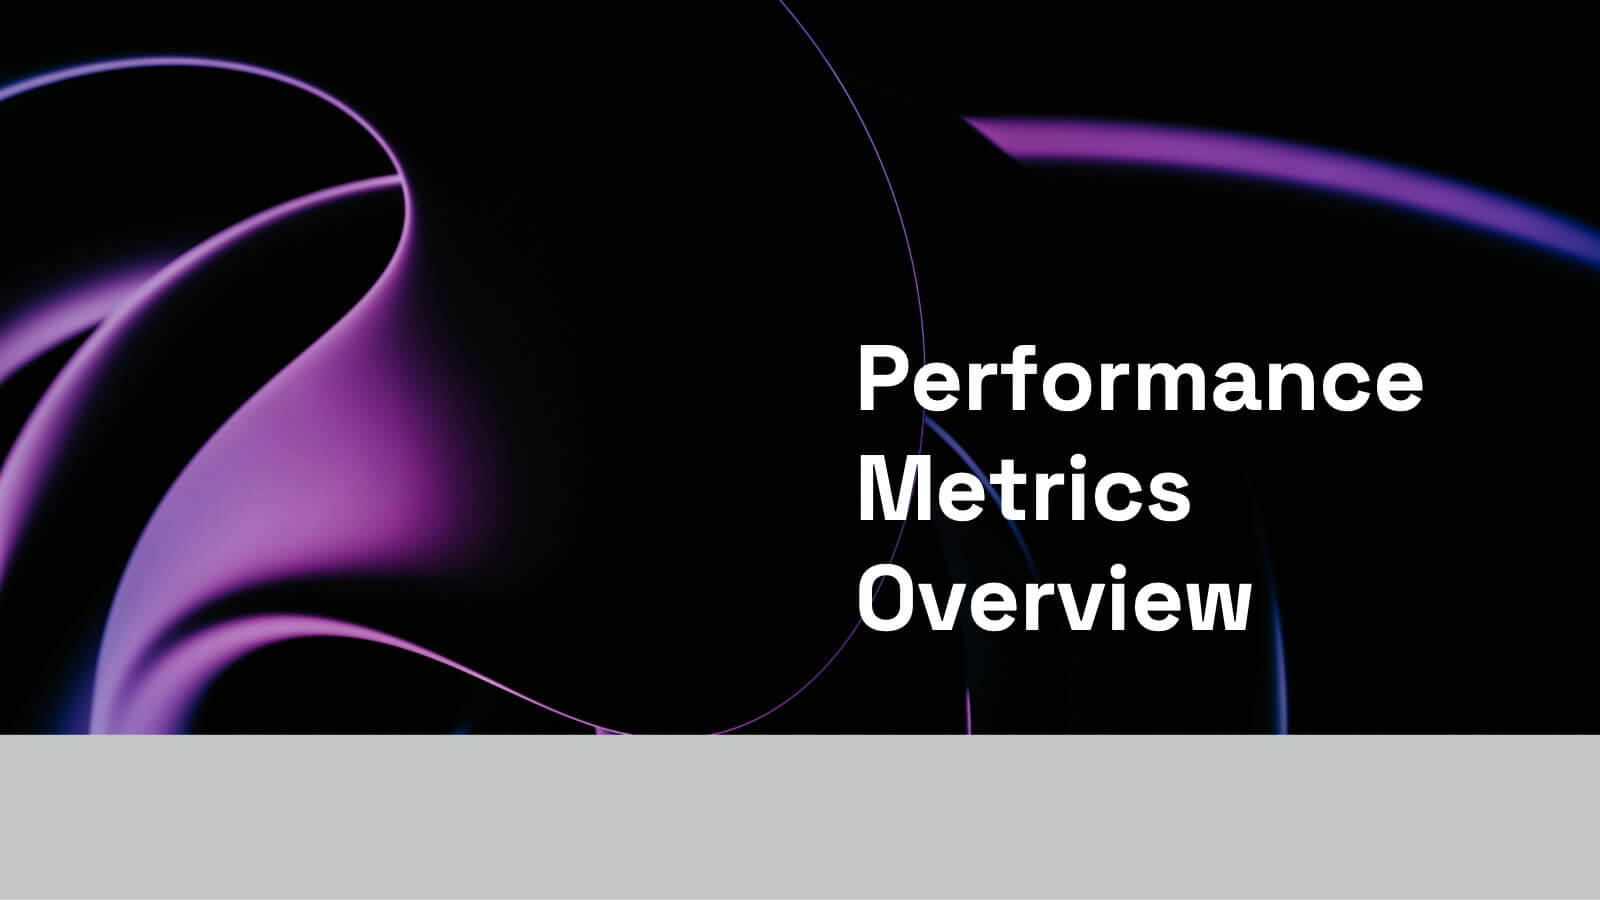
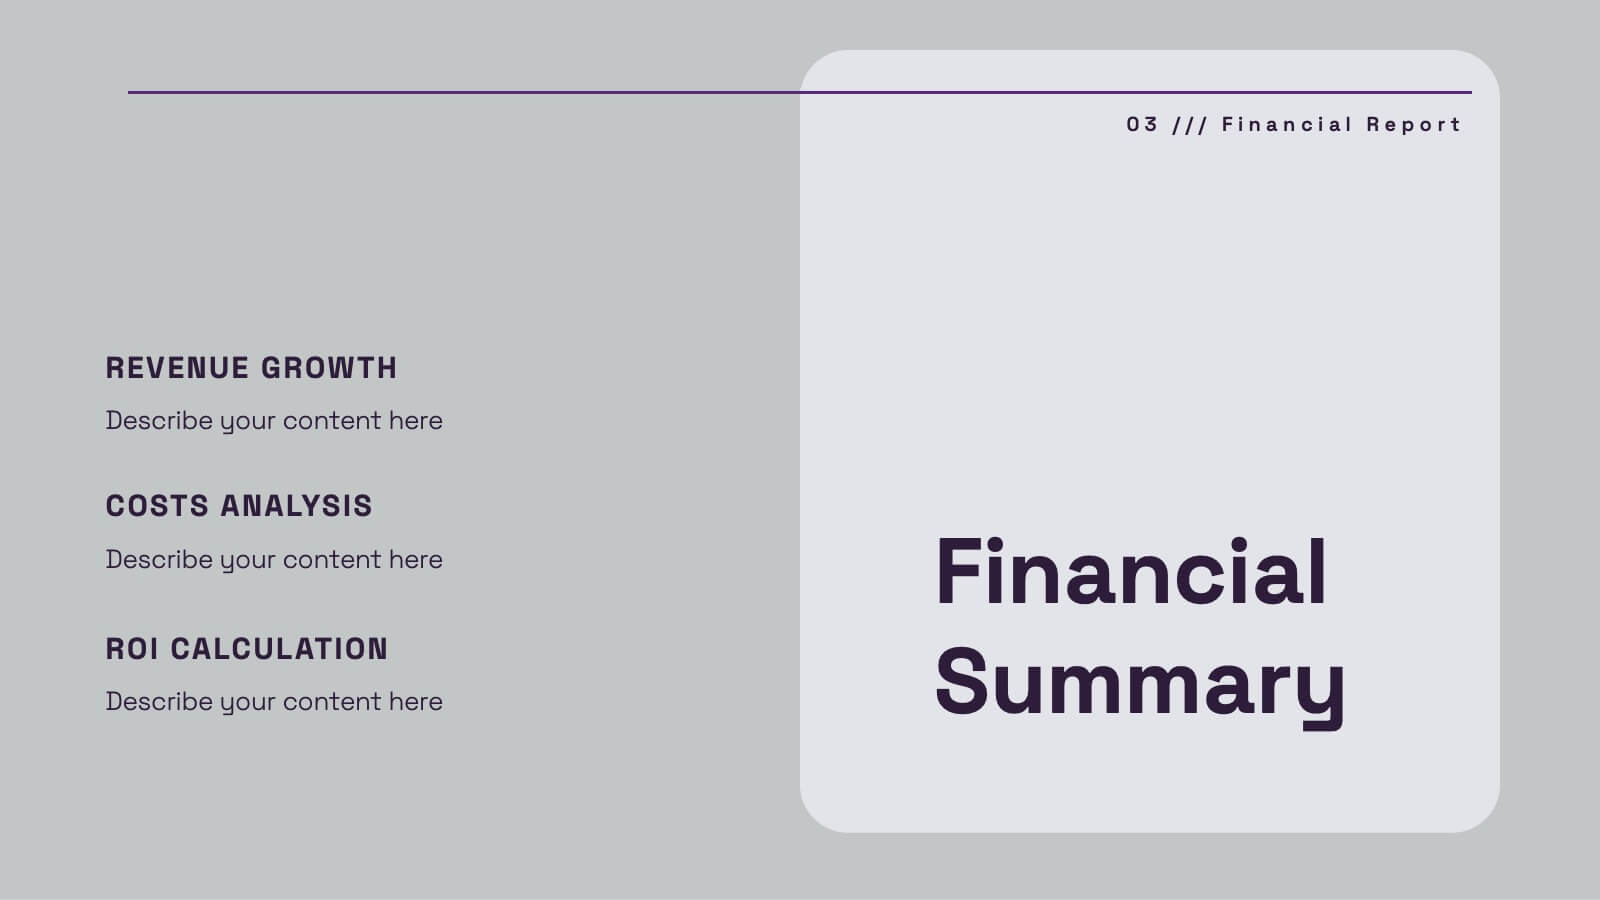
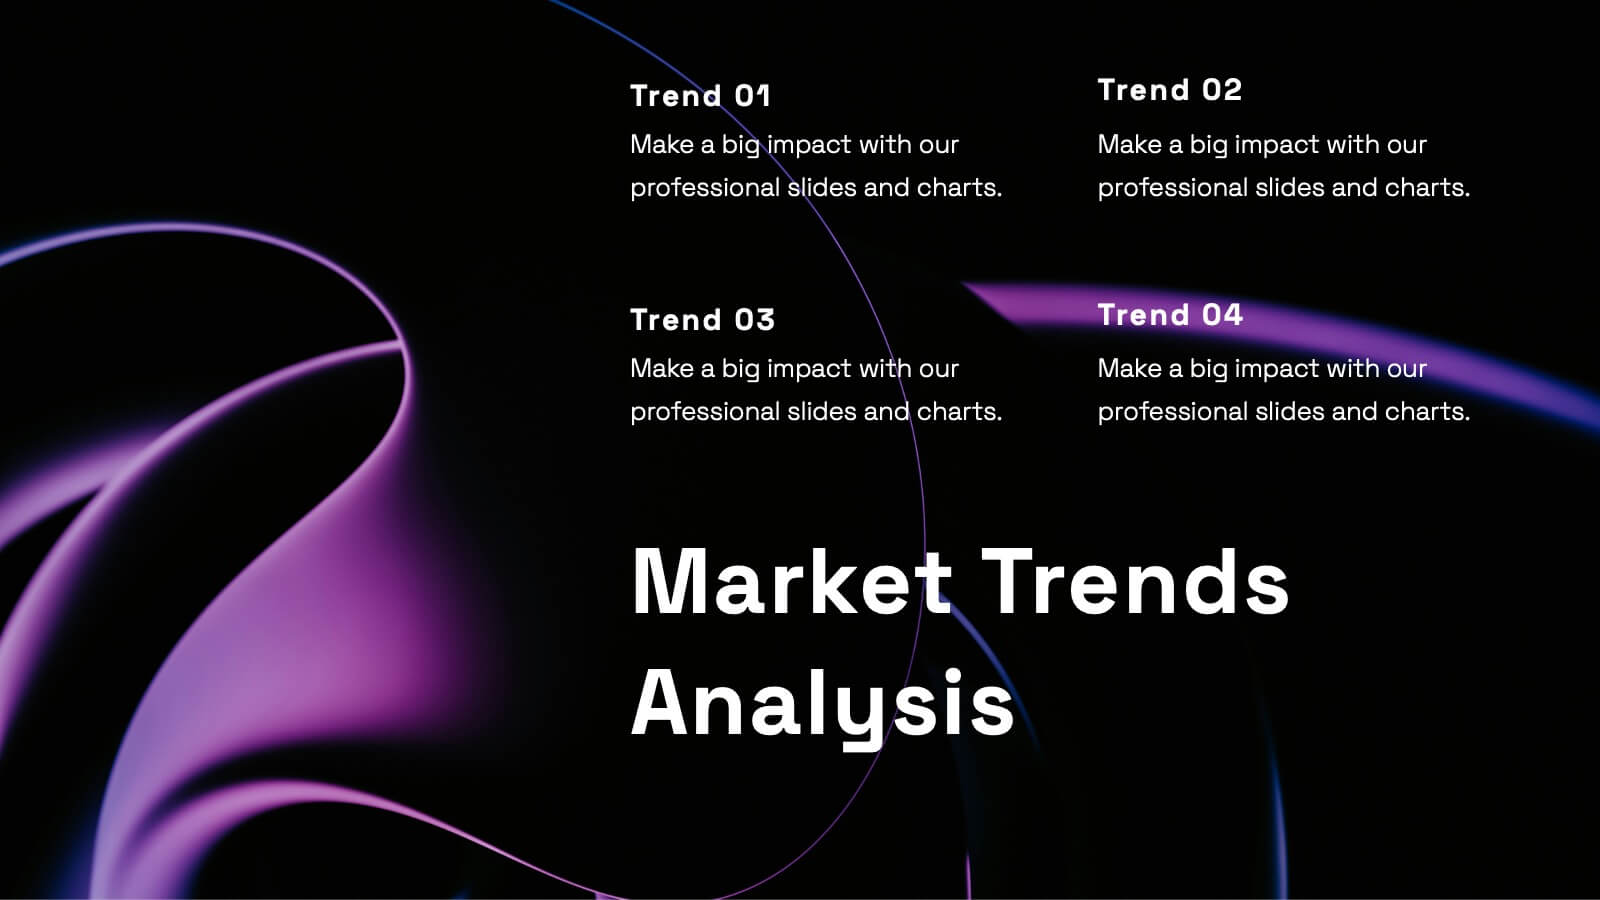
Gale Gust Financial Report Presentation
Unleash the power of your financial presentations with the Gale Gust Financial Report template! This sleek, modern design features a captivating black theme that radiates professionalism and confidence. The layout is meticulously structured to guide your audience through key highlights, performance metrics, sales performance, and financial summaries with ease. Each slide is designed to keep the focus on your data, with clean lines and a minimalist aesthetic that enhances readability and impact. Whether you're showcasing operational updates, market trends, or strategic initiatives, this template ensures that your content shines. Ideal for corporate meetings, investor updates, and financial reviews, this template is fully compatible with PowerPoint, Keynote, and Google Slides. The Gale Gust template is your perfect companion for delivering financial reports that command attention and leave a lasting impression. Get ready to make your numbers speak volumes!


21 diapositivas
Uplift Financial Report Presentation
Present your financial or business report with this sleek and modern presentation template! It includes essential sections such as performance metrics, financial summaries, project progress, and market trends analysis, ensuring a comprehensive overview. Whether you're discussing key achievements or competitor insights, this template is perfect for delivering a professional and polished report. Compatible with PowerPoint, Keynote, and Google Slides for easy use and customization.


6 diapositivas
Risk and Return Investment
Illustrate the delicate balance between risk and reward with this visual concept. This presentation uses a see-saw metaphor to compare investment risk versus financial return, ideal for finance professionals, consultants, and educators. Fully customizable in PowerPoint, Keynote, and Google Slides.


5 diapositivas
Types of Natural Disasters Infographics
Immerse in the dynamic realm of nature with our types of natural disasters infographics. Utilizing an earthy color scheme of blue, tan, and red, this template plunges viewers into the heart of environmental extremities. It's an invaluable resource for educators, students, and environmentalists. Compatible with Powerpoint, Keynote, and Google Slides. The design, brimming with creative vigor, incorporates striking graphics and icons, offering a vivid exploration of the various forces that shape our planet. This compilation doesn't just inform but captivates, turning statistics and data into compelling storytelling.


5 diapositivas
Understanding Customer Needs with Empathy Map Presentation
Gain deeper customer insights with the Understanding Customer Needs with Empathy Map Presentation. This template simplifies user research by visually organizing customer thoughts, behaviors, and emotions into a clear layout. Perfect for UX teams, product designers, and marketers aiming to craft user-centric strategies. Fully editable in PowerPoint, Keynote, Canva, and Google Slides.


5 diapositivas
Physical Science Infographics
Immerse in the realm of physical sciences with our physical science infographics template. Set against a deep cosmos of blues and purples, this template serves as a bridge between complex scientific principles and audiences, ideal for educators, students, and science communicators. The design, balancing creativity and informativeness, integrates stunning graphics and icons, turning data and facts into captivating visual stories. This dark-themed, visually engaging layout is not just an educational tool, but a spark that ignites curiosity and exploration in classrooms, scientific presentations, or educational content, making science both profound and accessible.


4 diapositivas
Conversion Funnel Stages Presentation
Bring clarity to every step of your customer journey with this clean, visually aligned funnel layout designed for quick understanding. This presentation breaks your process into clear stages, helping you explain performance, drop-offs, and opportunities with ease. Fully compatible with PowerPoint, Keynote, and Google Slides.


20 diapositivas
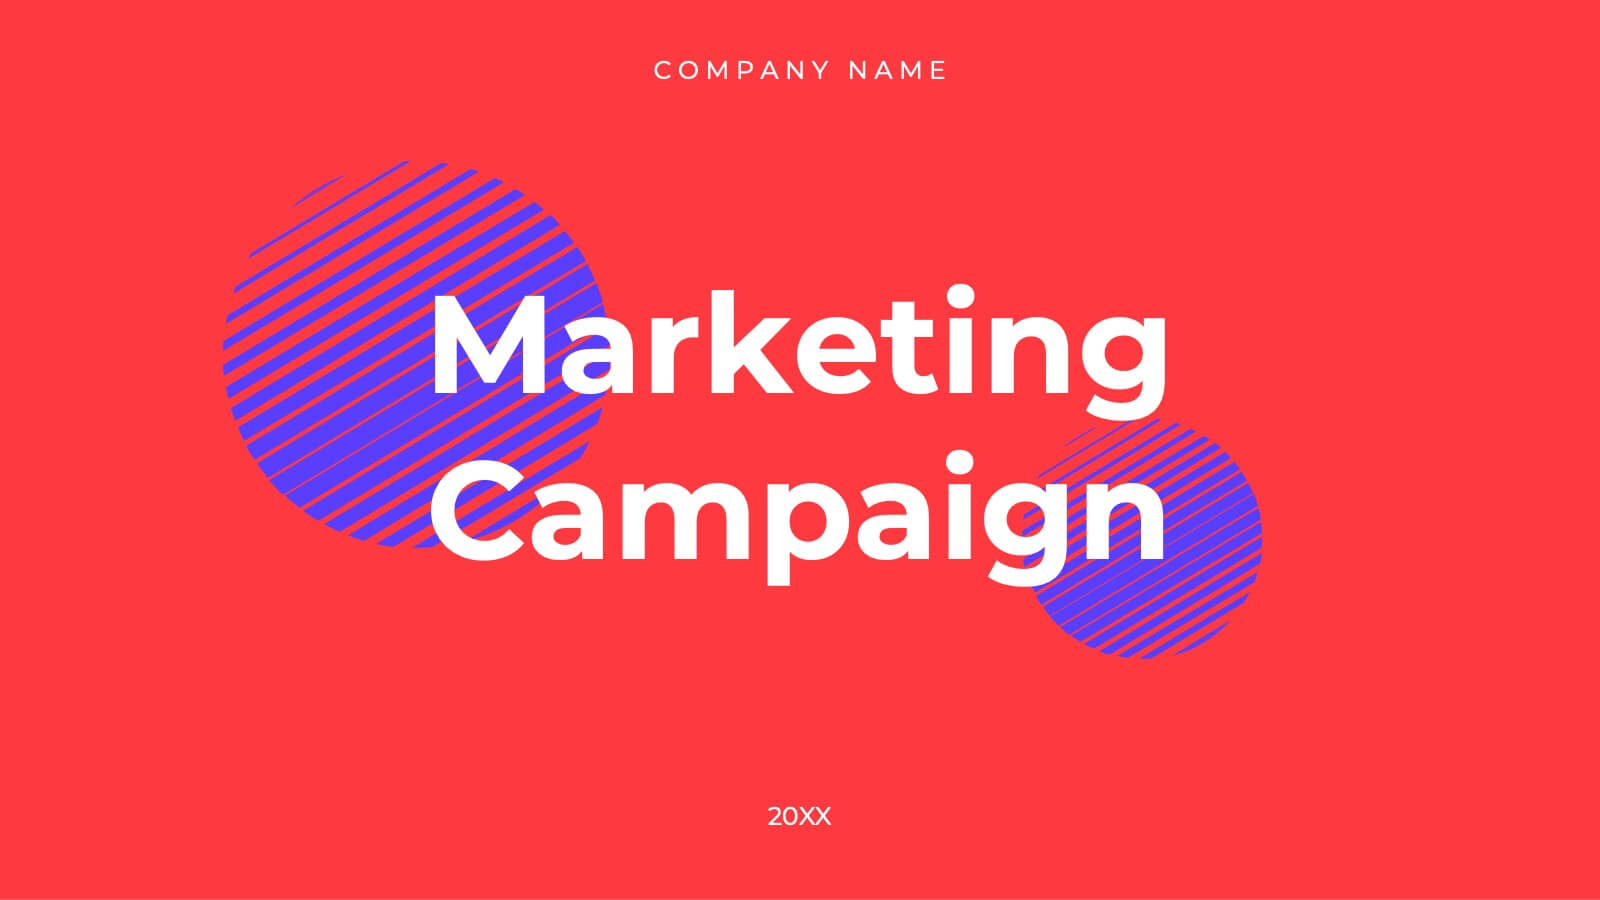
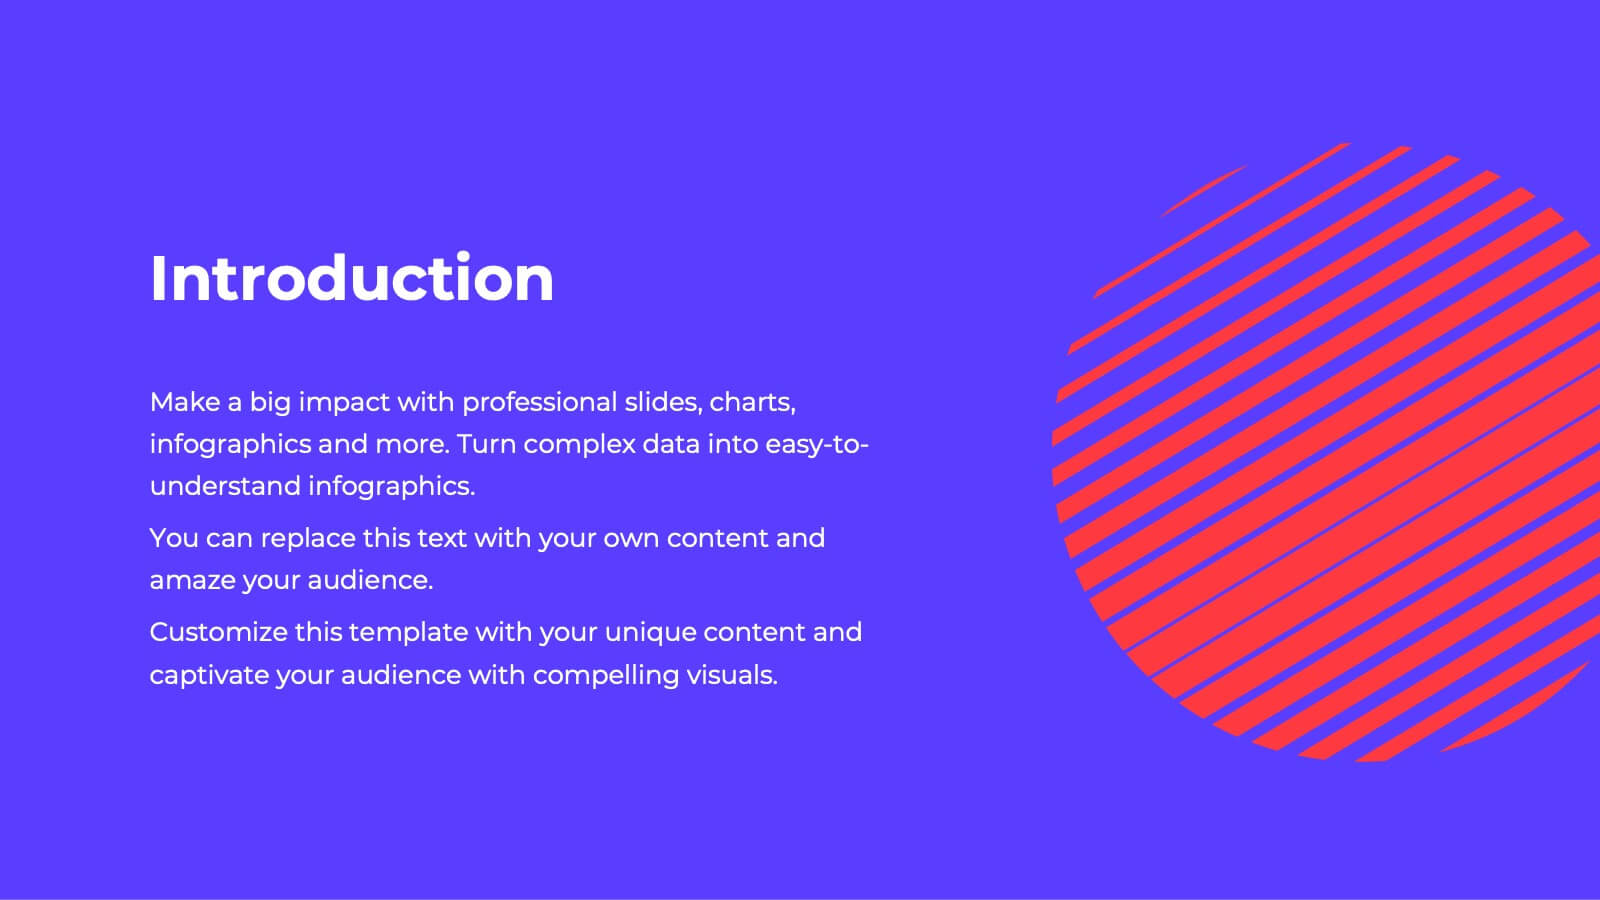
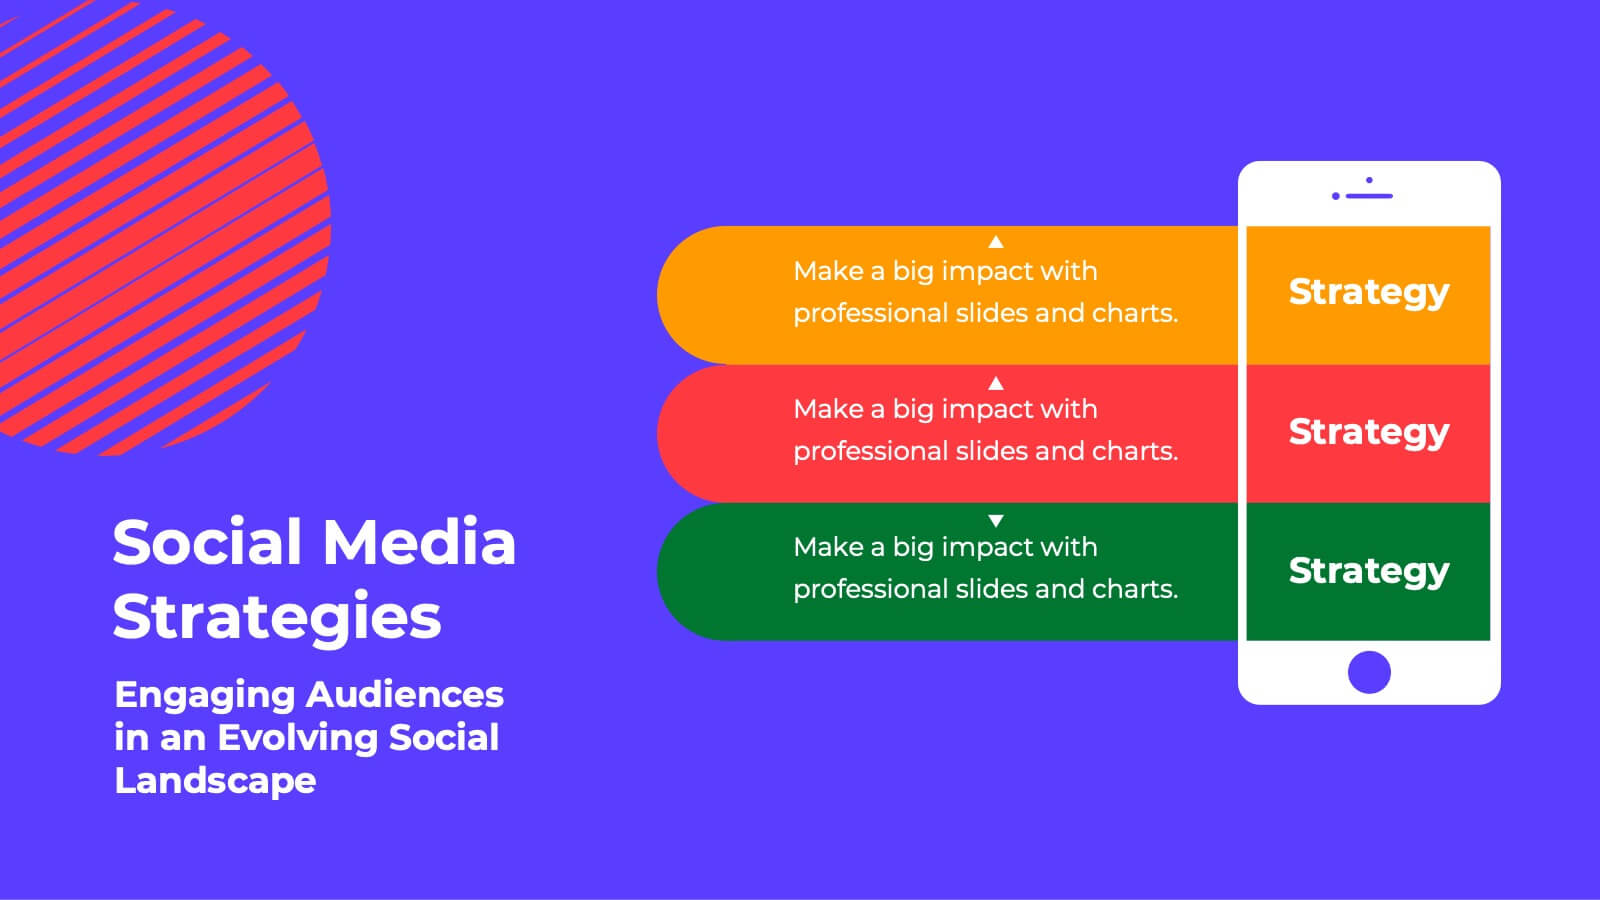
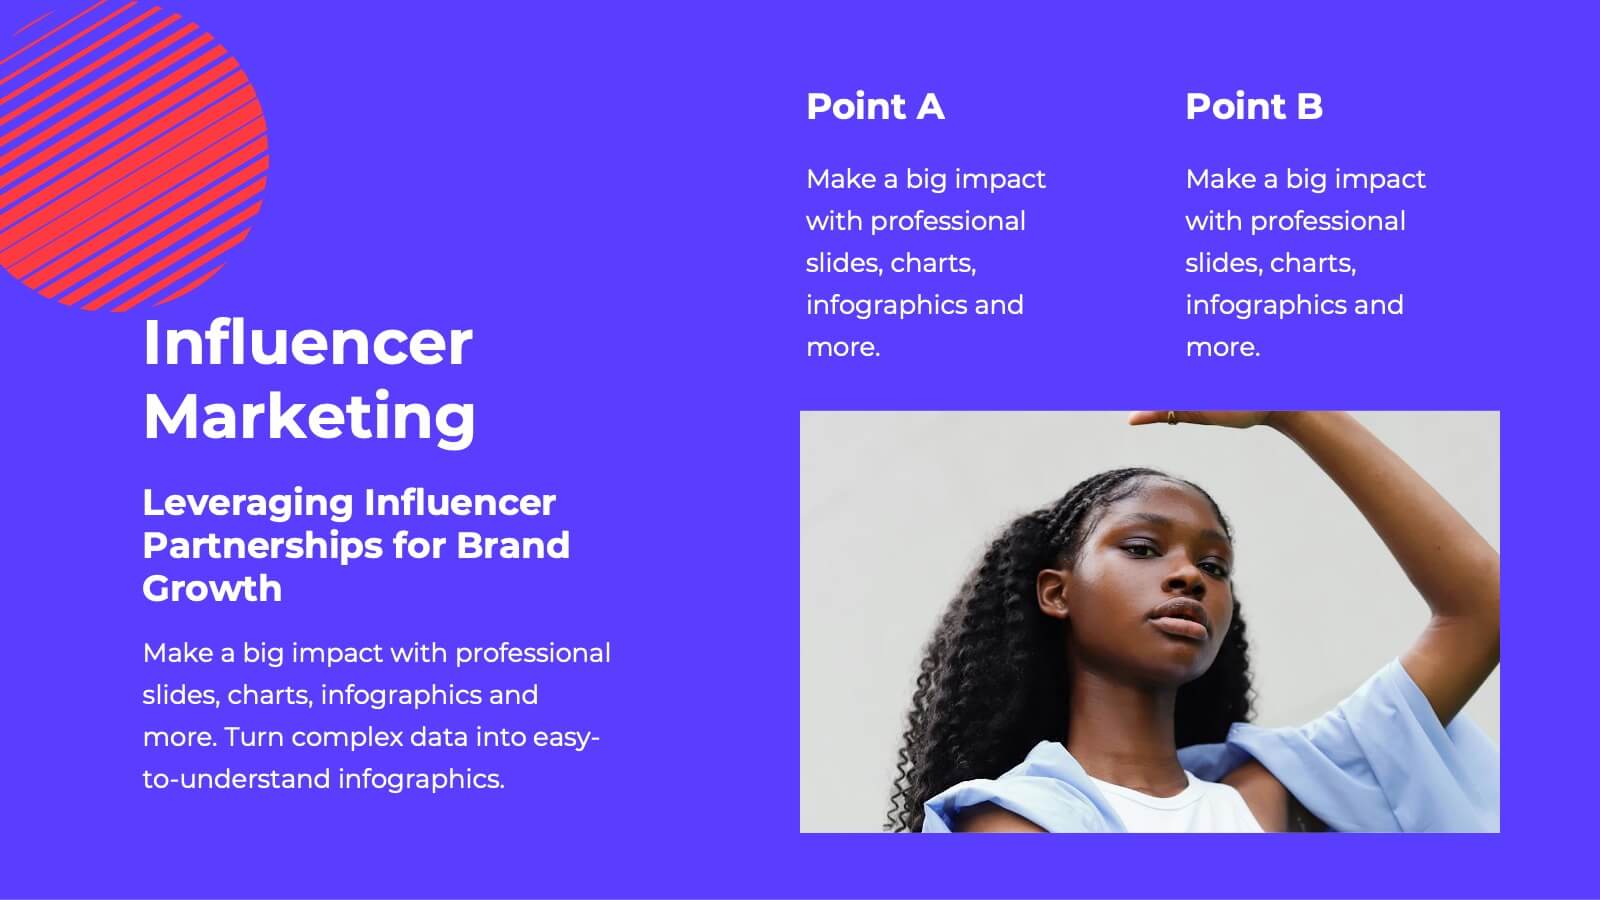
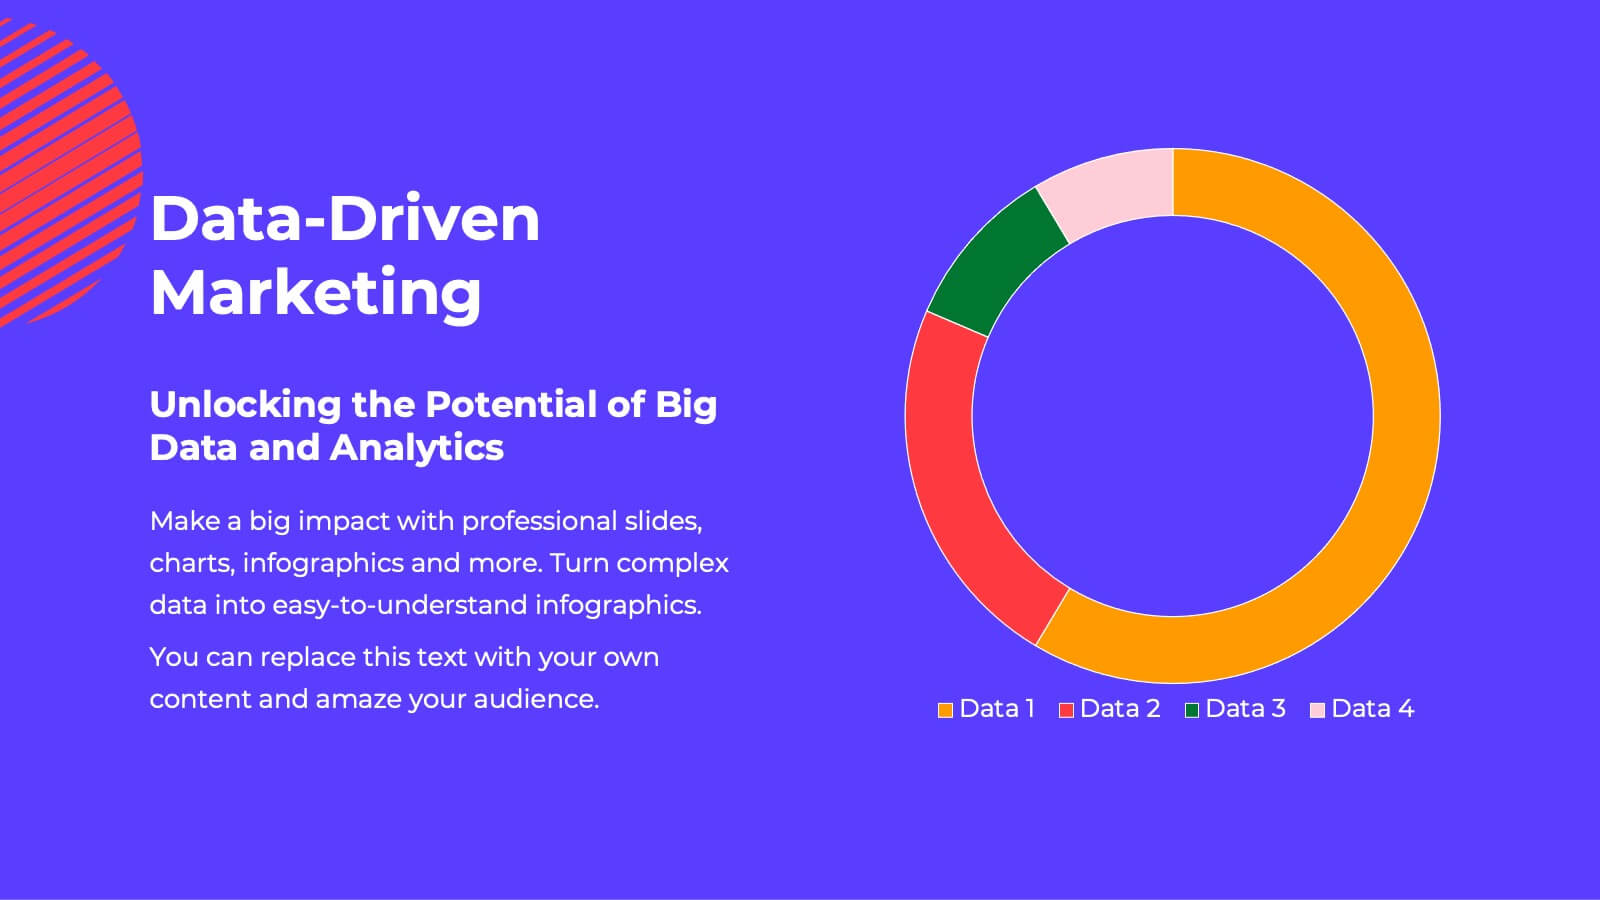
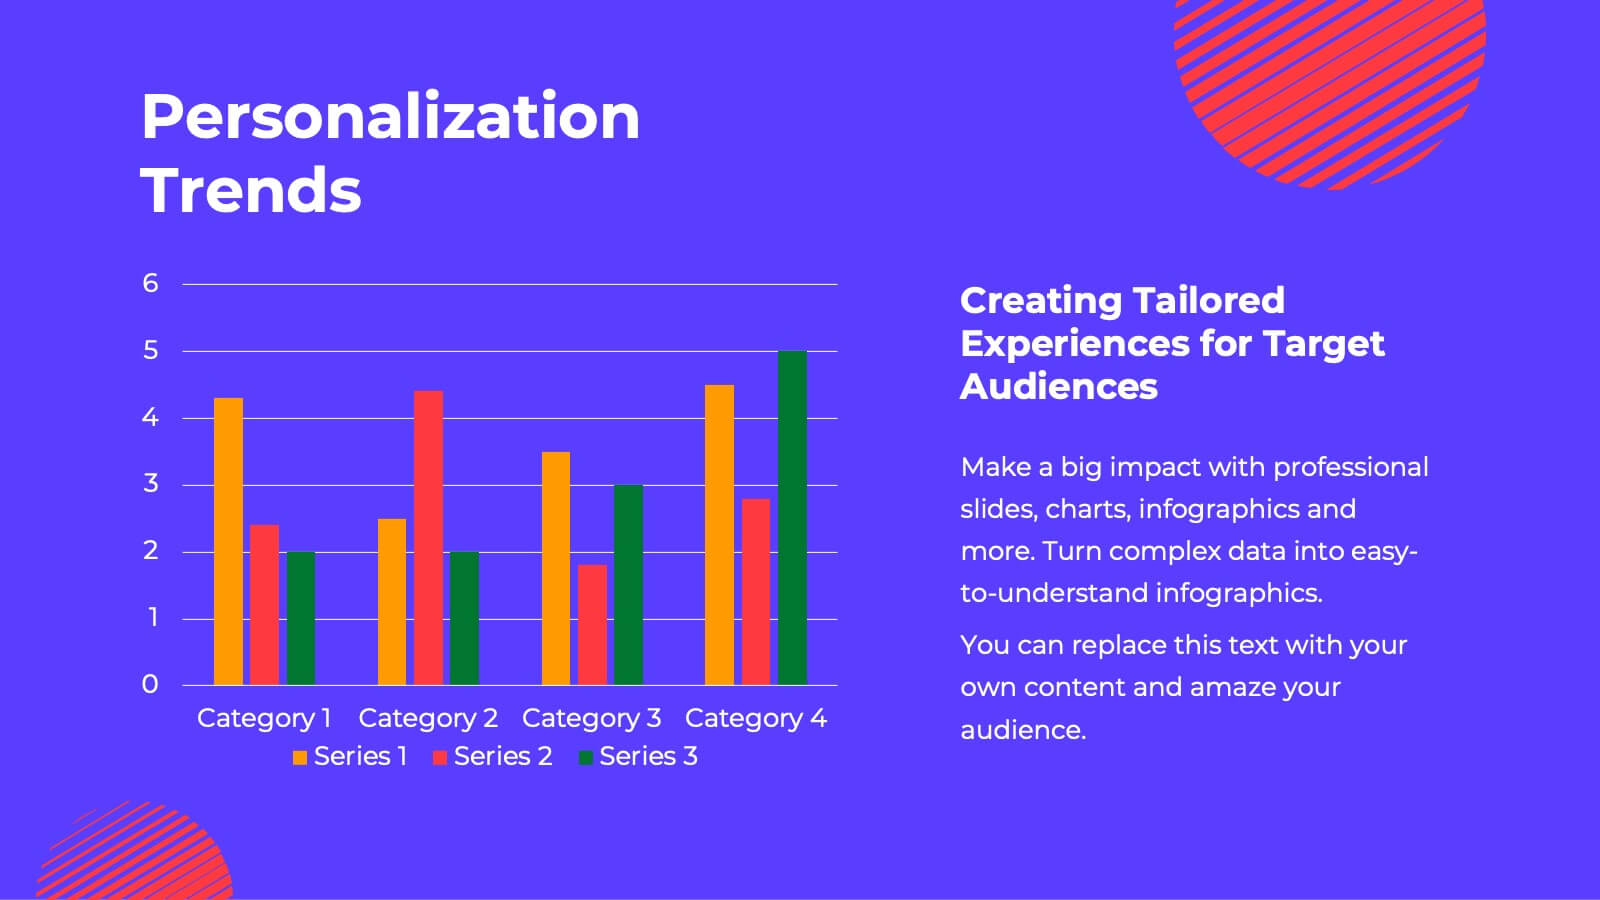
Fusion Marketing Campaign Presentation
Unleash the power of your marketing campaigns with this vibrant marketing campaign template! Dive into social media strategies, influencer marketing, data-driven insights, and more. Perfect for presenting to stakeholders and team members. Fully customizable and compatible with PowerPoint, Keynote, and Google Slides.


7 diapositivas
Project Status Infographic Presentation Template
Project status reports are a great way for project managers to track the progress of their projects and identify risks, challenges and opportunities. They can also help stakeholders better understand what’s going on in the project. They are a critical part of the project documentation system. They allow you to monitor the state of your project’s progress, efficiently share information with upper management and help everyone involved understand where things stand. You can use project status reports to guarantee that you have a constant information flow and higher productivity.


7 diapositivas
Business Pricing Table Slides Infographic
Streamline your product offerings with our Business Pricing Infographic, designed to clearly present pricing tiers and package options. This infographic is essential for sales teams, marketing professionals, and business owners to communicate value propositions to potential customers. Our Business Pricing Infographic allows for a clean, comparative view of different pricing plans, showcasing features, benefits, and cost-effectiveness at a glance. It includes customizable sections for various packages, making it easy to distinguish between basic, standard, and premium options. With this tool, you can highlight key differences and unique selling points of each package, aiding customers in making informed purchasing decisions. This SEO-friendly infographic is crafted to attract and educate potential buyers, providing them with transparent pricing information. Adopt this infographic in your marketing materials to facilitate a straightforward shopping experience, helping customers choose the right product that fits their needs and budget.


7 diapositivas
Technology Innovations Infographic
Technology innovations refer to significant and novel advancements, improvements, or creations in processes, products, services, or systems that introduce new features, functionalities, or approaches. Get ready to ignite the tech world with our technology infographic. This infographic will journey your audience into the cutting-edge world of technology. Prepare your viewers for a mind-blowing showcase of innovation and progress. Compatible with Powerpoint, Keynote, and Google Slides. Inspire action and invite readers to step boldly into a new era of technological innovations.


7 diapositivas
Root Cause Model Infographic
Unlock problem-solving efficiency with our Root Cause Analysis Model Infographic, designed for process engineers, quality assurance teams, and business managers. This infographic is a strategic tool to dissect complex issues and identify underlying causes of operational challenges. Our infographic outlines a step-by-step methodology to trace problems back to their fundamental causes, using visual diagrams to map out cause-and-effect relationships. It's crafted to facilitate a thorough examination of processes, systems, and outcomes, promoting a deep understanding of business issues. Customizable elements allow you to detail specific causes, impacts, and the interplay between different contributing factors. This SEO-optimized infographic is designed to be an accessible resource for professionals dedicated to continuous improvement and corrective action planning. Employ this infographic to guide your team through root cause analysis, fostering a culture of proactive problem-solving and sustainable solutions within your organization.


5 diapositivas
History of Vaccine Infographics
The History of Vaccines is a fascinating journey that spans centuries and has significantly impacted human health and disease prevention. With these infographic templates, you can effectively communicate the importance of vaccines, highlight their role in disease prevention, and debunk common misconceptions. It serves as an educational tool to promote understanding and appreciation for the significant advancements in vaccine development that have saved countless lives throughout history. Use these to provide a comprehensive overview of the history of vaccine and help individuals understand the importance and impact of vaccines.


6 diapositivas
2-Option Comparison Chart Presentation
Make your decision-making story pop with a clean, energetic layout that clearly contrasts two paths side by side. This presentation helps you compare options, outline pros and cons, and guide audiences toward confident choices with sharp visual structure. Fully compatible with PowerPoint, Keynote, and Google Slides.
7 diapositivas
Six Arrow Infographic Presentation
A Arrow infographic is an effective visual tool that can help communicate a process or a series of steps in a clear and engaging way. The arrows represent the sequential flow of steps or actions and text boxes are included to further explain each step. This template includes pre-made layouts so all that is left to do is add your own text, images, and colors. This is a perfect way to communicate your message. With a clean, contemporary look, this template will help you raise awareness about your cause and spread your ideas. This is perfect for any of your business or academic projects!


7 diapositivas
Six Sigma Training Infographic
Six Sigma is a data-driven methodology and approach for eliminating defects and improving processes in any business. This is a bold, transformative tool designed to equip individuals and organizations with the prowess of Six Sigma methodology. This template is the roadmap to excellence, paving the way for achieving remarkable improvements and efficiency. Fully customizable and compatible with Powerpoint, Keynote, and Google Slides. Unleash the power of Six Sigma through our Six Sigma Training Infographic. Let this be your guide to mastering the art of perfection, driving transformative change, and marching boldly towards operational excellence.


7 diapositivas
Simple Schedule Infographic
Effortlessly structure your time with our simple schedule infographic. Rendered in a clean white canvas, enhanced with dependable blue tones and anchored with timeless black, our template is the epitome of clarity and organization. Equipped with streamlined infographics, universal icons, and adaptable image placeholders, it facilitates easy time management and daily planning. Seamlessly tailored for Powerpoint, Keynote, or Google Slides. A fundamental tool for project managers, event planners, educators, or any professional aiming to efficiently allocate their time. Plan with ease; let every slide bring order to your daily chaos.