


Características


¿Tienes alguna pregunta?
Recomendar
20 diapositivas
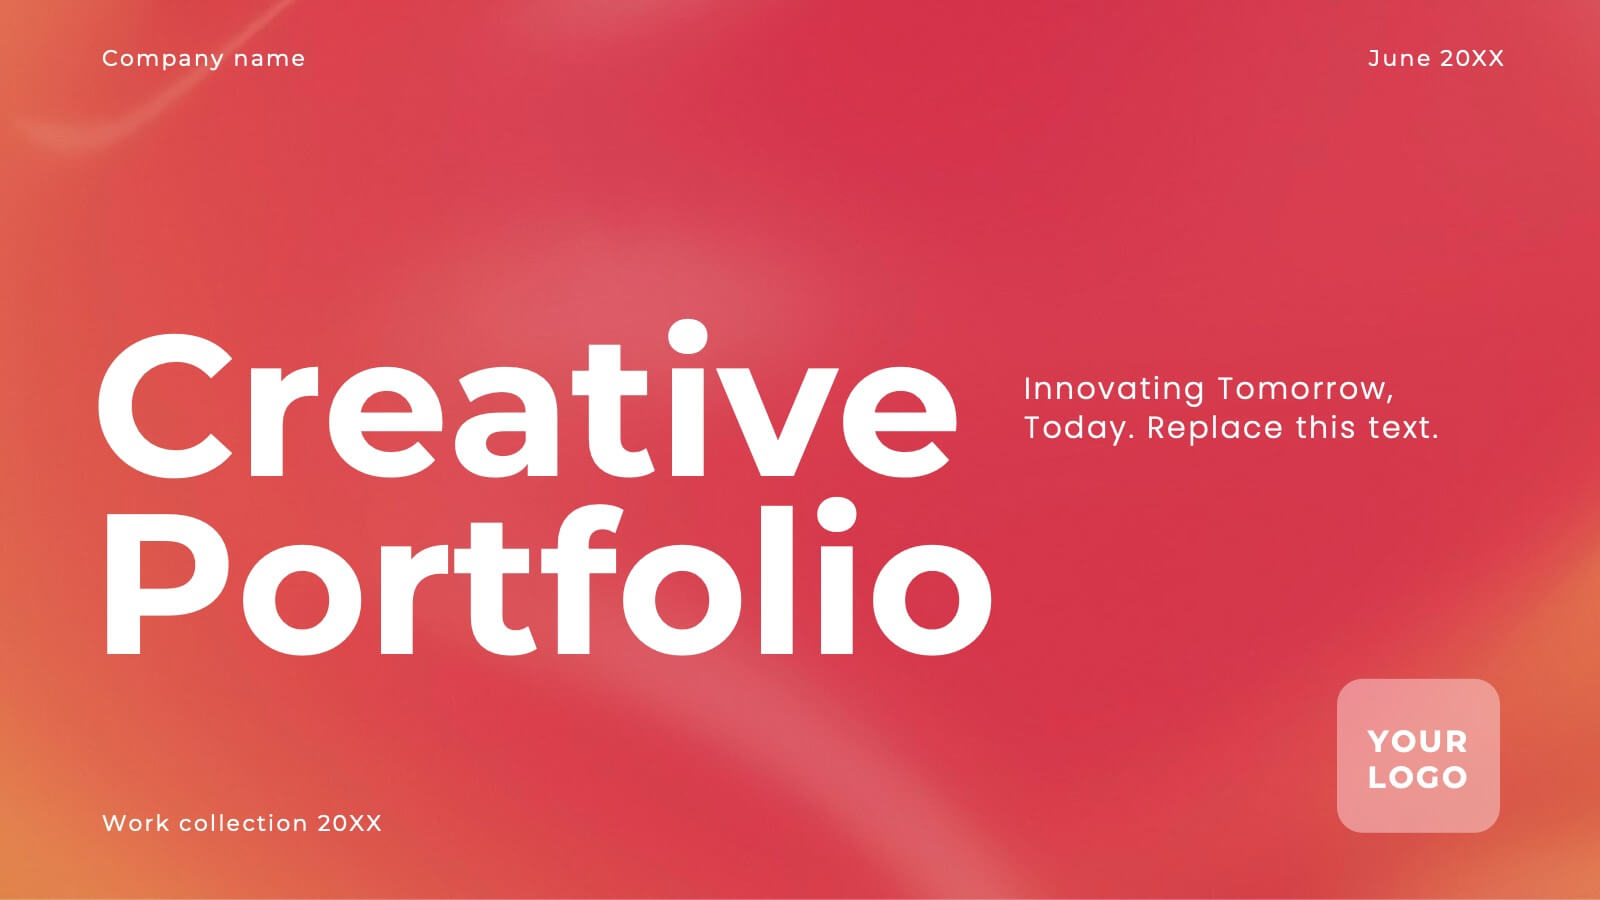
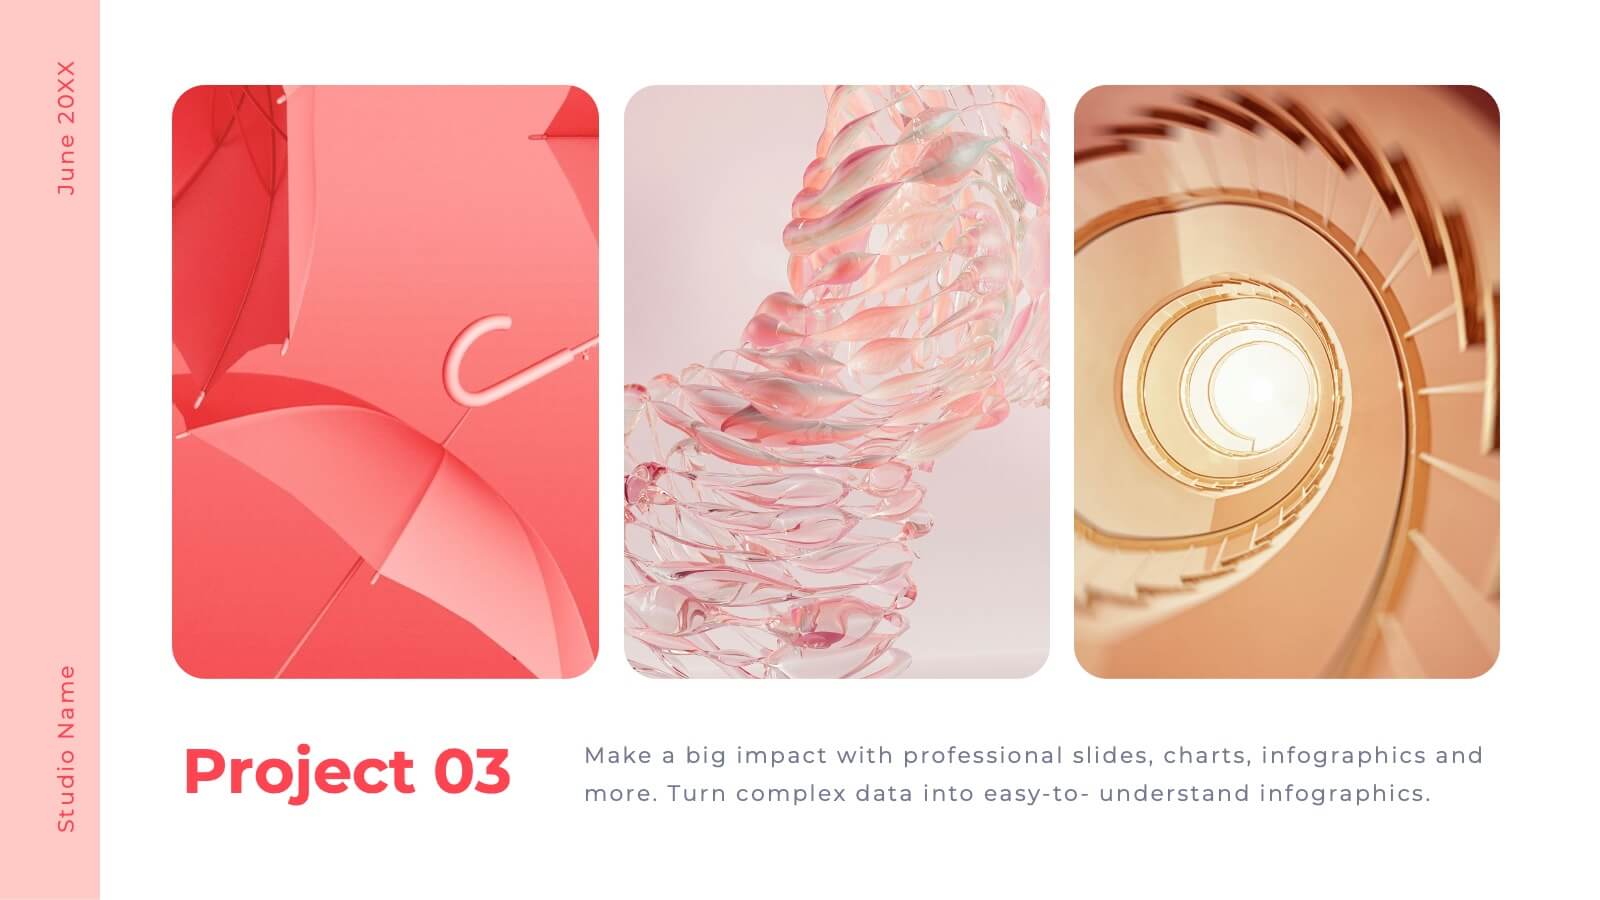
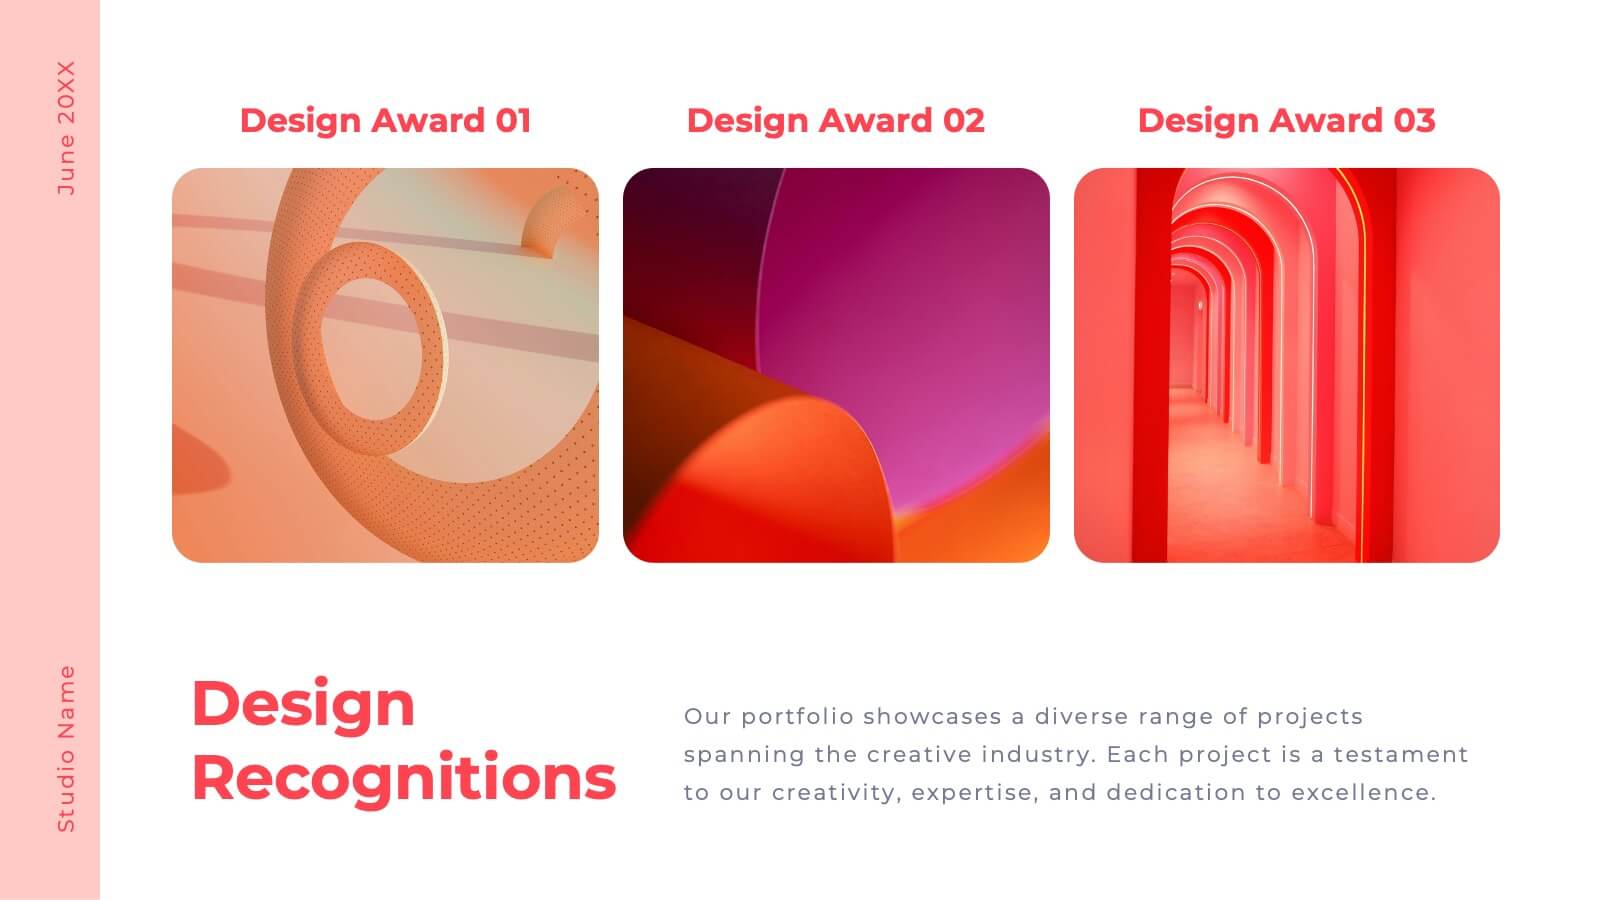
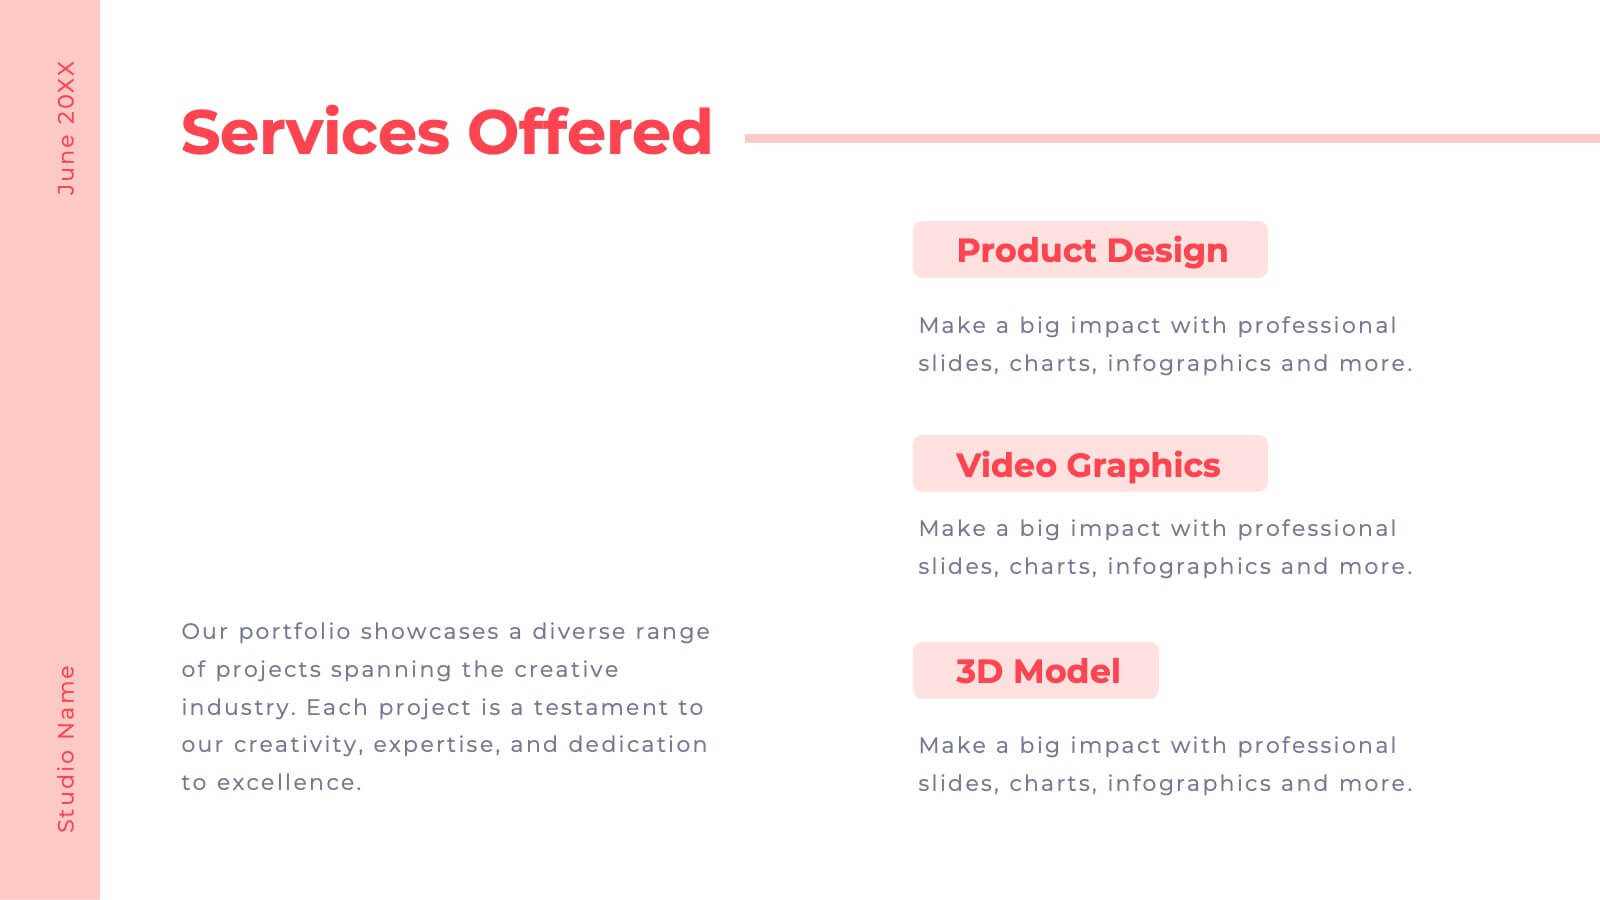
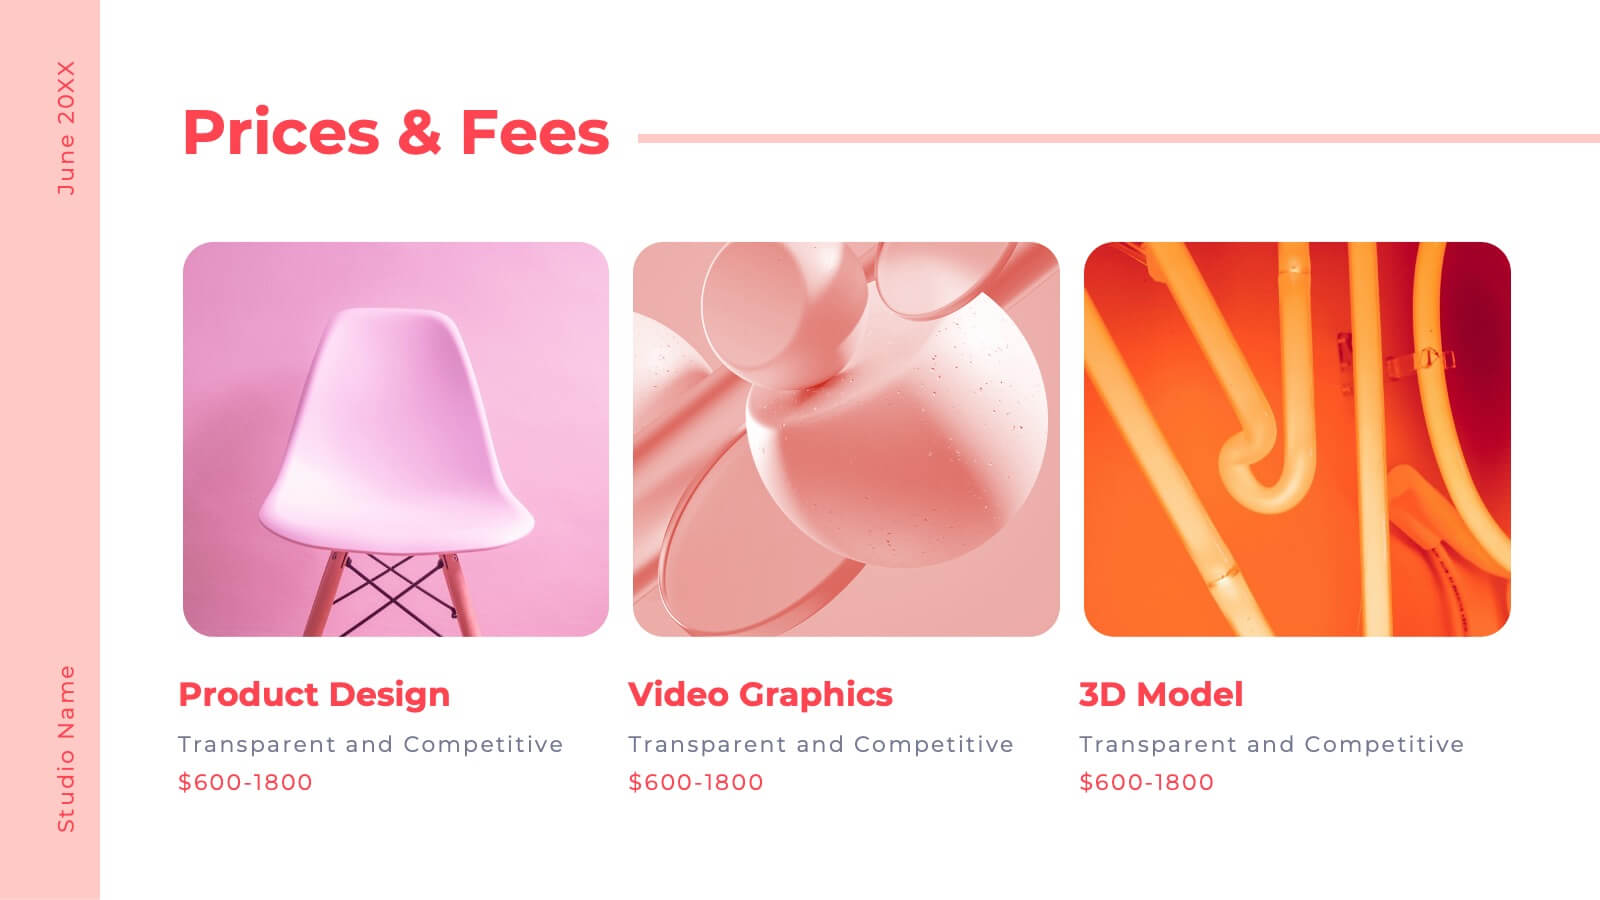
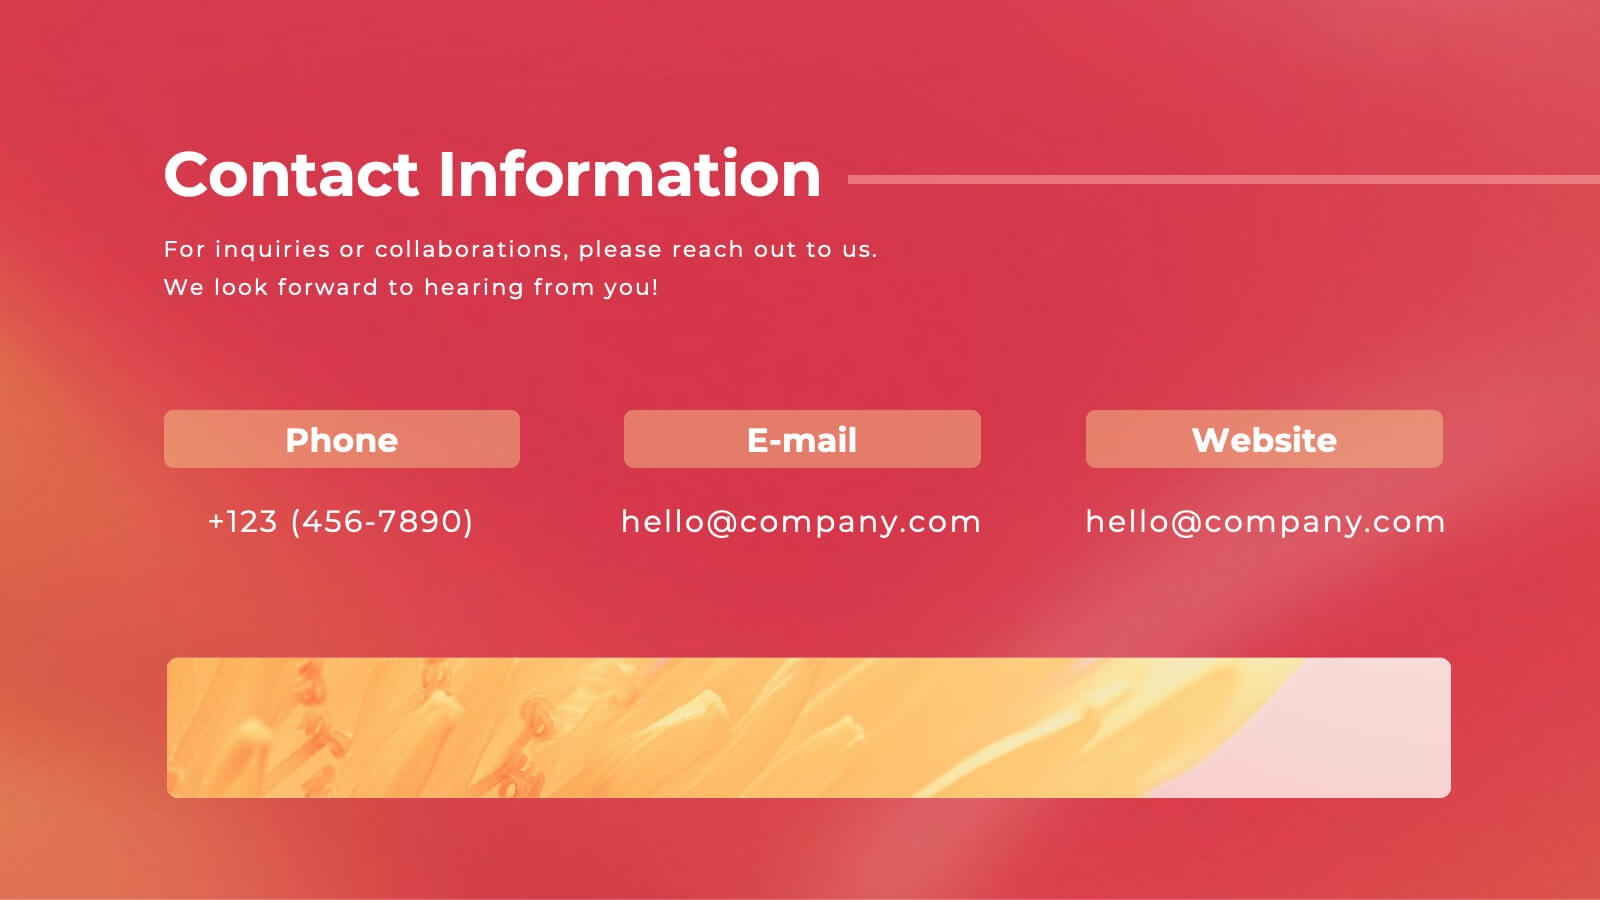
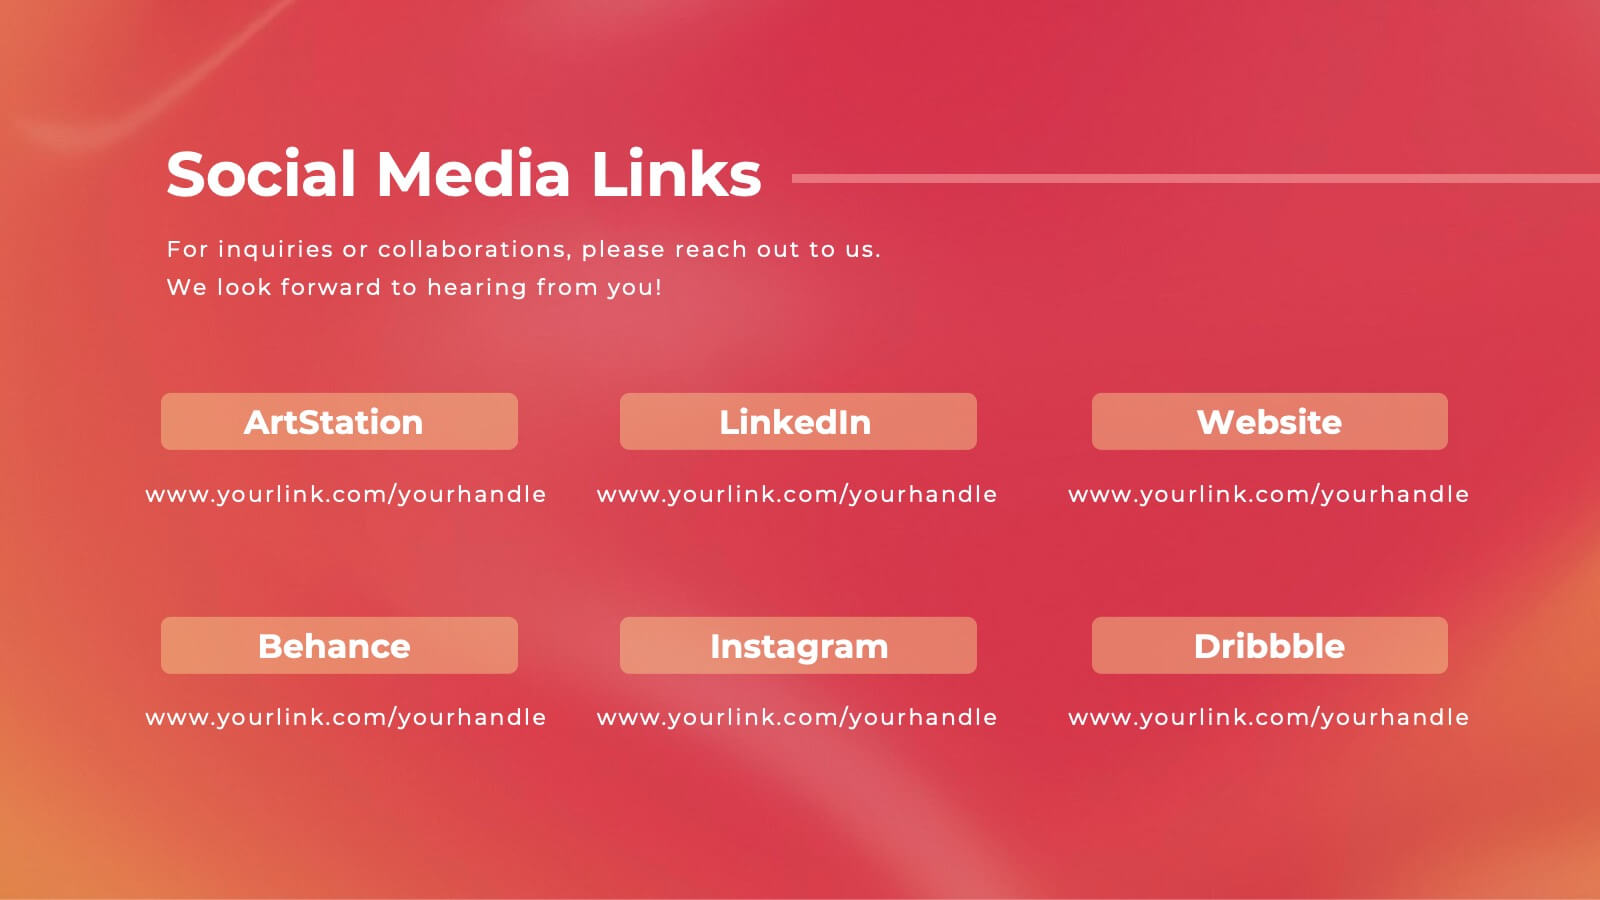
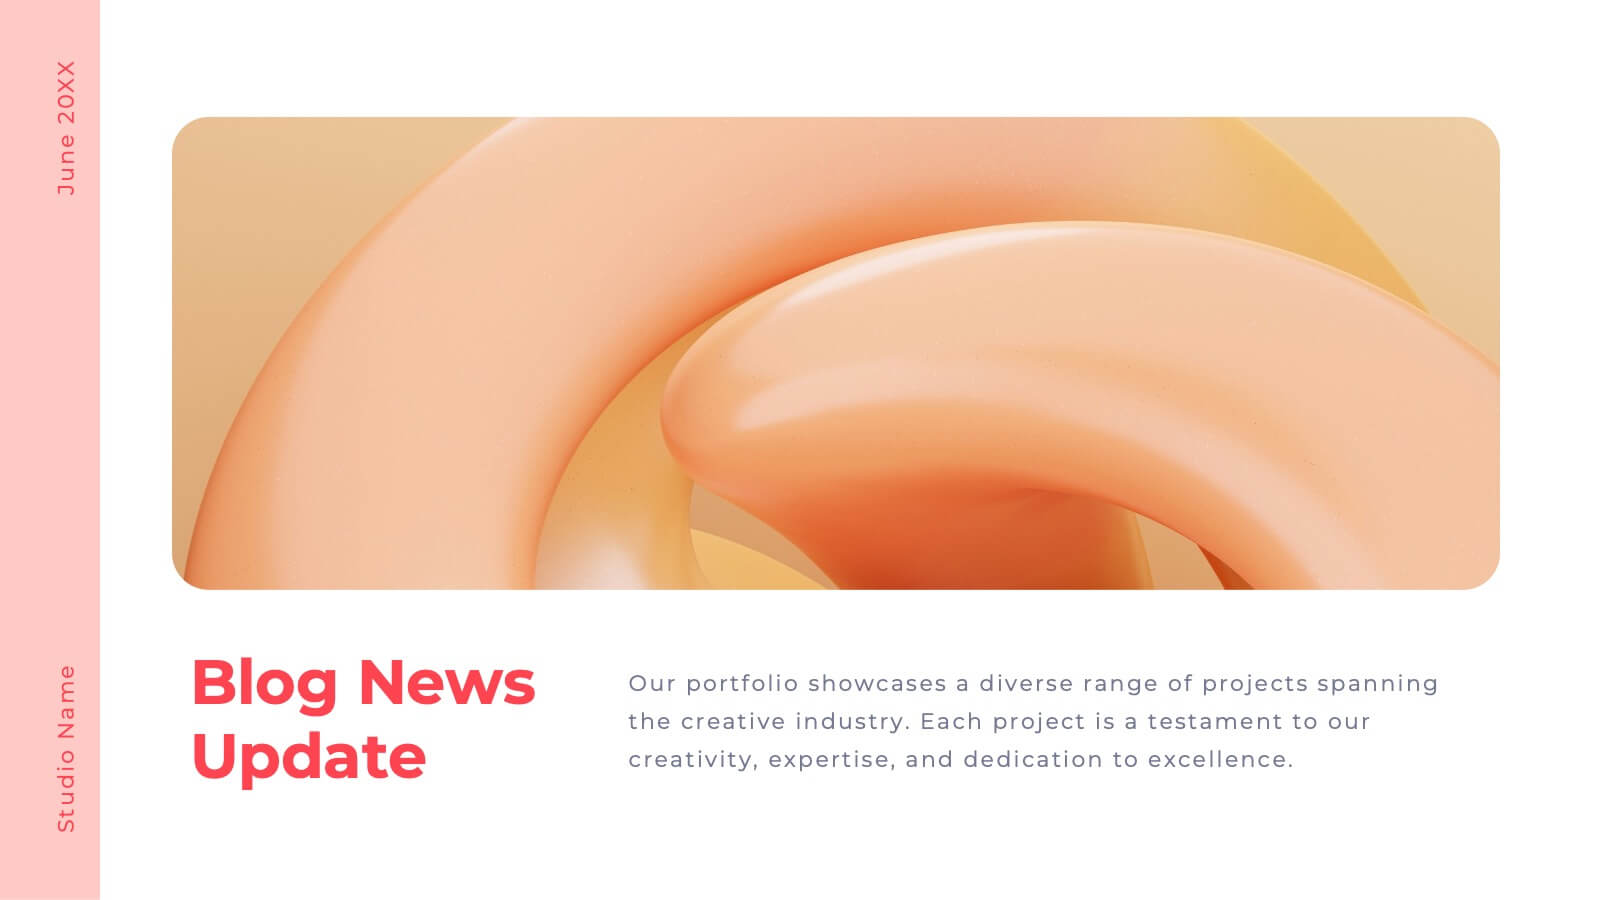
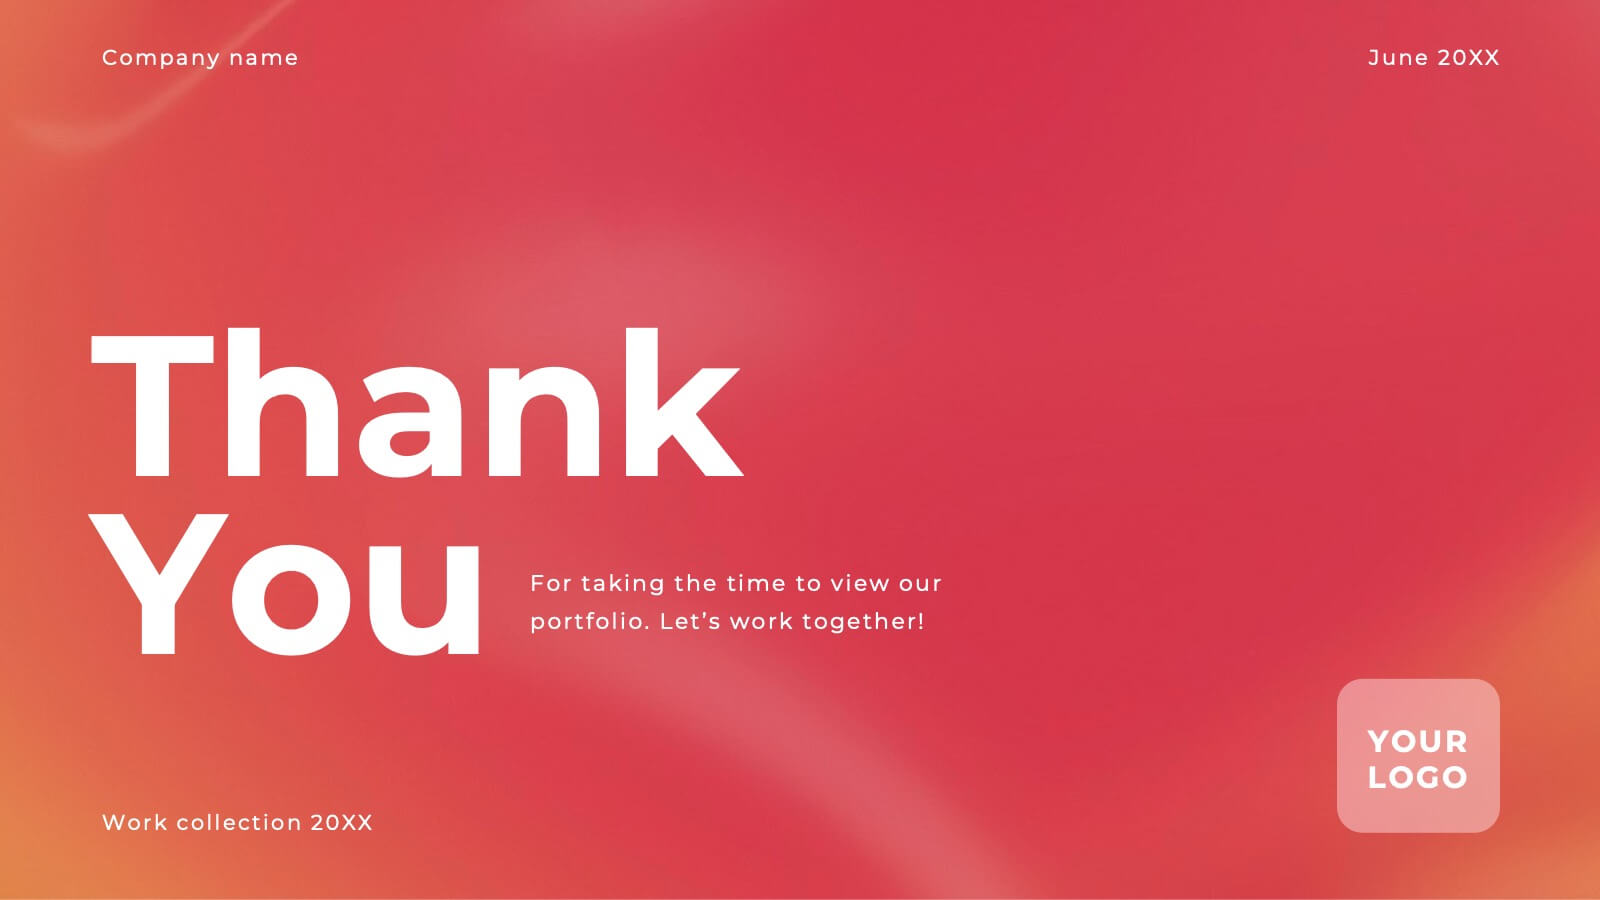
Valor Creative Portfolio Presentation
Step into creativity with this stunning portfolio template! Showcase your projects, design philosophy, and client testimonials with style and flair. Ideal for designers, artists, and creatives wanting to impress. Compatible with PowerPoint, Keynote, and Google Slides, this template elevates every portfolio to new heights. Perfect for making a lasting impact.


5 diapositivas
Strategic Blue Ocean Shift Presentation
Dive into bold new thinking with a slide that makes strategic transformation feel clear, focused, and actionable. This presentation breaks down key decisions that help teams shift from competitive pressure to value innovation, making complex choices easy to visualize and present. Fully compatible with PowerPoint, Keynote, and Google Slides.


7 diapositivas
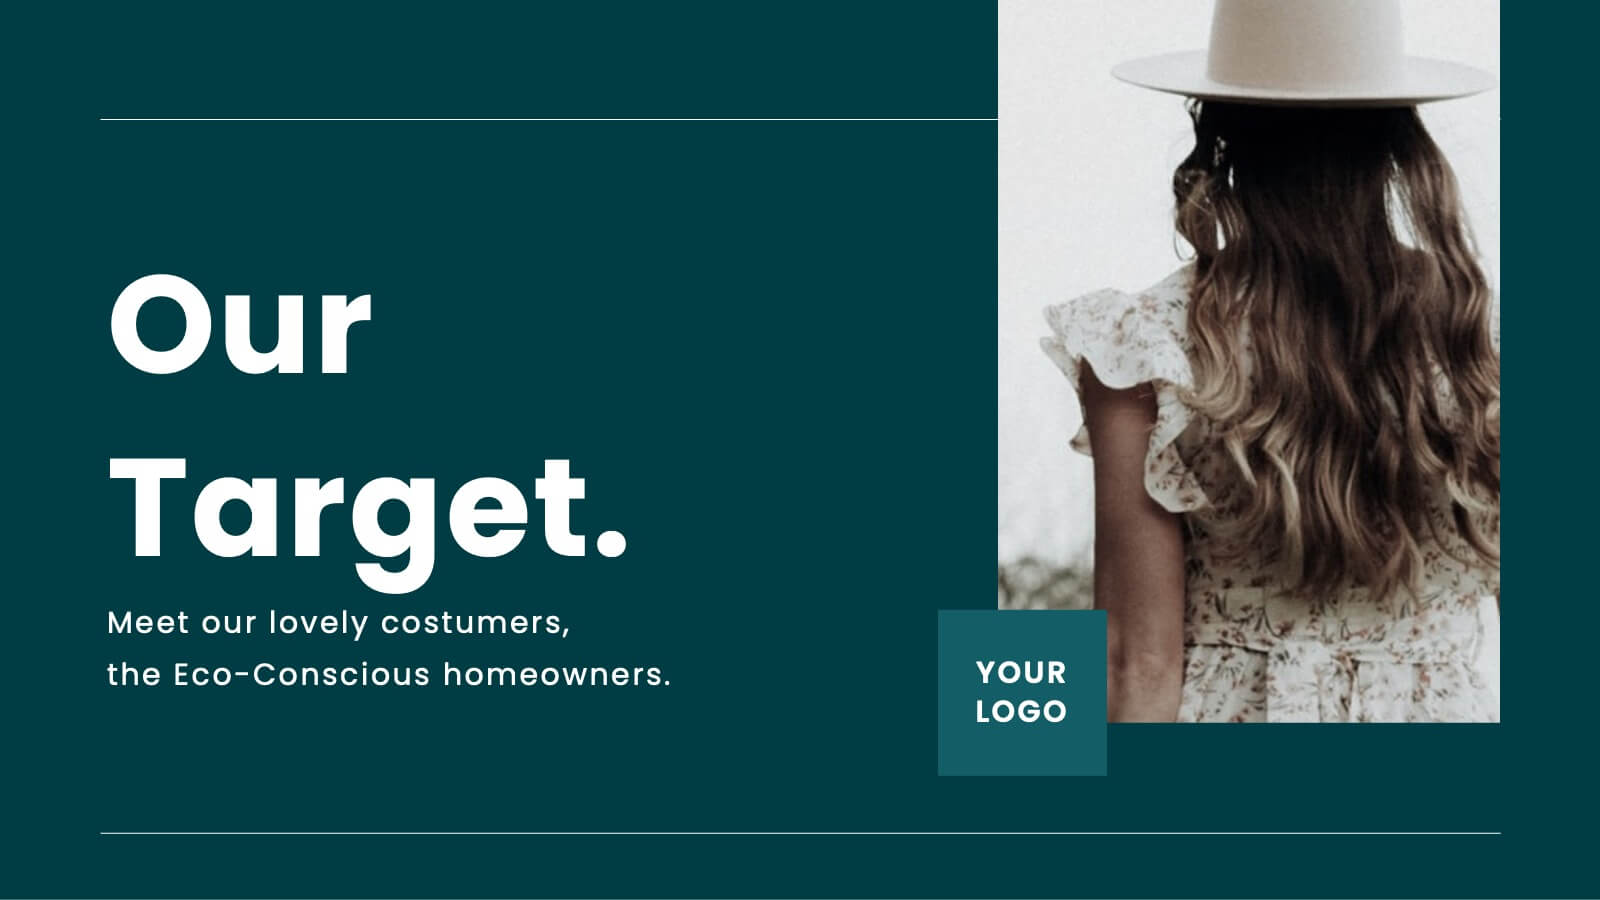
Market Focus and Demographic Insights Presentation
Present your audience data with clarity using this Market Focus and Demographic Insights presentation. Designed with a central persona and six key data points, this slide helps visualize customer characteristics, behavioral trends, and strategic targets. Great for marketing, branding, or investor decks. Fully editable in Canva, PowerPoint, and Google Slides.


5 diapositivas
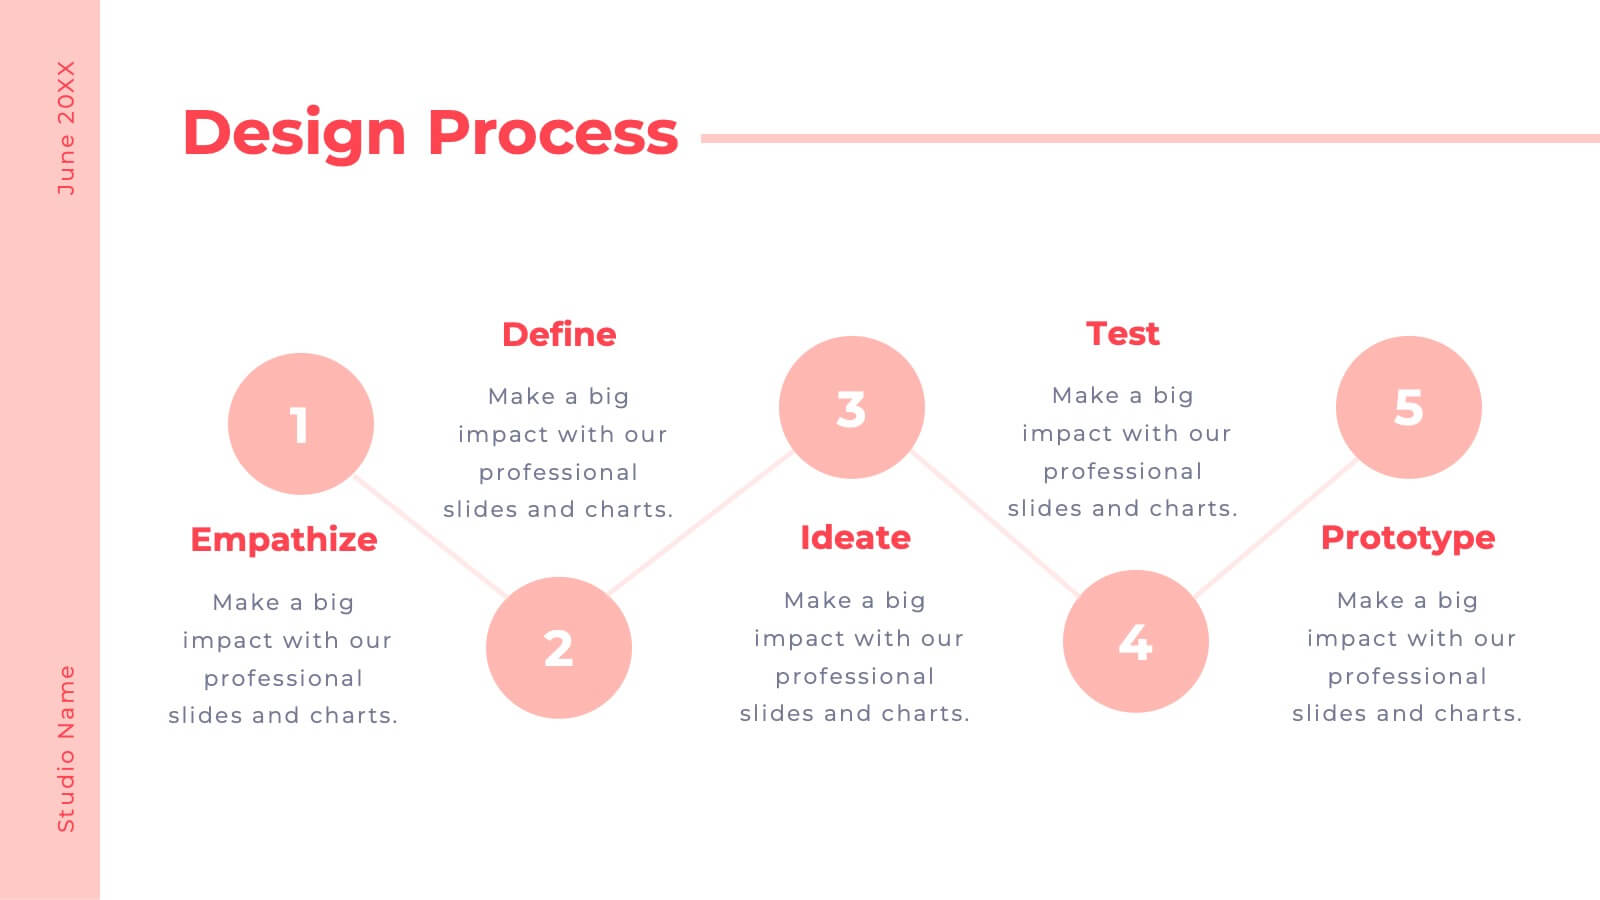
End-to-End Process Flow Framework Presentation
Visualize your operations from start to finish with the End-to-End Process Flow Framework Presentation. This clean, arrow-based layout is perfect for outlining workflows, project stages, or business processes step by step. Fully customizable in Canva, PowerPoint, and Google Slides to suit any team or strategic need.


5 diapositivas
Strategic Decision-Making Techniques Presentation
Communicate key business insights with clarity using this structured four-step layout. Each segment is aligned with an icon and space for concise text, making it ideal for presenting executive strategies, project evaluations, or decision pathways. The centered character adds a professional and engaging touch. Fully customizable in PowerPoint, Keynote, and Google Slides.


6 diapositivas
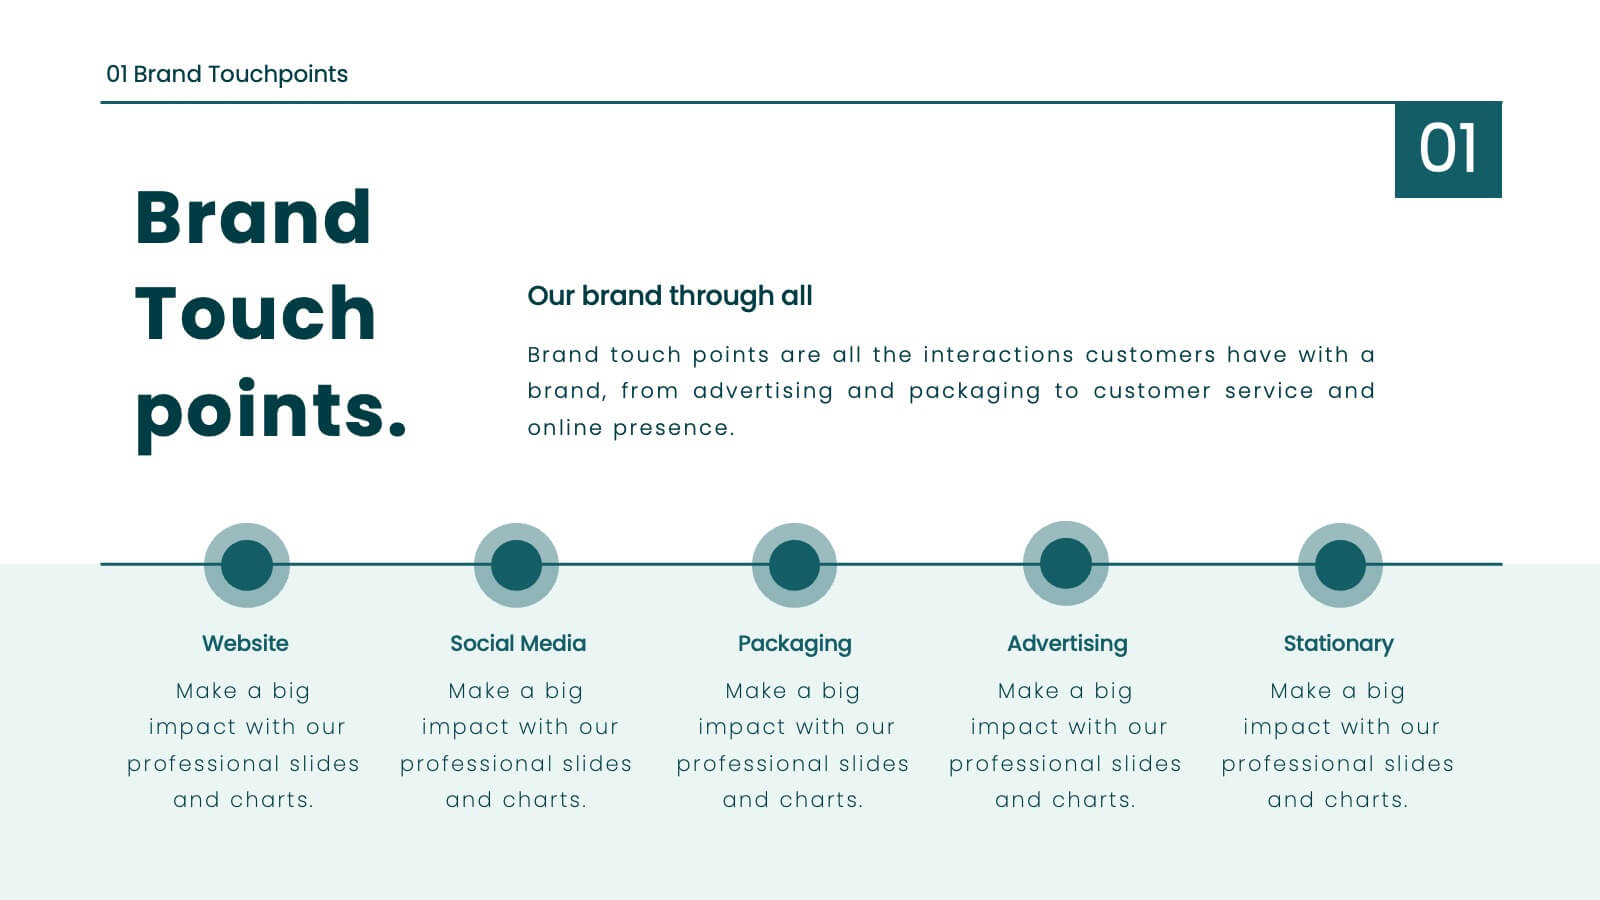
Efficient Workflow Management
Highlight process optimization, task delegation, or team productivity strategies using this linear gear-style workflow design. Perfect for operations leaders, project managers, or consultants presenting step-by-step plans. Fully customizable in PowerPoint, Keynote, and Google Slides—edit icons, text, and colors to fit your message.


5 diapositivas
Demographic Segmentation Analysis Presentation
Bring your insights to life with a clean, engaging layout that simplifies complex audience data into clear, visual segments. This presentation helps you explain key patterns, compare group behaviors, and communicate strategic decisions with confidence. Fully editable and compatible with PowerPoint, Keynote, and Google Slides.


4 diapositivas
Income and Expense Highlights Presentation
Enhance learning with the Interactive Digital Learning Experience Presentation. This template mimics a multiple-choice format, making it perfect for quizzes, training modules, or eLearning content. Each slide includes labeled options (A–D) alongside a modern vertical interface, ideal for engaging assessments or lesson recaps. Fully editable in Canva, PowerPoint, Keynote, and Google Slides.


6 diapositivas
Bubble Chart Data Visualization Presentation
Make your data pop with visuals that tell a story at a glance. This modern presentation transforms raw numbers into clear, engaging bubble charts that simplify complex insights and comparisons. Fully editable and compatible with PowerPoint, Keynote, and Google Slides for effortless customization and professional results.
28 diapositivas
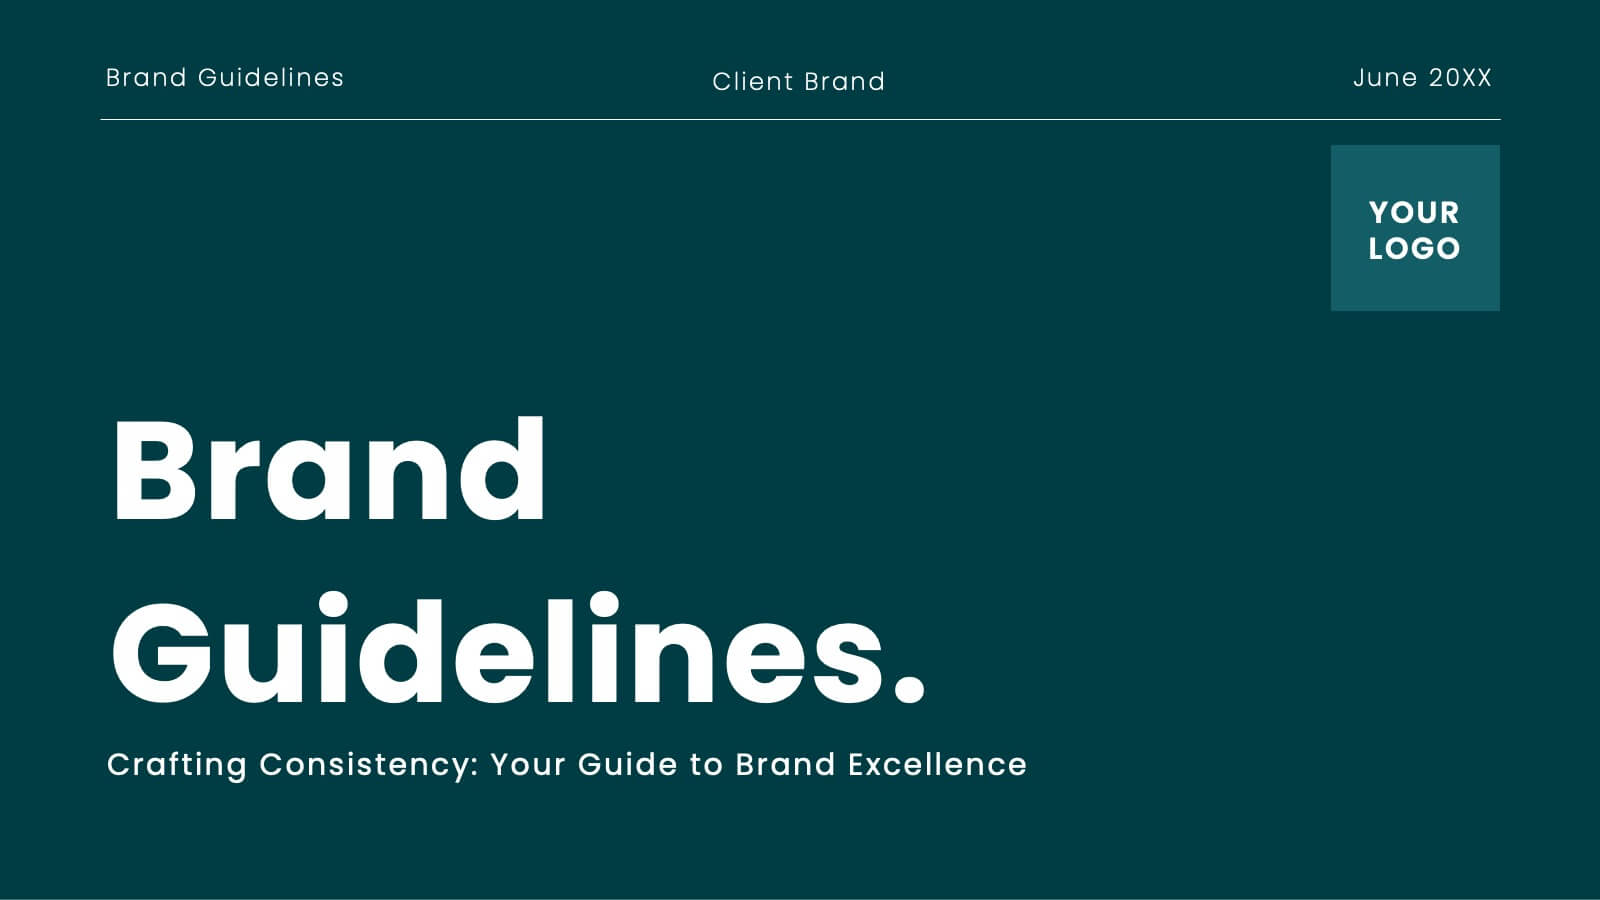
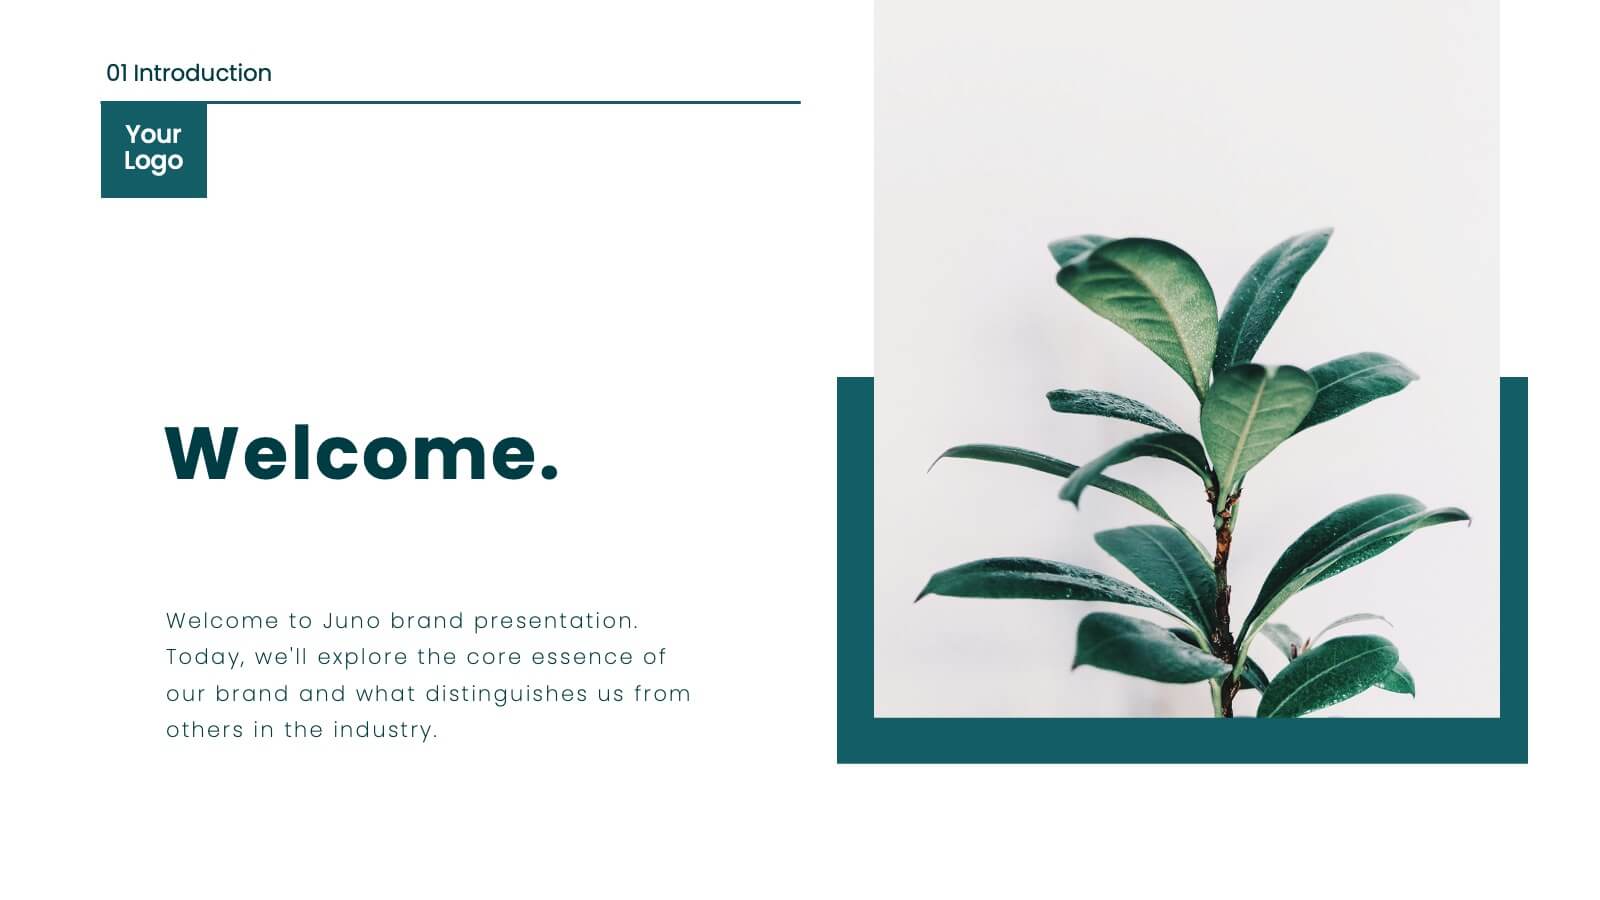
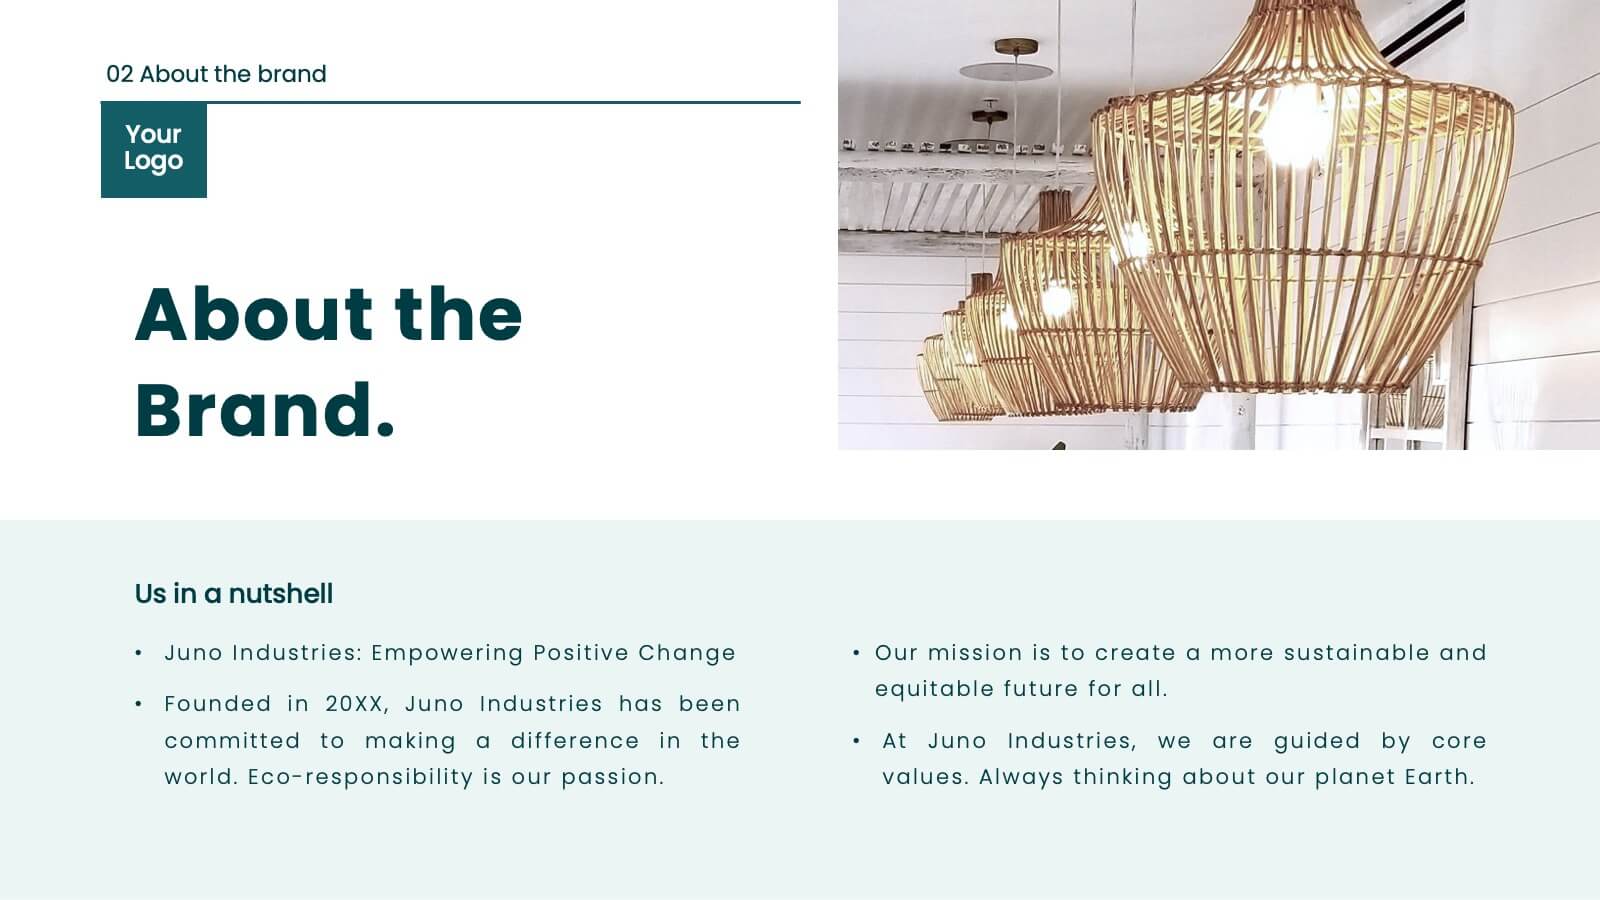
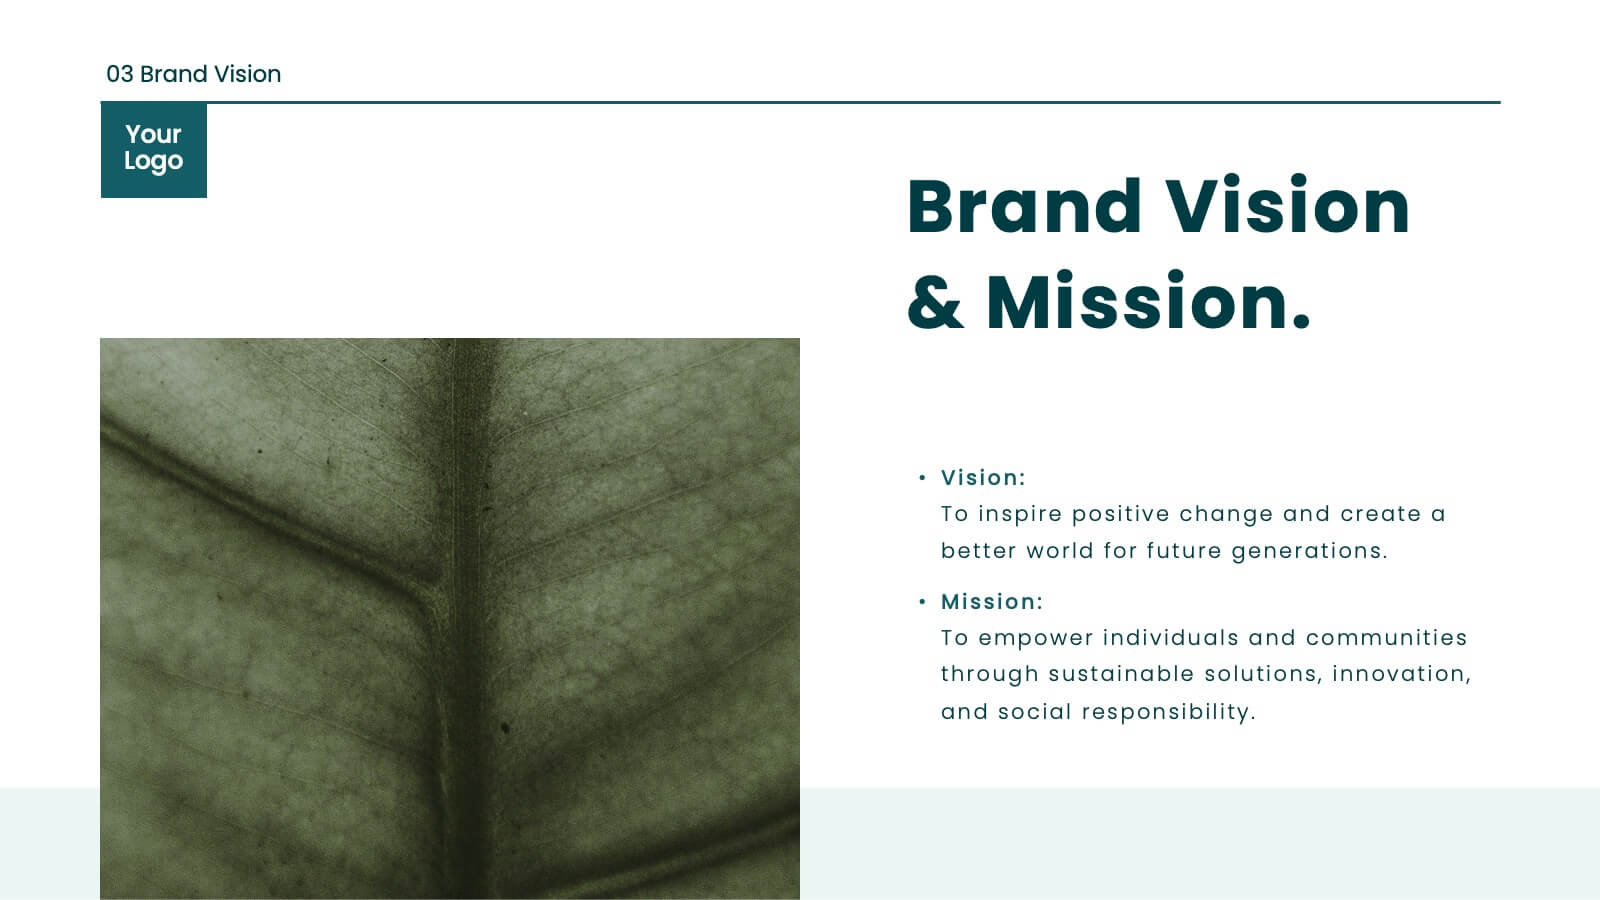
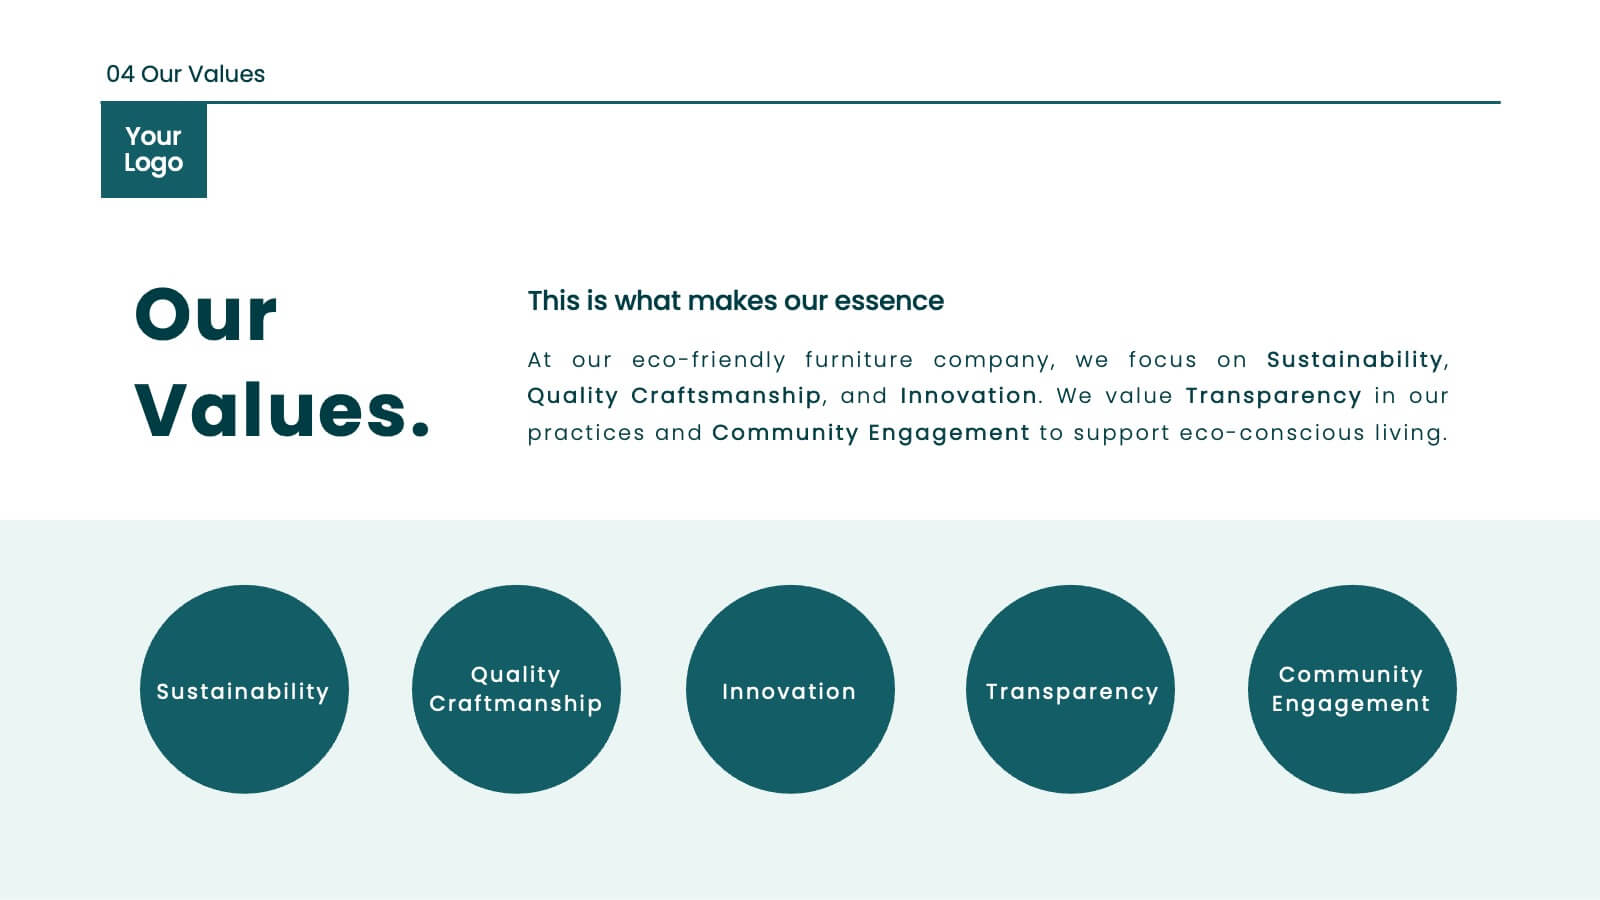
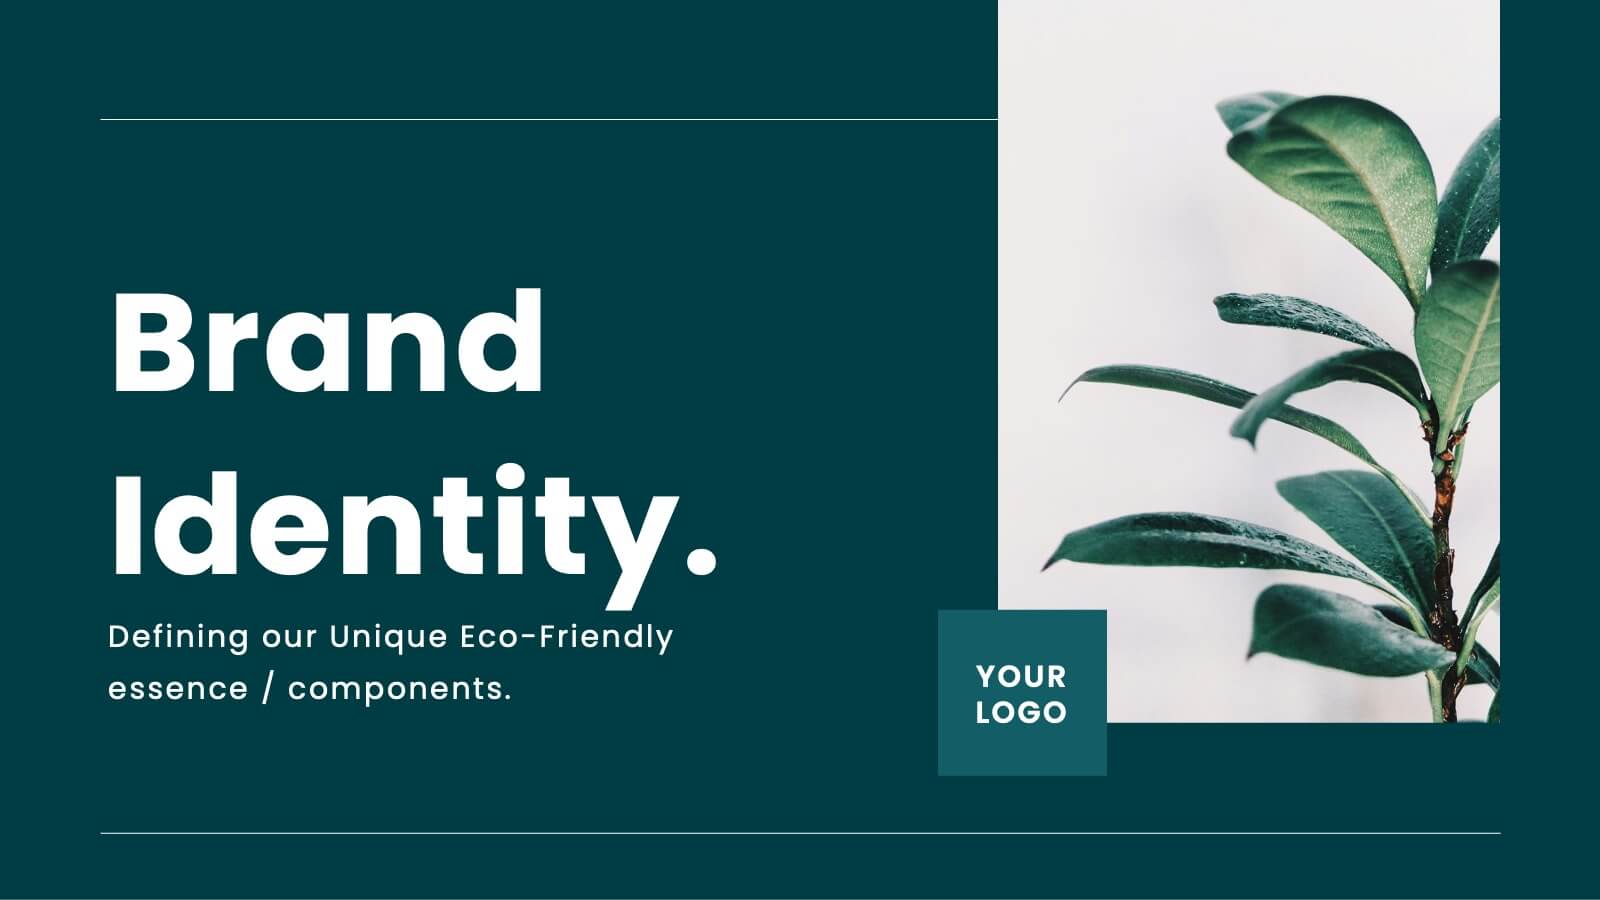
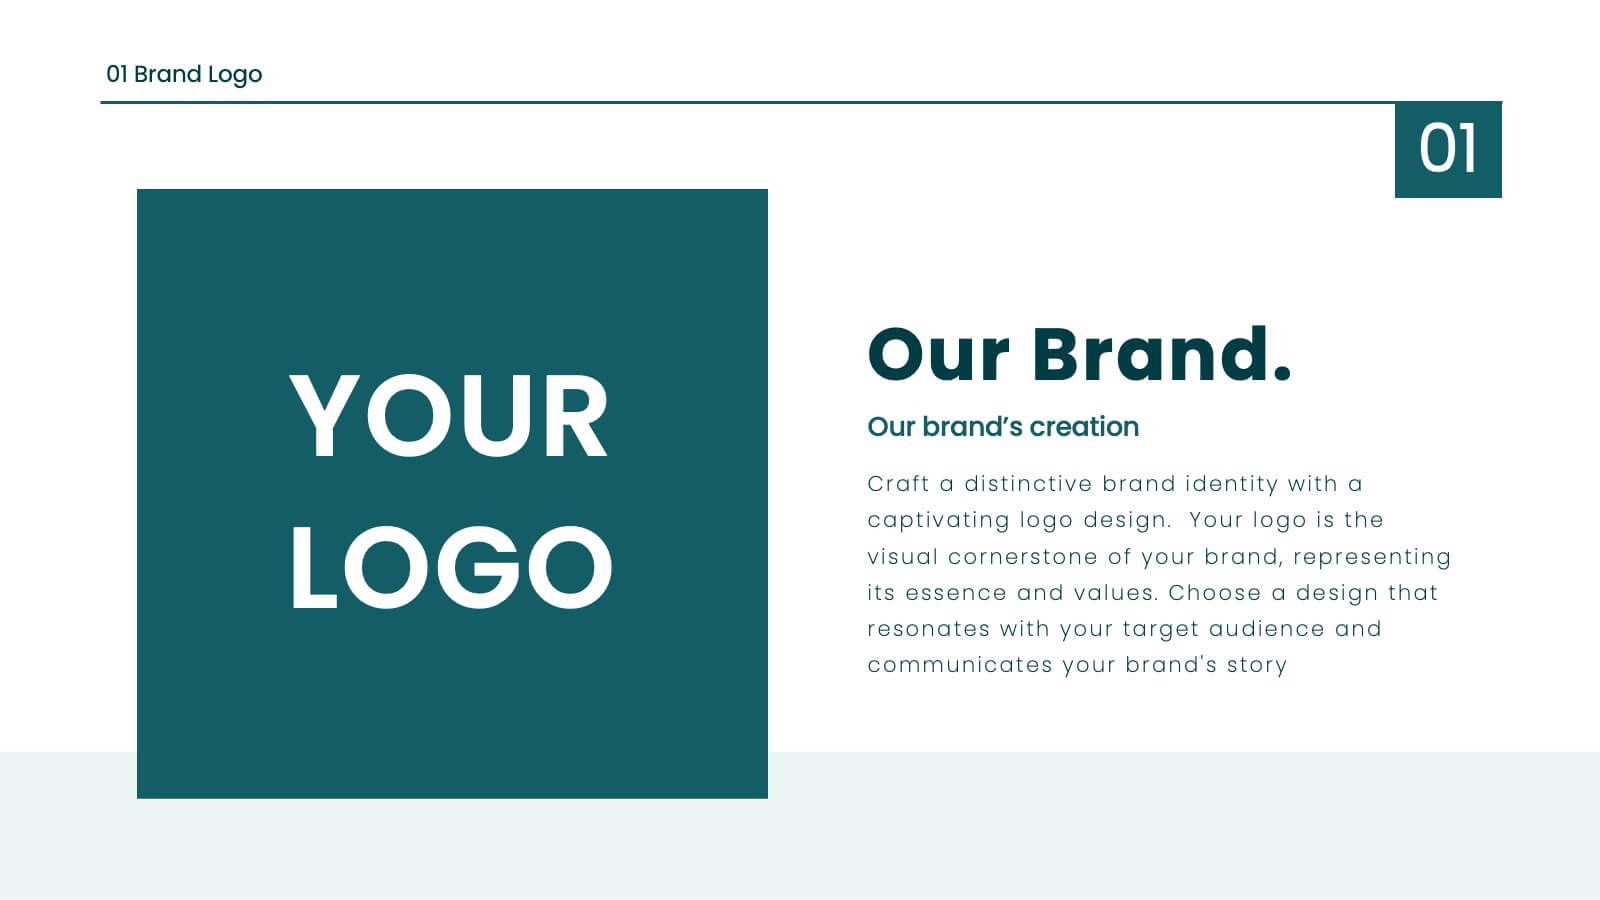
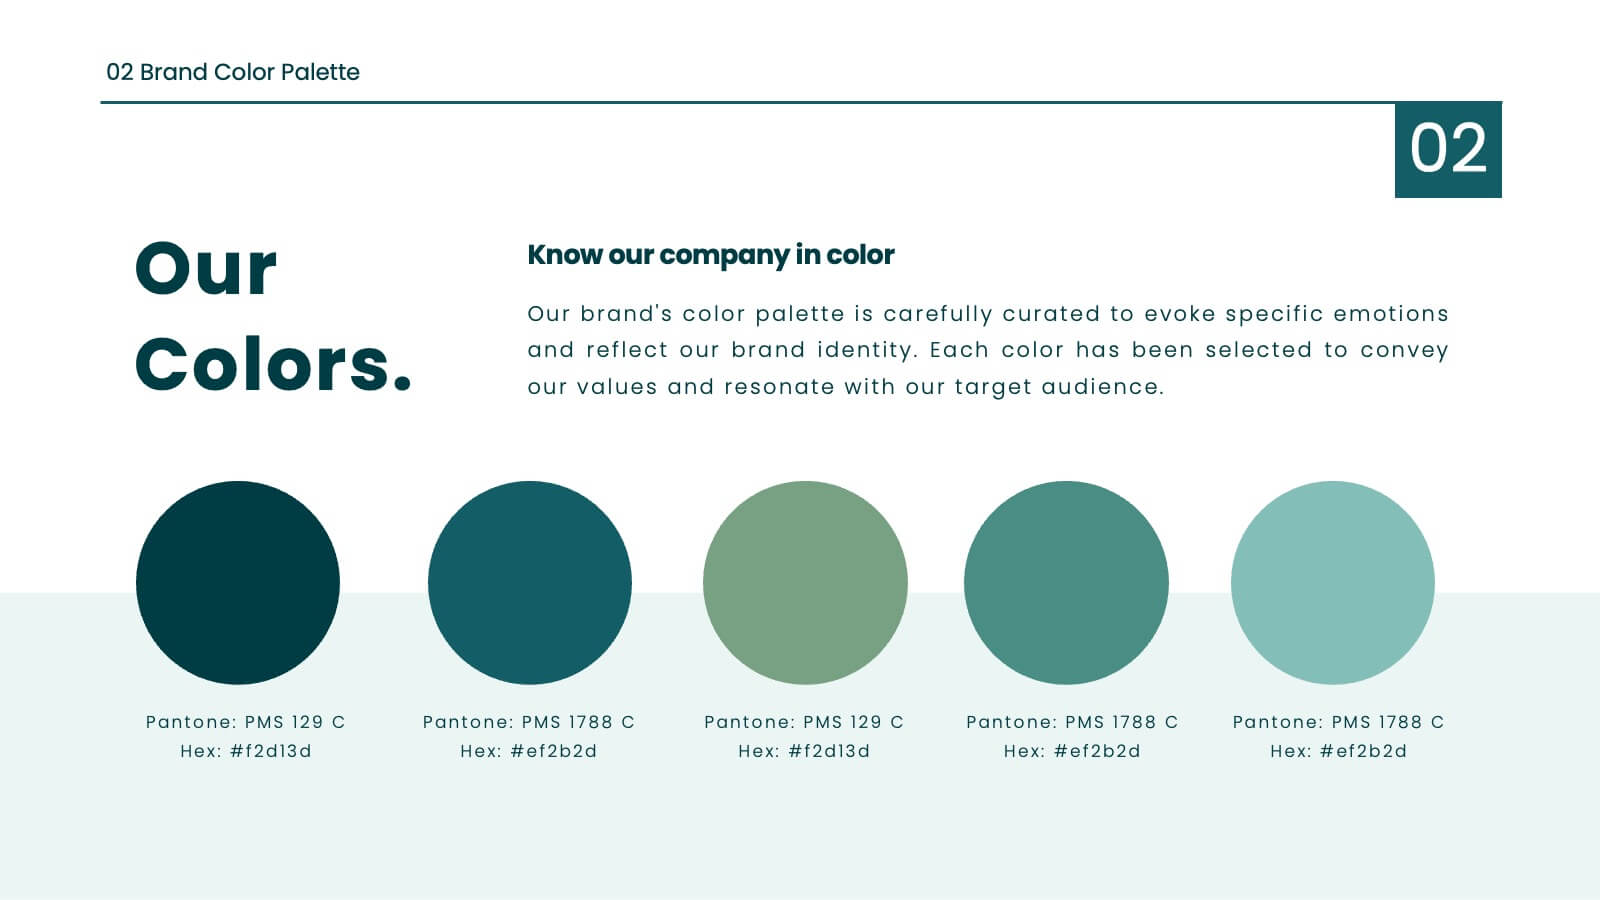
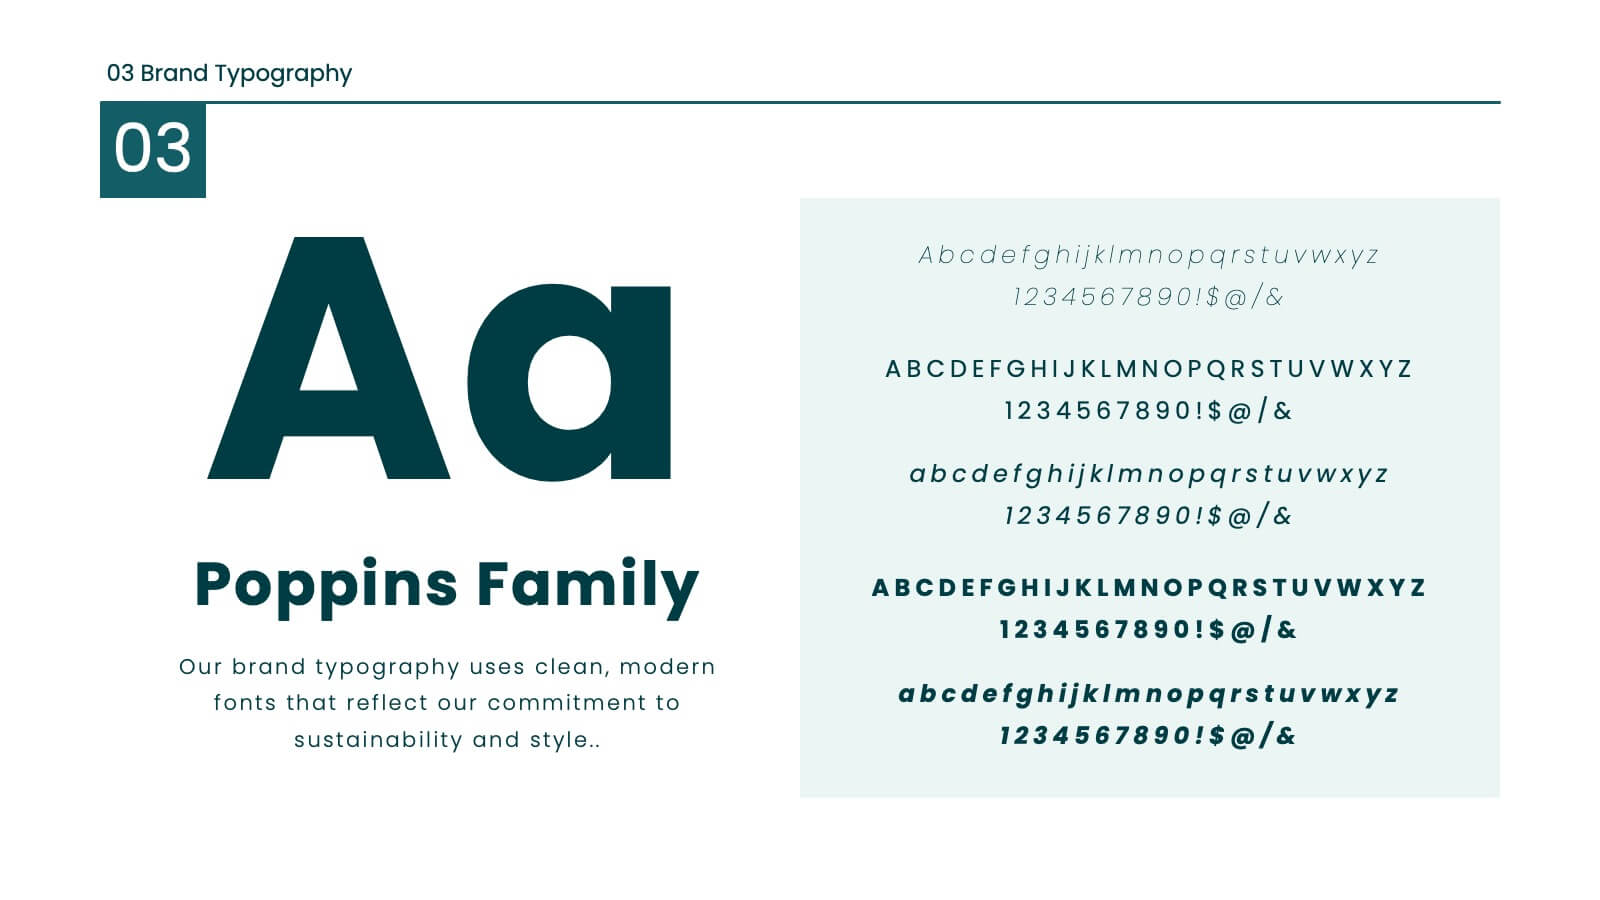
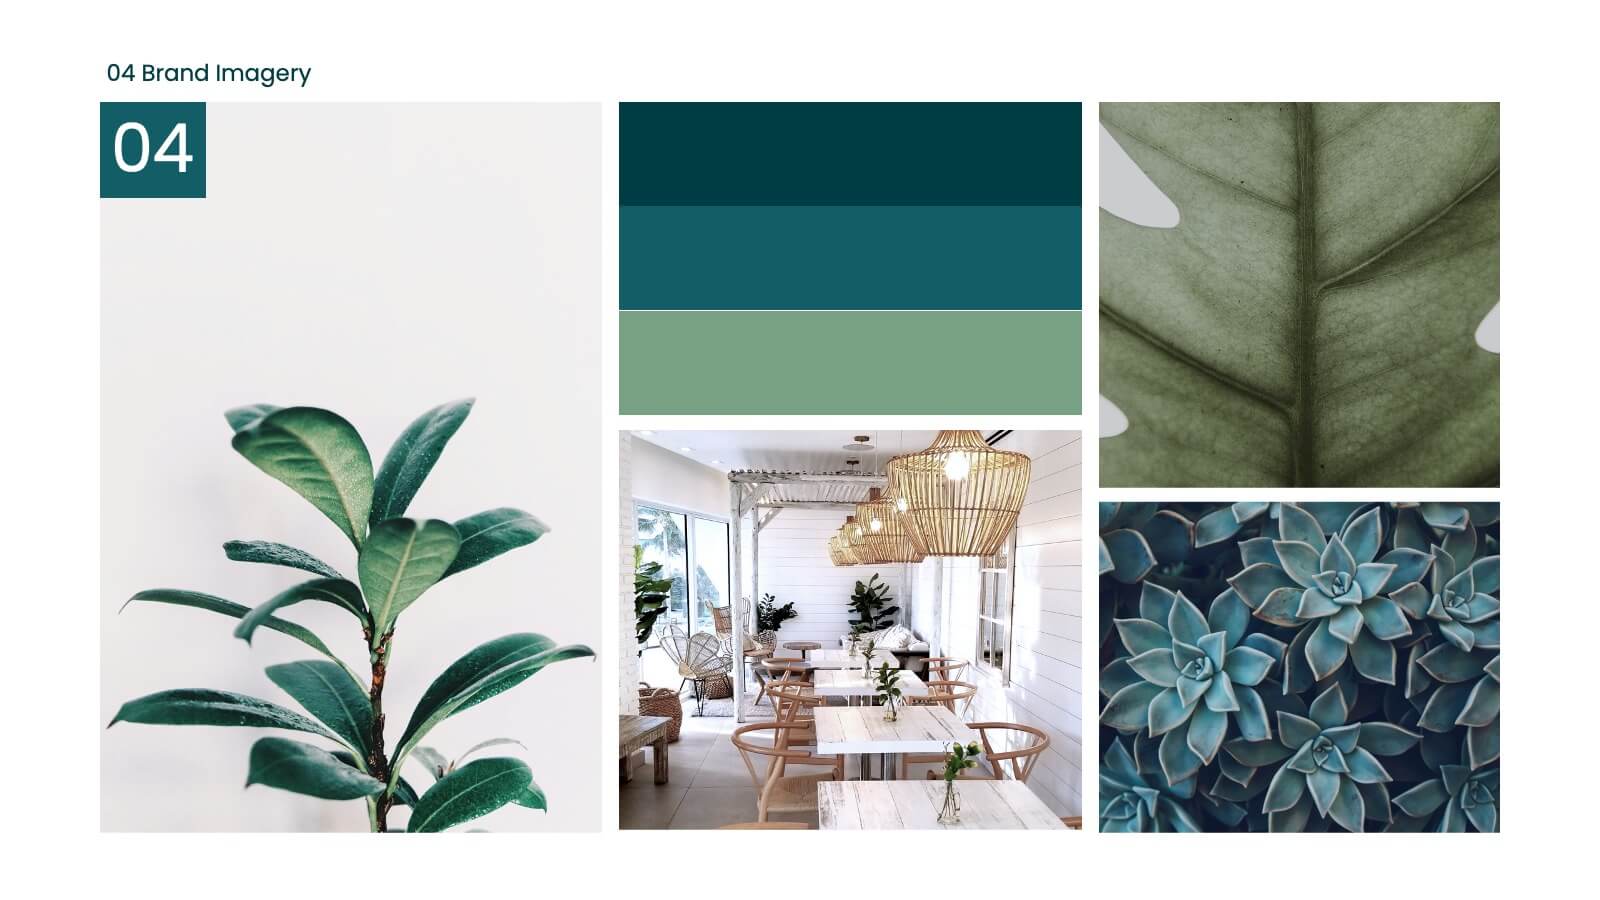
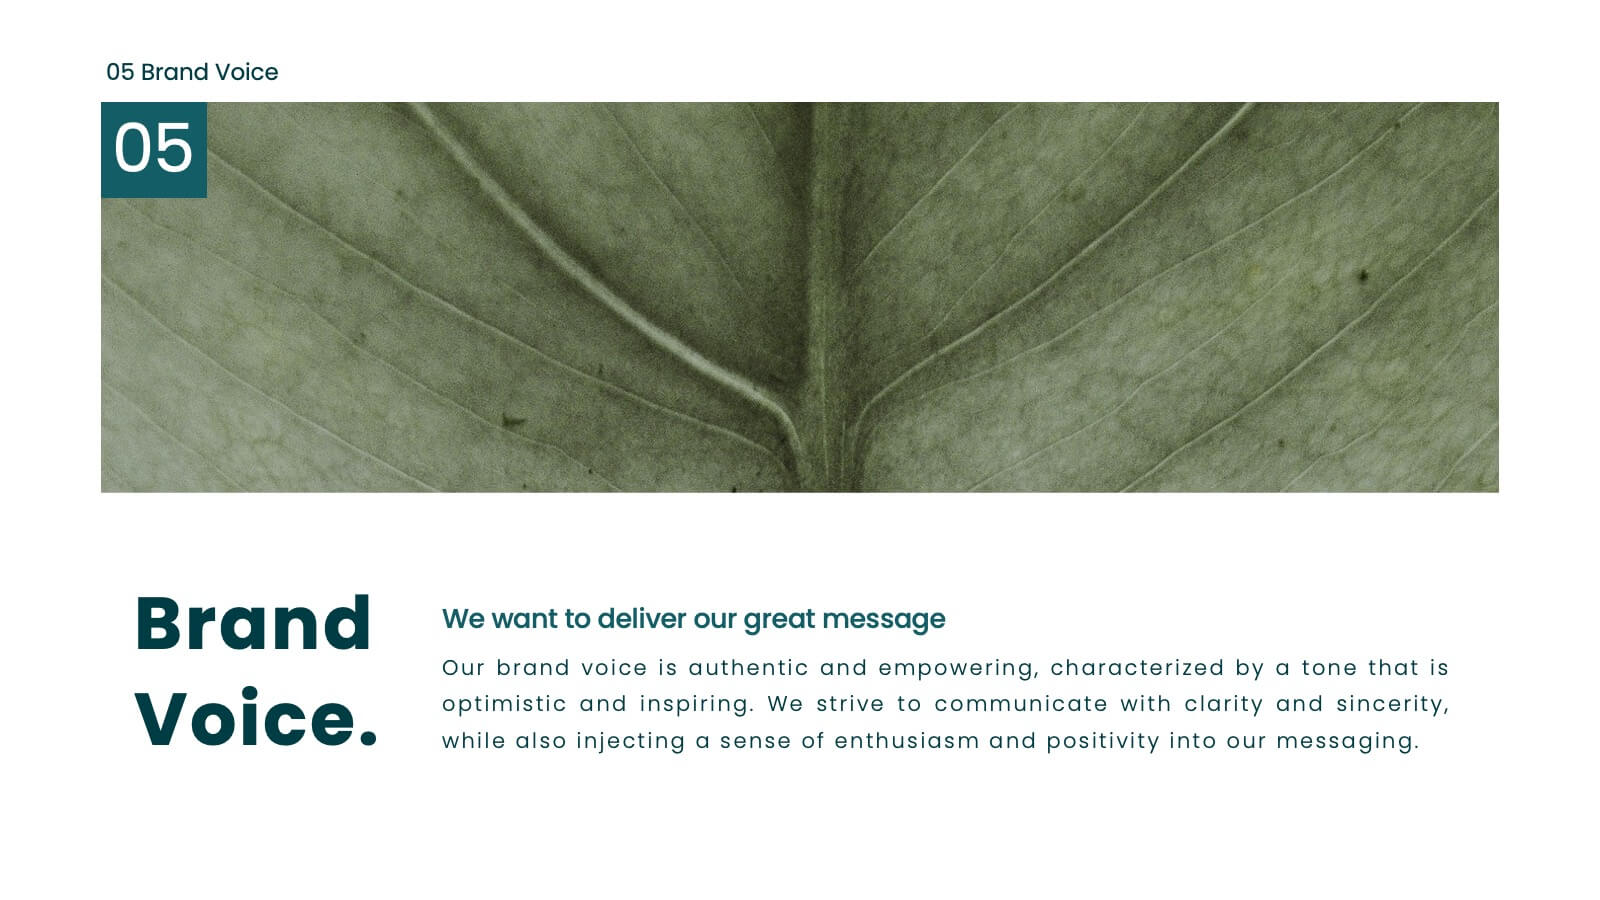
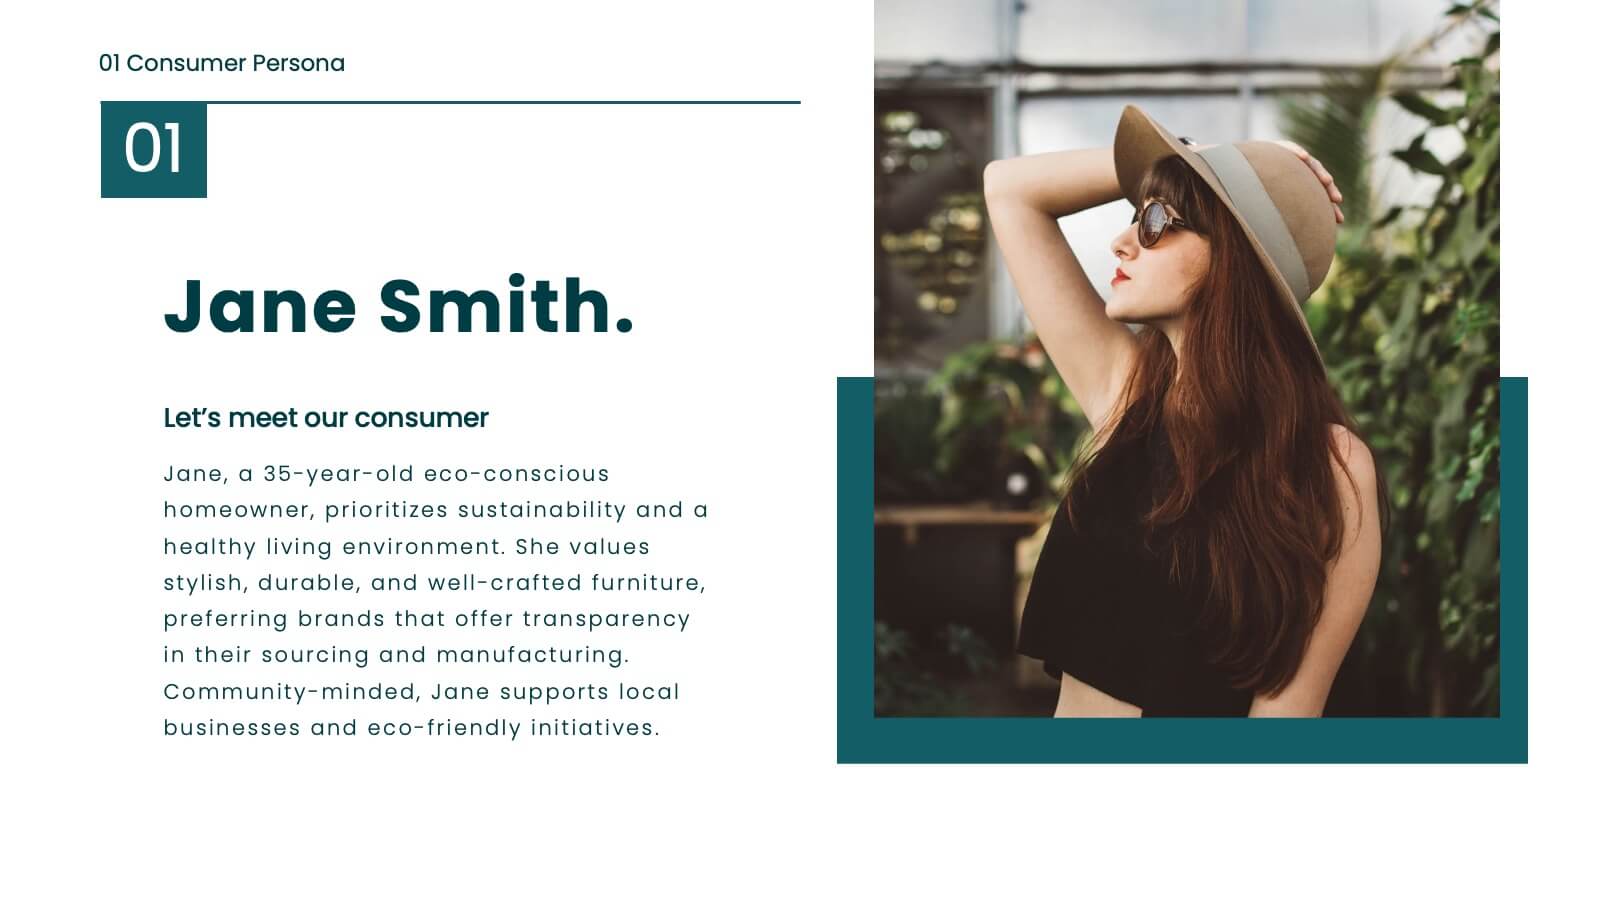
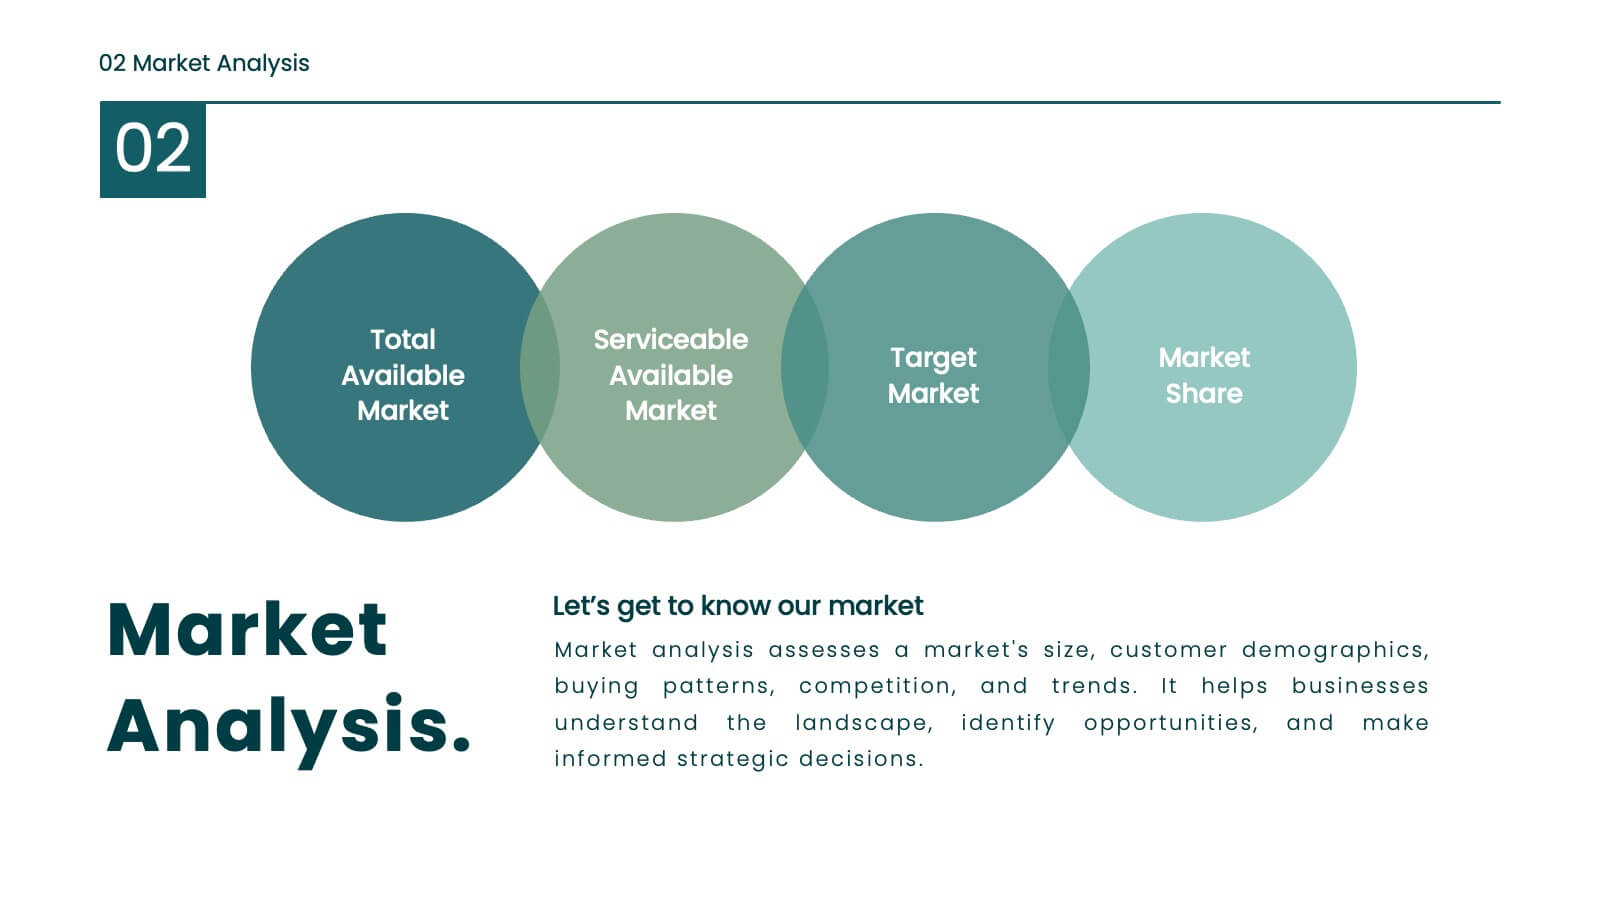
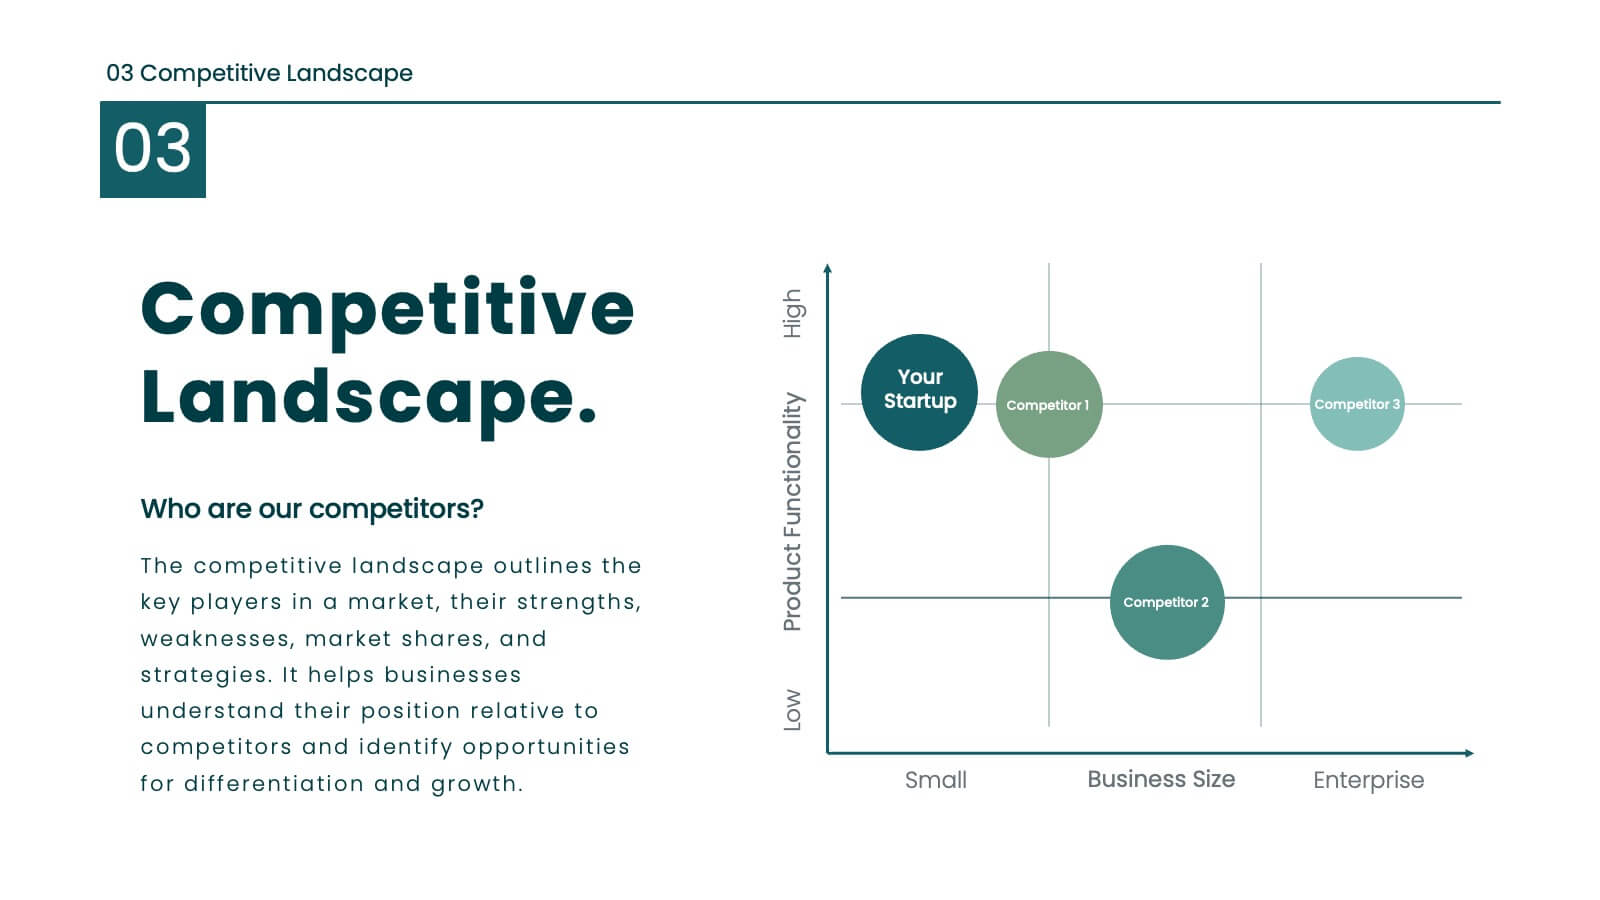
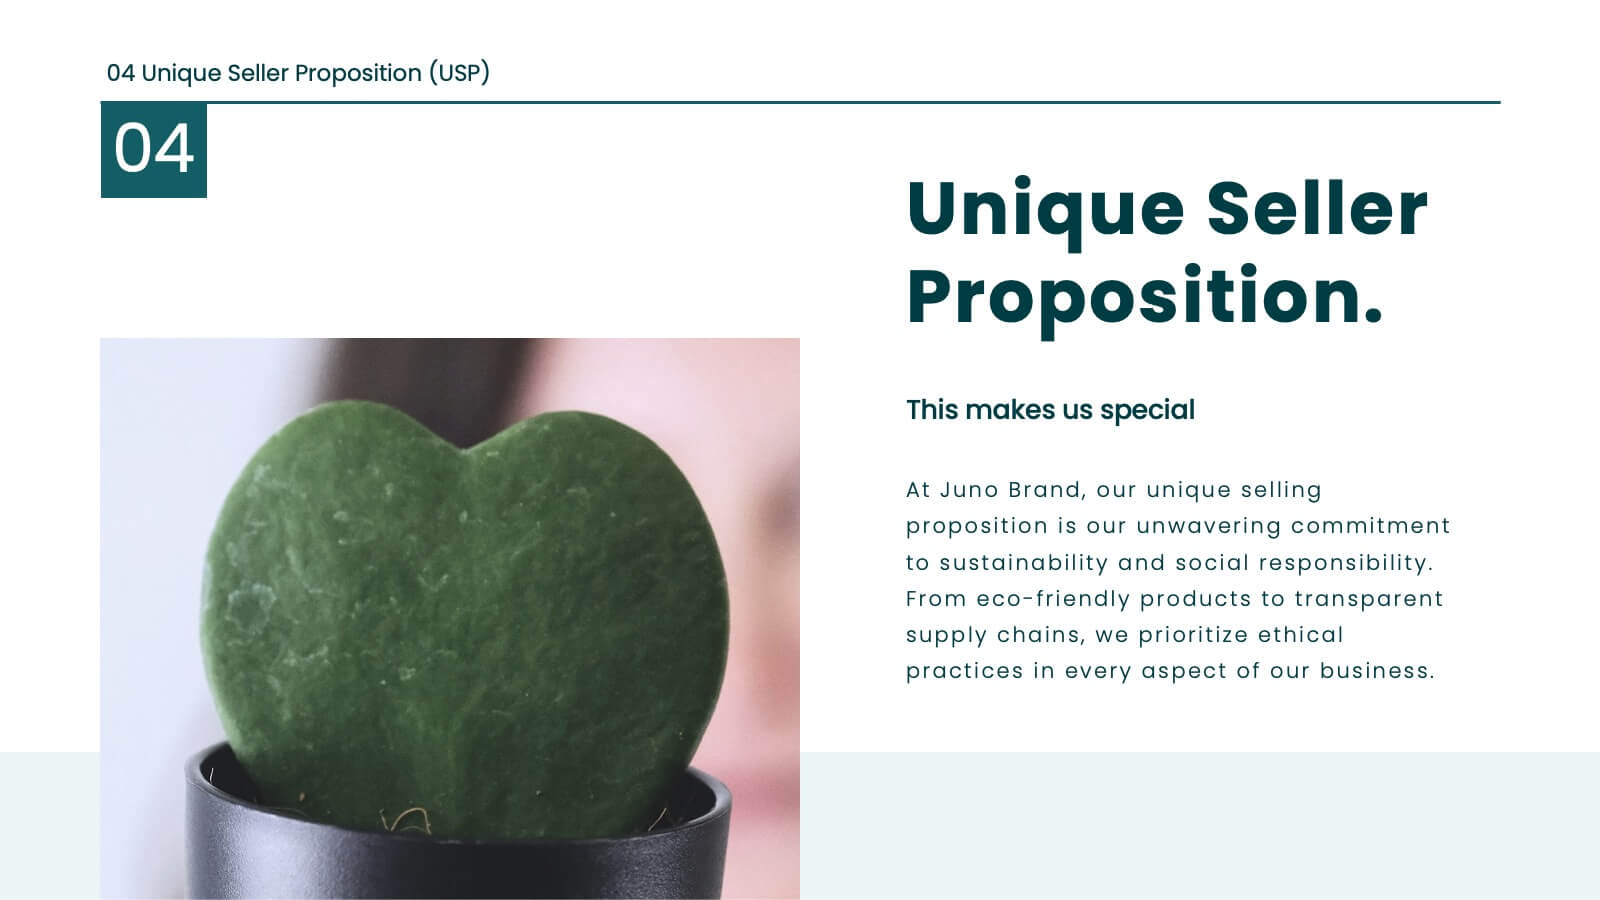
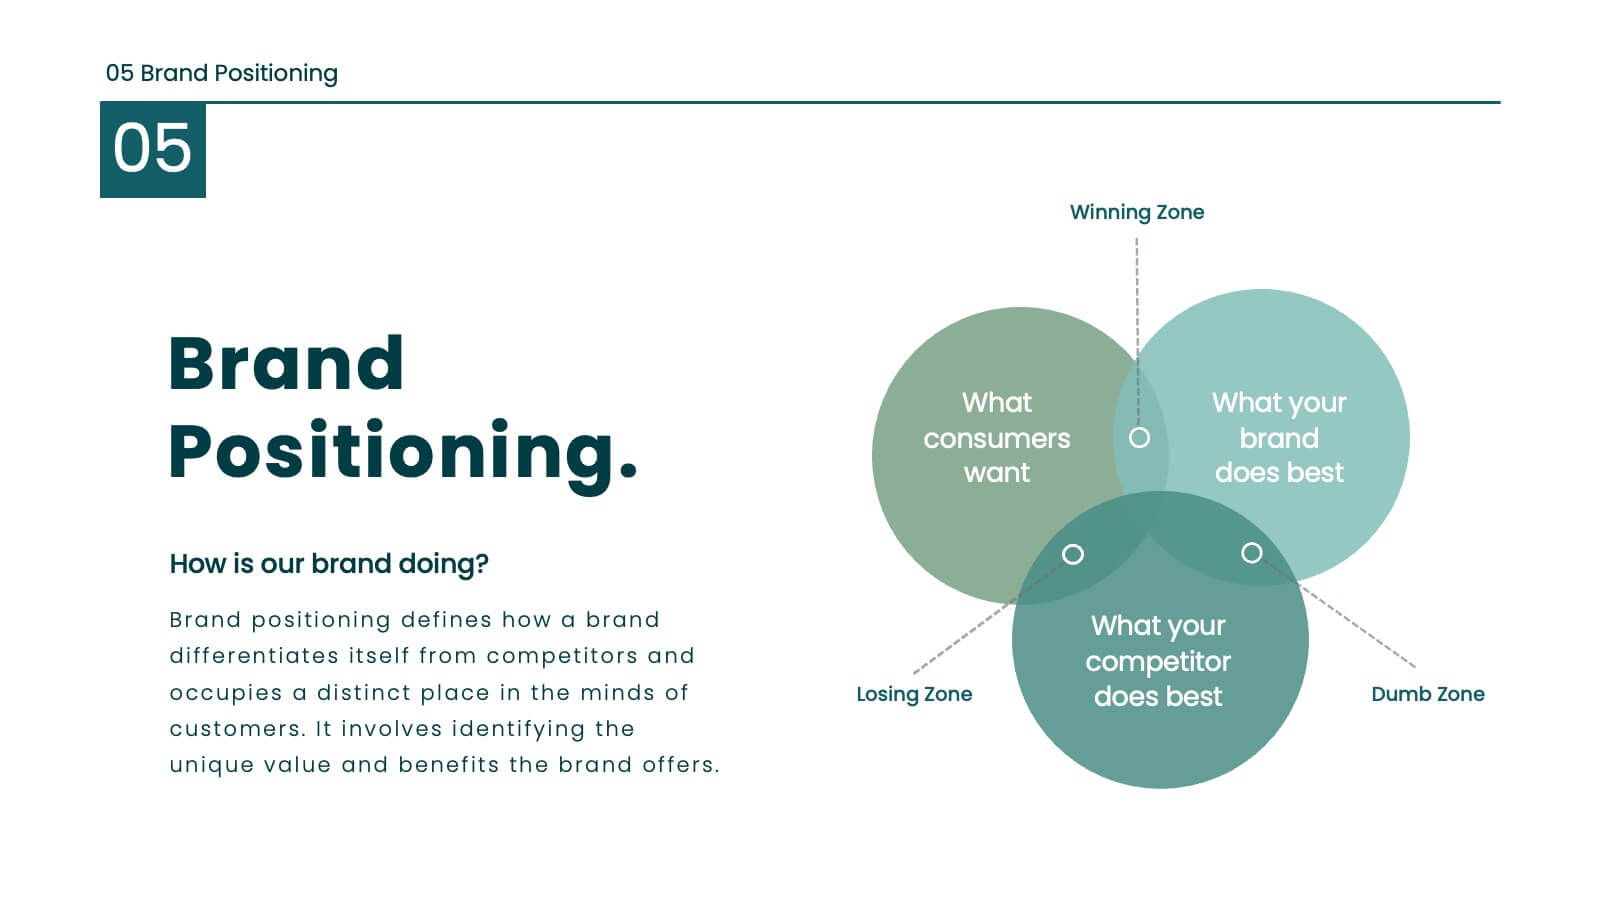
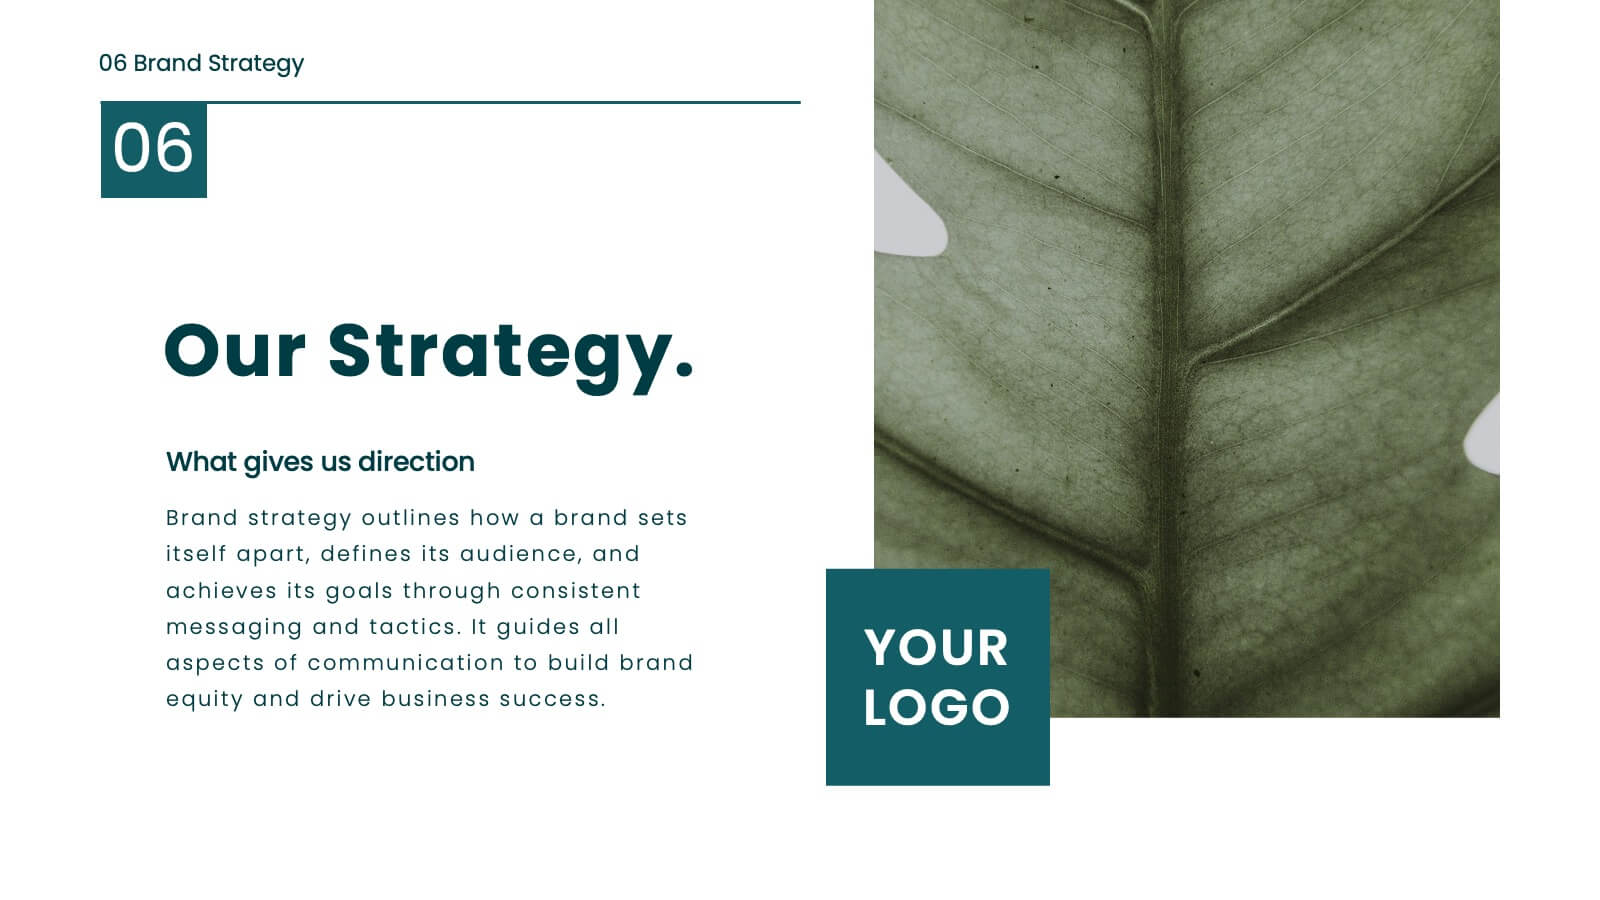
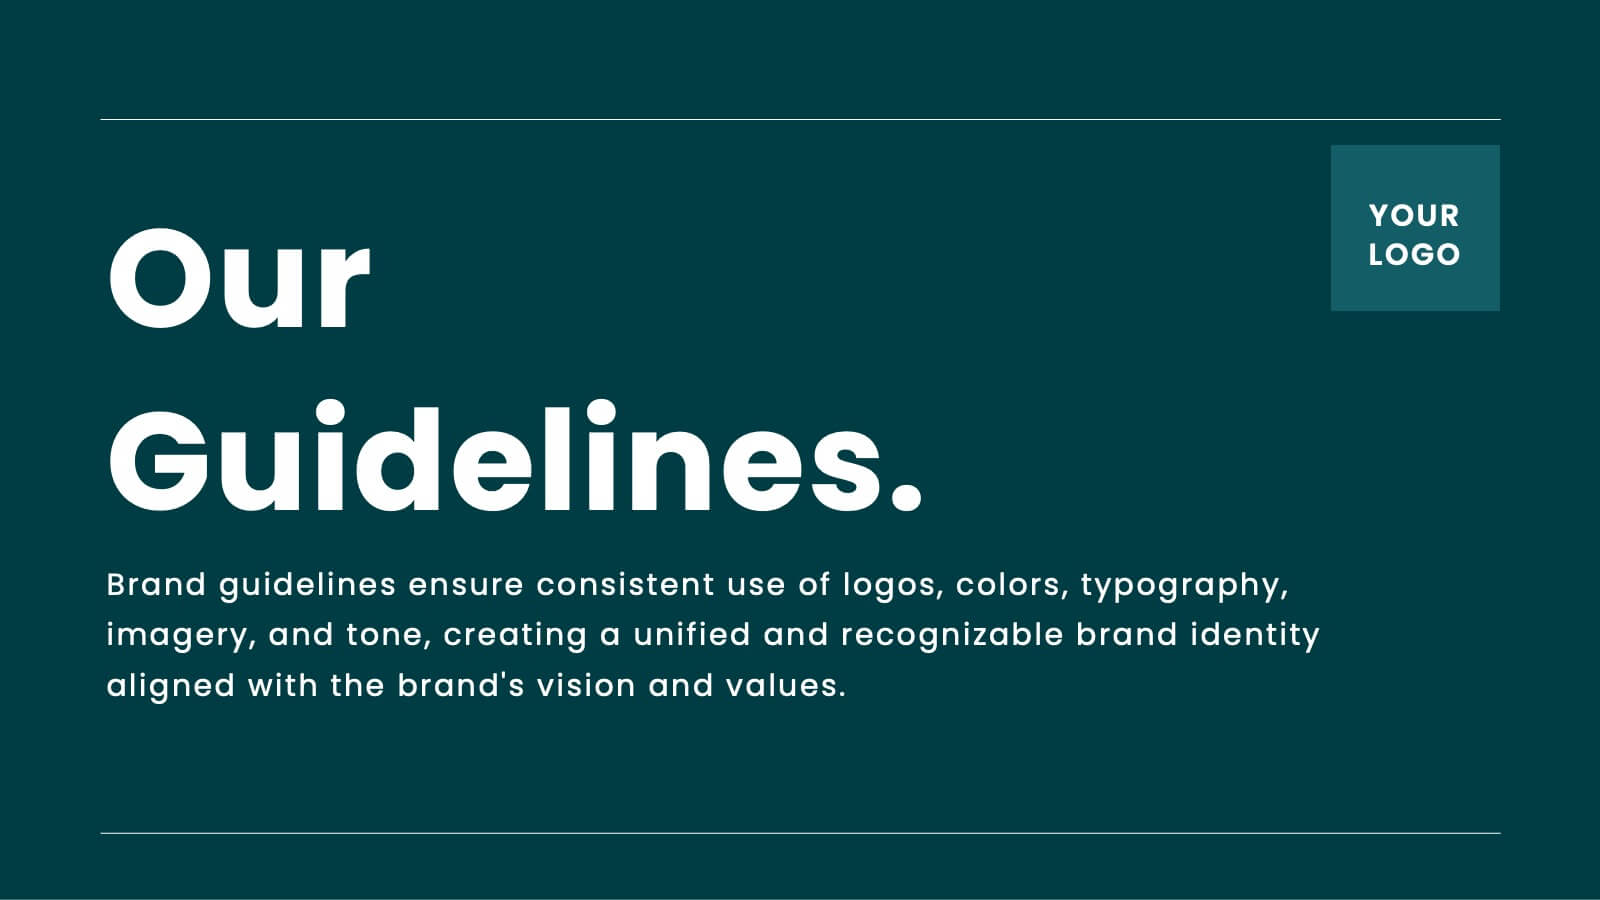
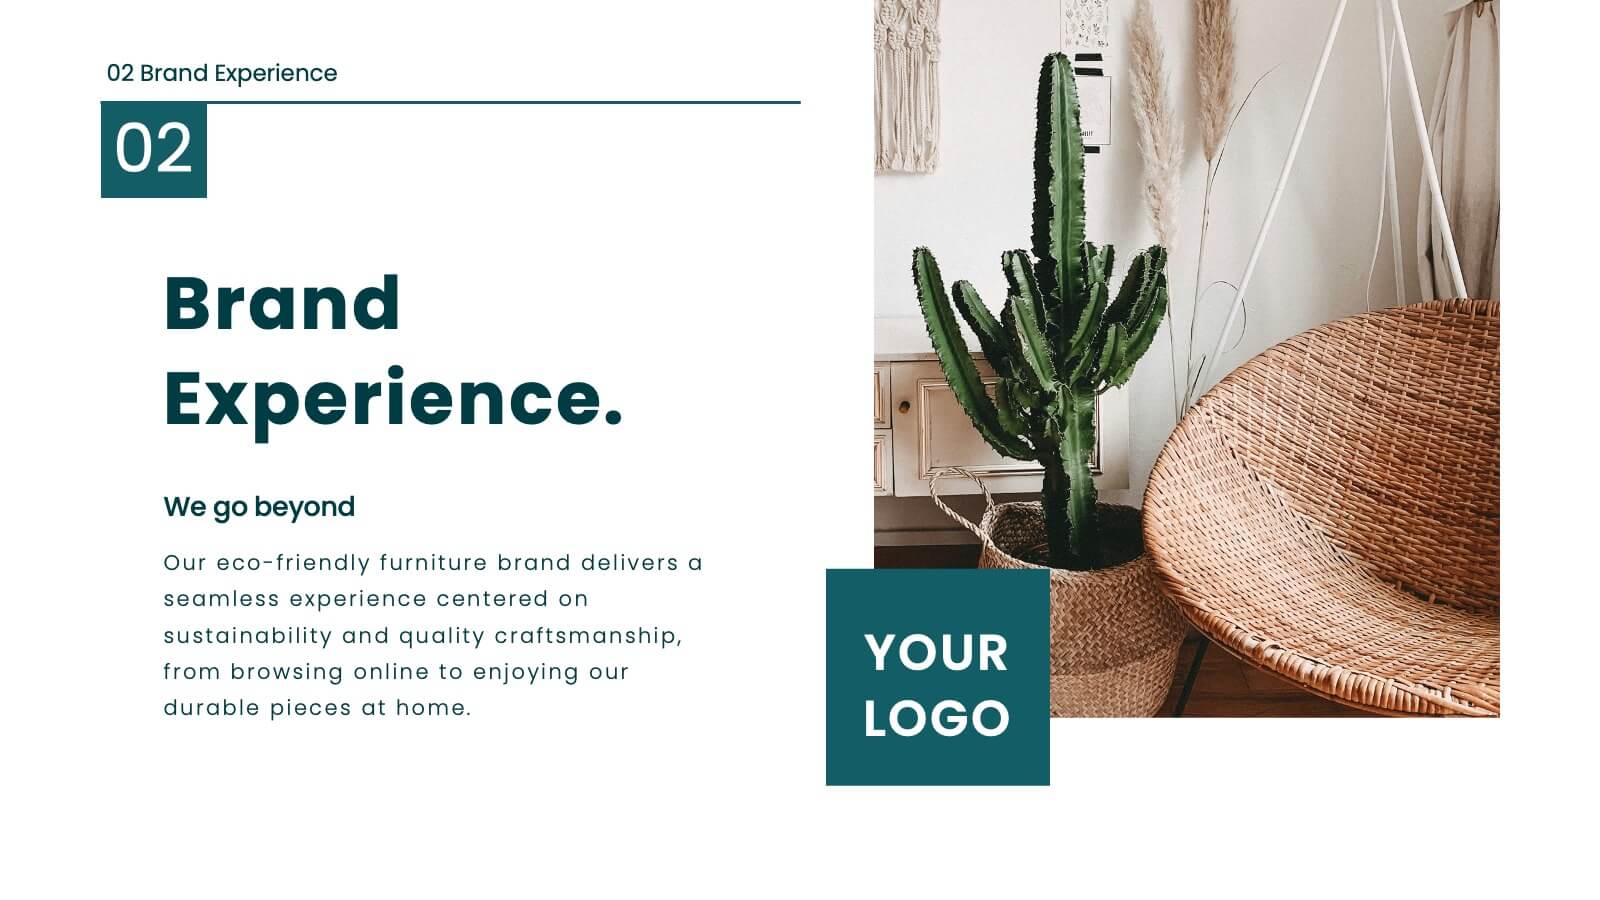
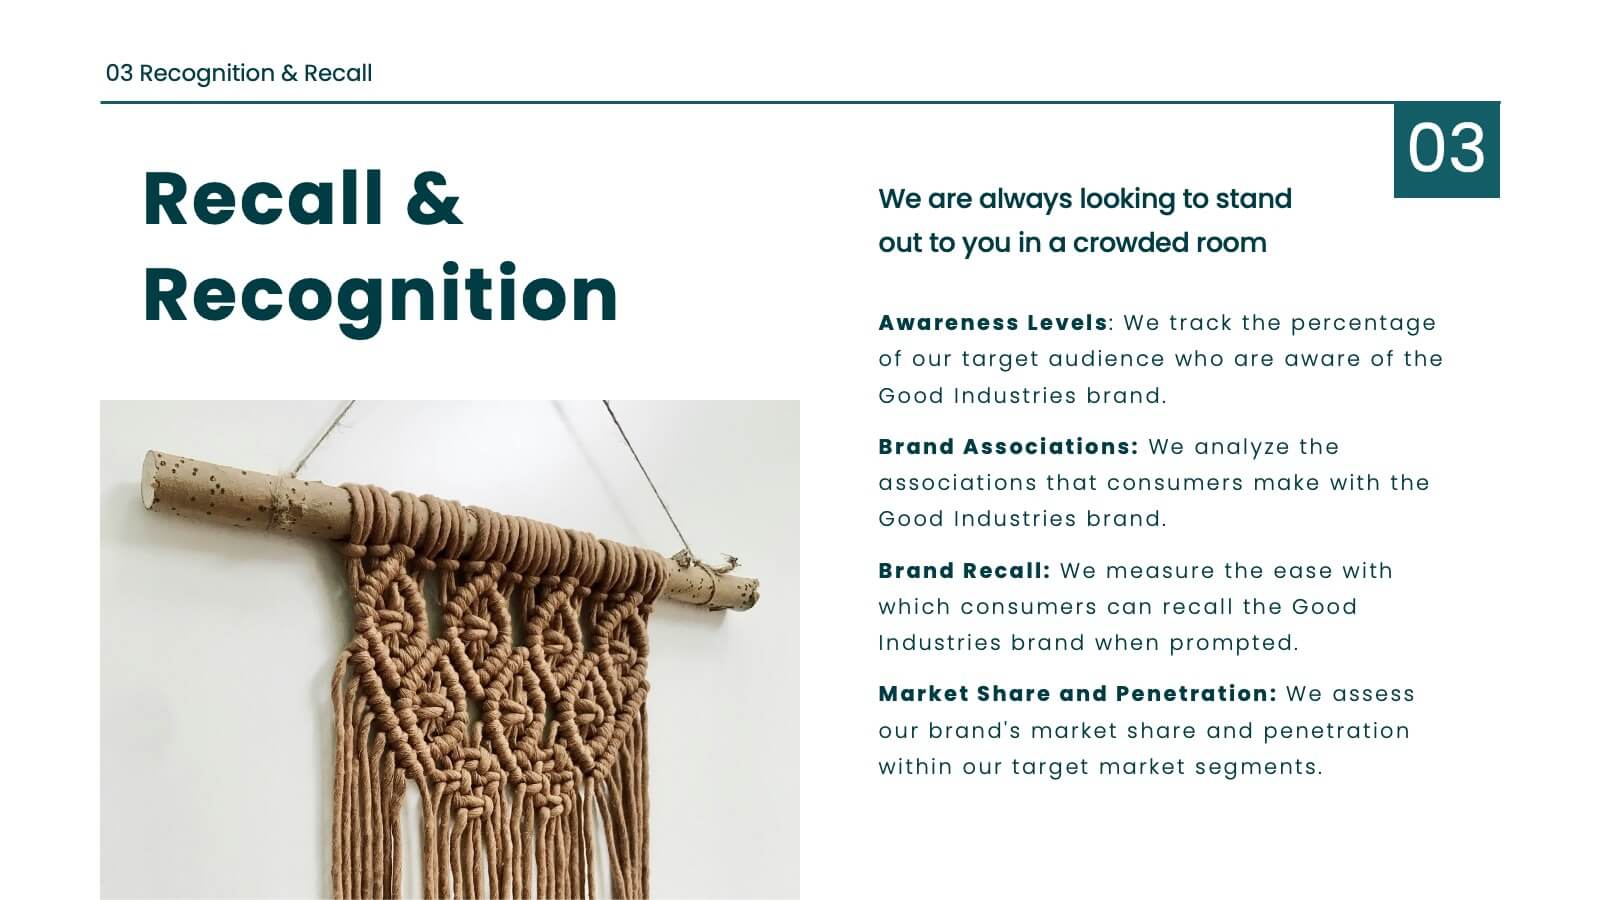
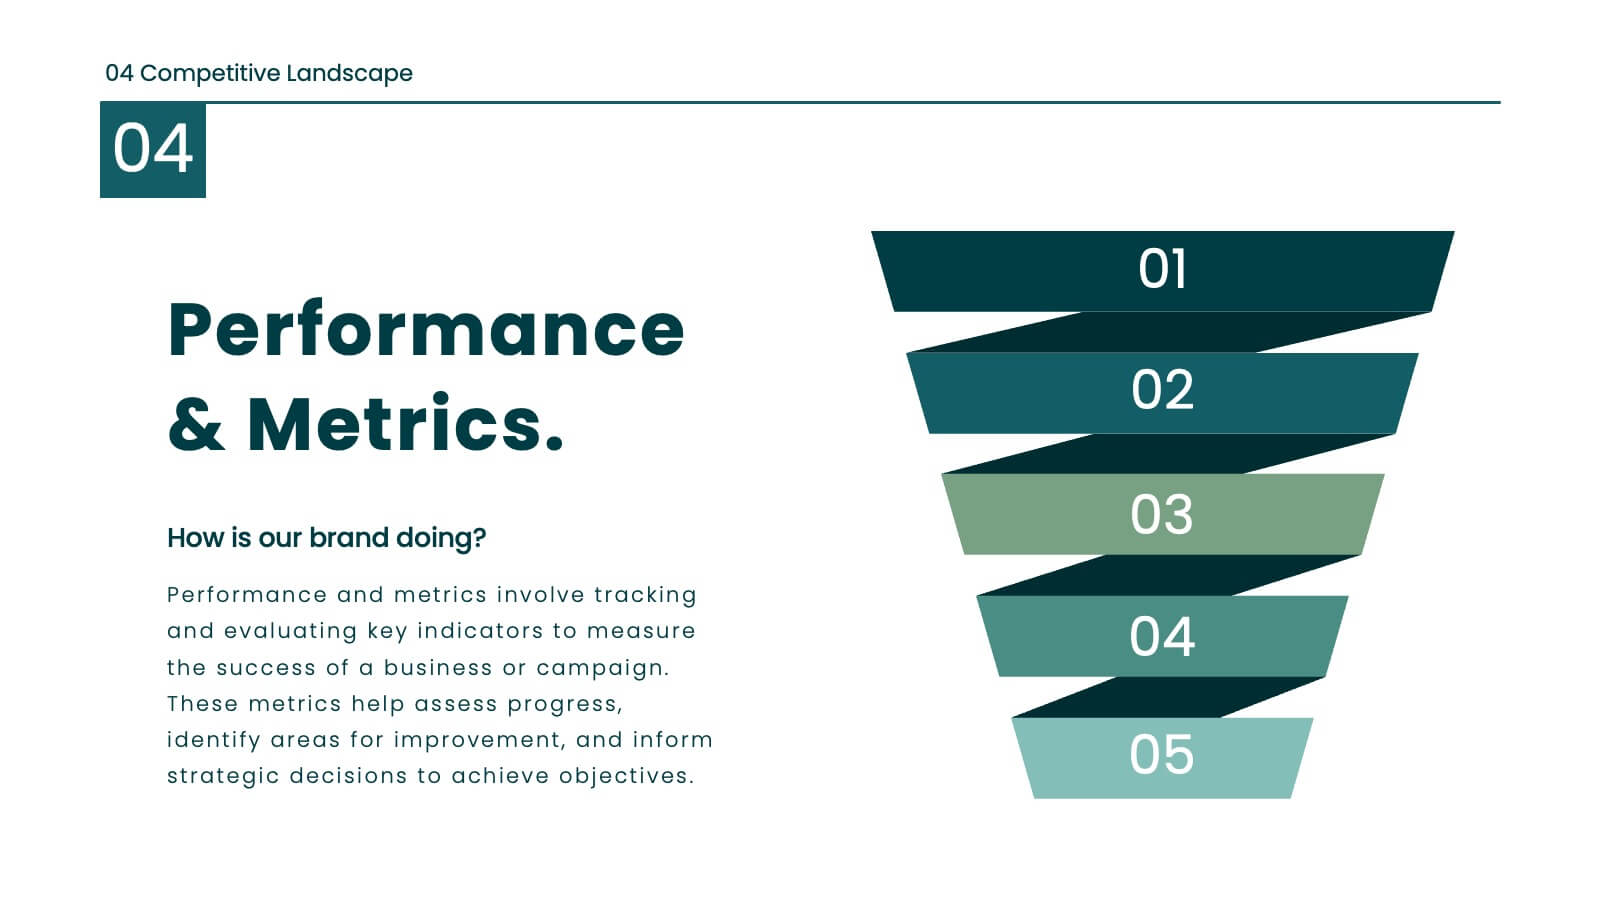
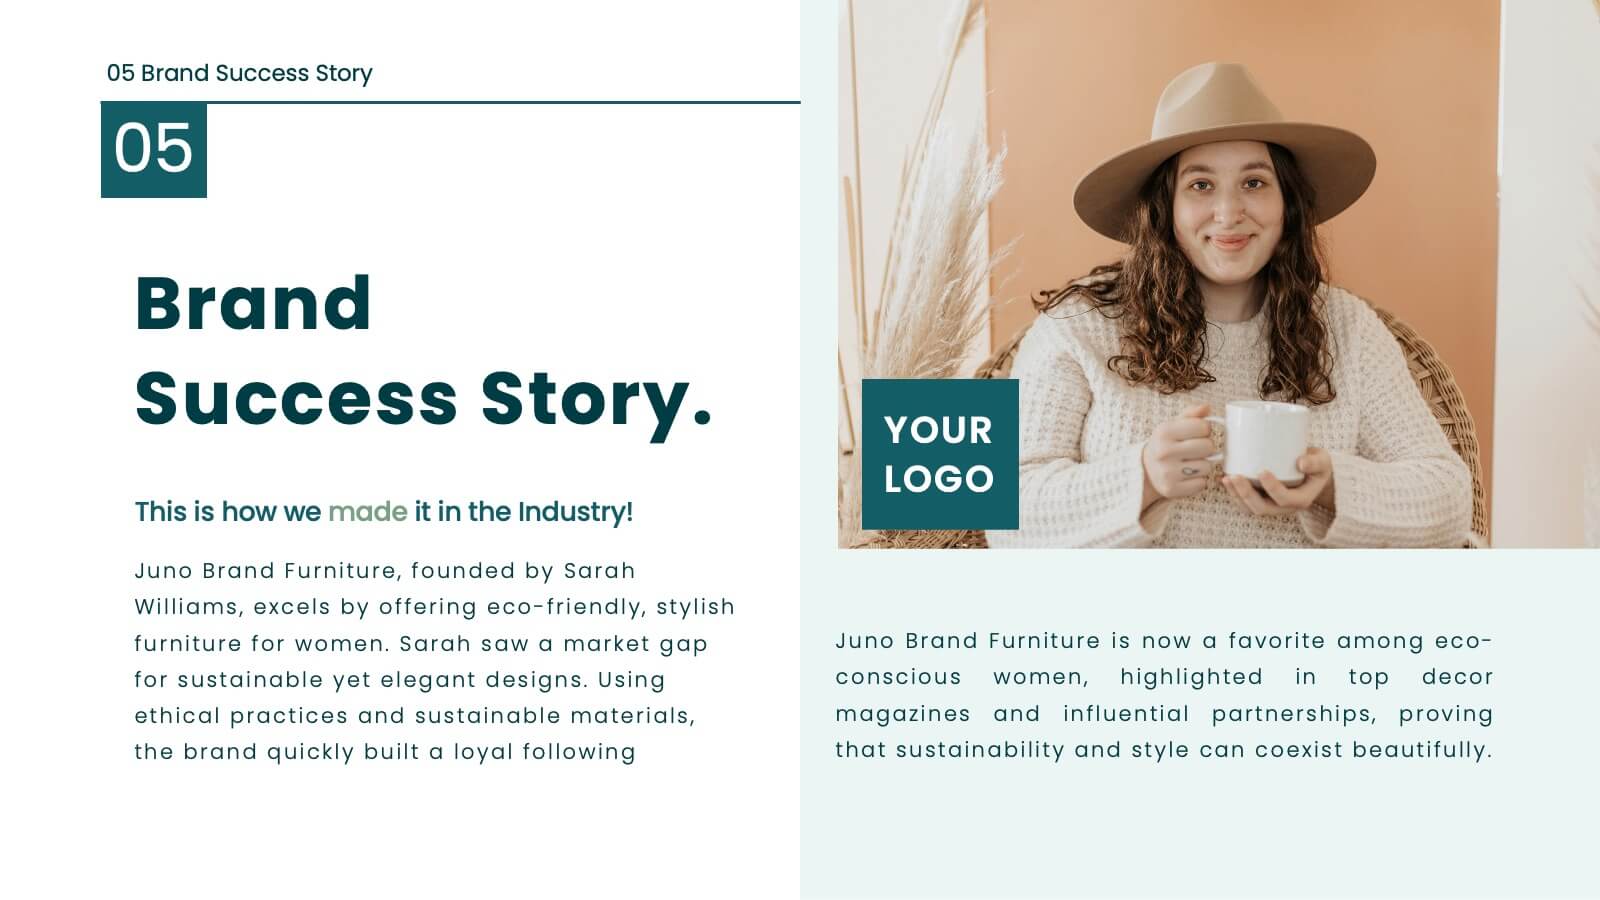
Juno Brand Guidelines Proposal Presentation
Define your brand's identity with this comprehensive, stylish presentation template. Perfect for detailing brand guidelines, vision, mission, and market analysis, it features a clean design with a professional layout. Highlight key elements like color palettes, typography, and unique selling propositions to ensure consistency and clarity. Compatible with PowerPoint, Keynote, and Google Slides, it’s ideal for any platform.


5 diapositivas
Concentric Circle Model Presentation
Make your ideas ripple outward with a layered, modern design that visualizes relationships and hierarchies in a clear, engaging way. Perfect for mapping influence, impact, or organizational structures, this layout brings balance to your visuals. Fully editable and compatible with PowerPoint, Keynote, and Google Slides for seamless customization.


6 diapositivas
Employee Change Management Strategy Presentation
Communicate change with clarity using this structured, gear-themed presentation slide. Designed to visualize six strategic stages of employee transition, it's ideal for HR professionals, team leaders, and consultants managing organizational change. Each step is represented with a numbered circle and aligned text for easy guidance. Fully customizable in PowerPoint, Keynote, and Google Slides.


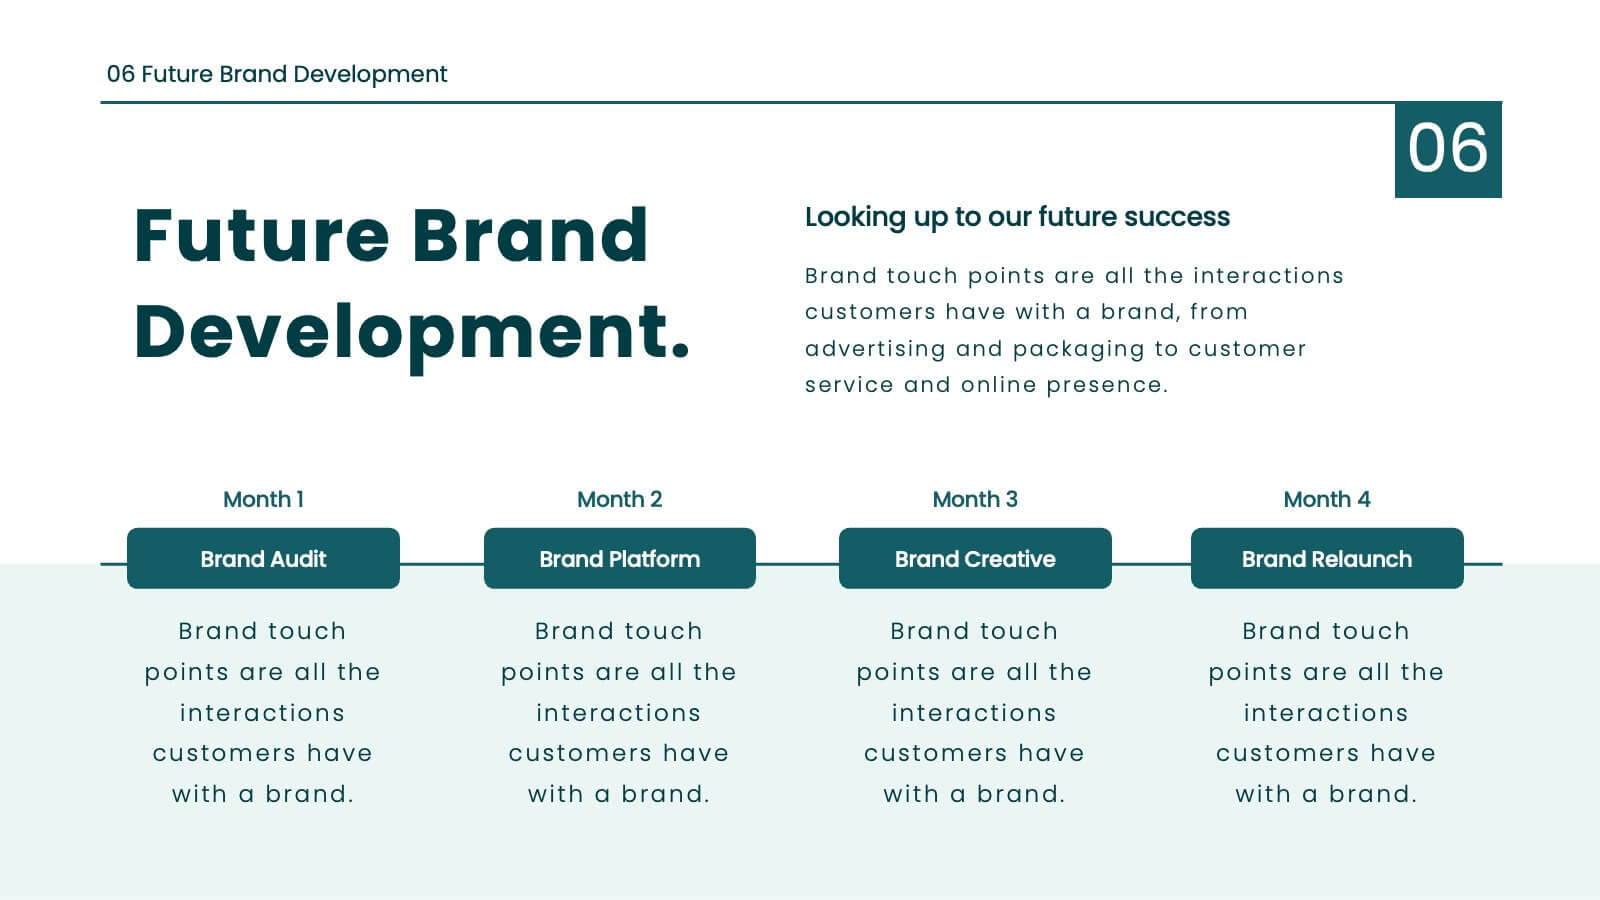
10 diapositivas
Corporate Sustainability Goals Planning
Drive environmental impact with clarity using the Corporate Sustainability Goals Planning Presentation. This clean, circular infographic helps communicate sustainability initiatives, eco-objectives, and long-term strategy with ease. Perfect for ESG reports, internal goal tracking, or stakeholder updates. Fully editable in PowerPoint, Keynote, and Google Slides.


15 diapositivas
Business Infographic Presentation Template
A business is an organization engaged in commercial, industrial, or professional activities. A Business Infographic is a visual representation of information related to business topics like marketing, sales, finance, project management, customer service, and more. Using the graphics, charts, icons, and other design elements provided, create the best presentation. These infographics are usually used to help explain business concepts, show trends and results, and communicate information to employees, stakeholders, customers, and for students. Use this for presentations, reports and websites!


2 diapositivas
Professional Cover and Title Layout
Make a bold first impression with this stylish and modern cover slide template. Featuring a balanced design of imagery and typography, it's perfect for business reports, marketing decks, or strategic plans. Fully editable in PowerPoint, Keynote, and Google Slides for effortless customization.


34 diapositivas
Pitch Deck Startup
Introducing our Pitch Deck Startup! Whether you are pitching to investors, partners, or customers, this template will help you create a persuasive presentation that showcases your company, growth plans, and financial projections. Customize the template to suit your needs and deliver a successful pitch that highlights the unique value of your startup and attracts potential investors or customers. This template includes sections for introducing your startup, explaining your business idea and market opportunity, showcasing your products or services, highlighting your financial projections, and outlining your growth plans.


7 diapositivas
Digital Marketing Infographics Presentation Template
Digital marketing is essential for your business and brand awareness. From website design to social media advertising, learn about all the ways digital marketing can help grow your company with this template. Digital marketing can be a powerful and effective way to promote your business.