


Características


¿Tienes alguna pregunta?
Recomendar


5 diapositivas
Spider Chart for Mind Organization Presentation
Clarify complex ideas with the Spider Chart for Mind Organization Presentation. This layout visually maps key topics and subtopics, helping you identify patterns, priorities, or areas of focus. Ideal for planning, decision-making, and brainstorming sessions. Fully customizable in Canva, PowerPoint, Google Slides, and Keynote for seamless use.


4 diapositivas
Strategic Idea Pitch Presentation
Present your strategic ideas with clarity using this structured Strategic Idea Pitch template. Designed for business professionals and entrepreneurs, it simplifies complex ideas with a visual roadmap. Fully customizable and compatible with PowerPoint, Keynote, and Google Slides, it ensures a polished, persuasive presentation for pitching strategies and innovations effectively.


6 diapositivas
Engagement Survey Results Infographics
Effectively communicate your engagement survey results with our Engagement Survey Results infographic template. This template is fully compatible with popular presentation software like PowerPoint, Keynote, and Google Slides, allowing you to easily customize it to illustrate and convey your survey findings. The Engagement Survey Results infographic template offers a visually engaging platform to present survey data, key findings, and insights related to employee or customer engagement. Whether you're an HR professional, manager, or business leader, this template provides a user-friendly canvas to create informative presentations and reports on engagement survey outcomes. Optimize your communication of survey results with this SEO-optimized Engagement Survey Results infographic template, thoughtfully designed for clarity and ease of use. Customize it to showcase survey methodology, response rates, visualizations of data, and action plans based on the findings, ensuring that your audience gains a comprehensive understanding of the survey results and their implications. Start crafting your personalized infographic today to effectively communicate engagement survey outcomes.


23 diapositivas
Maverick Business Plan Presentation
Navigate your business journey with ease using this comprehensive business plan presentation template. Structured to guide you through each critical aspect of your business, from market analysis and operational strategies to financial projections and employee management, this template provides a solid foundation for conveying your business objectives and plans. Ideal for startups and established enterprises alike, it's designed to facilitate discussions on company direction and strategic decisions. Compatible with PowerPoint, Google Slides, and Keynote, this template is accessible across devices, ensuring you can pitch or plan wherever you are.


5 diapositivas
Rental Business Milestone Timeline Presentation
Showcase your company's growth journey with this clean Rental Business Milestone Timeline layout. Designed for tracking key achievements, it features a horizontal timeline with icons and customizable date markers. Perfect for business reviews or investor updates, it’s fully editable in PowerPoint, Keynote, and Google Slides for a professional presentation

20 diapositivas
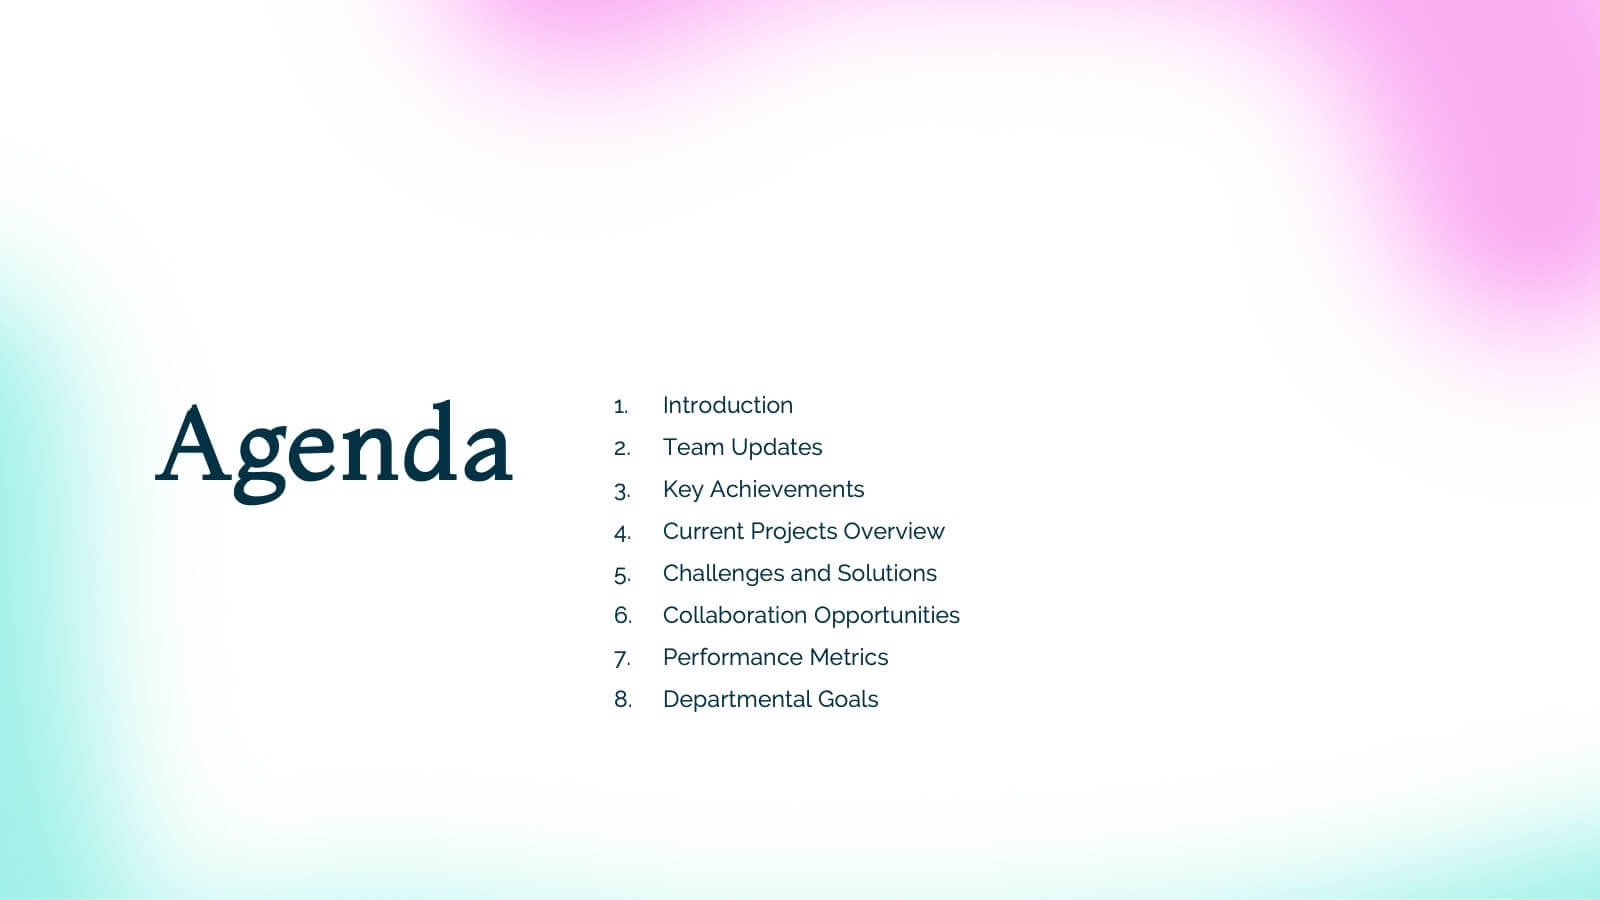
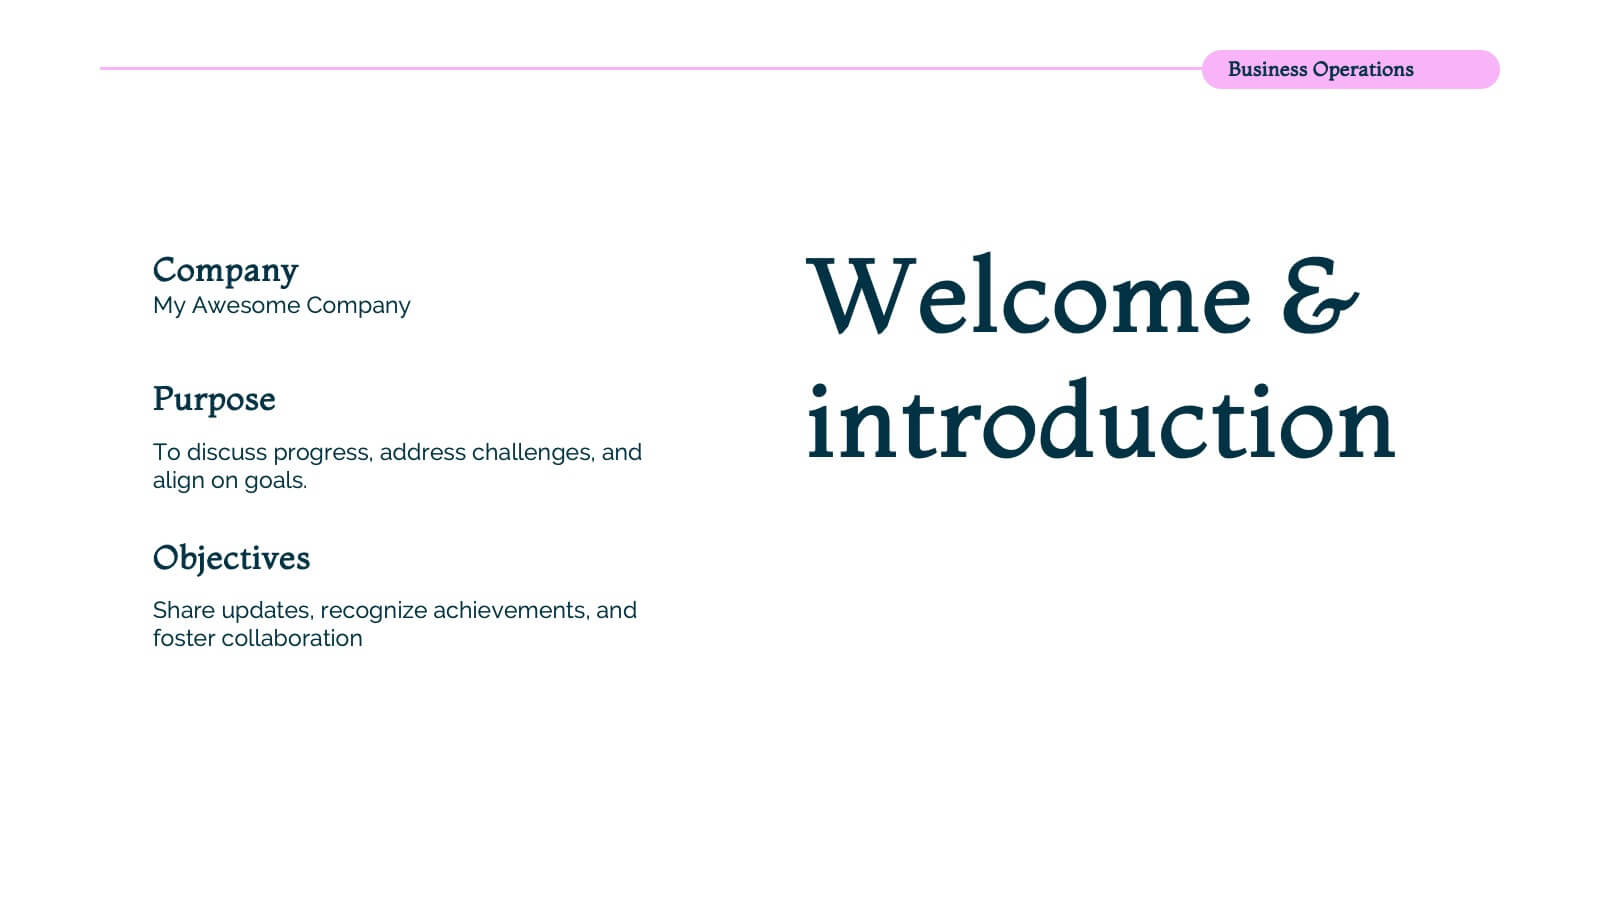
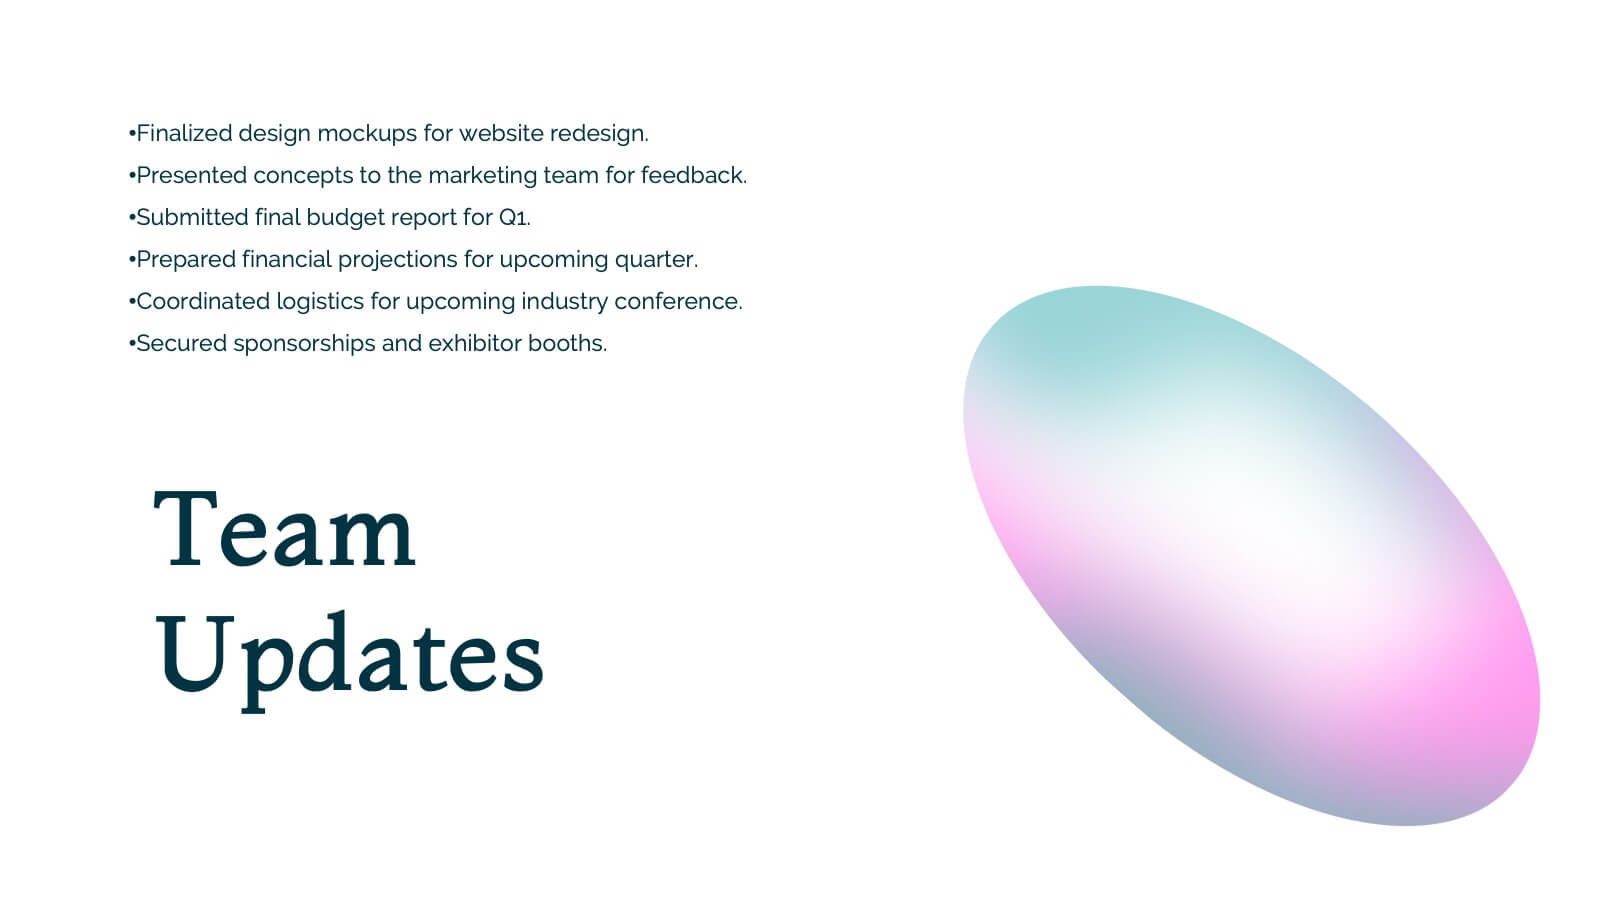
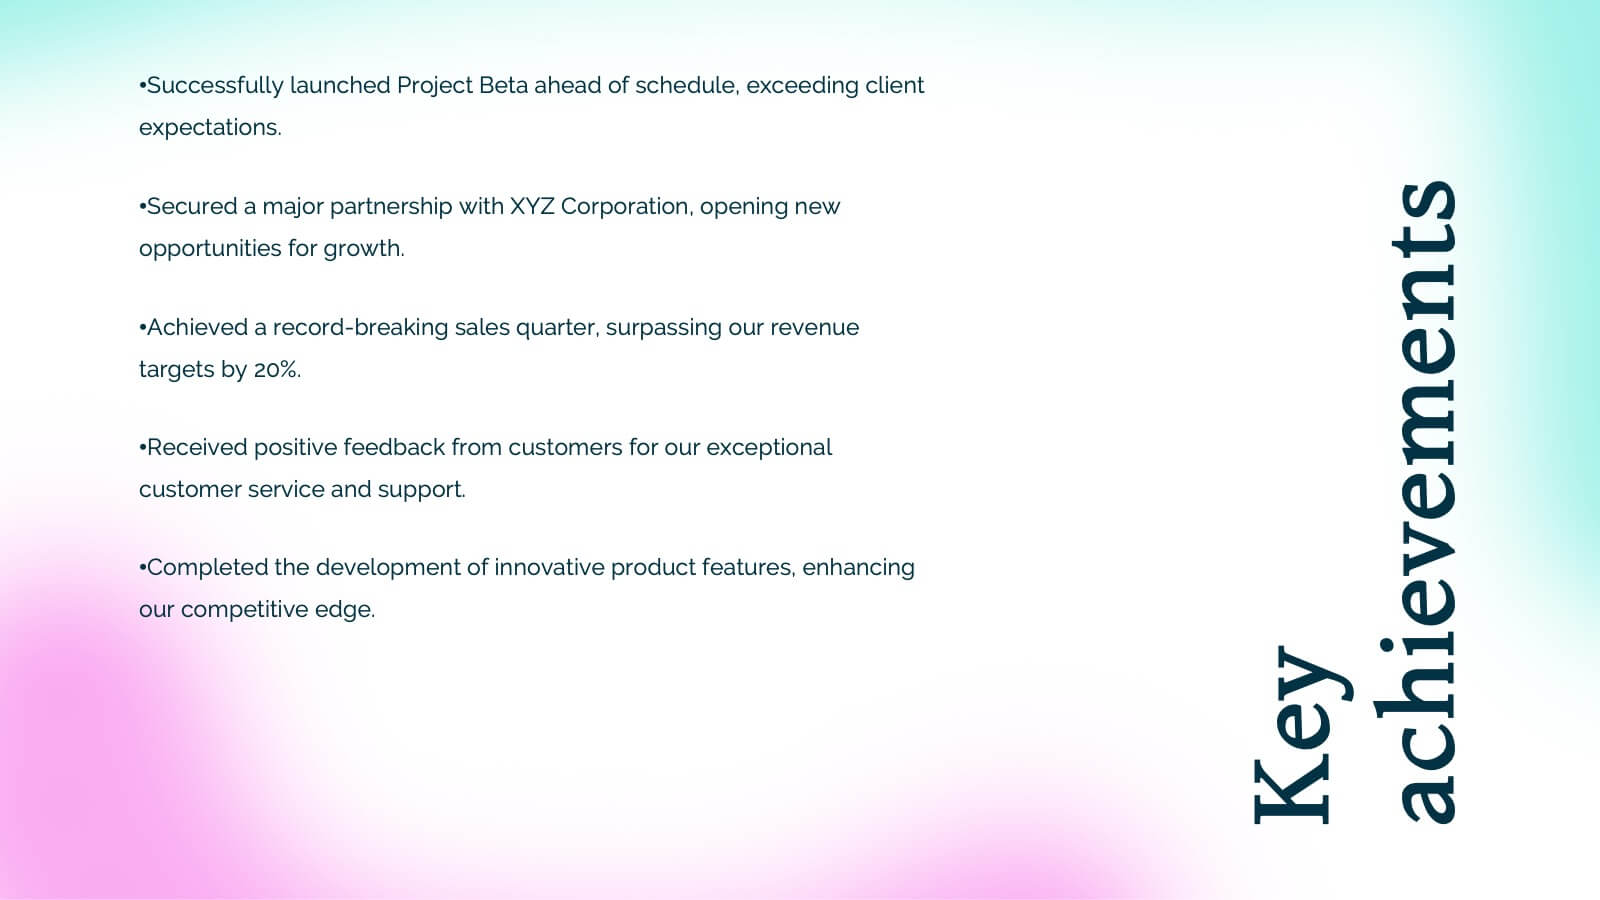
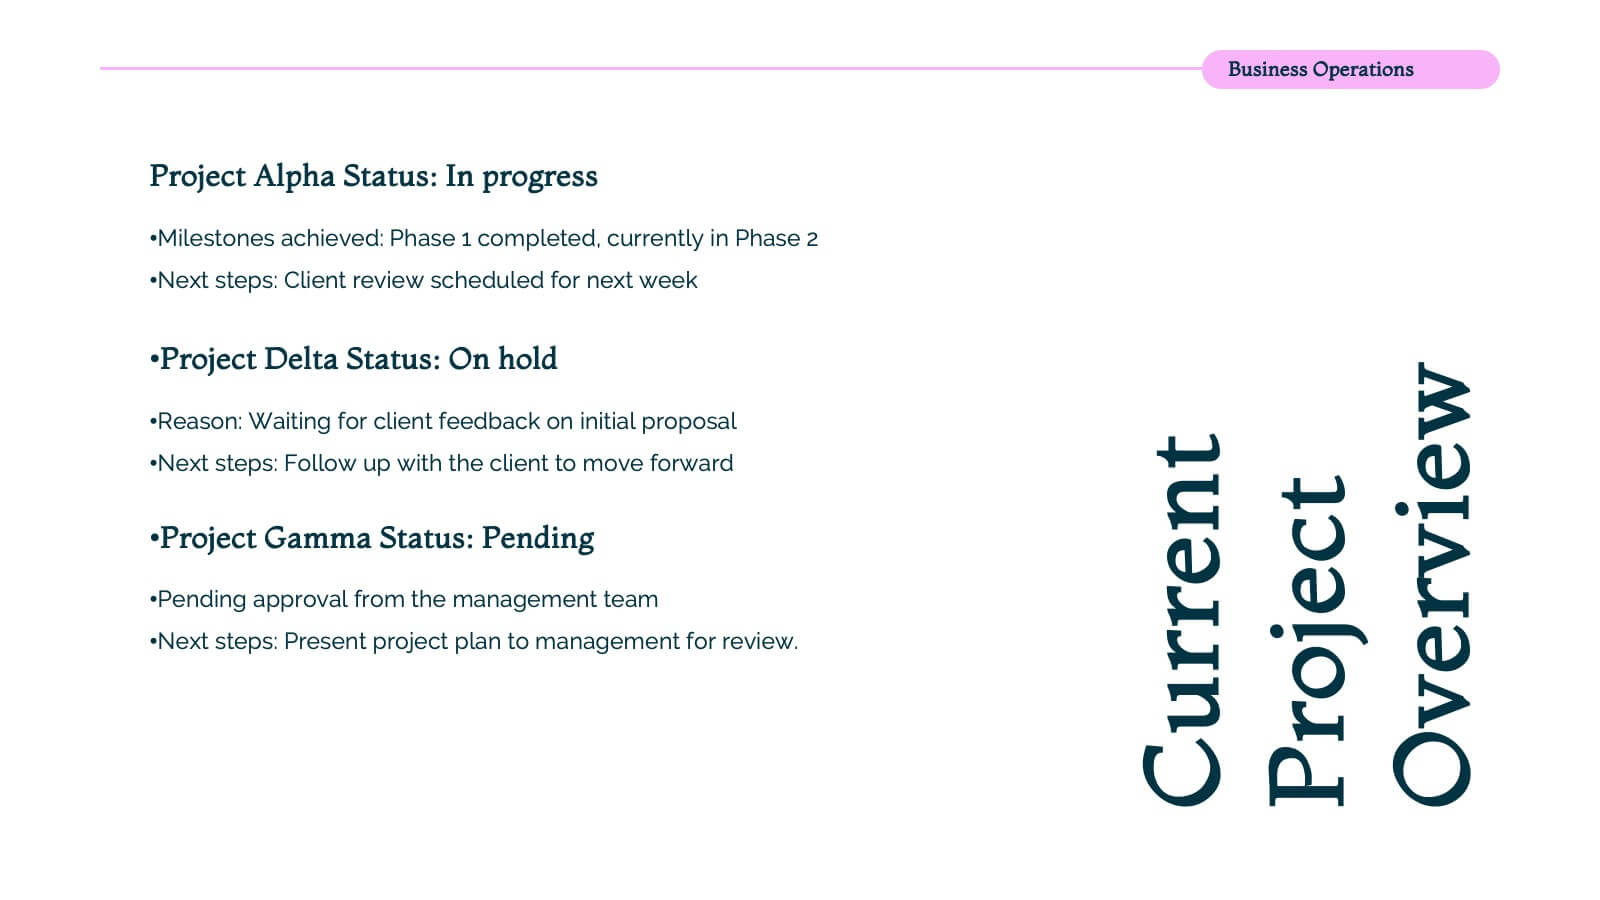
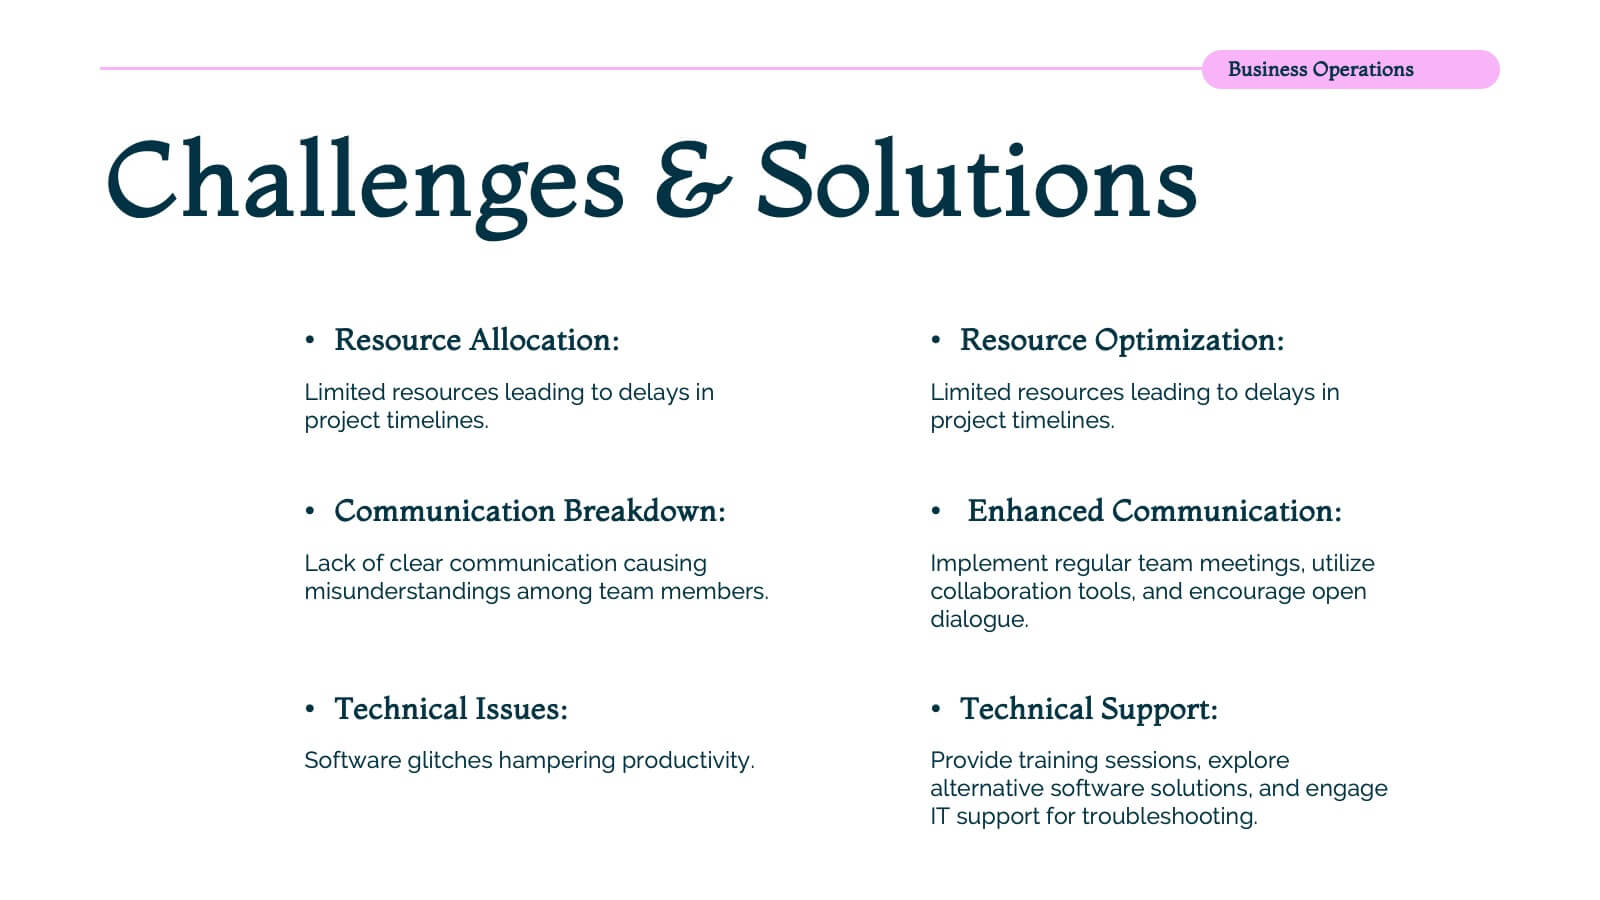
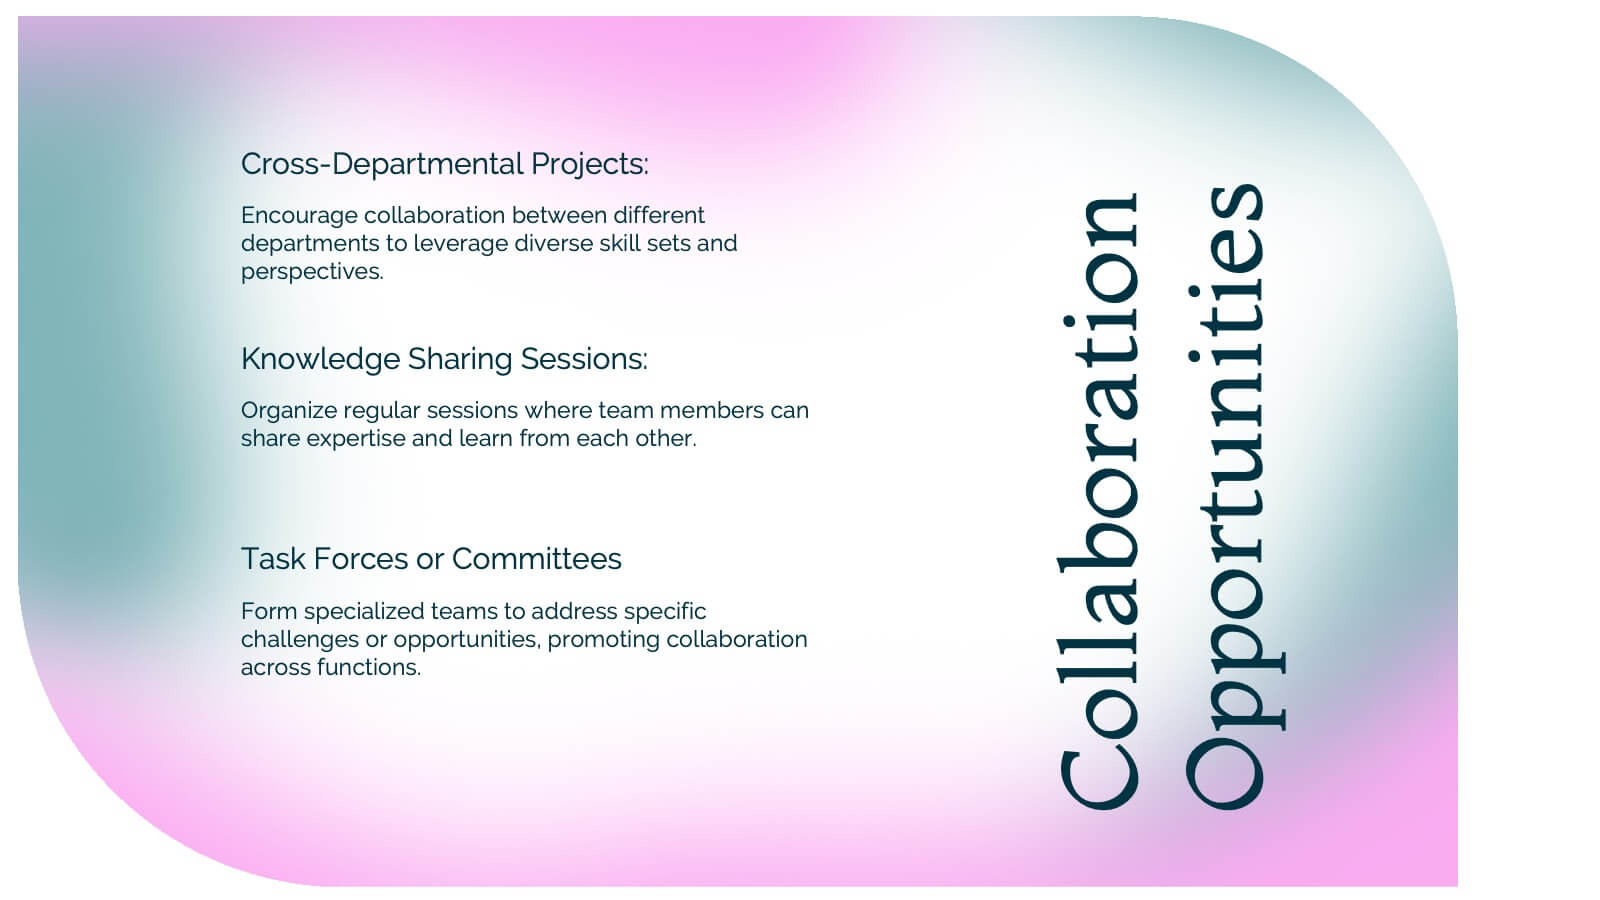
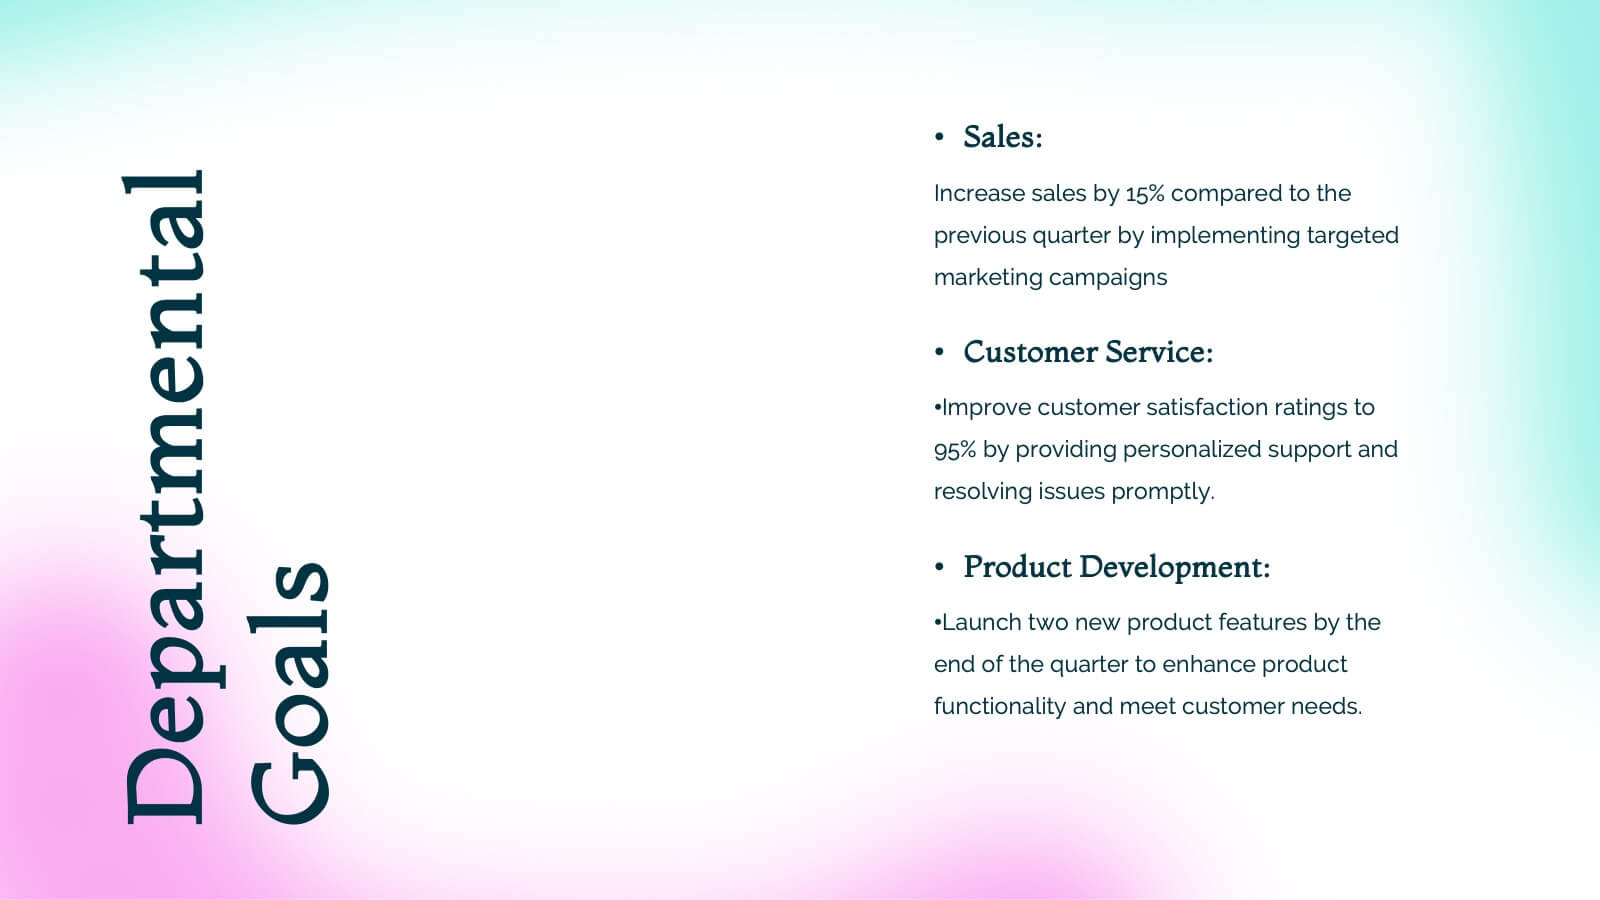
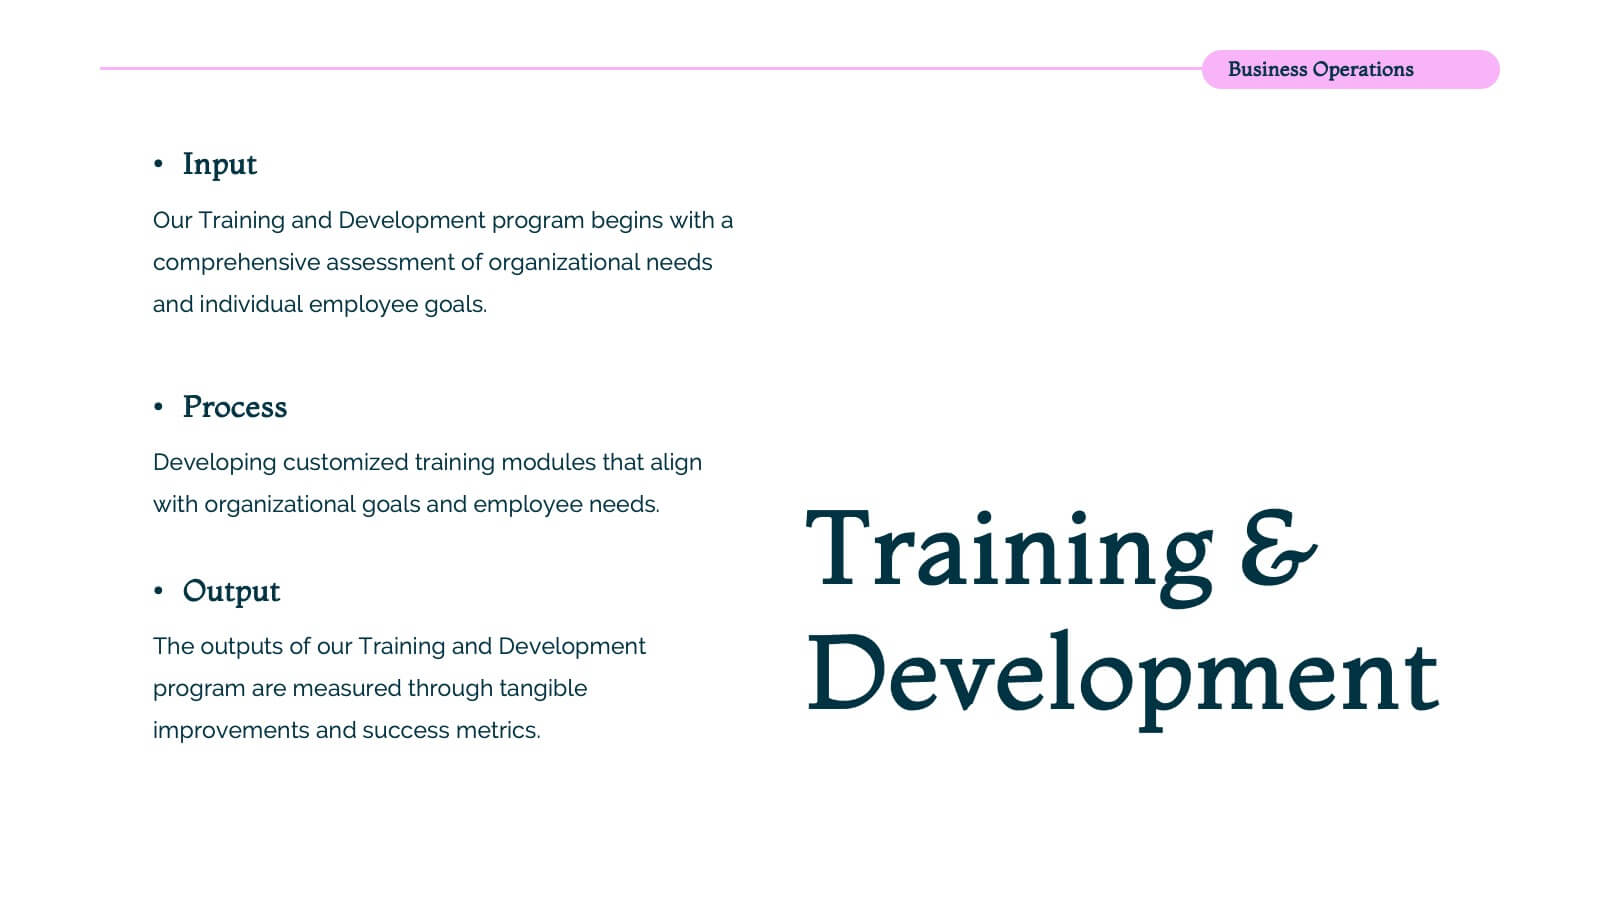
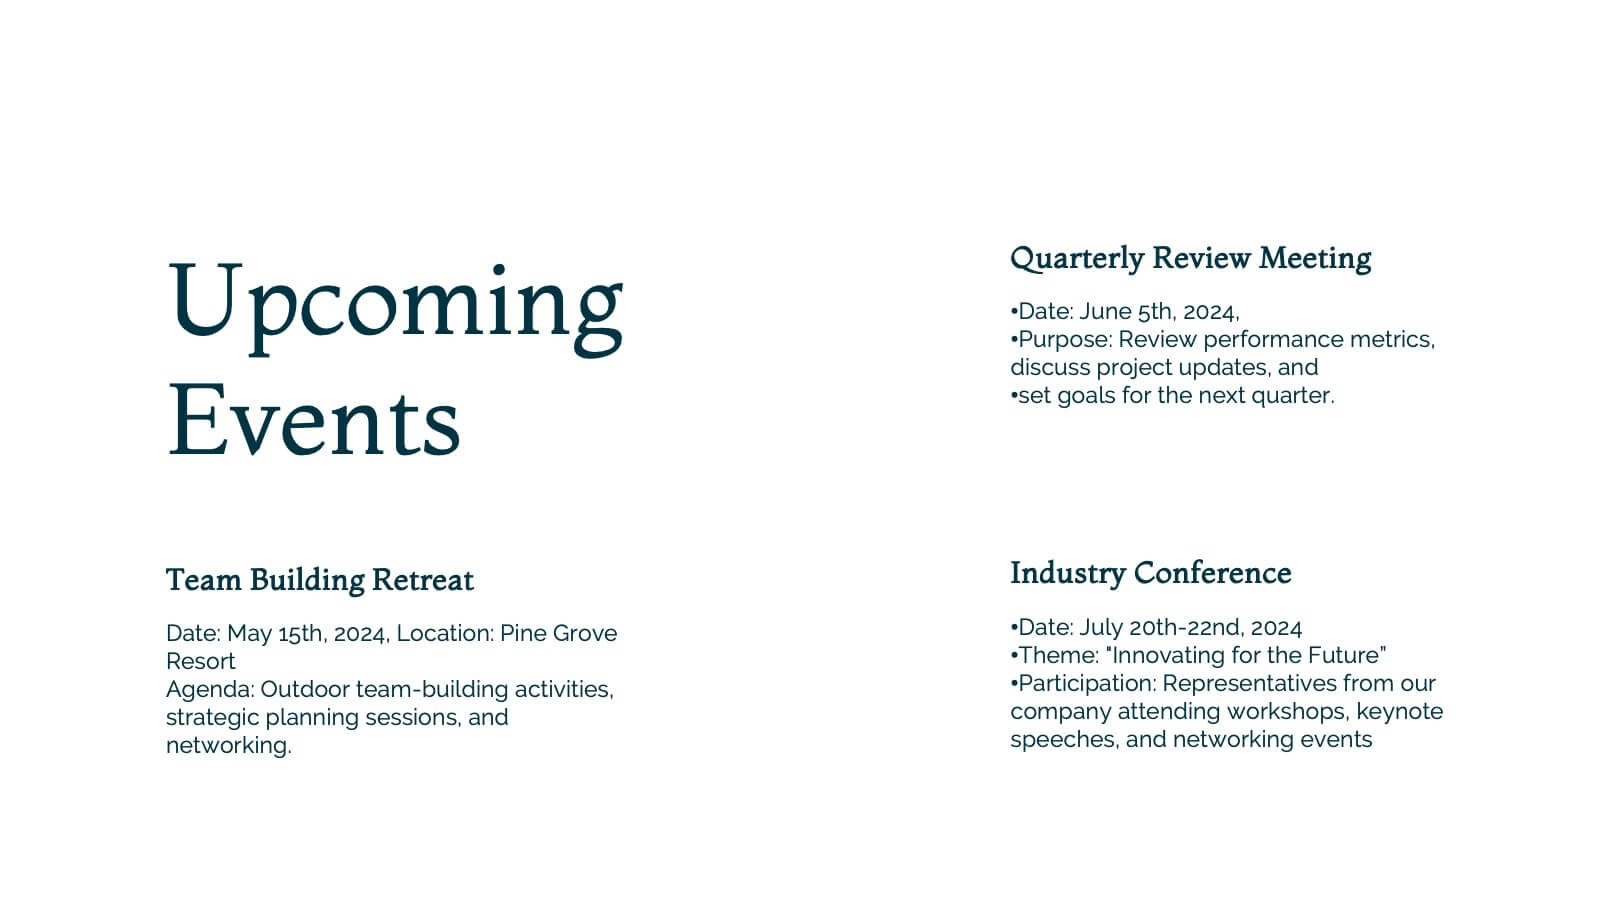
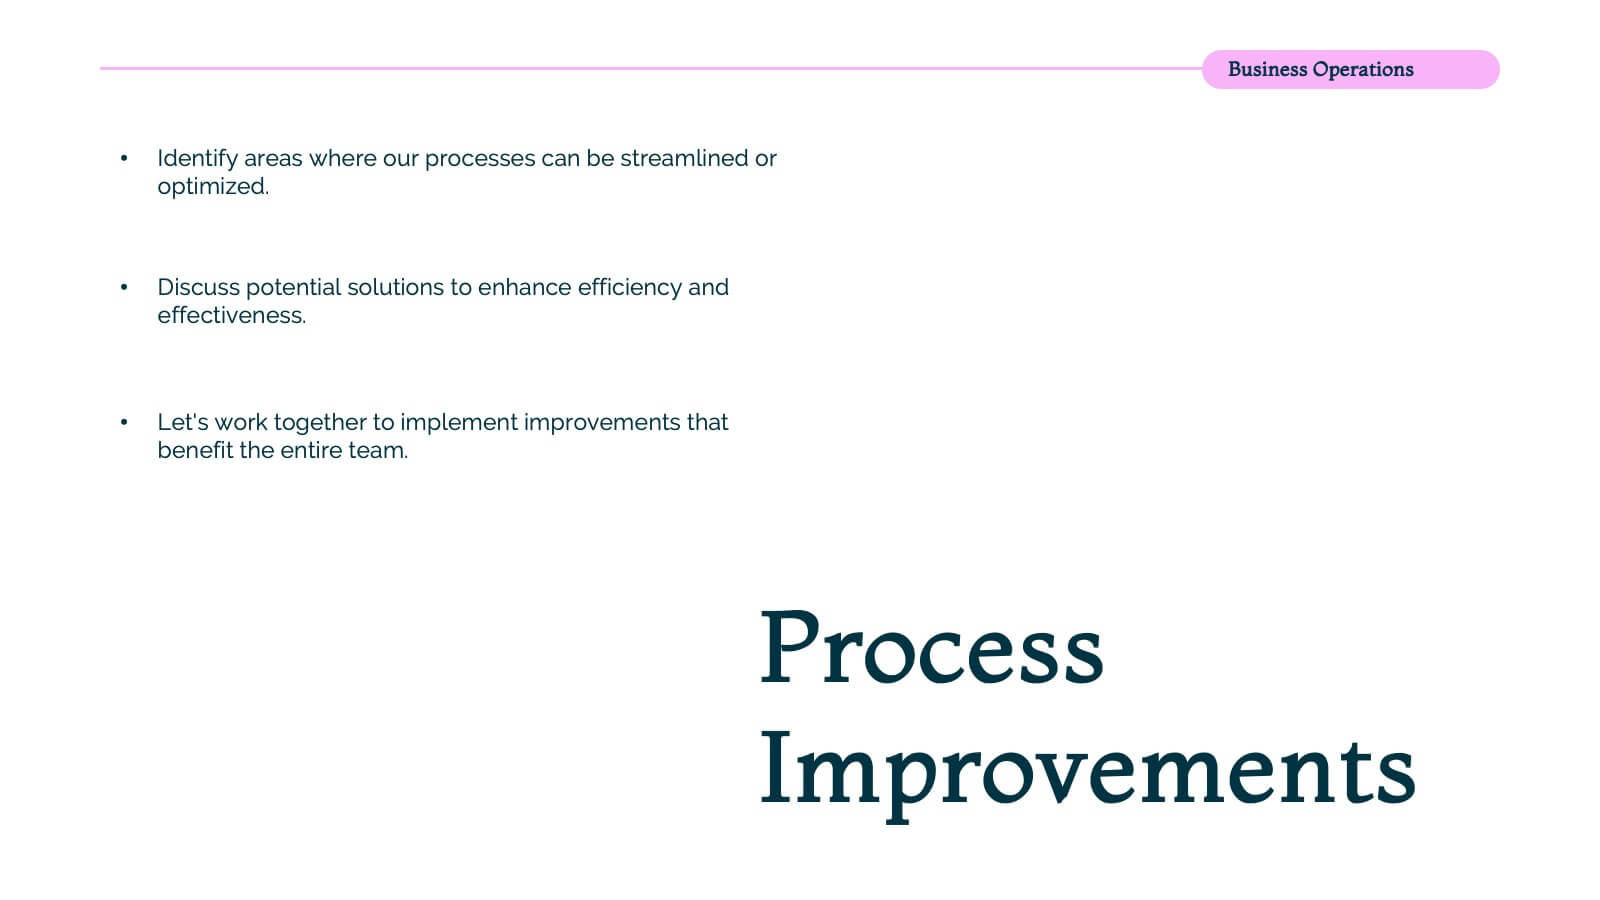
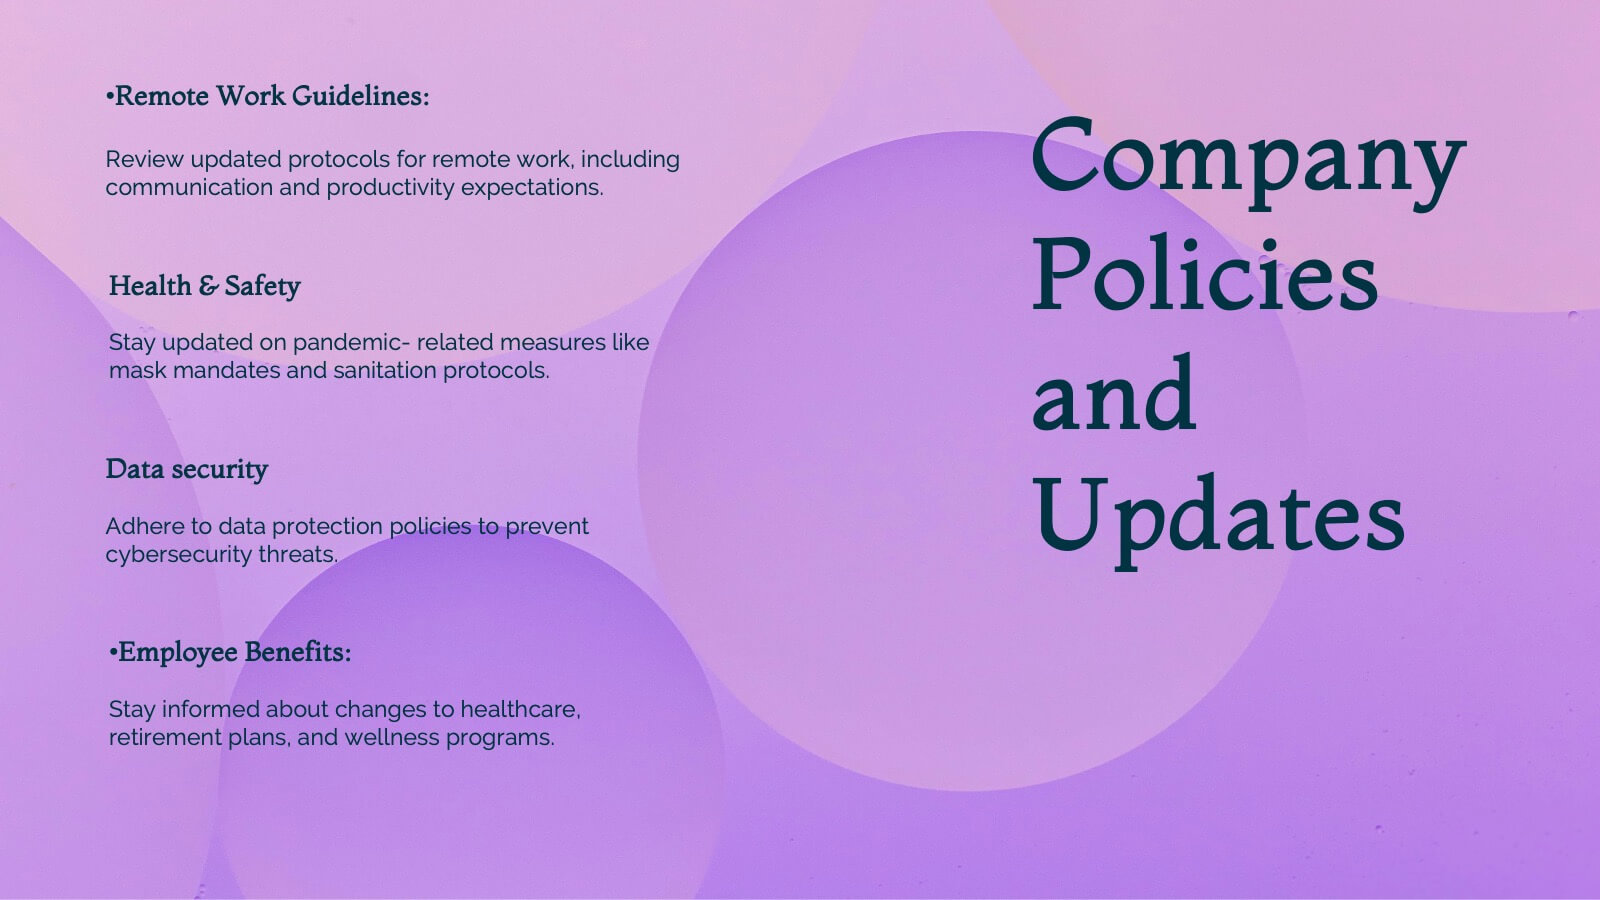
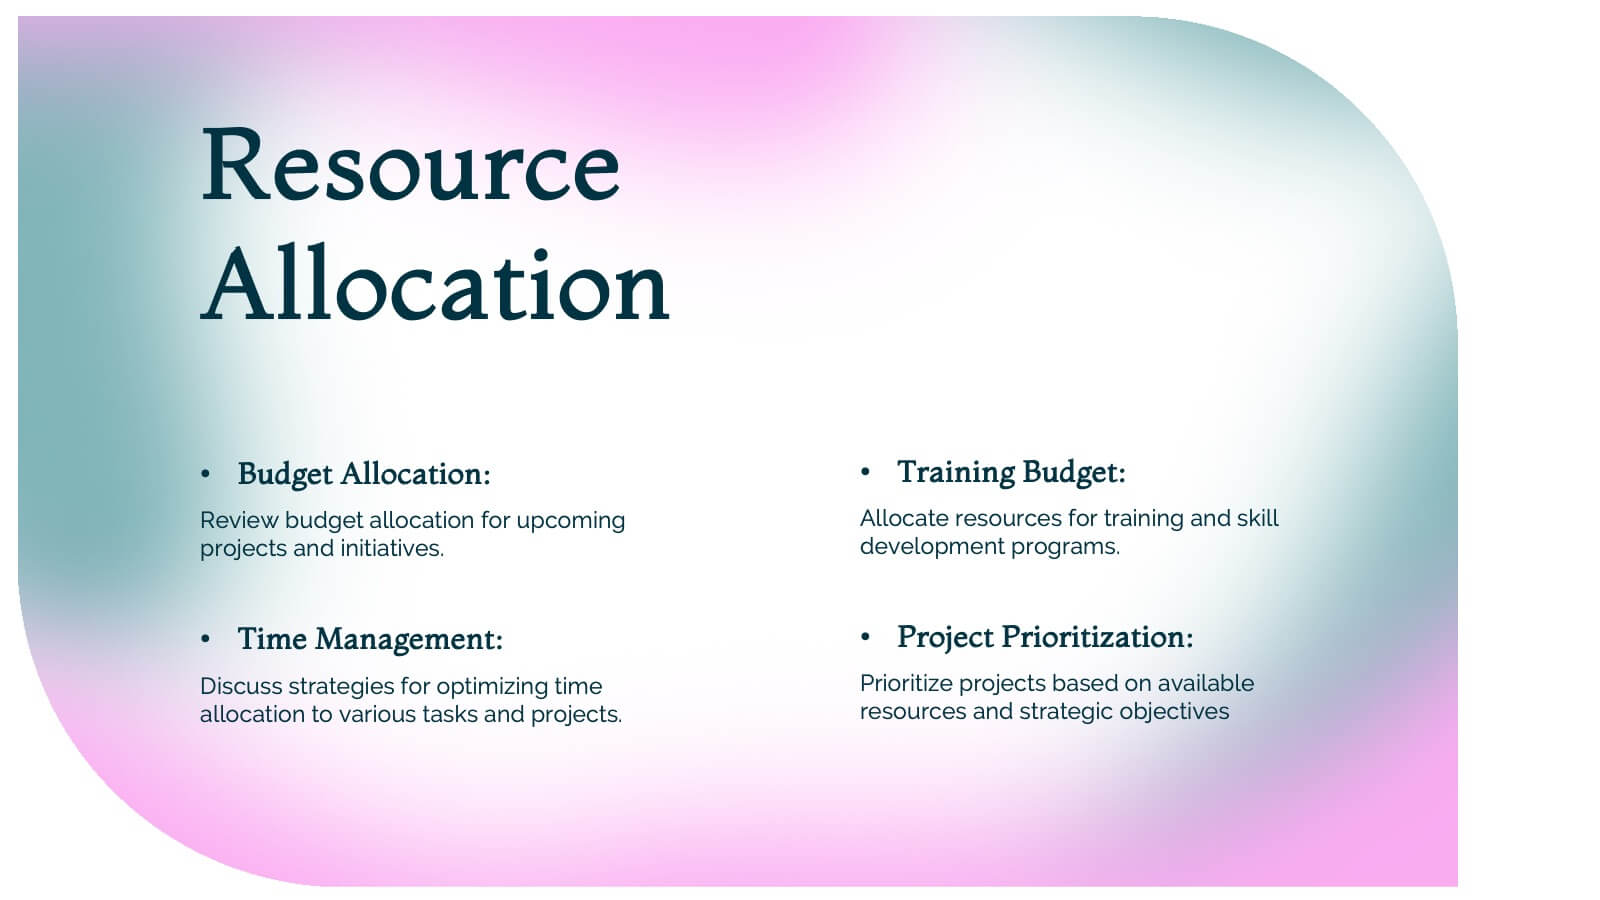
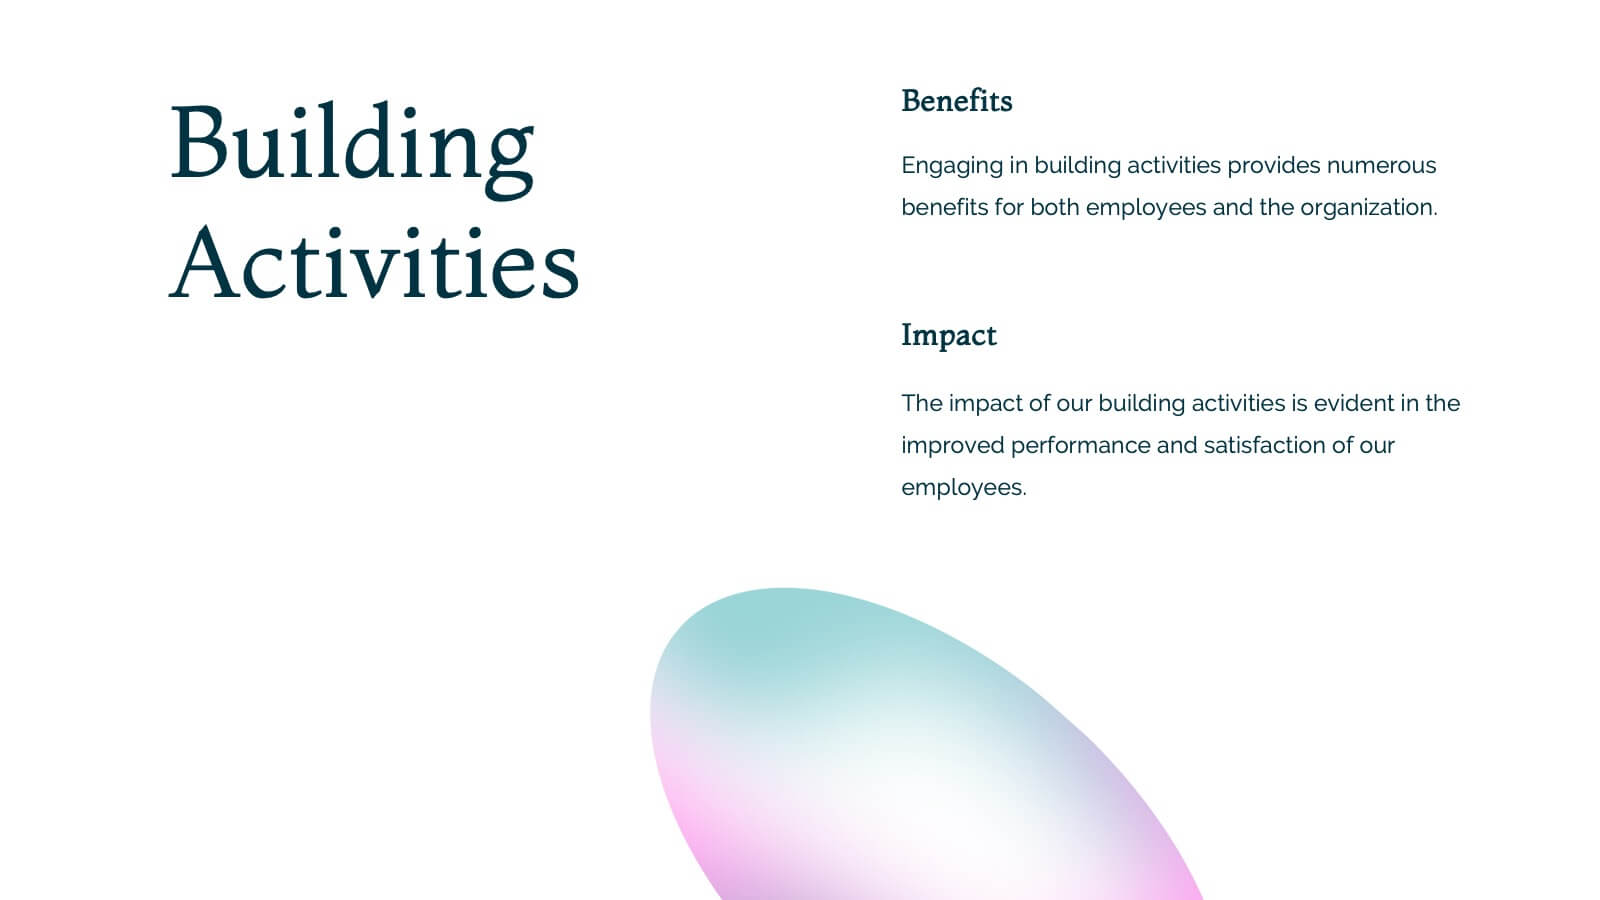
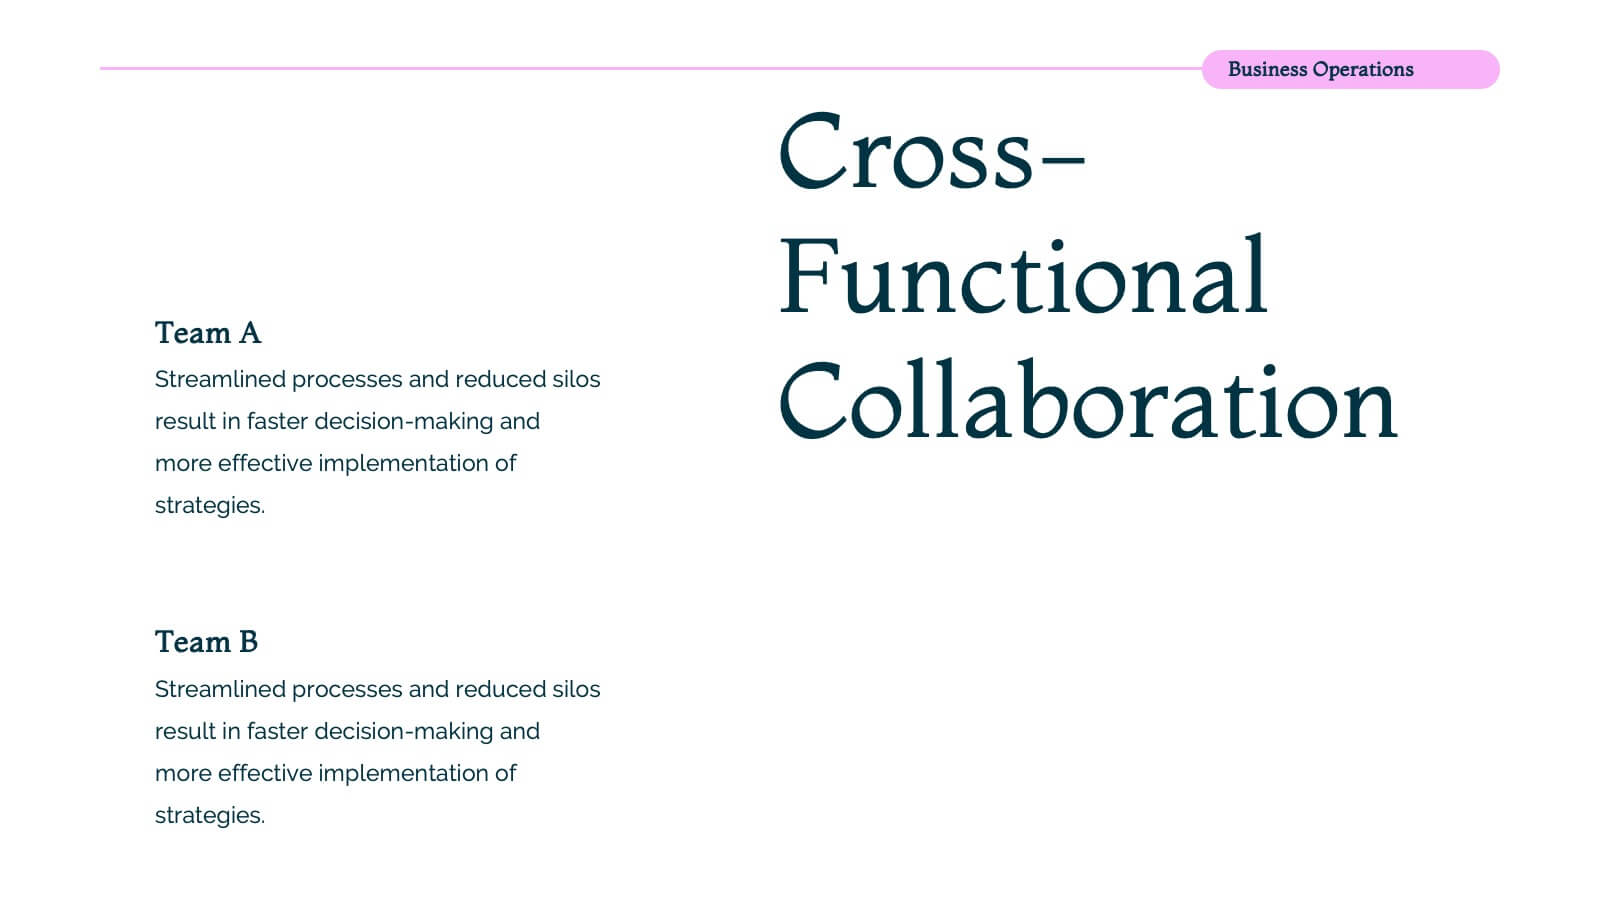
Nova Business Operations Plan Presentation
Create a polished business operations plan with this modern and organized template! It covers everything from team updates and project overviews to resource allocation and collaboration opportunities. Perfect for structuring departmental goals, process improvements, and employee recognition. Compatible with PowerPoint, Keynote, and Google Slides for a seamless, professional presentation.


6 diapositivas
Effective Time Management Strategie Presentation
Make the most of your hours with this sharp and creative visual layout designed to organize your time-saving game plan. This template highlights key time management strategies, helping you structure priorities and boost daily efficiency. Fully customizable and easy to edit in PowerPoint, Keynote, and Google Slides for seamless presentation use.


5 diapositivas
Root Cause Analysis Fishbone Slide Presentation
Give your problem-solving sessions a fresh visual spark with a tree-style diagram that makes tracing causes feel clear and intuitive. This presentation helps you break down issues, organize insights, and present findings with clean, structured flow. Perfect for teams and workshops. Fully compatible with PowerPoint, Keynote, and Google Slides.


15 diapositivas
Business Proposal Infographic
A business proposal is a formal document that outlines a specific business endeavor, project, or venture, and presents a persuasive argument for why the proposed approach or solution is viable and advantageous. This infographic template is a tool for the business world to communicate business ideas, pitch a product or service, secure funding or partnerships, or enter into a business agreement. Fully customizable and compatible with Powerpoint, Keynote, and Google Slides. Showcase your unique value proposition and unveil how it fuels your journey to success. Energize your business propositions and set the stage for success!


28 diapositivas
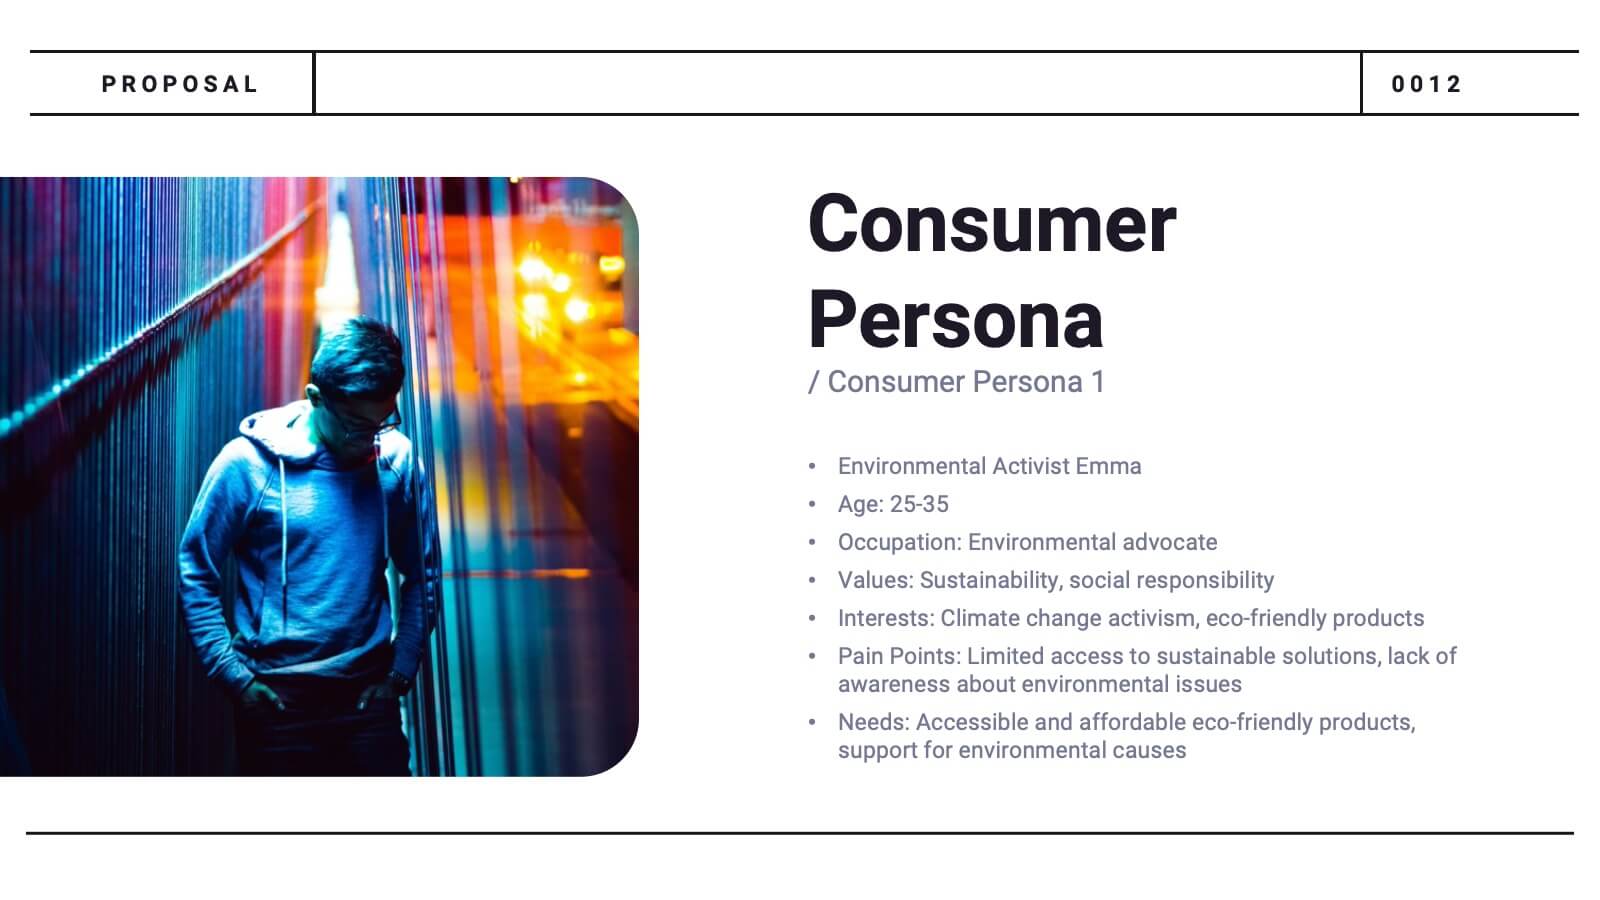
Glowspire Brand Guidelines Proposal Presentation
This brand identity template covers essential components: logo, imagery, color, typography, and voice & tone. It includes slides for consumer persona, market analysis, USP, brand positioning, and strategy. Ideal for establishing a cohesive brand, it highlights brand touchpoints across digital, print, packaging, and advertising mediums. Customizable for various platforms.


6 diapositivas
Company Heritage and Legacy Timeline Presentation
Chronicle your business milestones with this modern timeline presentation. Featuring a horizontal layout with photo placeholders and color-coded markers, this design helps visually map your company’s history. Perfect for brand storytelling, anniversaries, or executive reports. Fully customizable in PowerPoint, Keynote, and Google Slides for seamless editing and branding.


7 diapositivas
Relationship Connectivity Infographic
The Relationship Connectivity Infographic provides a structured visualization to represent the interconnectedness of various elements within a system or project. This graphic organizes components into a cohesive layout that highlights how each part is related to and impacts the others. Ideal for demonstrating the complex synergy between different departments, phases of a project, or any scenario requiring a clear display of relationships, this infographic serves as an essential tool for planners, educators, and managers. It is designed to be user-friendly and is compatible with a range of platforms, including PowerPoint, Google Slides, and Keynote, making it easily customizable.


26 diapositivas
Corporate Finance Presentation
The "Corporate Finance" template is your financial compass for presentations that require a mix of precision and clarity. Tailored for use on PowerPoint, Keynote, and Google Slides, it is perfect for demystifying the world of corporate finance. Commence with the "Wealth strategies designed for your unique journey" slide to capture the tailored approach of your financial services. The "Table of Contents" neatly outlines the topics such as investment strategies, risk management, and financial forecasting. Introduce the minds behind the numbers with "Meet Our CEO" and "Meet Our Team" slides. Utilize the "Three Option Slide" to present different financial models, and the "Chart Slide" to depict financial performance. The "Bringing a new perception of investing" slide can redefine investment approaches, while "Feel good with Earning, Feel free to call us." invites engagement. Every slide offers the opportunity to infuse data-driven insights with compelling visuals, ensuring that your "Corporate Finance" presentation not only informs but also impresses your corporate audience.


20 diapositivas
Silverleaf Graphic Design Project Plan Presentation
This Graphic Design Project Plan Presentation Template offers a vibrant and modern design to showcase your creative process, key elements, and strategic goals. It includes sections for design brief, target audience, moodboard, prototypes, and implementation. Ideal for agencies and designers, fully customizable in PowerPoint, Keynote, and Google Slides.


8 diapositivas
Vision-Oriented Goal Roadmap Presentation
Achieve alignment with the Vision-Oriented Goal Roadmap Presentation. Featuring a clear bullseye target and directional arrows, this layout highlights priority goals and action steps. Perfect for strategic planning, leadership briefings, or team objectives. Easily editable in PowerPoint, Keynote, and Google Slides to match your brand and vision.


6 diapositivas
Project Proposal Slide Deck Presentation
Make your next pitch unforgettable with a clean, structured layout that turns complex project ideas into a clear visual story. Ideal for presenting timelines, goals, or performance metrics, it helps you communicate your proposal with confidence and precision. Fully compatible with PowerPoint, Keynote, and Google Slides for effortless editing.


5 diapositivas
Pet Clinic Business Strategy Presentation
Enhance your pet clinic's approach with our Pet Clinic Business Strategy presentation template. This layout is expertly designed to outline your clinic’s key strategies and enhance your operational excellence, making it perfect for meetings, stakeholder presentations, and strategic workshops.