


Características


¿Tienes alguna pregunta?
Recomendar


6 diapositivas
Customer Feedback Smile Rating Scale
Visualize customer satisfaction with this editable Smile Rating Scale Presentation. Featuring five emotive icons, it’s perfect for showcasing feedback, survey results, or performance reviews. Fully customizable in PowerPoint, Keynote, and Google Slides, it simplifies data presentation while adding a friendly, professional touch to your report or presentation.


5 diapositivas
Technology Innovation Infographics
Technology innovation refers to the process of creating and introducing new or improved technologies that have the potential to bring about significant advancements in various industries and sectors. These vertical infographics explores the world of technology innovation and its impact on various industries. These templates are designed to showcase the latest advancements, emerging trends, and transformative technologies that are shaping our digital landscape. These enable you to showcase the transformative power of technology and inspire your audience to embrace the opportunities it presents.


26 diapositivas
Jenna Presentation Template
Want to let your customers know how your services can help with their interior design needs? The Jenna template features attractive images of different room designs, color palettes, services, and lighting concepts that this business can help you with. This presentation uses soft pastel colors and a clean design so that potential clients can focus on the importance of your services. With its eye-catching graphics, informative content, and organized structure, this presentation template will engage and inspire your audience as you present your ideas for creating beautiful, functional interior spaces.


22 diapositivas
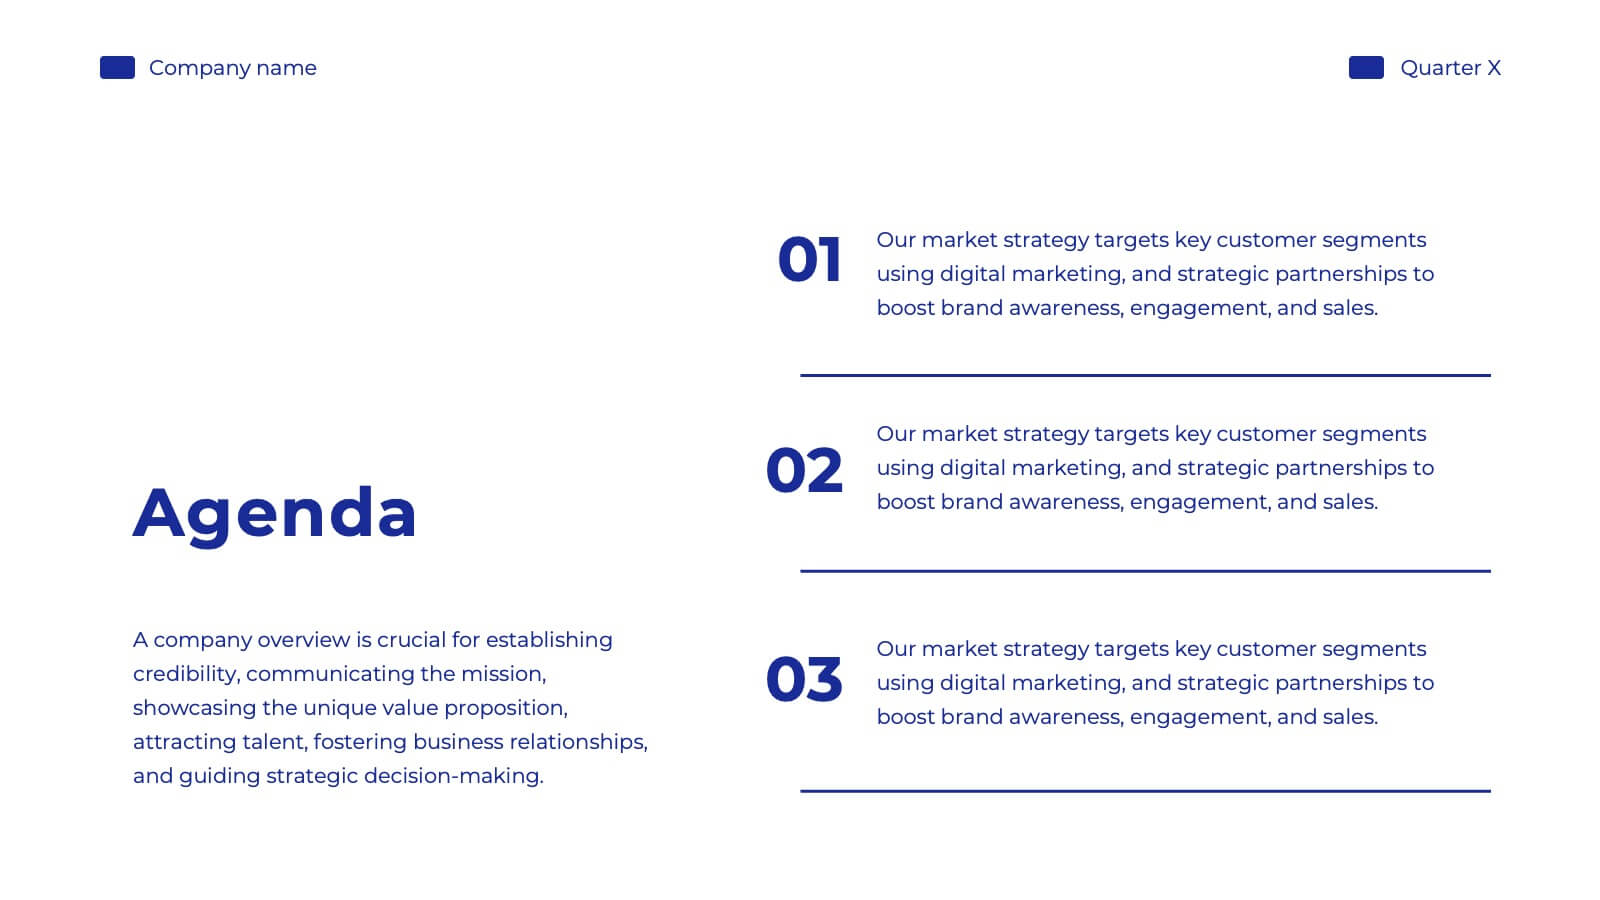
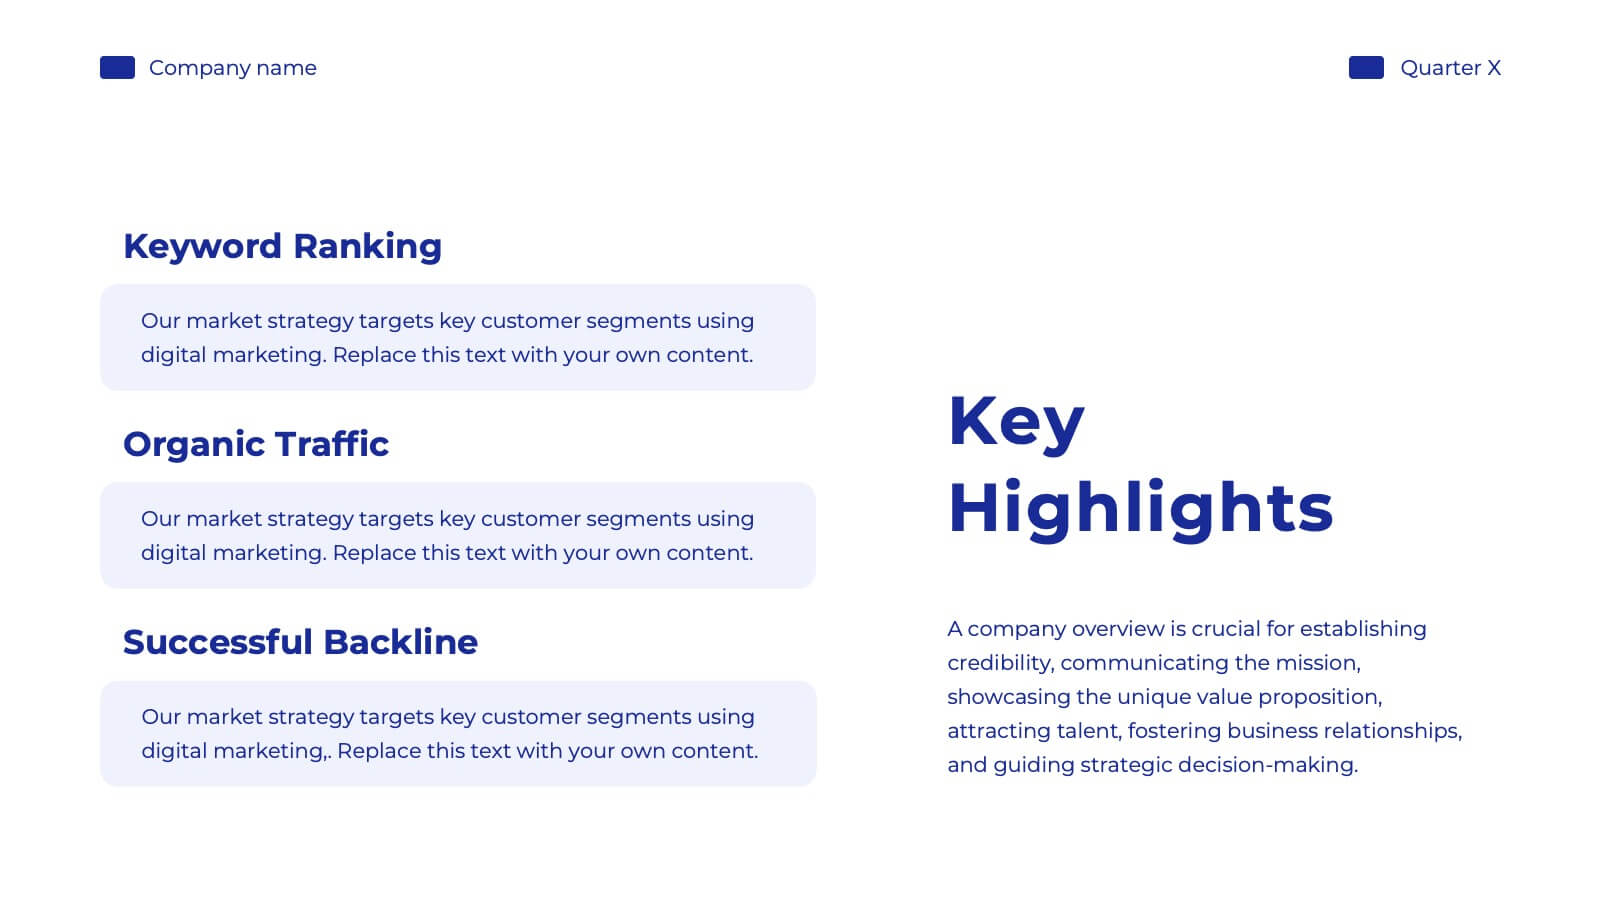
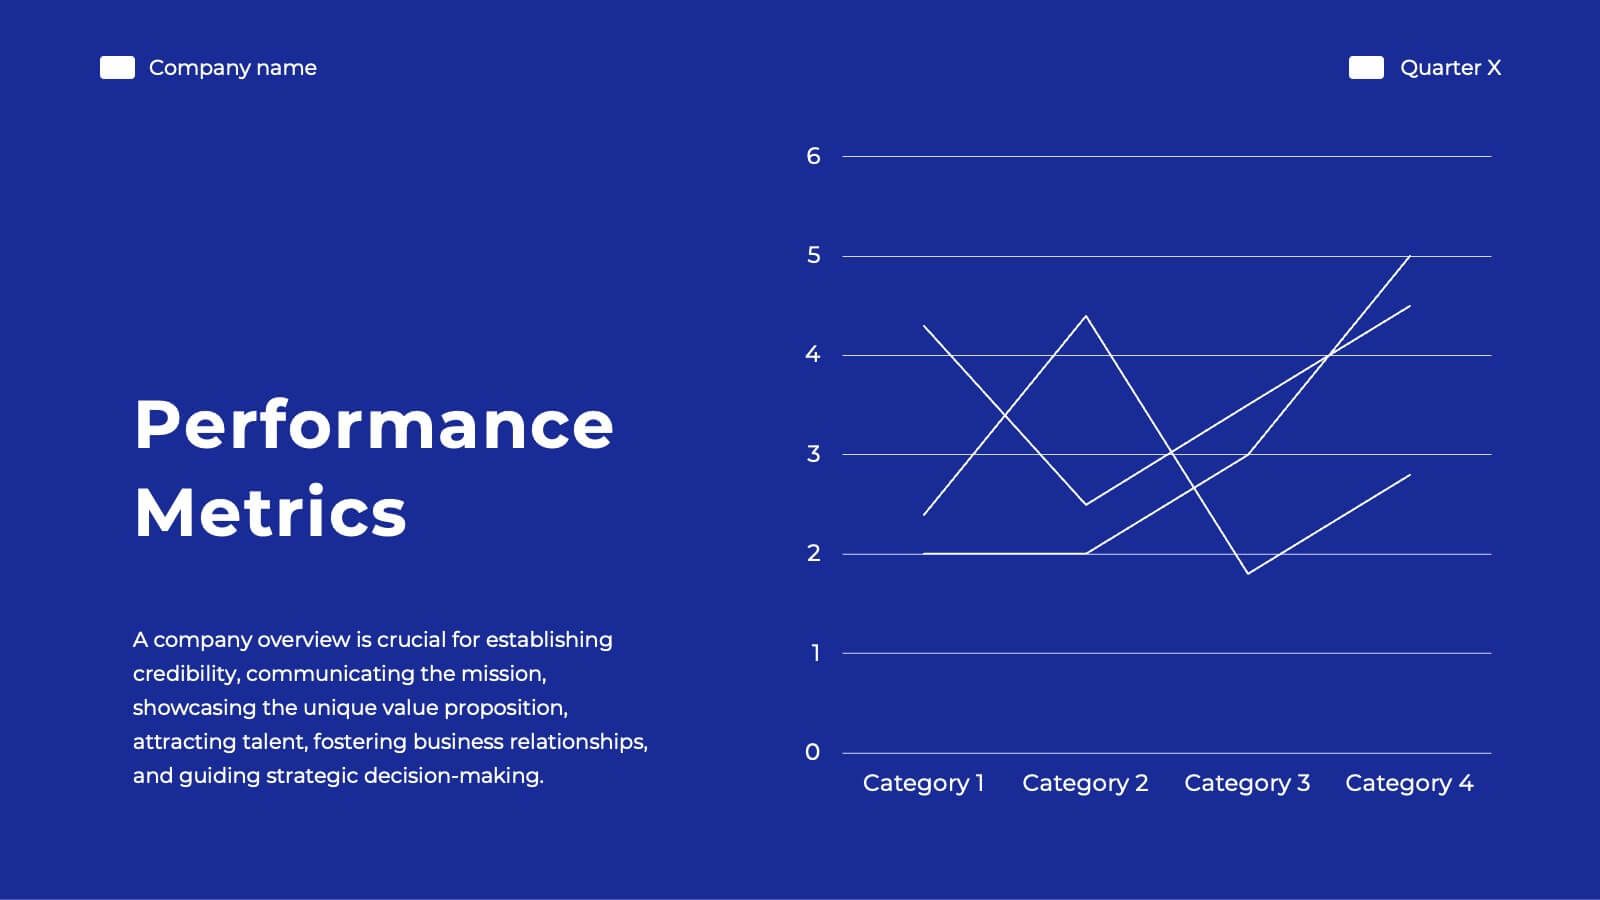
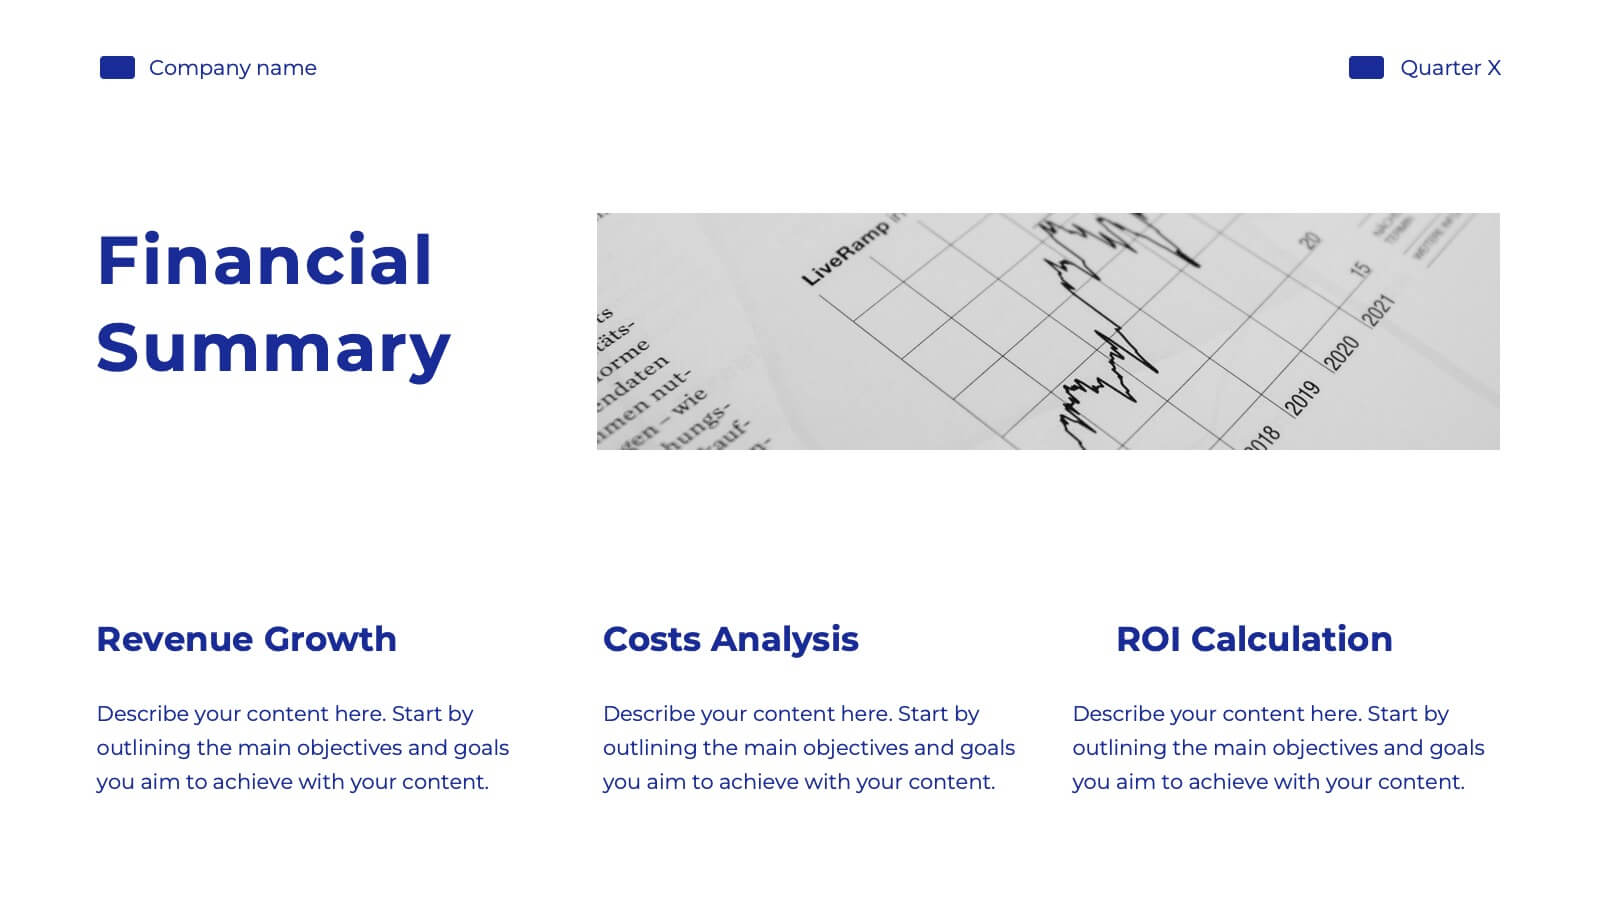
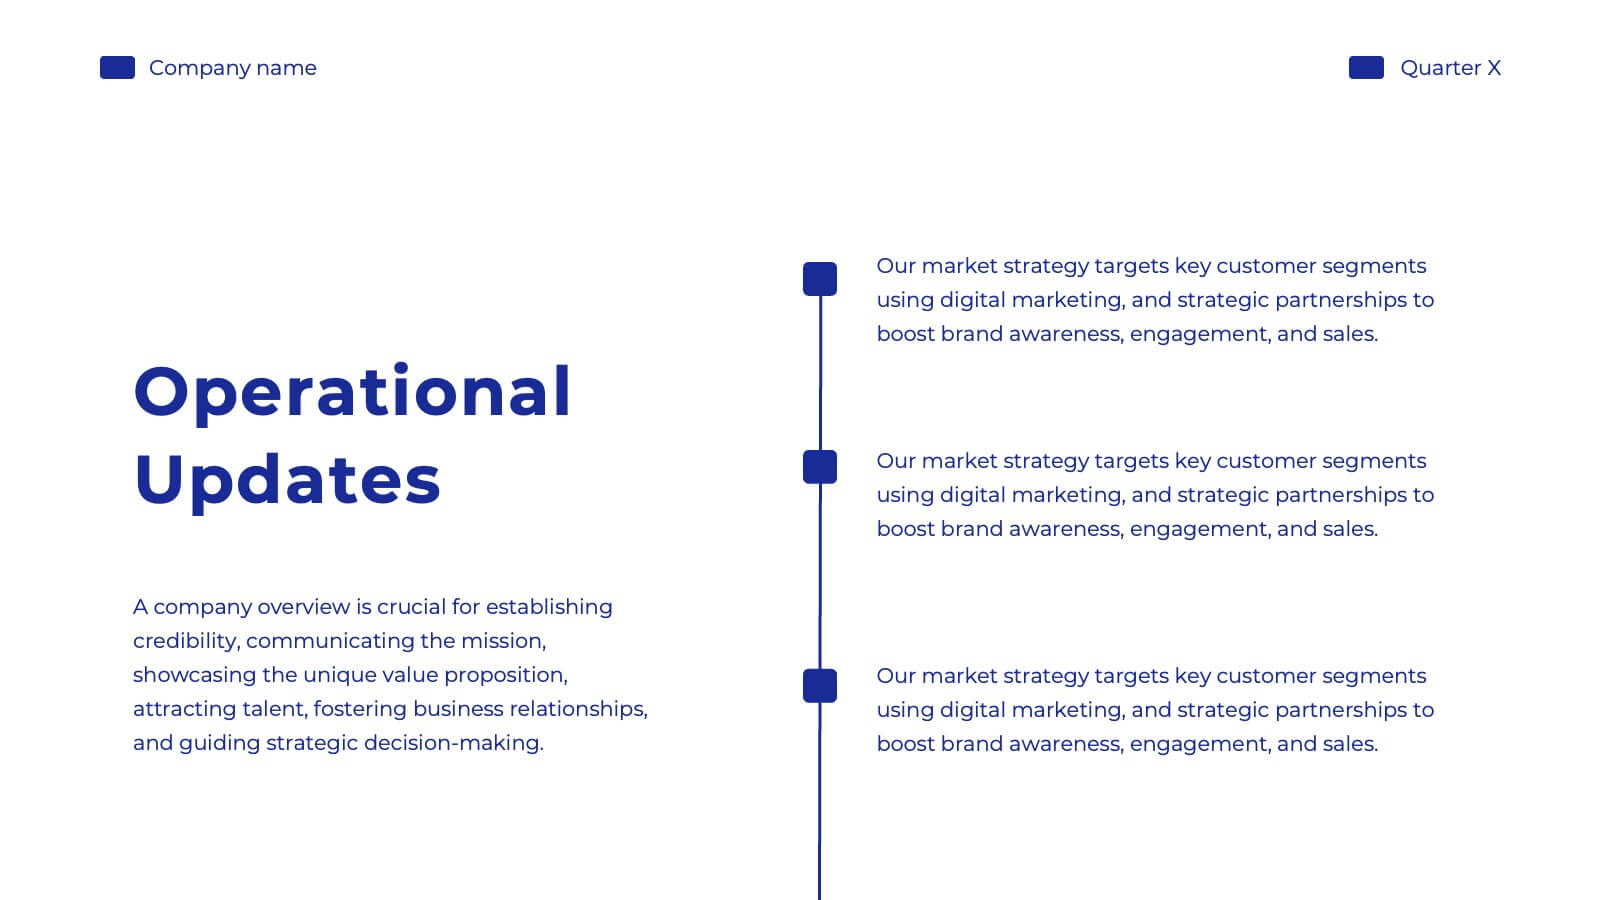
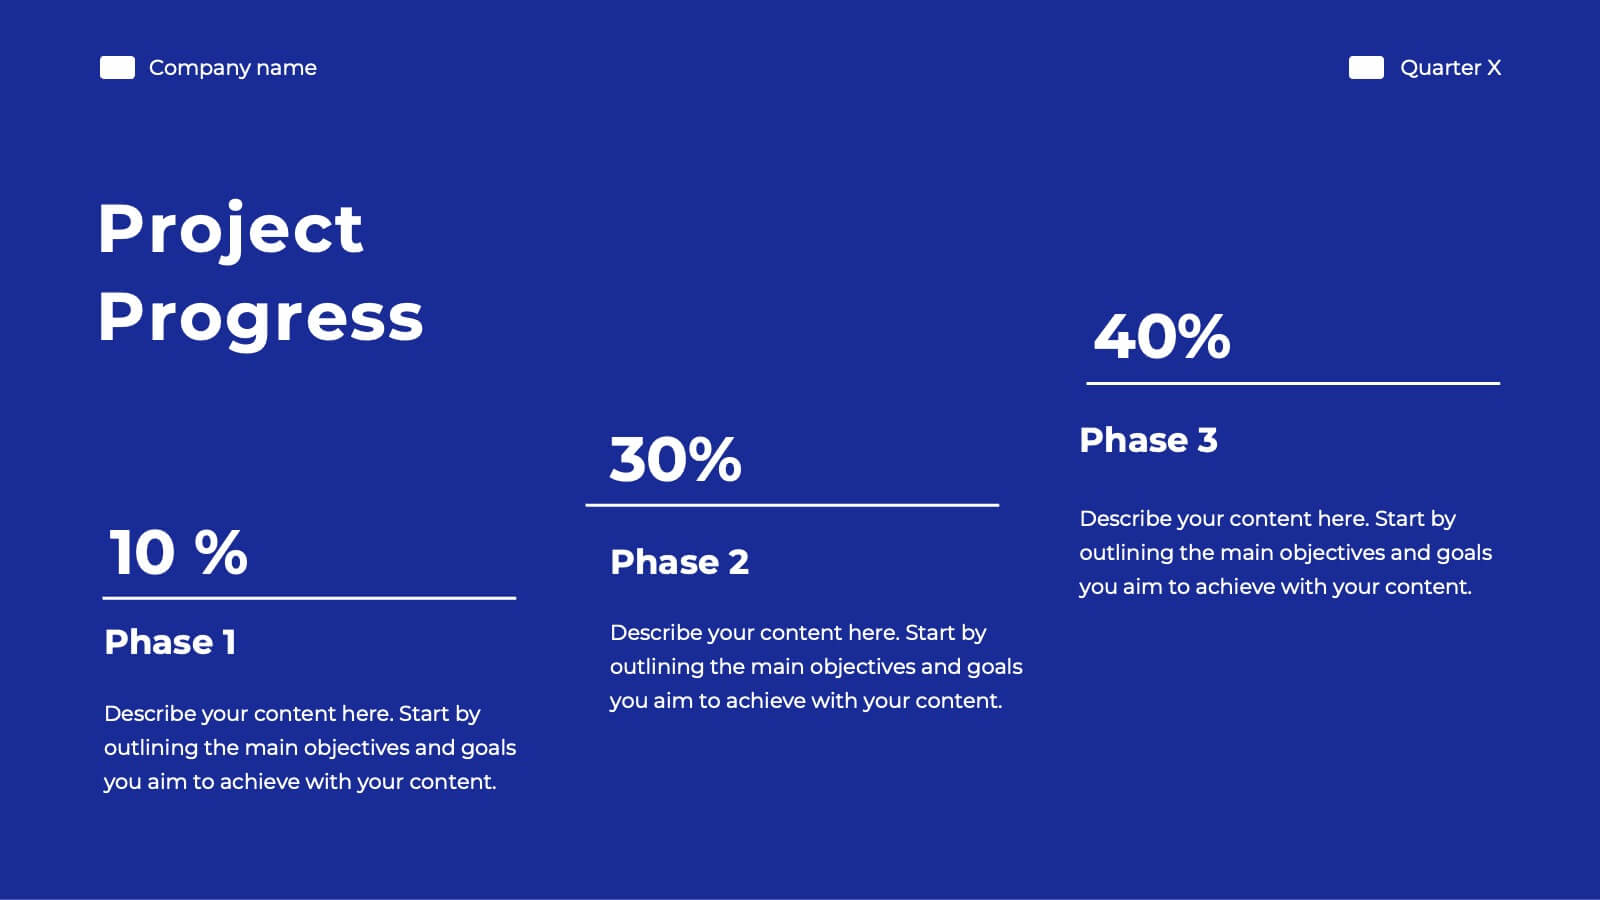
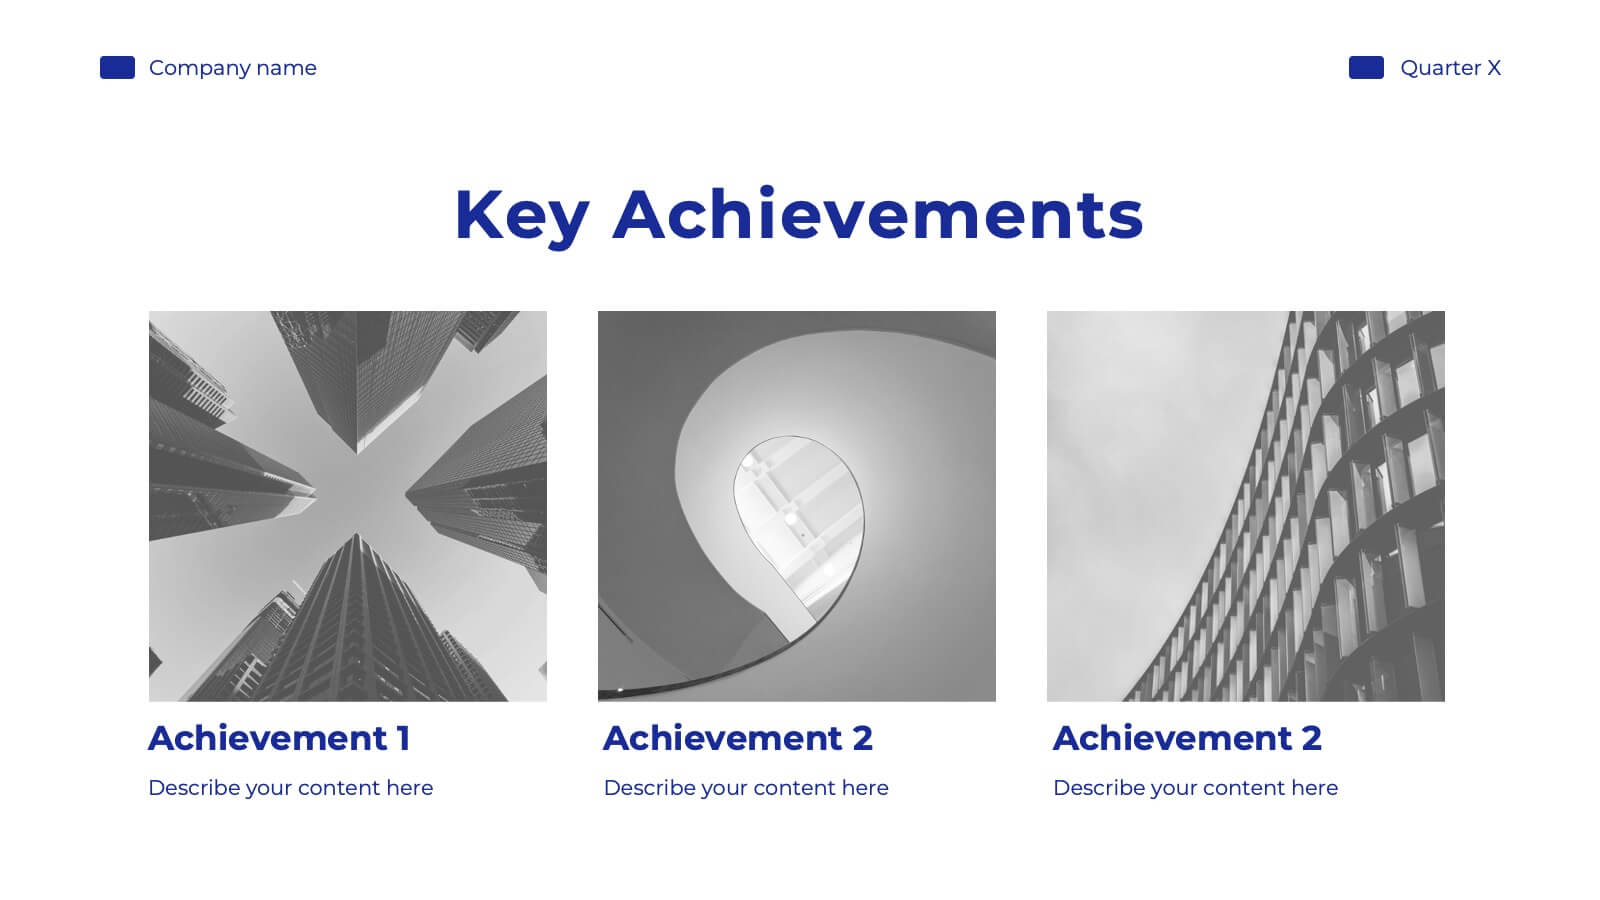
Frost Financial Report Presentation
Transform your brand with this comprehensive rebranding project template! Perfect for presenting brand identity, market analysis, and strategic positioning, it includes slides for logos, color palettes, and brand guidelines. Engage your audience with visually striking designs and detailed content. Compatible with PowerPoint, Keynote, and Google Slides for easy, professional presentations on any platform.


7 diapositivas
Europe Map Infographic Presentation Template
Europe is a continent located in the northern part of the globe and surrounded by water on three sides. It is bordered by the Atlantic Ocean to the west, the Arctic Ocean to the north, and the Mediterranean Sea to the south. Europe is divided into roughly forty four countries and dependent territories, each one with its own unique identity, cuisine and culture. This European map template is a vector map of an outline of Europe, with color-coded and labeled countries and a legend. This map template can be used for presentations, reports and blogs about tourism it's a simple and clean style map.


5 diapositivas
Business Plan Infographics
Elevate your strategic approach with the business plan infographics template. Cast in the motivational hues of orange, purple, and green, this template breathes life into your business strategy, illustrating your plan's potential. Entrepreneurs and corporate strategists will find this creative, vertical-style infographic an invaluable ally in conveying complex business plans with simplicity and visual flair. Compatible with Powerpoint, Keynote, and Google Slides. This dynamic template comes complete with innovative graphics, thematic icons, and designated image placeholders, all fashioned to articulate your business journey. Utilize this tool to captivate your audience.


4 diapositivas
Lifecycle Strategy for Product Management Presentation
Present the complete journey of a product with clarity using the Lifecycle Strategy for Product Management presentation. This slide illustrates each phase—Introduction, Growth, Maturity, and Decline—along a progressive path, making it ideal for showcasing product timelines, strategic decisions, and forecasting. Each stage includes editable icons and text for easy customization. Fully compatible with PowerPoint, Keynote, and Google Slides.


7 diapositivas
North America Language Map Infographic
Embark on a visual odyssey across the vast terrains of North America with our expertly crafted map infographic. Painted in the expansive blue, the lush green, the vibrant yellow, and the warm orange, our template captures the essence of North America's diverse geographies and cultures. Adorned with accurate infographics, distinct icons, and region-specific image placeholders, it provides a panoramic view of the continent's multifaceted landscape. Flawlessly tailored for Powerpoint, Keynote, or Google Slides. An indispensable tool for educators, travelers, geographers, or businesses targeting the North American market. Navigate with purpose; let every slide be a step into North America's captivating expanse.


5 diapositivas
Perspective of Economic Trends in Africa Map Presentation
Visualize key economic insights across Africa with this data-driven map layout. Use labeled progress bars and highlighted countries to present regional performance, sector growth, or market distribution. Fully editable in PowerPoint, Keynote, or Google Slides, this clean template is ideal for business reports, financial reviews, and investment-focused presentations.


5 diapositivas
Hierarchical Structure in Triangle Format Presentation
Clearly illustrate levels of authority or stages of growth with the Hierarchical Structure in Triangle Format Presentation. This layout features a visually stacked triangle with color-coded segments, each layer representing a tier or level of information. Ideal for organizational charts, value pyramids, or priority structures. Each section includes a title, icon, and description area to keep your message clear and impactful. Fully editable in PowerPoint, Keynote, and Google Slides.
6 diapositivas
Task Tracking and Milestone Gantt Overview Presentation
Stay on top of weekly progress with this Task Tracking and Milestone Gantt Overview presentation. Ideal for project managers and teams, it clearly maps tasks by week with visual progress bars and milestone icons. Easily customizable in Canva, PowerPoint, and Google Slides to align with your project timelines and goals.


6 diapositivas
Clarifying Questions and Response Slide Presentation
Help your audience follow complex topics with the Clarifying Questions and Response Slide Presentation. Designed around a bold question mark layout, this slide format highlights five key clarifications or FAQs alongside thoughtful responses. Ideal for training, onboarding, or product demos, it enhances understanding and engagement. Fully editable in Canva, PowerPoint, Keynote, and Google Slides.


6 diapositivas
Progressive Insurance Infographics
Explore Progressive Insurance with our customizable infographic template. This template is fully compatible with popular presentation software like PowerPoint, Keynote, and Google Slides, allowing you to easily customize it to showcase various aspects of Progressive Insurance, its services, and achievements. The Progressive Insurance infographic template offers a visually engaging platform to highlight the company's history, insurance offerings, customer satisfaction, and industry leadership. Whether you're an insurance professional, a potential customer, or a financial analyst, this template provides a user-friendly canvas to create informative presentations and educational materials about Progressive Insurance. Learn more about Progressive Insurance with this SEO-optimized infographic template, thoughtfully designed for clarity and ease of use. Customize it to showcase Progressive's unique features, coverage options, and innovations, making it a valuable resource for sharing information about the company with your audience. Start crafting your personalized infographic today to explore the world of Progressive Insurance.


6 diapositivas
Communication Plan Infographic
A communication plan is a strategic document that outlines how an organization or project team intends to communicate with various stakeholders. This infographic template is designed with a structured approach to deliver consistent and effective messages to ensure that all viewers are informed, engaged, and aligned. This template outlines the strategies and tactics for effectively conveying information within an organization or to a target audience. Compatible with Powerpoint, Keynote, and Google Slides. This serves as a quick reference guide for effective communication strategies and help your audience understand the key elements of your plan.


6 diapositivas
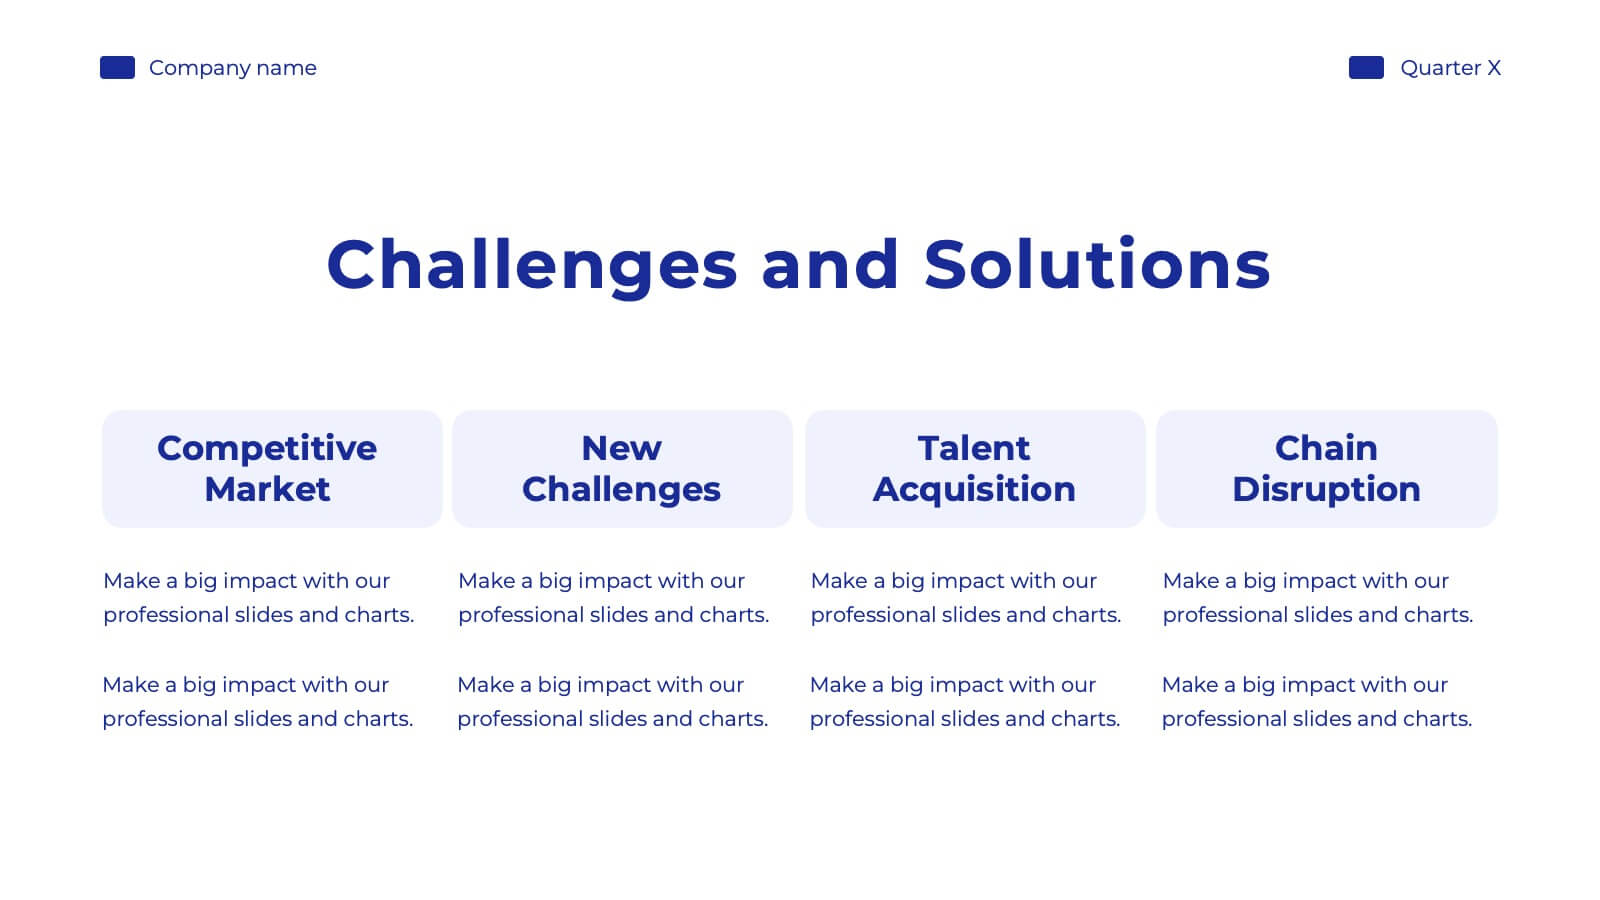
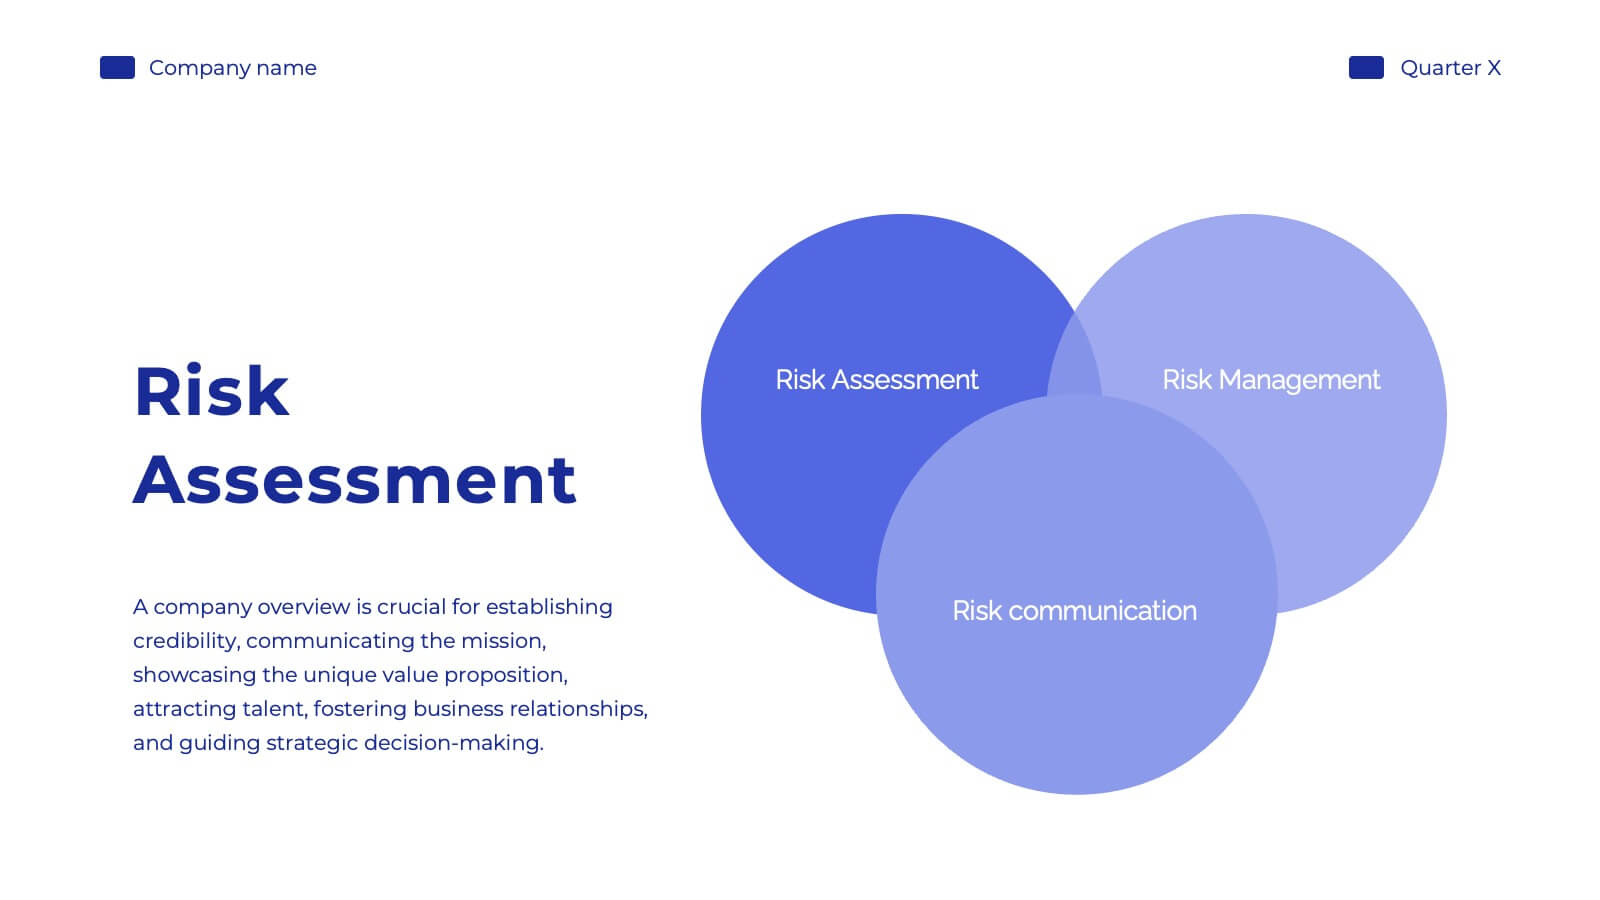
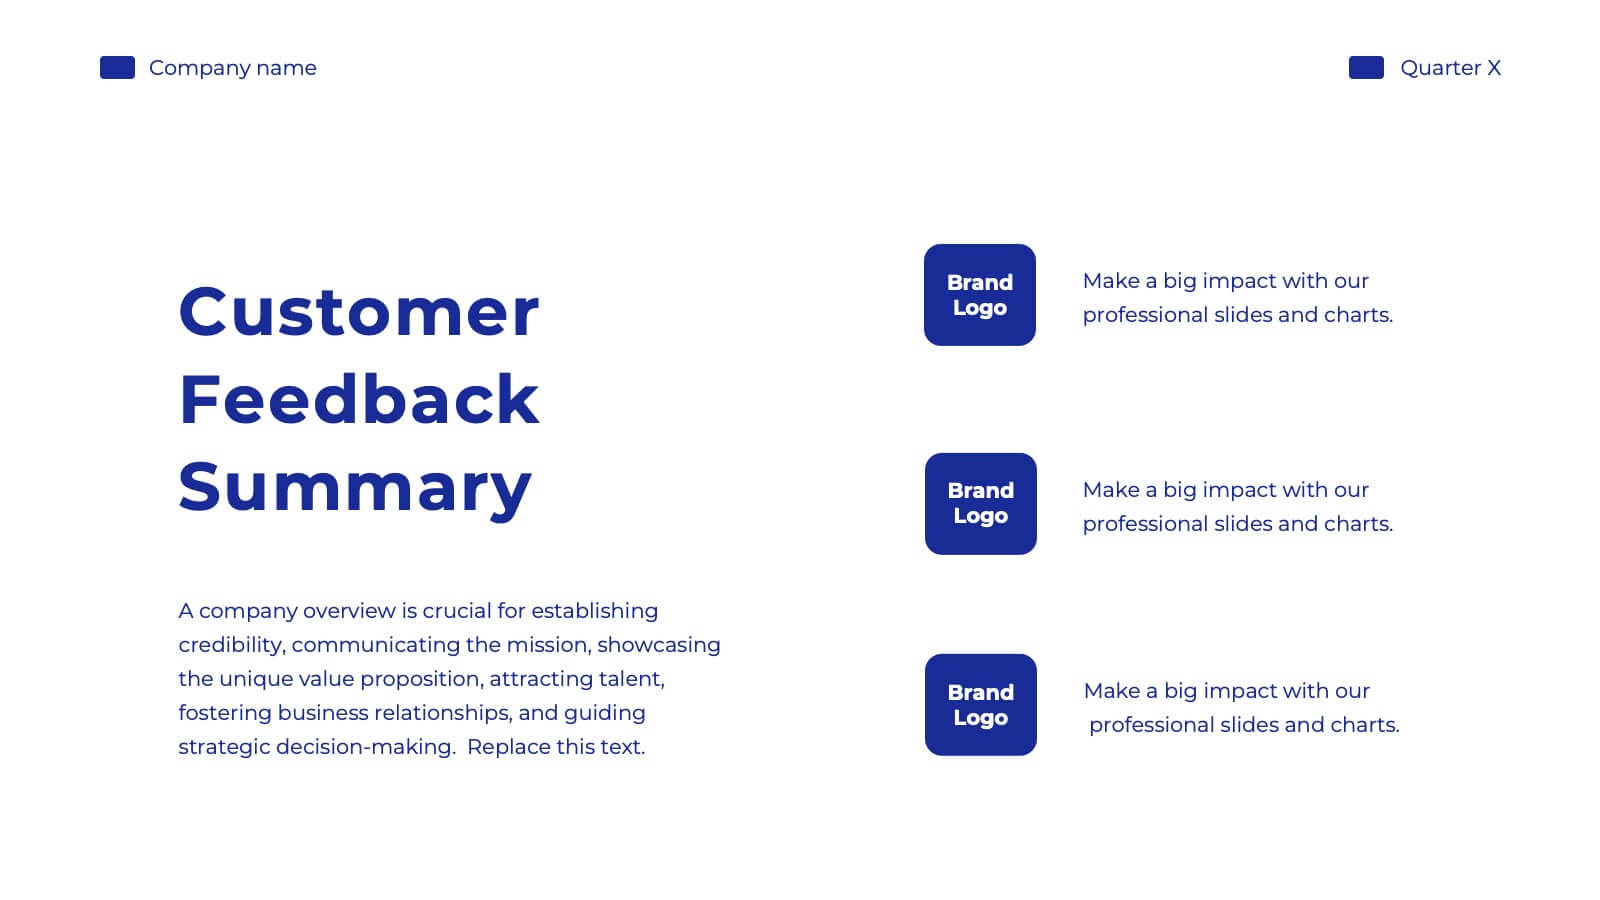
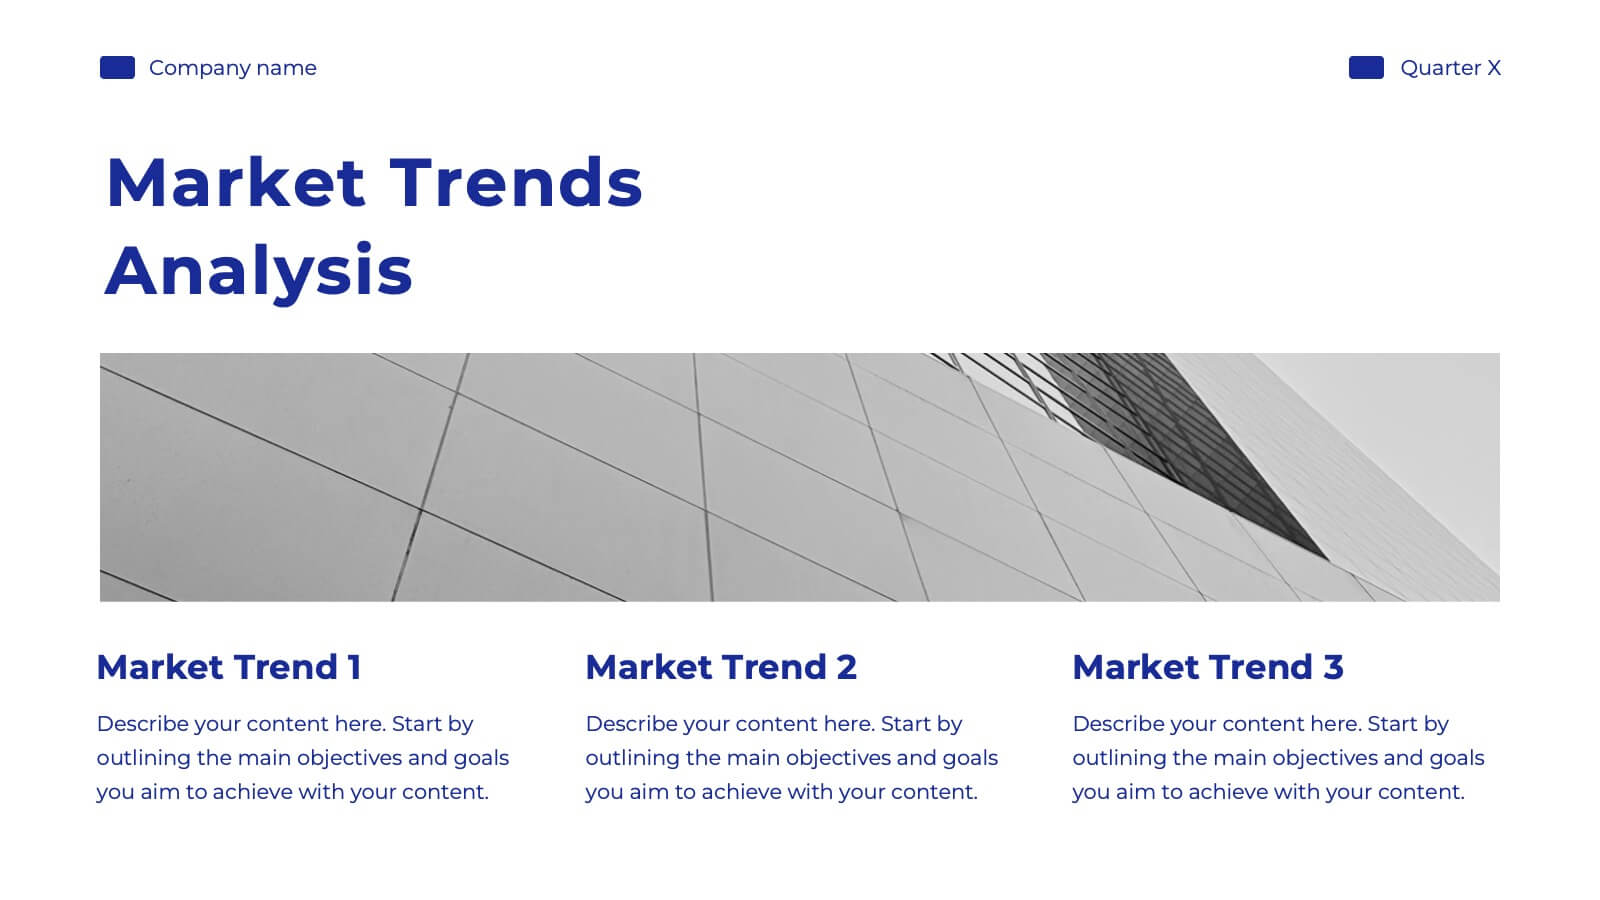
Business Framework Strategy Presentation
Dive into strategic planning with our Business Framework Strategy presentation template. This design brilliantly visualizes the essentials of business frameworks, guiding users through critical insights with a visually appealing, color-coded process. Ideal for strategists and planners, it offers a streamlined way to present complex information effectively. Compatible with PowerPoint, Keynote, and Google Slides, this template is a versatile tool for delivering impactful business strategies.


4 diapositivas
Remote Learning Classroom Engagement Presentation
Make virtual classrooms more engaging with this clear, conversation-inspired visual. Designed for educators, trainers, and e-learning professionals, this infographic helps highlight interaction points, participation levels, or communication flows in remote learning. Easy to customize and fully compatible with PowerPoint, Keynote, and Google Slides.


21 diapositivas
Phoenix Design Portfolio Presentation
Elevate your design presentations with this stylish, contemporary template. Perfect for showcasing design portfolios, concept development, and project timelines, it features a modern layout with vibrant colors. Highlight key elements like color palettes, textures, and design processes to captivate your audience. Compatible with PowerPoint, Keynote, and Google Slides, it ensures seamless presentations on any platform.