


Características


¿Tienes alguna pregunta?
Recomendar


5 diapositivas
Smart Decision Making Models Presentation
Make complex choices simple with this modern and colorful template designed to visualize analytical thinking and structured planning. Ideal for presenting frameworks, strategies, or goal-setting models, it helps communicate logic and clarity effectively. Fully compatible with PowerPoint, Keynote, and Google Slides for smooth customization and presentation delivery.


4 diapositivas
Device Mockup Display Slide Presentation
Showcase your digital products with this device mockup slide. Ideal for highlighting landing pages, dashboards, or app interfaces, the layout includes clean typography and vibrant shapes for visual balance. Fully editable in PowerPoint, Keynote, and Google Slides—customize text, colors, and images to fit your tech brand or presentation style.


7 diapositivas
Real Estate Companies Infographic
Real estate companies are organizations that engage in various aspects of the real estate industry, which involves the buying, selling, managing, or investing in properties. Creating an infographic about real estate companies can be a great way to showcase key information, trends, and benefits of various real estate firms. Customize the content, design, and visuals to create an engaging and informative infographic that provides insights into the real estate industry and the leading companies within it. Real estate is a dynamic field, and your infographic can serve as a valuable resource for potential clients and investors.


5 diapositivas
International Reach World Map Presentation
Bring your global story to life with a clean, modern layout that highlights key regions and data points in a visually engaging way. This presentation helps you showcase international impact, market presence, or worldwide performance with clarity and confidence. Fully compatible with PowerPoint, Keynote, and Google Slides.


2 diapositivas
Small Business Success Illustrations
Get your business on the right track with our small business success illustrations pack! These illustrations will help you with your next business presentation and make it more engaging and catchy. Fully compatible with Powerpoint, Keynote, and Google Slides. You can use these in your website, blog or social media posts. Turn your vision into a reality—download the small business success illustrations pack today!


20 diapositivas
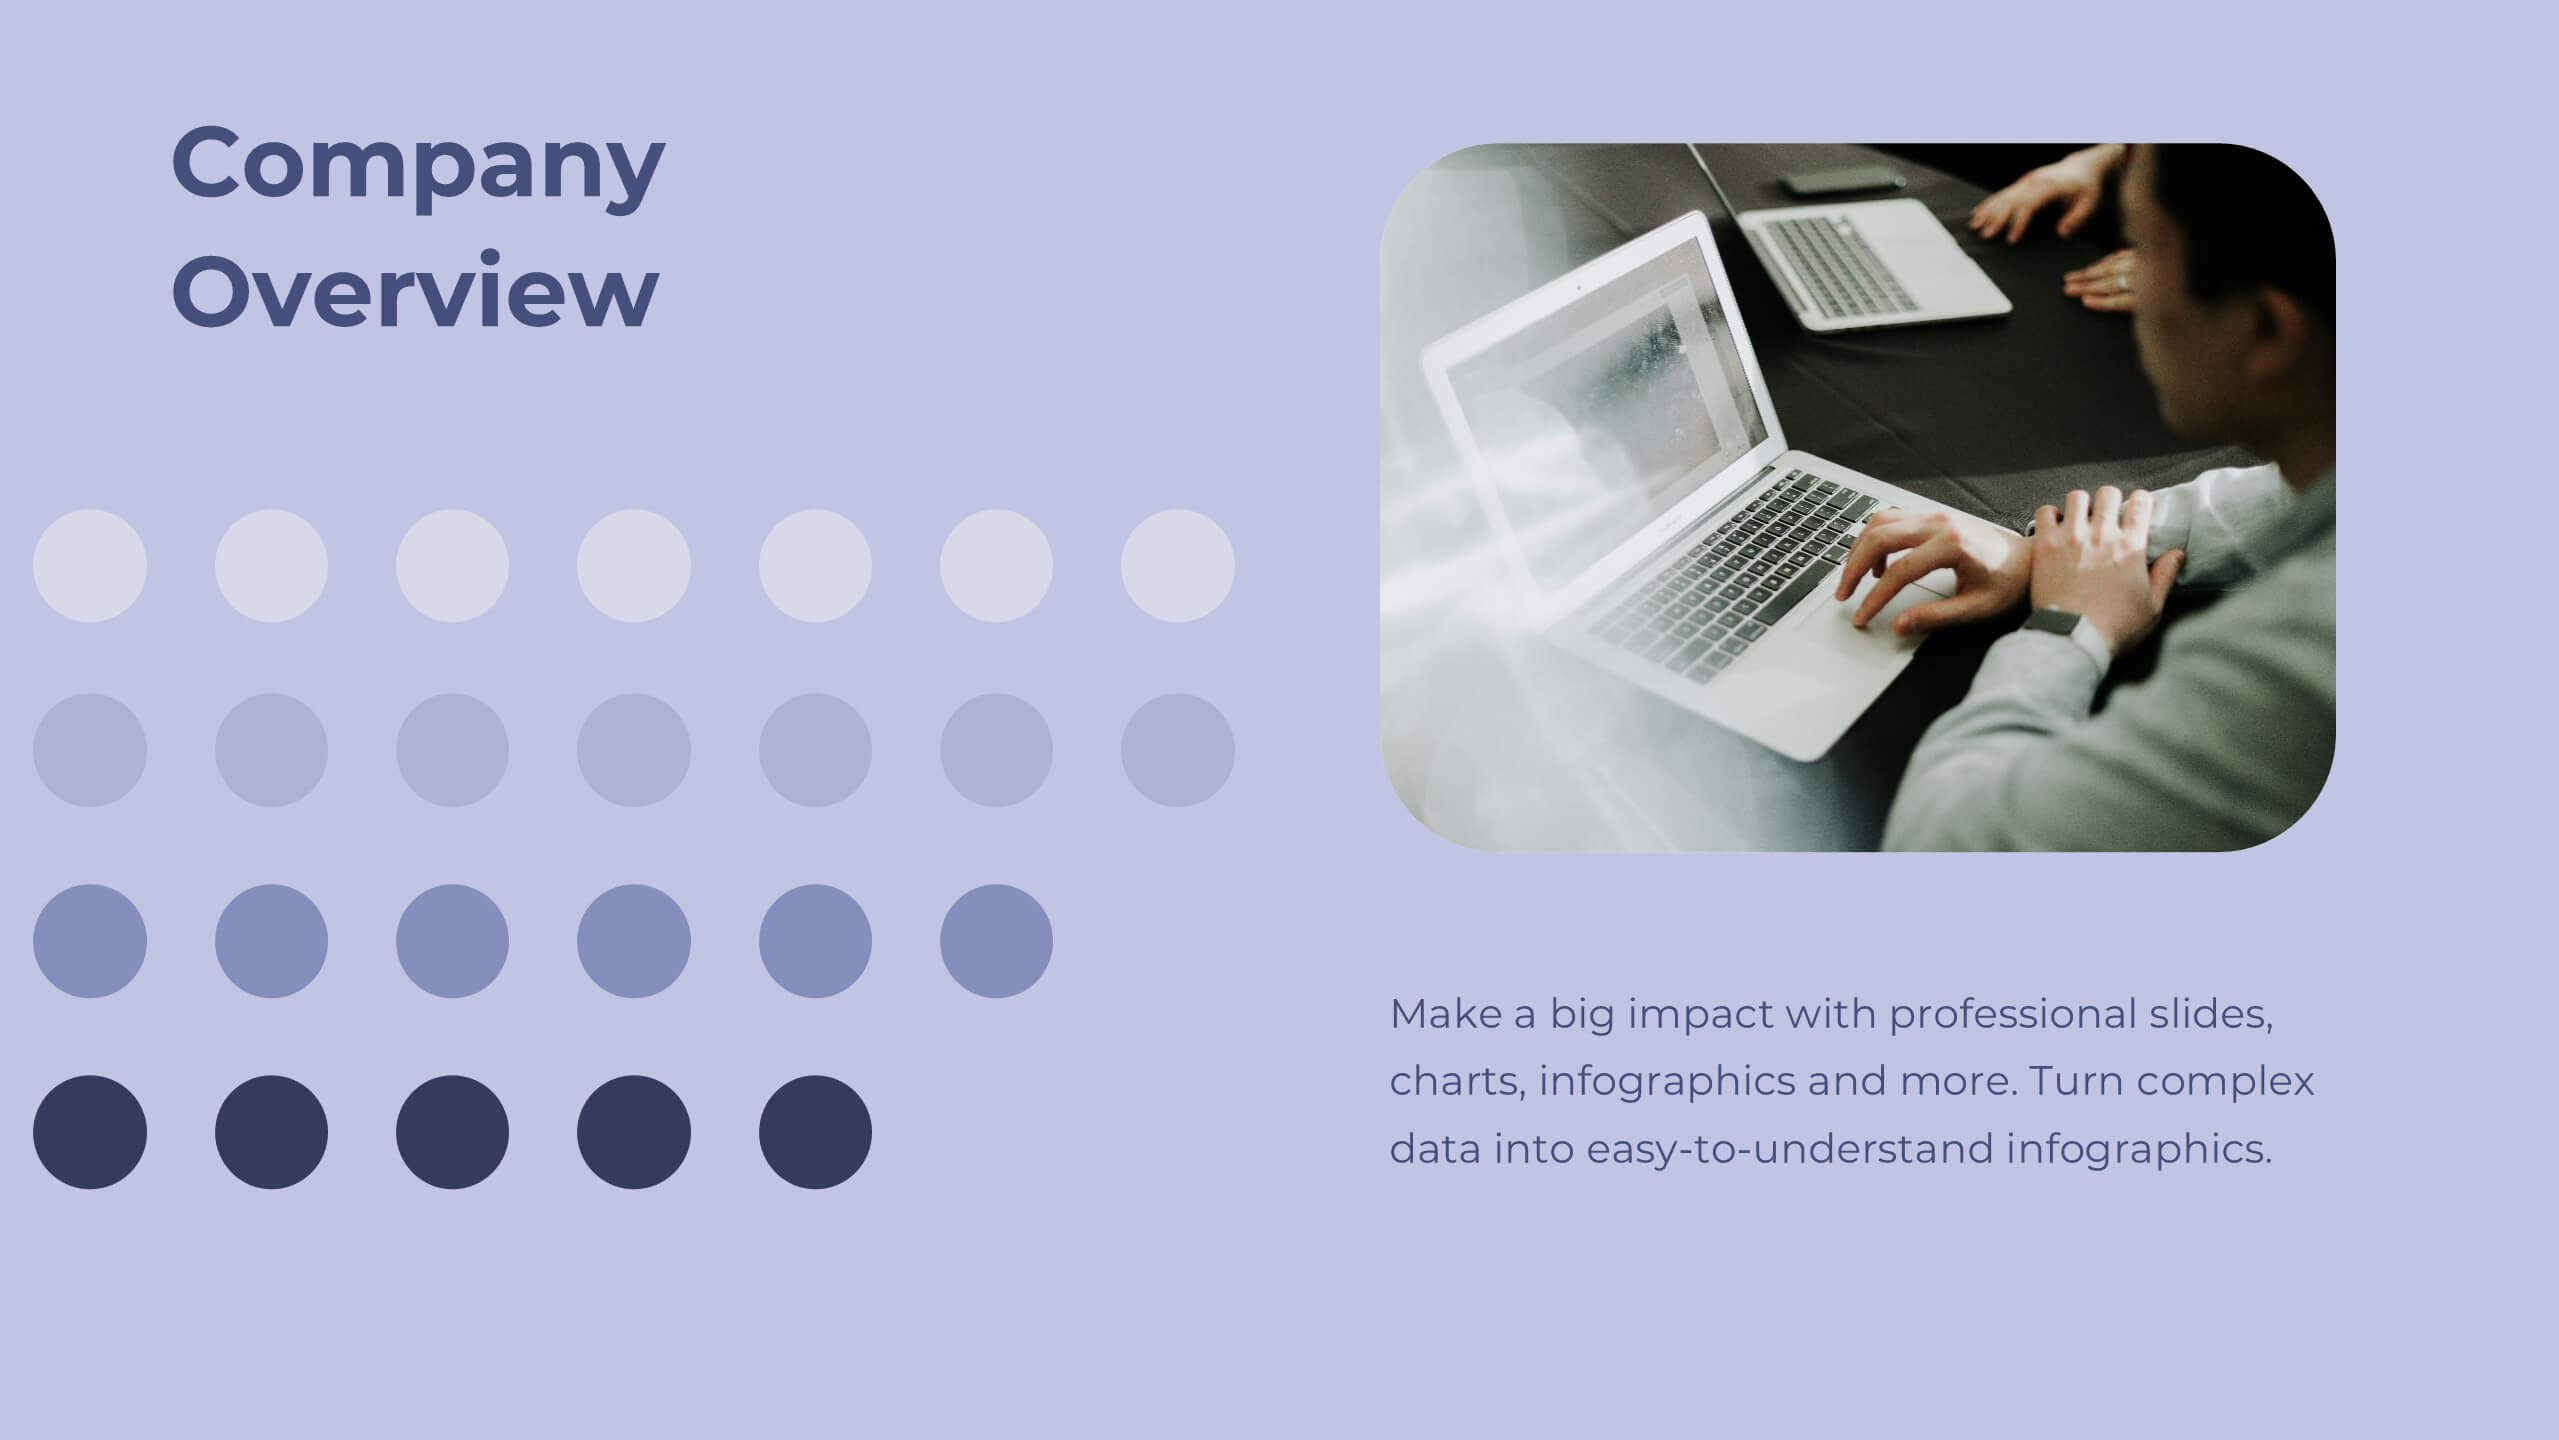
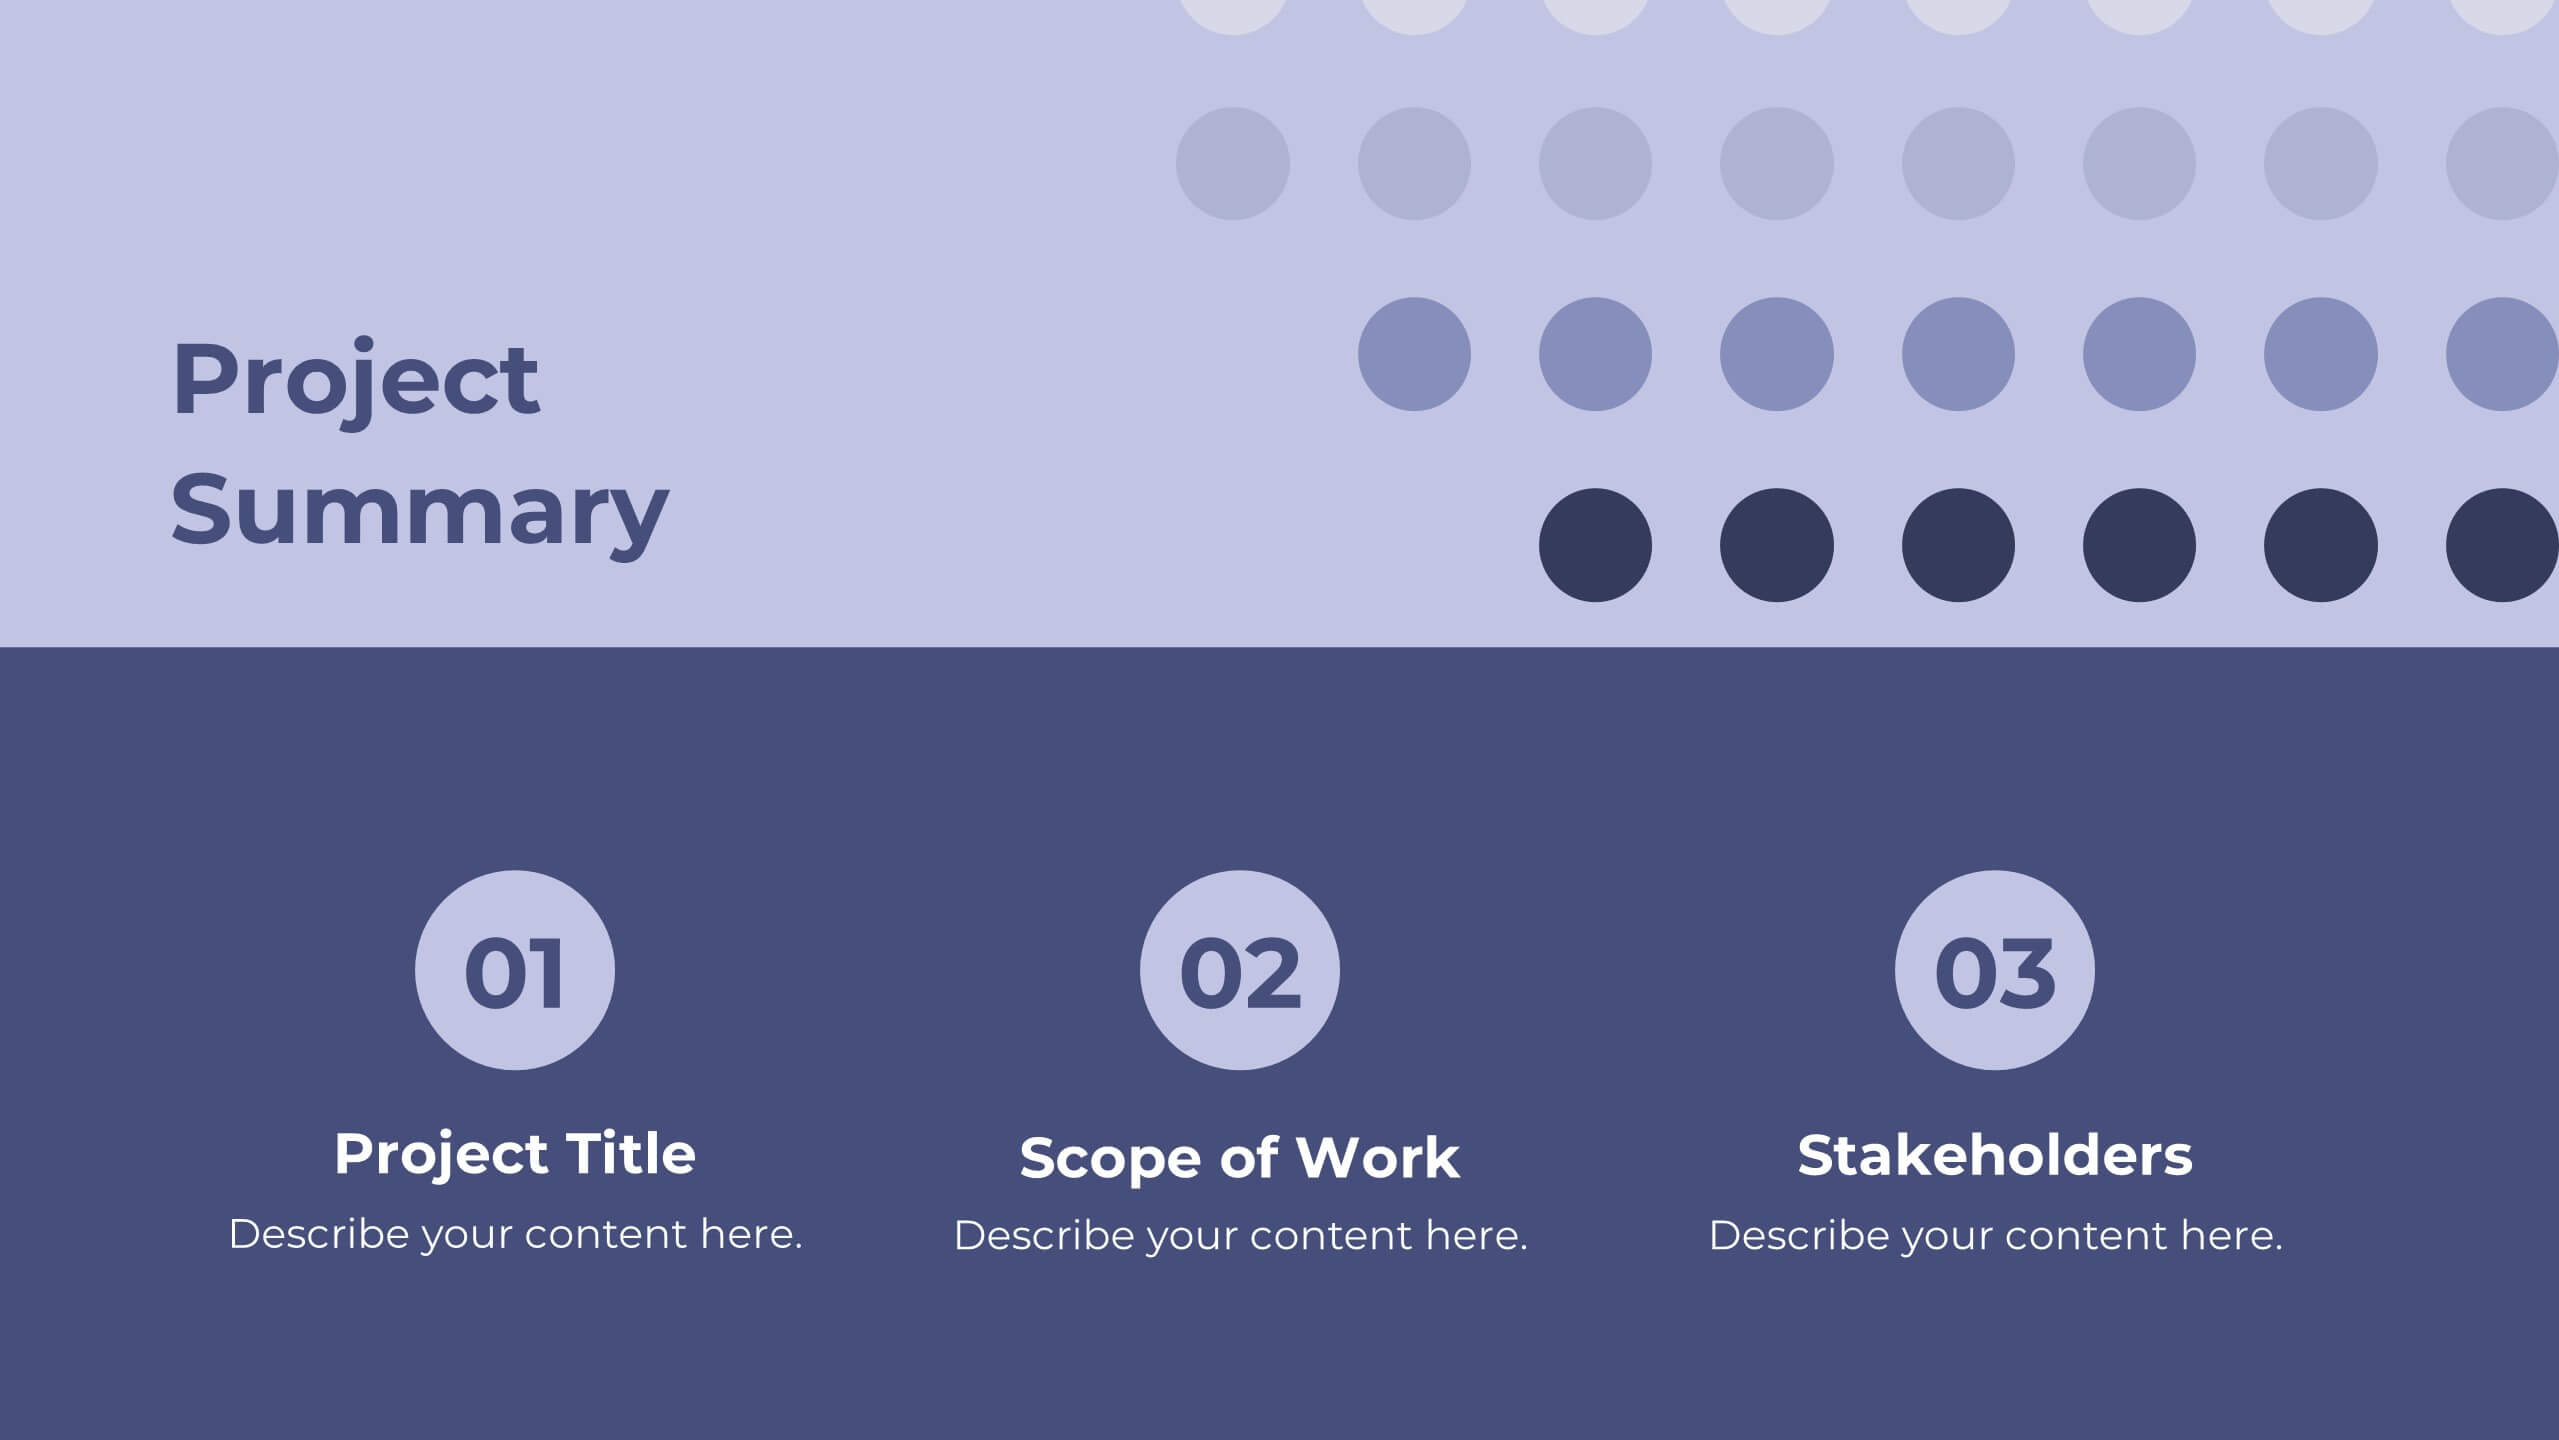
Labyrinth Project Proposal Presentation
Present your project proposal with this clean and professional template! Covering sections such as objectives, scope of work, timeline, and budget breakdown, it helps you convey your plan clearly and effectively. Fully customizable and compatible with PowerPoint, Keynote, and Google Slides, it’s perfect for delivering impactful proposals to clients.


26 diapositivas
Operational Efficiency Tips Purple Presentation
Optimize your team's workflow and showcase your strategies for improved performance with this operational efficiency template. The vibrant purples and dynamic design invite viewers into a world where streamlined processes and clear objectives lead to success. Lay out the steps of your action plan, from the CEO's vision to the team's execution, with a variety of slides designed for clear communication. Charts and diagrams turn complex data into easy-to-follow visuals, while mockups provide a real-world view of your tools and platforms. Tailored for use in popular presentation software, this set of slides is an excellent aid for managers and consultants aiming to present plans that boost productivity and cut down waste. It’s all about making the complex simple and achieving more with less, helping your audience see the path to a leaner and more effective operation.


23 diapositivas
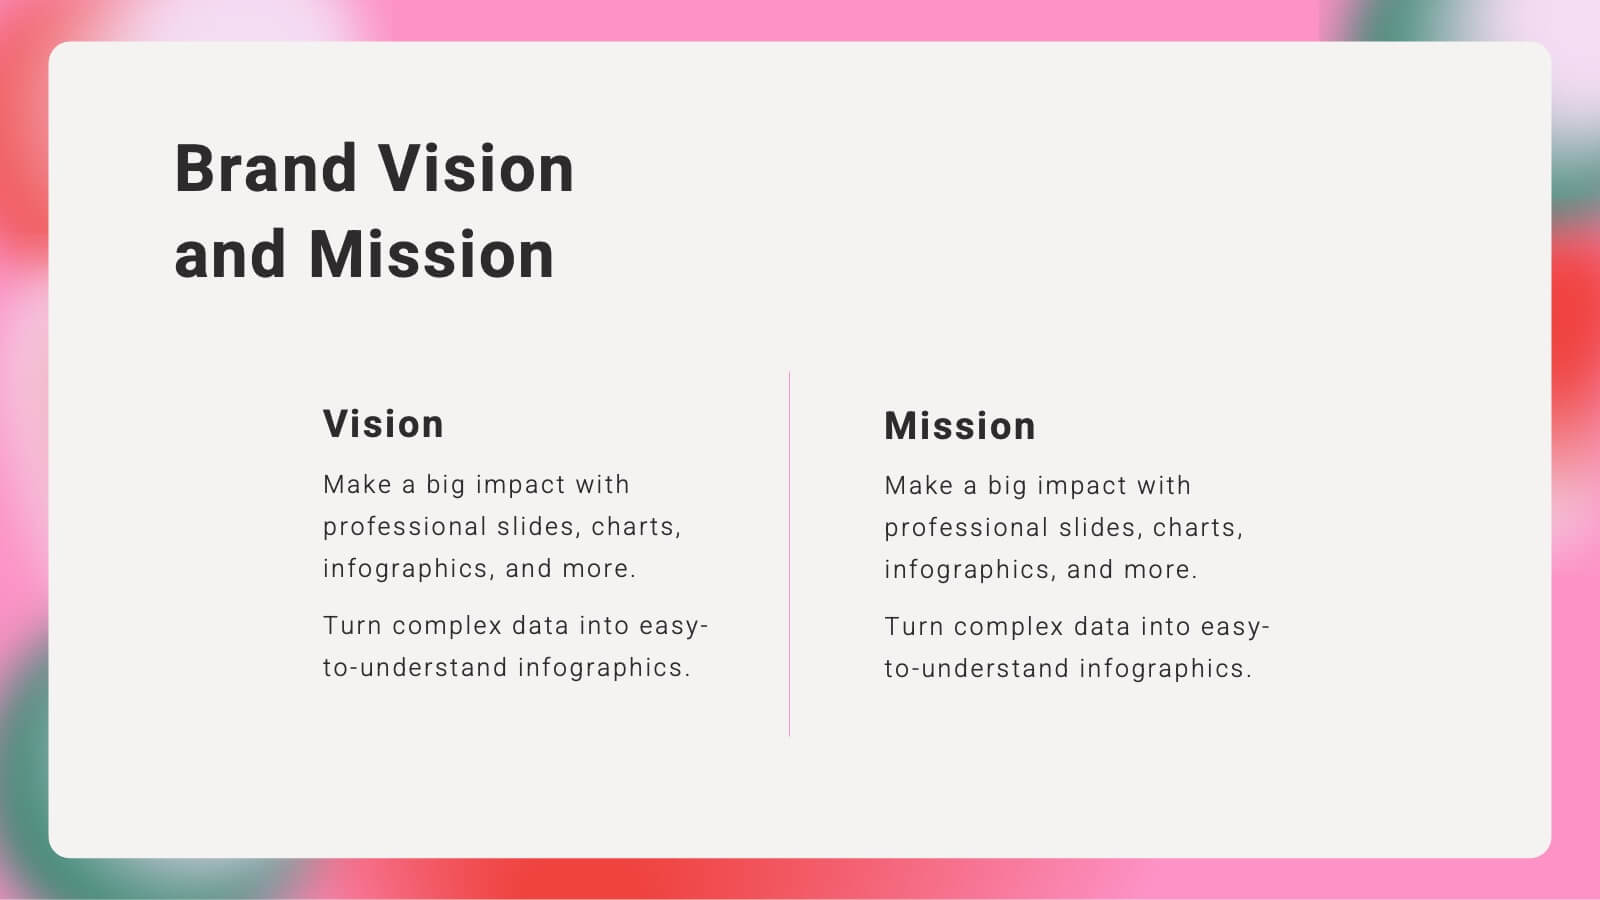
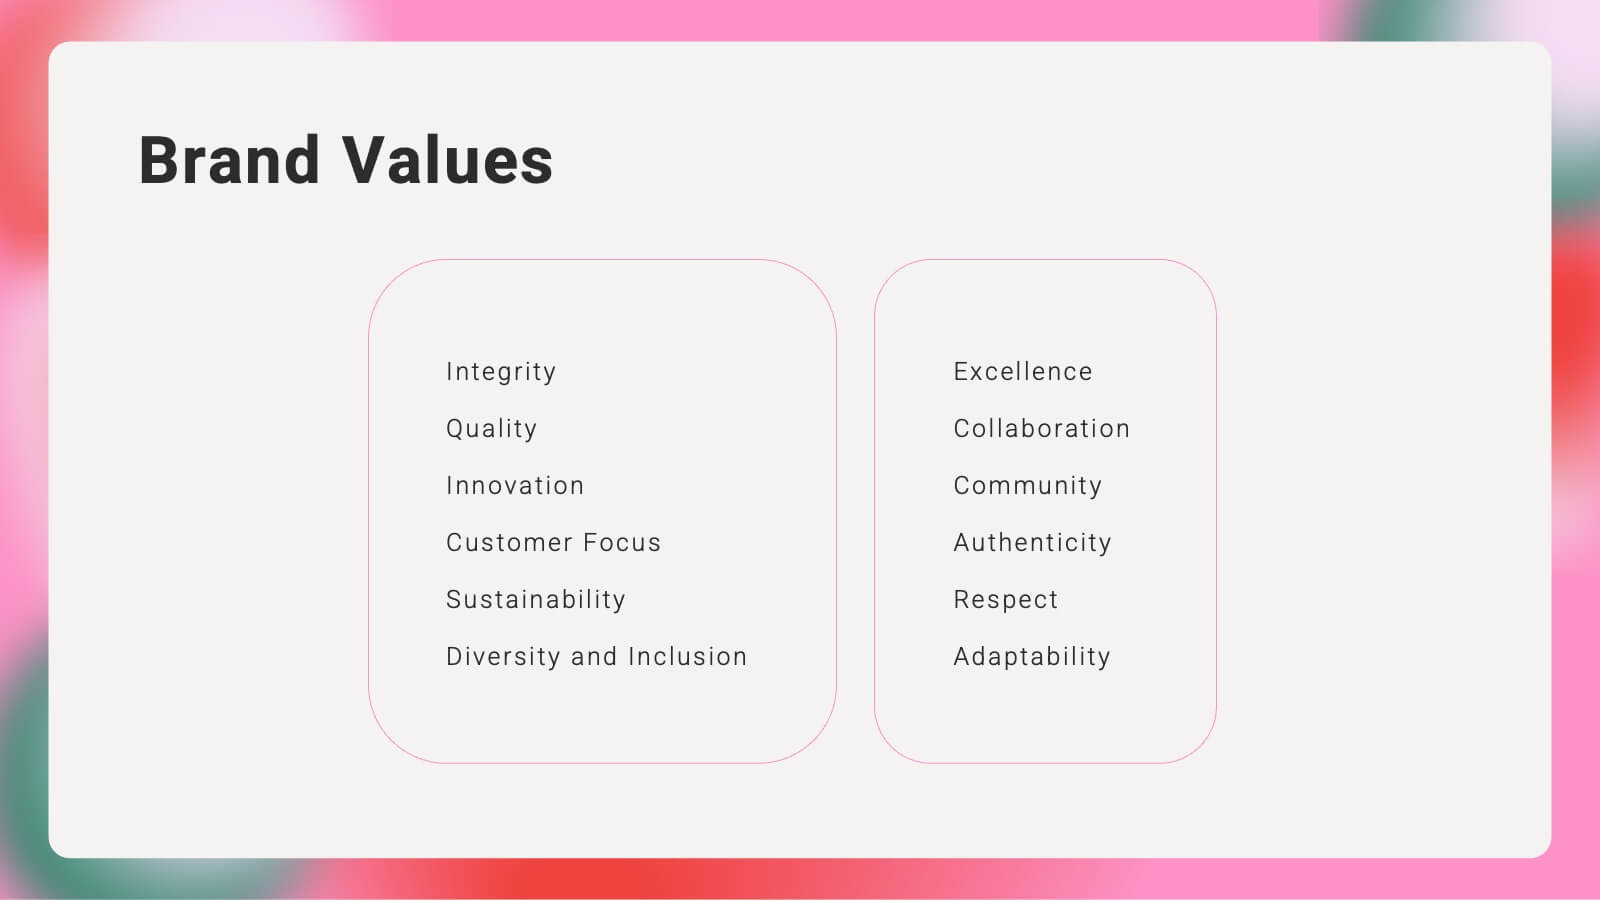
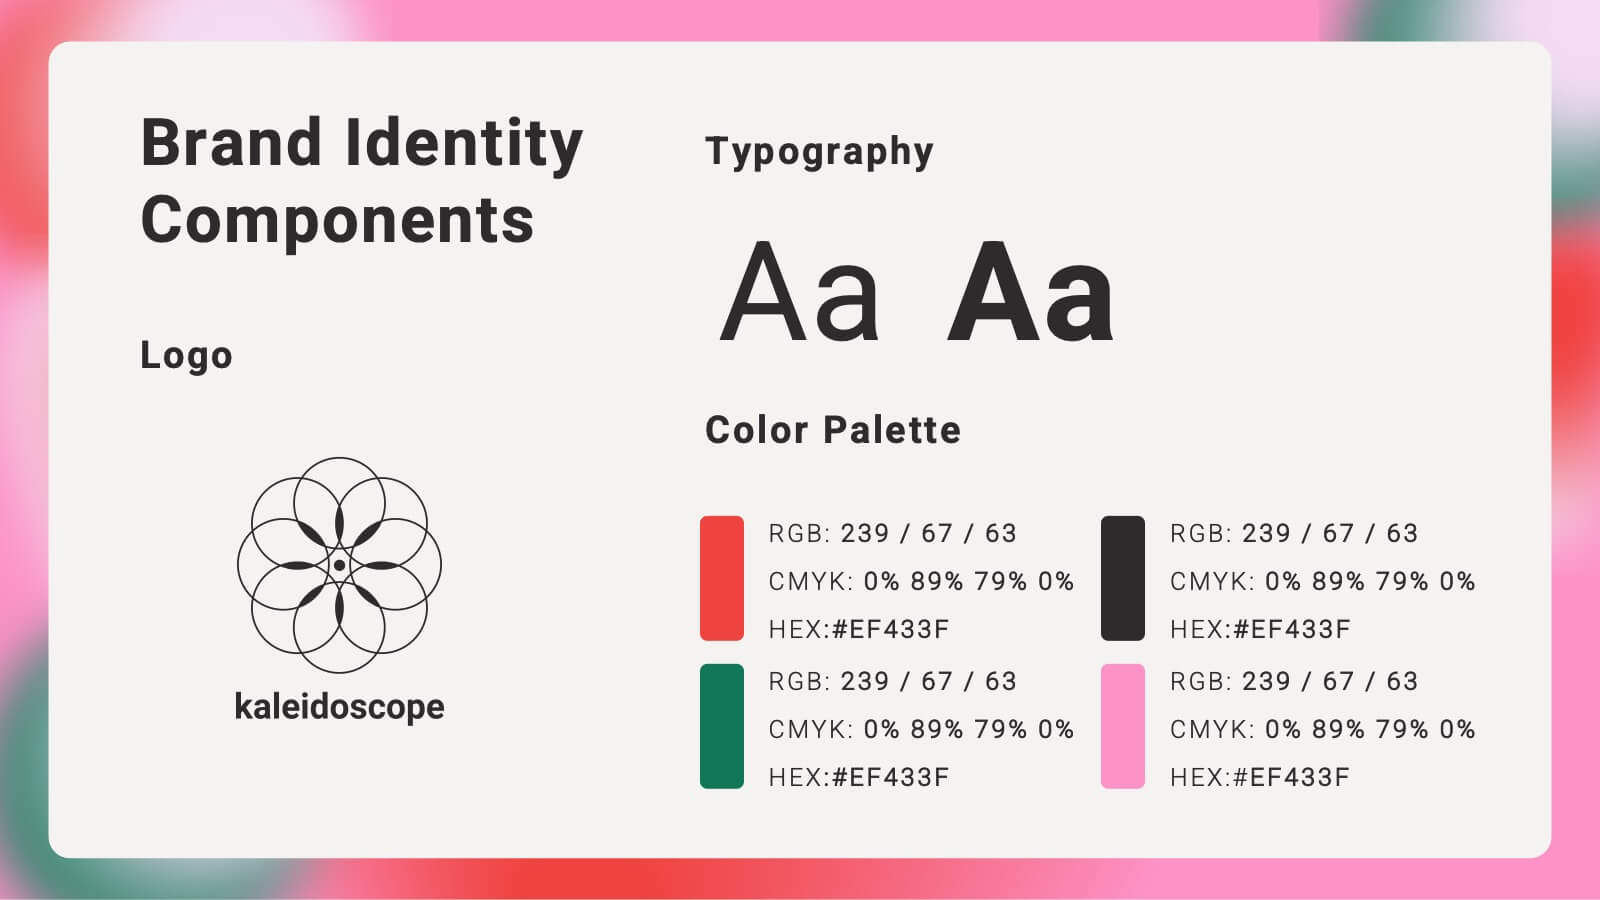
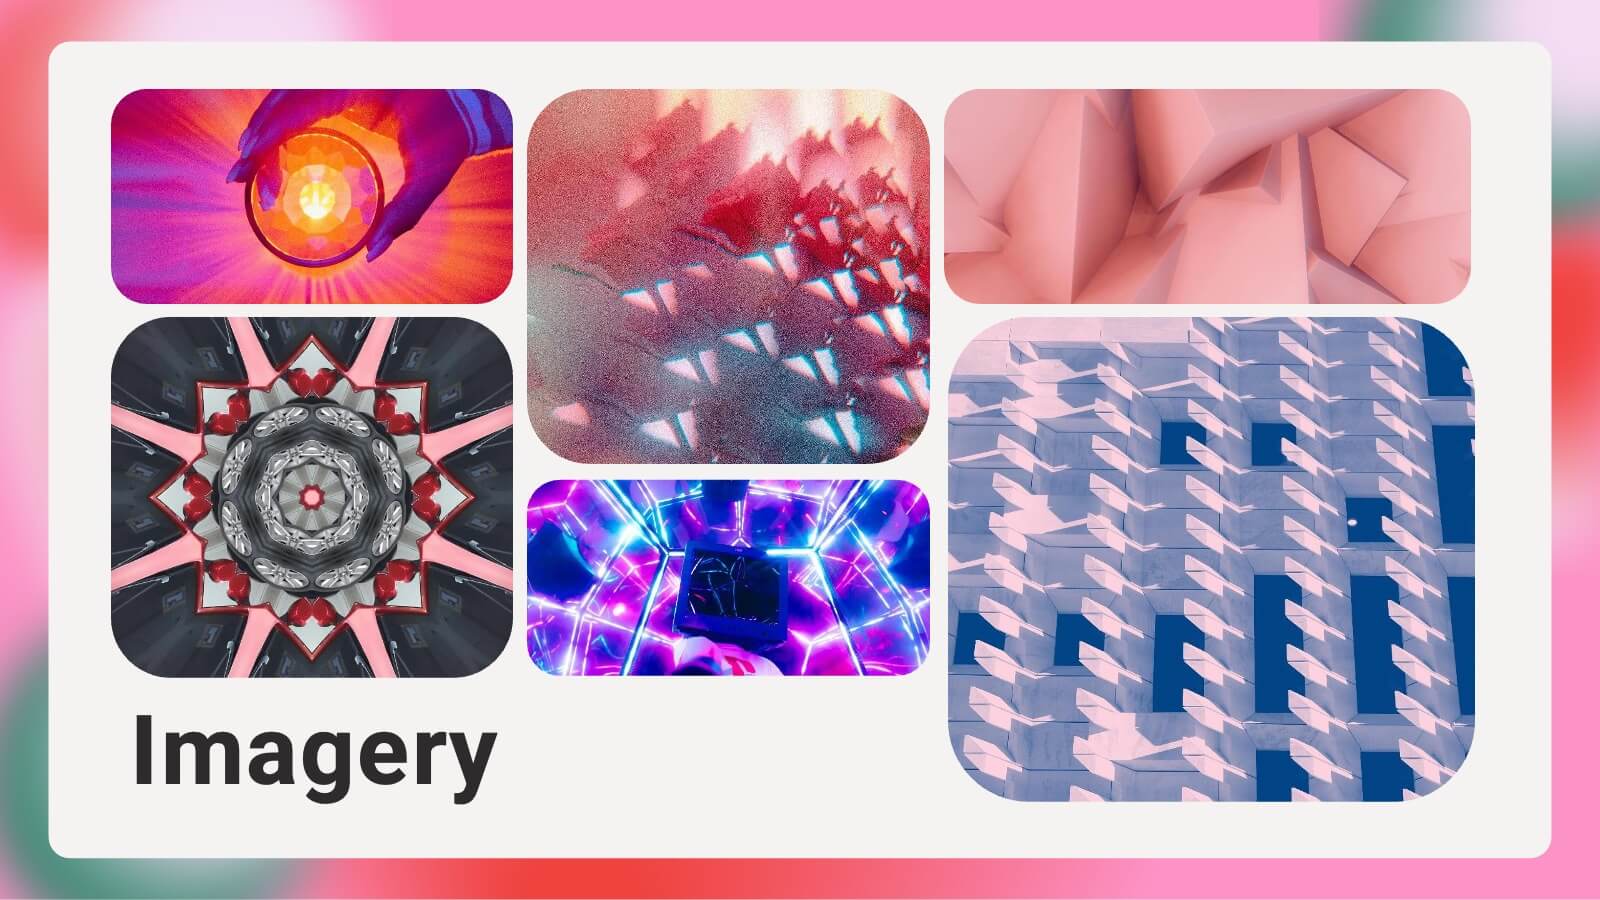
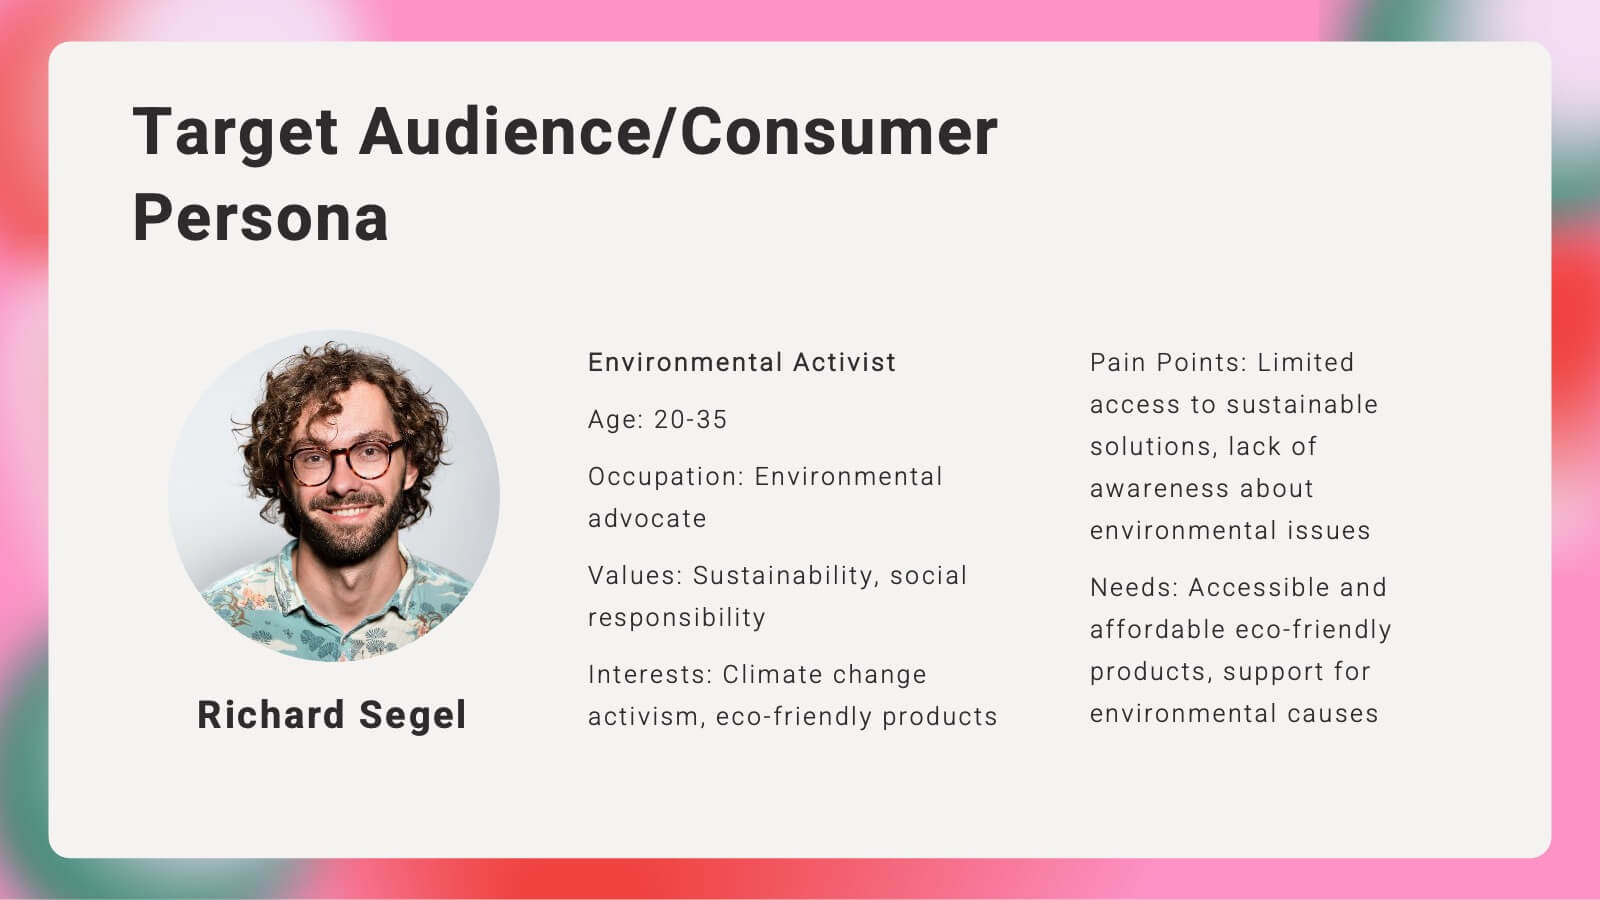
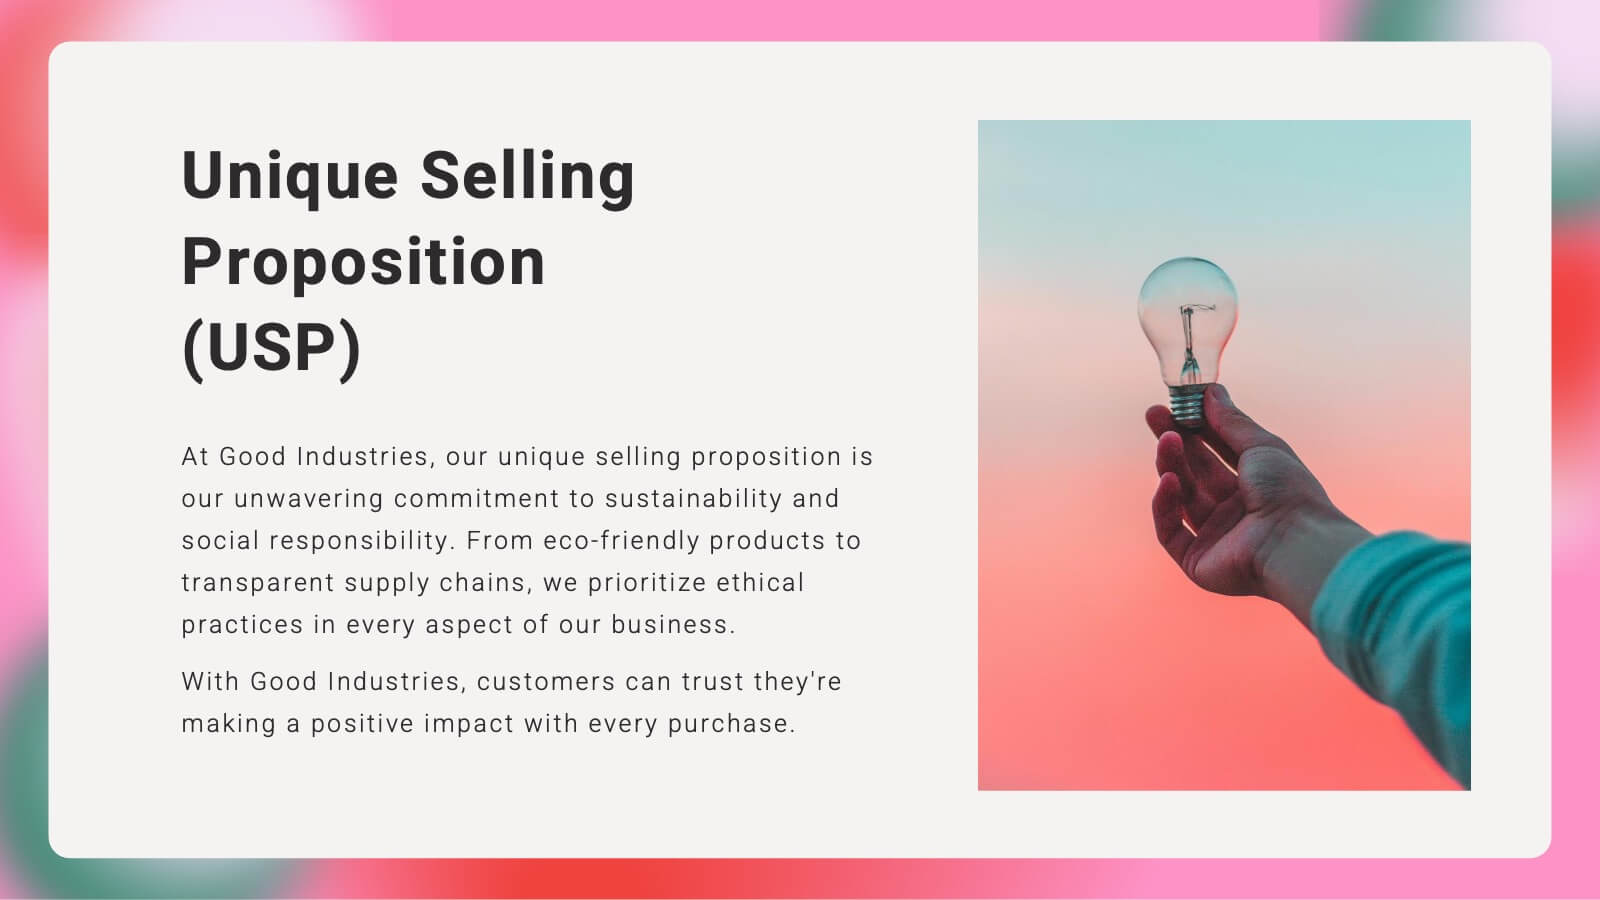
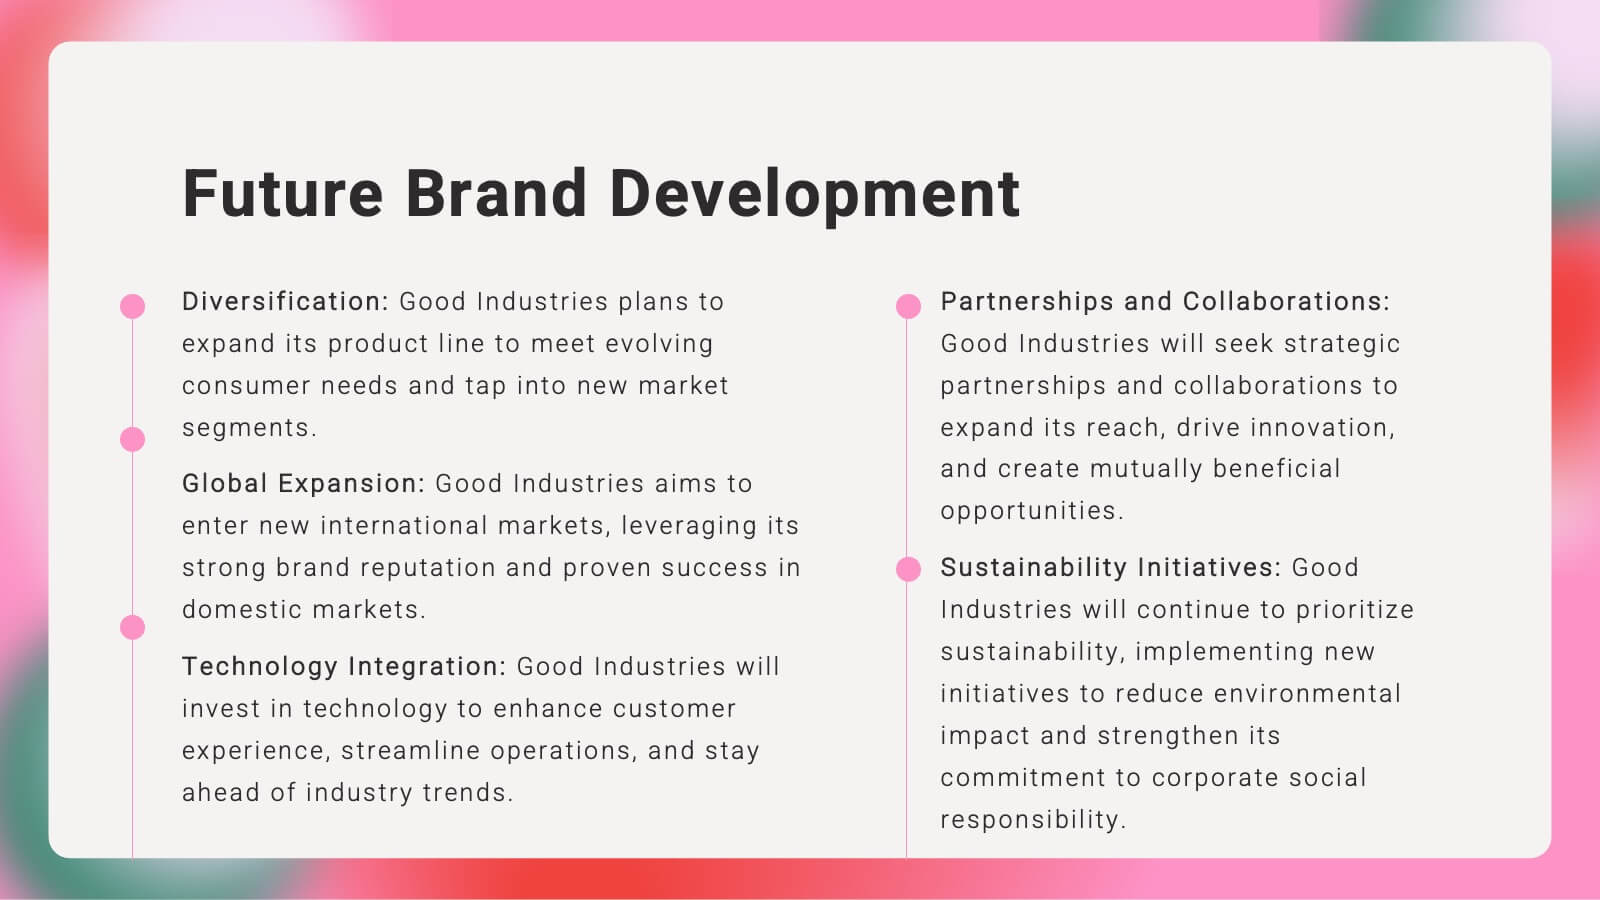
Kaleidoscope Brand Strategy Report Presentation
Craft a compelling narrative for your brand with this vibrant brand strategy presentation template. Designed to cover every facet of brand development, from vision and mission to market analysis and consumer personas, this template is an essential tool for businesses looking to establish a strong brand identity. It incorporates visually engaging slides that outline brand voice, values, and touchpoints, facilitating a thorough understanding of strategic branding. Compatible with platforms like PowerPoint, Google Slides, and Keynote, it is accessible across various devices, making it perfect for collaborative planning and presentations.


5 diapositivas
Breast Cancer Awareness Day
Raise awareness and educate with this visually impactful Breast Cancer Awareness Day template. Featuring circular infographic elements styled in a breast tissue-inspired layout, this slide design is ideal for campaigns, health education, corporate wellness events, and social initiatives. Each section can be customized with key data, statistics, or actionable messages. Fully editable in PowerPoint, Keynote, and Google Slides.


7 diapositivas
Buyer Journey Infographic
Embark on a visual adventure with our Buyer Journey Infographic Template, designed to map out the critical stages of the consumer experience with flair and precision. This template captures each phase of the buyer's journey, from initial awareness to the final purchase decision, using a combination of bold graphics and streamlined information. Ideal for marketing professionals and business strategists, this template breaks down complex consumer behavior into clear, actionable insights. Utilize this engaging tool to showcase how customers interact with your brand at every touchpoint, highlighting opportunities for engagement and conversion enhancement. Fully customizable, this template allows you to adjust the visuals and text to align with your company’s branding and the specific nuances of your customer base. It’s an essential tool for presentations, training, and marketing materials, providing a foundation for strategies that resonate deeply with audiences and drive successful outcomes.


5 diapositivas
Advances in Technology Infographics
Advances in Technology have transformed the world in a number of ways and have had a significant impact on society. These Infographic templates are dynamic and visually appealing tools for showcasing the latest advancements in technology across various fields. Whether you're discussing breakthroughs in electric cars, robotics, biotechnology, or any other cutting-edge technology, this template has you covered. With its modern and sleek design, this template captures the essence of technological innovation. It features a range of customizable design elements enabling you to present data-driven information in a visually engaging way.


6 diapositivas
Customers Market Segmentation Strategy Presentation
Unlock the power of understanding your audience with a visually structured layout that turns complex data into clear, actionable insights. This presentation helps businesses define, target, and engage customer groups effectively. Fully editable and compatible with PowerPoint, Keynote, and Google Slides for seamless customization and professional presentation delivery.


6 diapositivas
Education Through Gamified Learning Presentation
Make learning fun and engaging with the Education Through Gamified Learning Presentation. This creative slide layout uses a playful interface with progress-style icons and a “Play” button to simulate game-based education paths. Ideal for educators, trainers, and eLearning designers. Fully customizable in Canva, PowerPoint, Keynote, and Google Slides.


6 diapositivas
Prevention and Support Breast Cancer Strategy Presentation
Deliver powerful insights with the Prevention and Support Breast Cancer Strategy Presentation. Designed for impact, this layout uses gender icons, ribbons, and clear percentage visuals to present awareness, research data, and healthcare strategies. Ideal for advocacy groups, nonprofit campaigns, or medical briefings. Fully editable in PowerPoint, Keynote, Google Slides, and Canva.


5 diapositivas
Editable Asia Region Map Slide Presentation
Explore data across countries with a sleek regional map designed to visualize insights and connections in a clear, professional way. Perfect for presenting market trends, business reach, or project highlights across Asia, this editable layout is fully compatible with PowerPoint, Keynote, and Google Slides for easy customization.


24 diapositivas
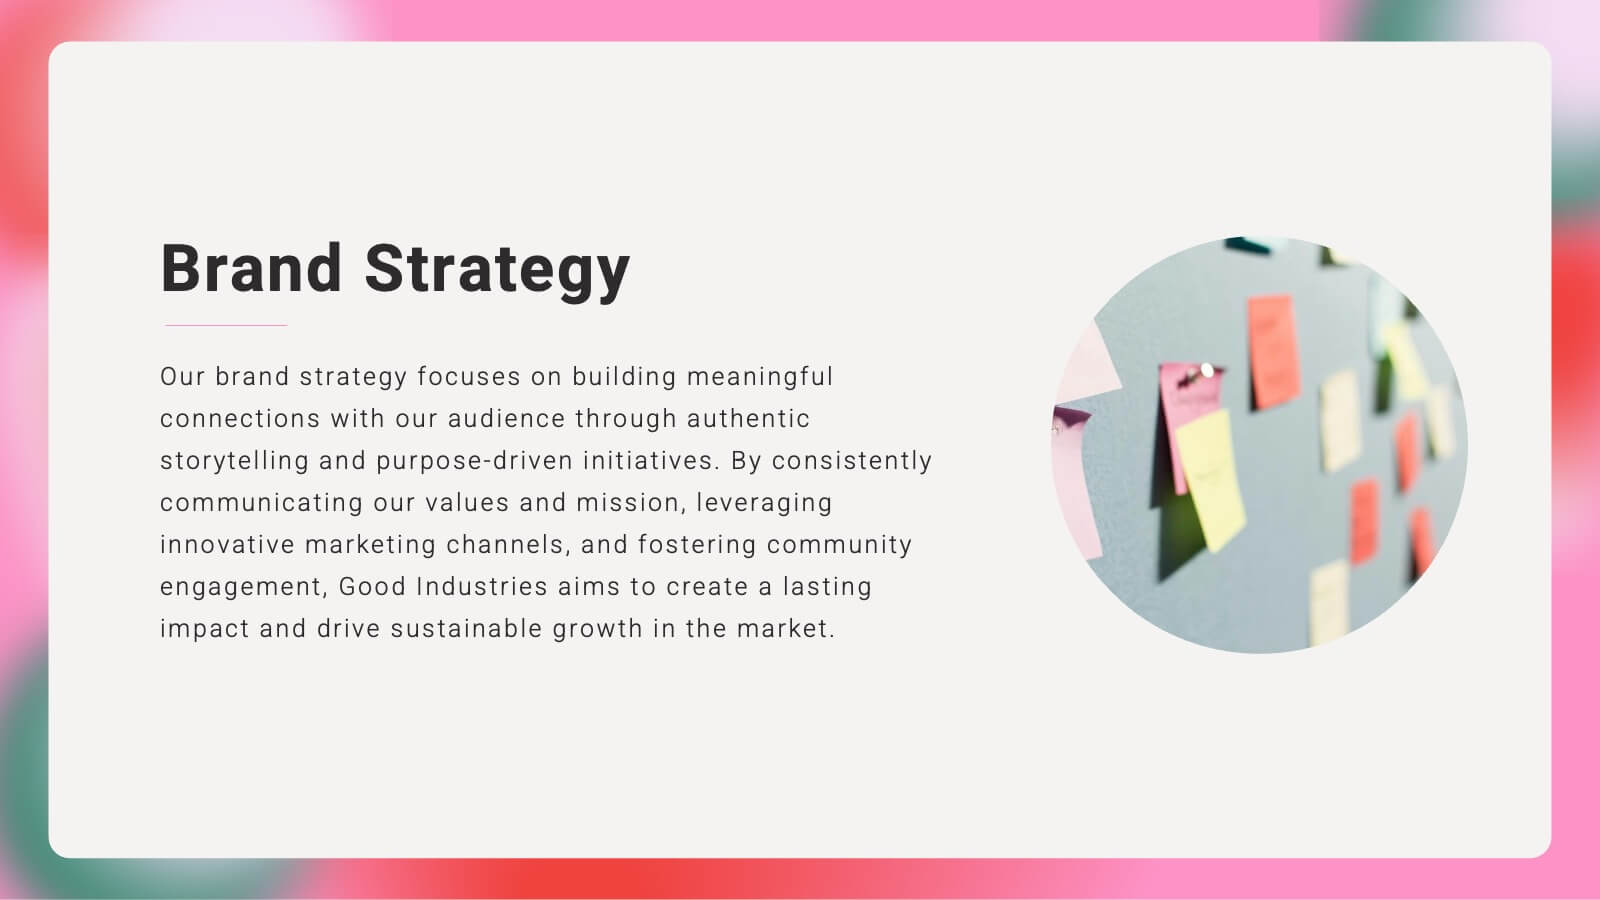
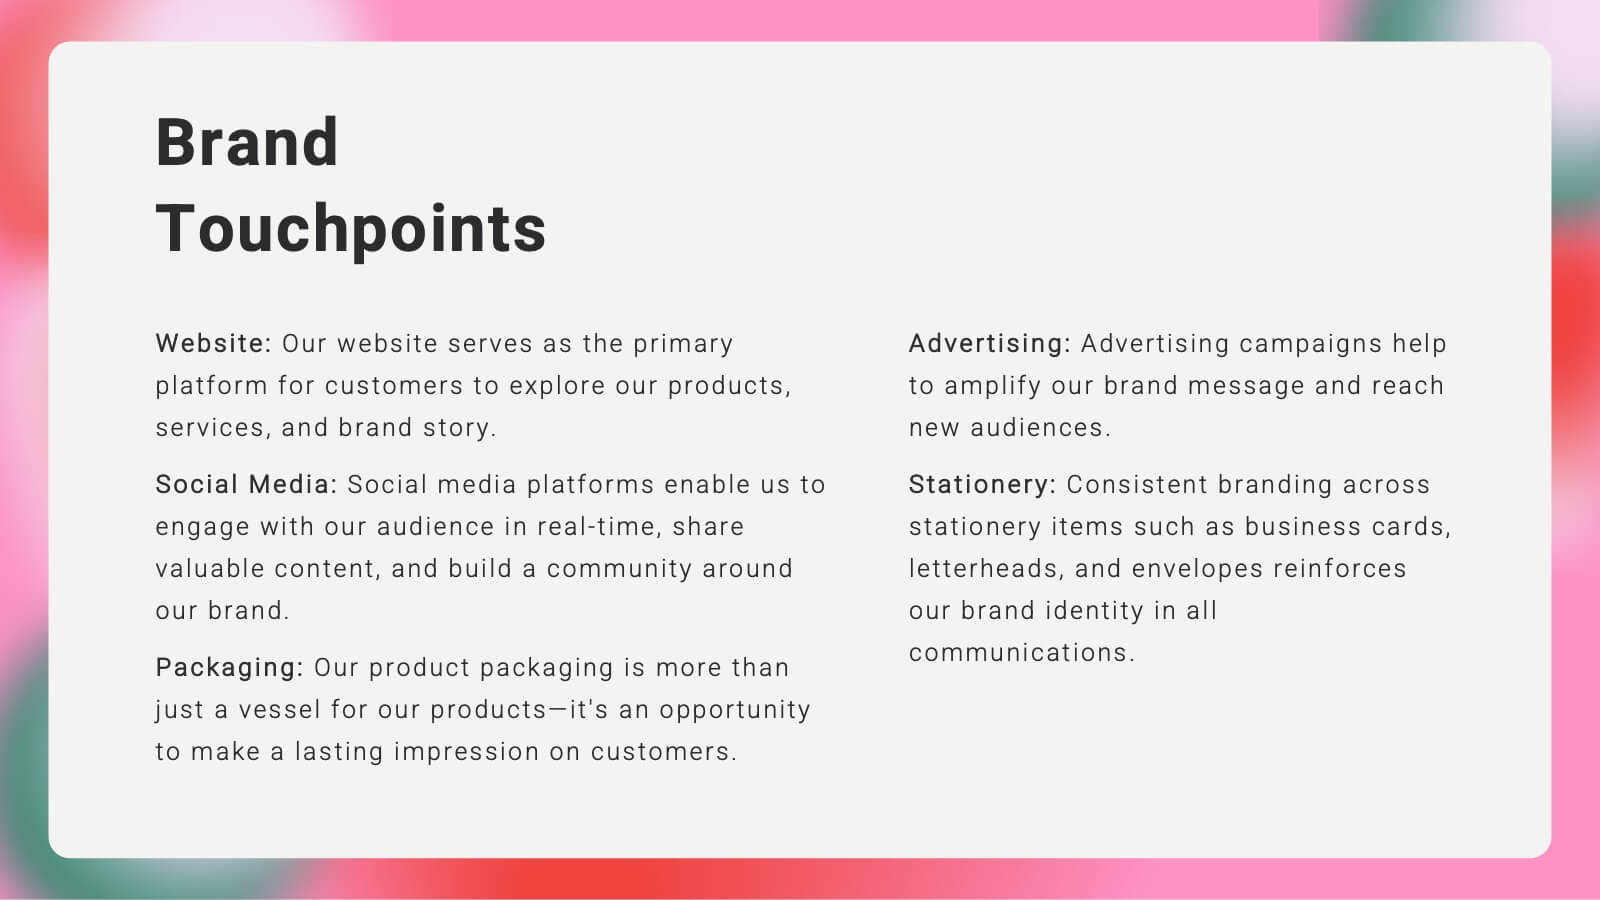
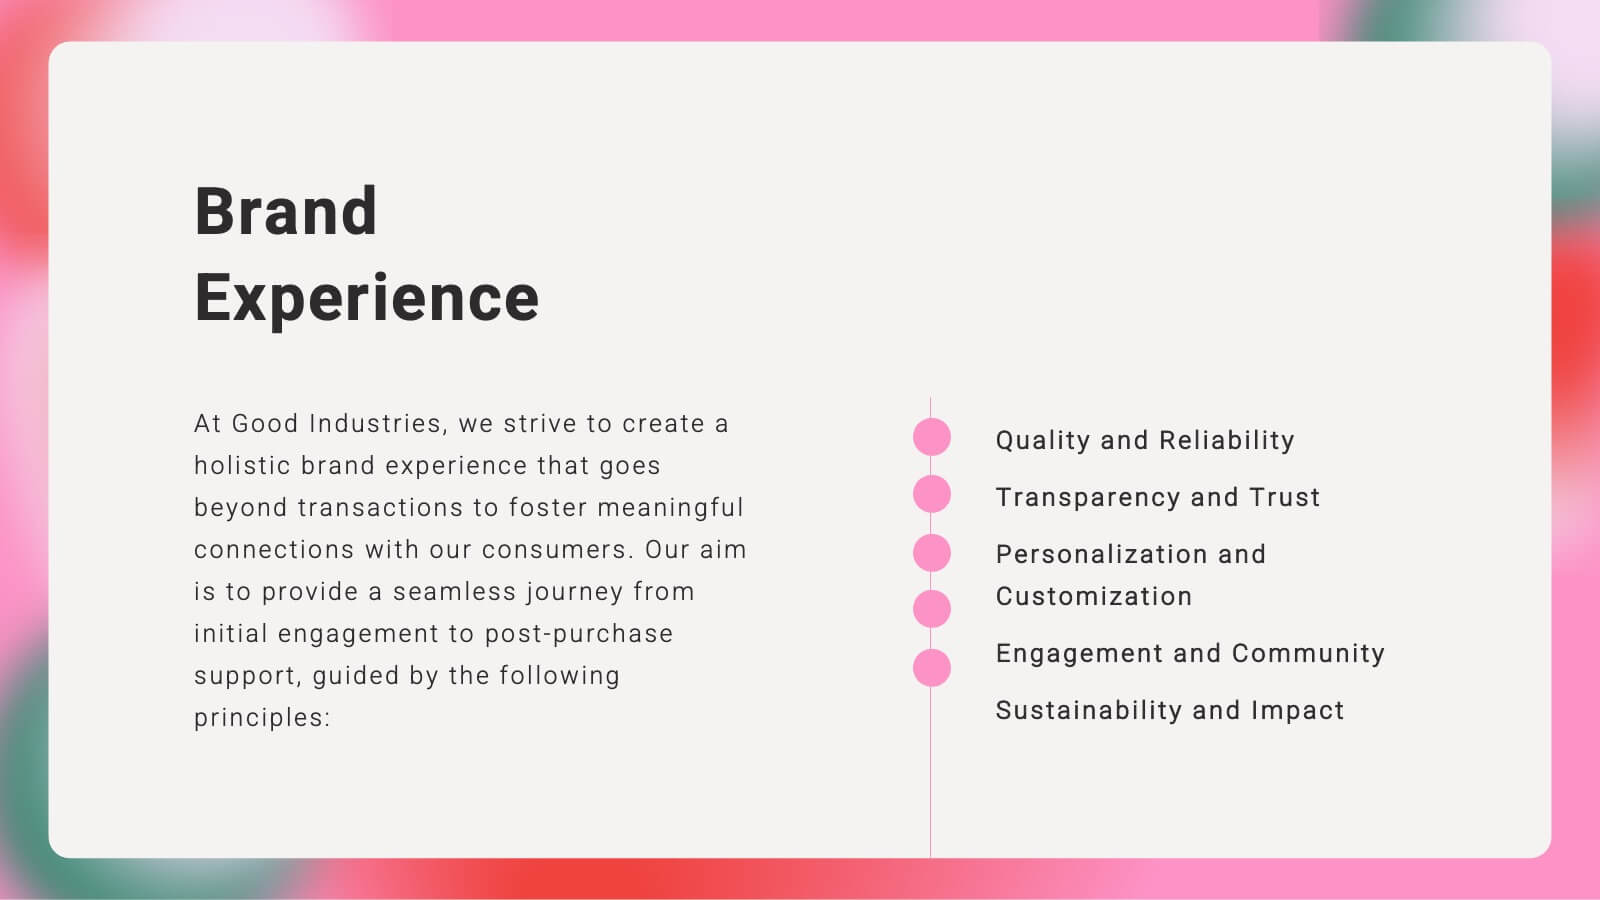
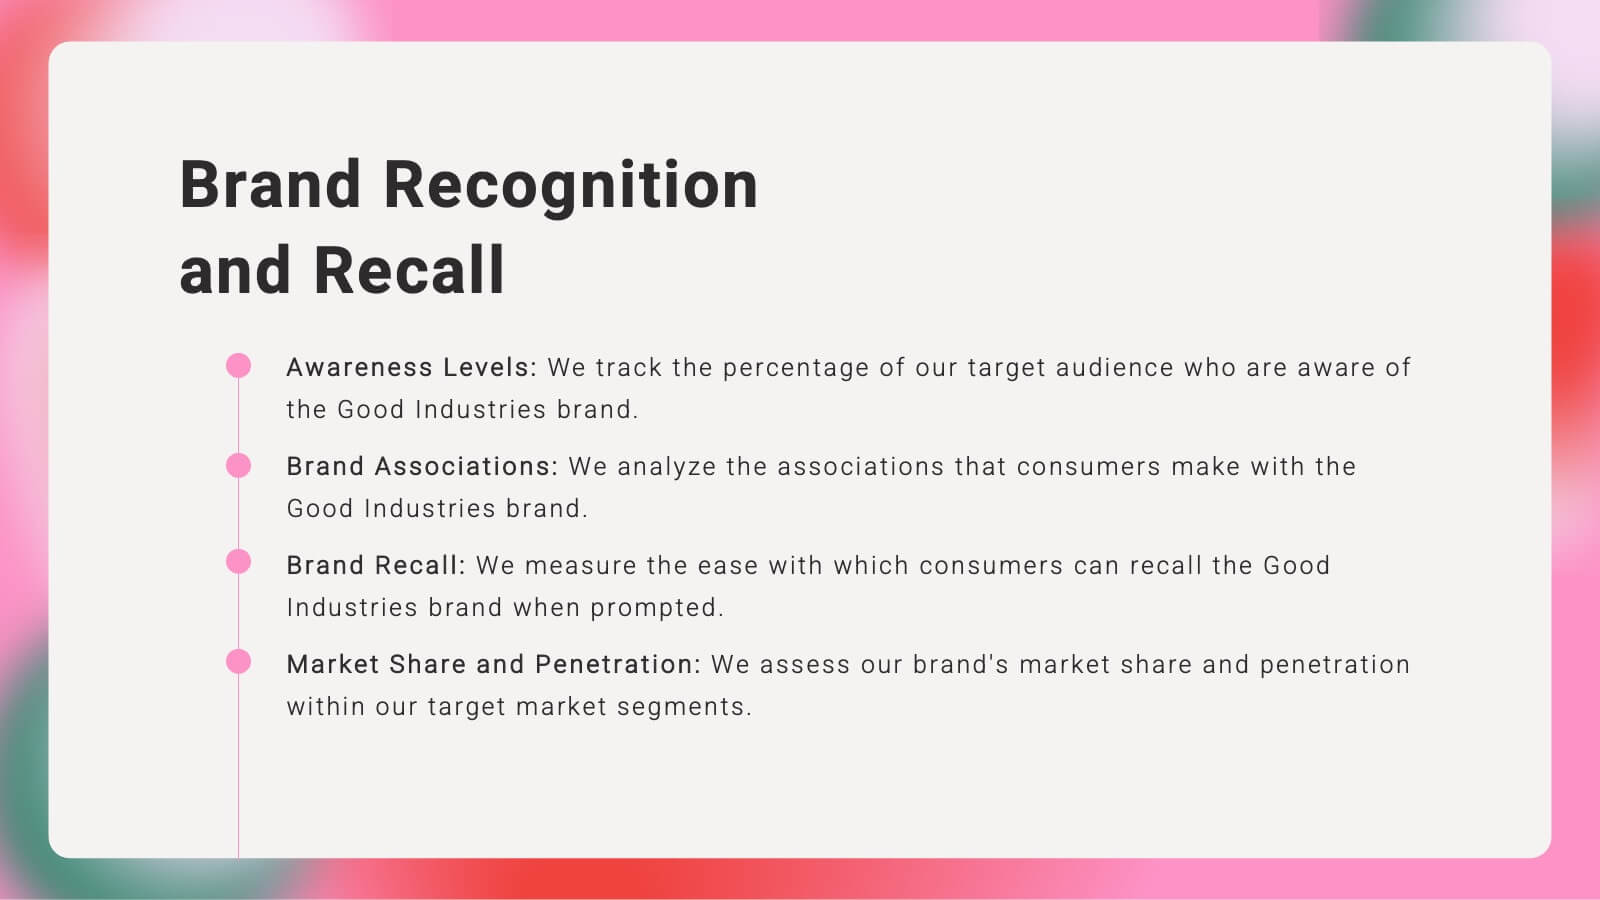
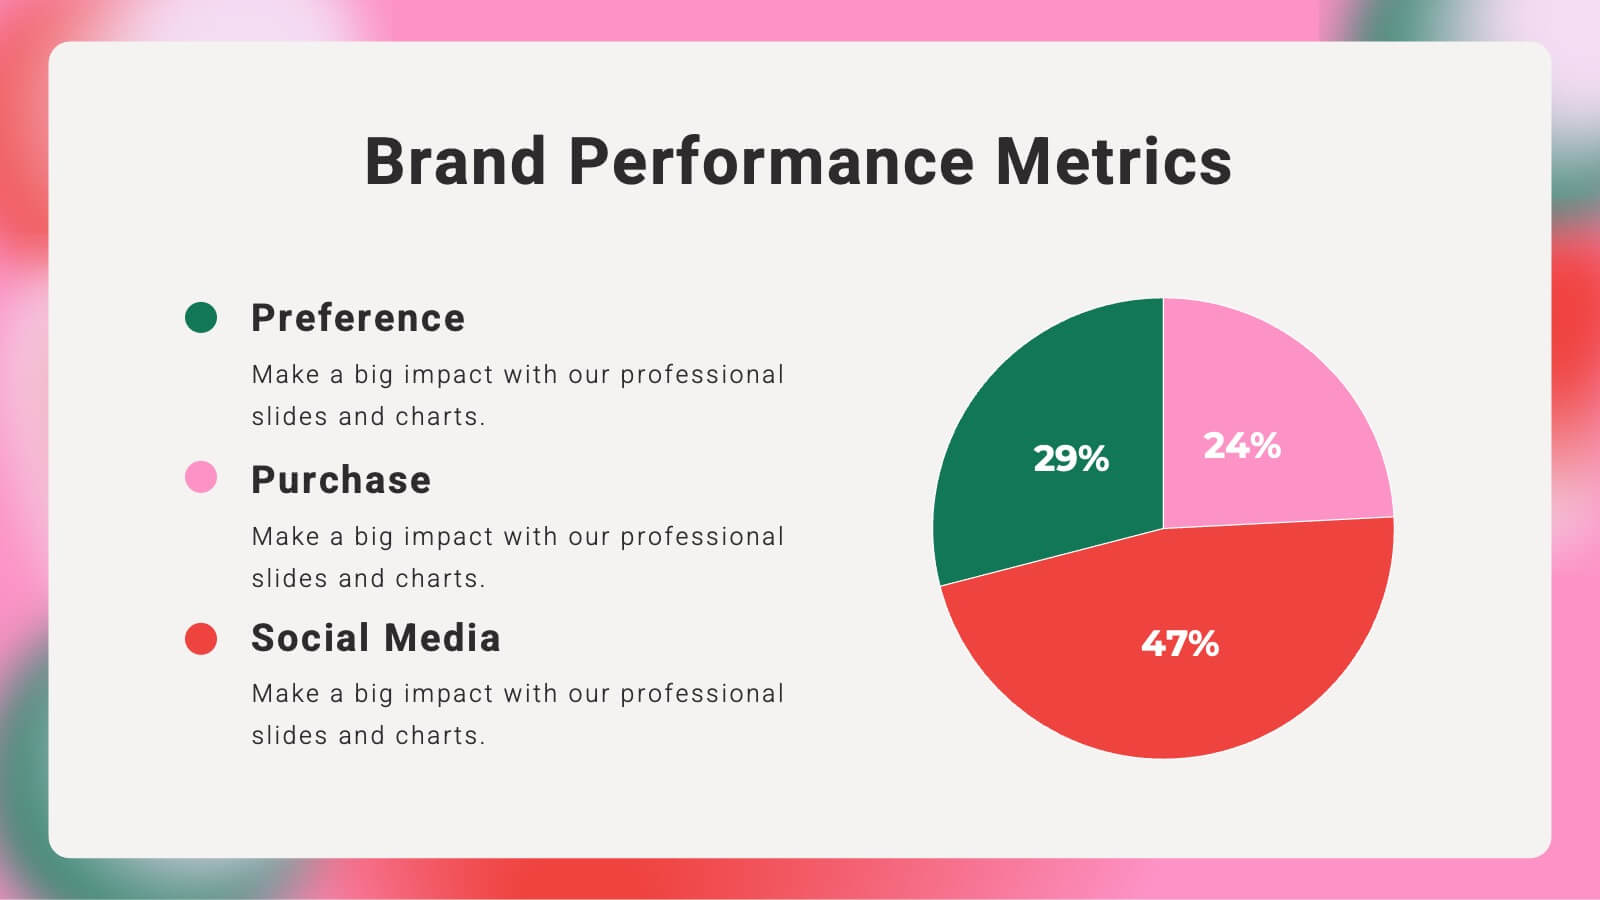
Brand Overview Presentation
Enhance your brand storytelling with our Brand Presentation template. Perfect for showcasing brand vision, values, and strategies, this template includes diverse slides for audience targeting and brand touchpoints. Suitable for all professional settings, it's compatible with PowerPoint, Keynote, and Google Slides.


6 diapositivas
Blue Ocean Strategy Business Model
Capture new market spaces with this innovative Blue Ocean Strategy slide. Designed with a dynamic hourglass visual, it helps you showcase differentiation and low-cost strategies clearly. Perfect for business strategy sessions, growth planning, and innovation discussions. Fully editable in PowerPoint, Keynote, and Google Slides.