


Características


¿Tienes alguna pregunta?
Recomendar


10 diapositivas
Teamwide Business Implementation Plan Presentation
Visualize your implementation roadmap with this team-focused progress slide. Featuring circular avatars, percentage bars, and milestone titles, it’s ideal for highlighting departmental progress or execution timelines. Fully editable in PowerPoint, Keynote, and Google Slides—perfect for internal updates, leadership reviews, or showcasing collaborative performance across business functions.


6 diapositivas
Enterprise IT Infrastructure Architecture
Showcase layered IT systems with the Enterprise IT Infrastructure Architecture Presentation. This vertical stacked diagram helps you illustrate five key components clearly, from top-level strategy to foundational systems. Ideal for IT teams, architects, and consultants. Fully editable in PowerPoint, Keynote, and Google Slides for seamless customization and professional delivery.


5 diapositivas
The History of Beer Infographics
Beer has a long and fascinating history that dates back thousands of years, throughout its history beer has played a significant role in social, cultural, and economic contexts. These engaging infographics take viewers on a journey through the fascinating history of beer. It provides a comprehensive overview of the origins, evolution, and cultural significance of beer throughout different eras and regions. This visual resource is perfect for beer enthusiasts, historians, and anyone interested in the cultural and historical aspects of this beloved beverage. Compatible with Powerpoint, Keynote, and Google Slides.


5 diapositivas
Behavioral Psychology Insights Presentation
Dive deep into the human mind with our 'Behavioral Psychology Insights' presentation template. Perfect for educators and professionals, this template offers a structured way to present complex psychological concepts visually. Ideal for delivering engaging presentations on human behavior, it is compatible with PowerPoint, Keynote, and Google Slides.

20 diapositivas
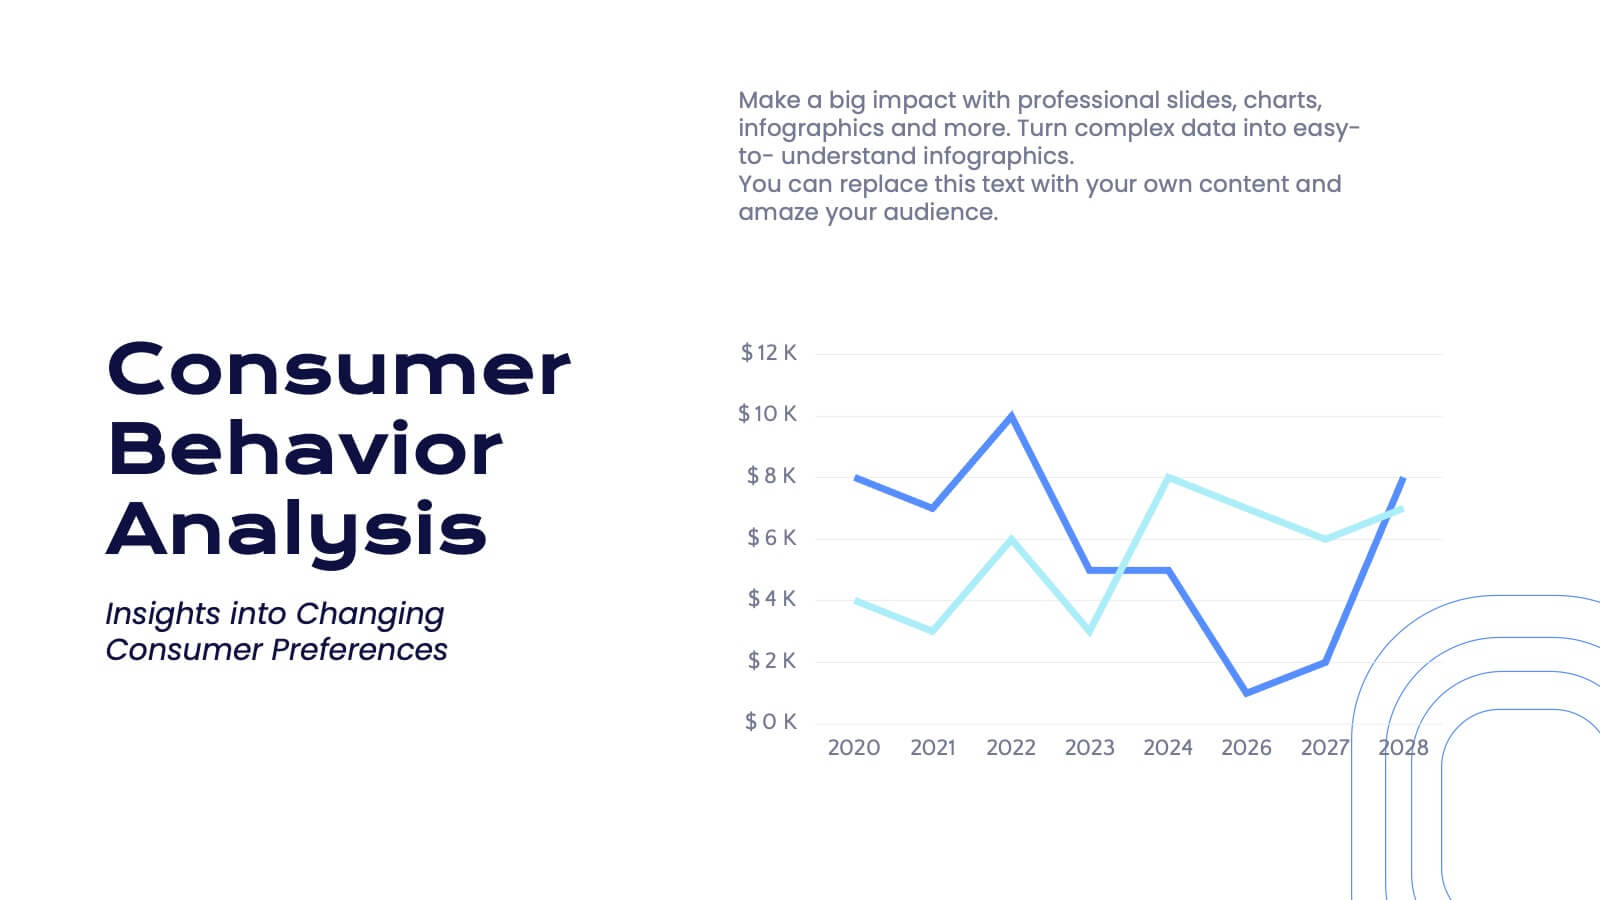
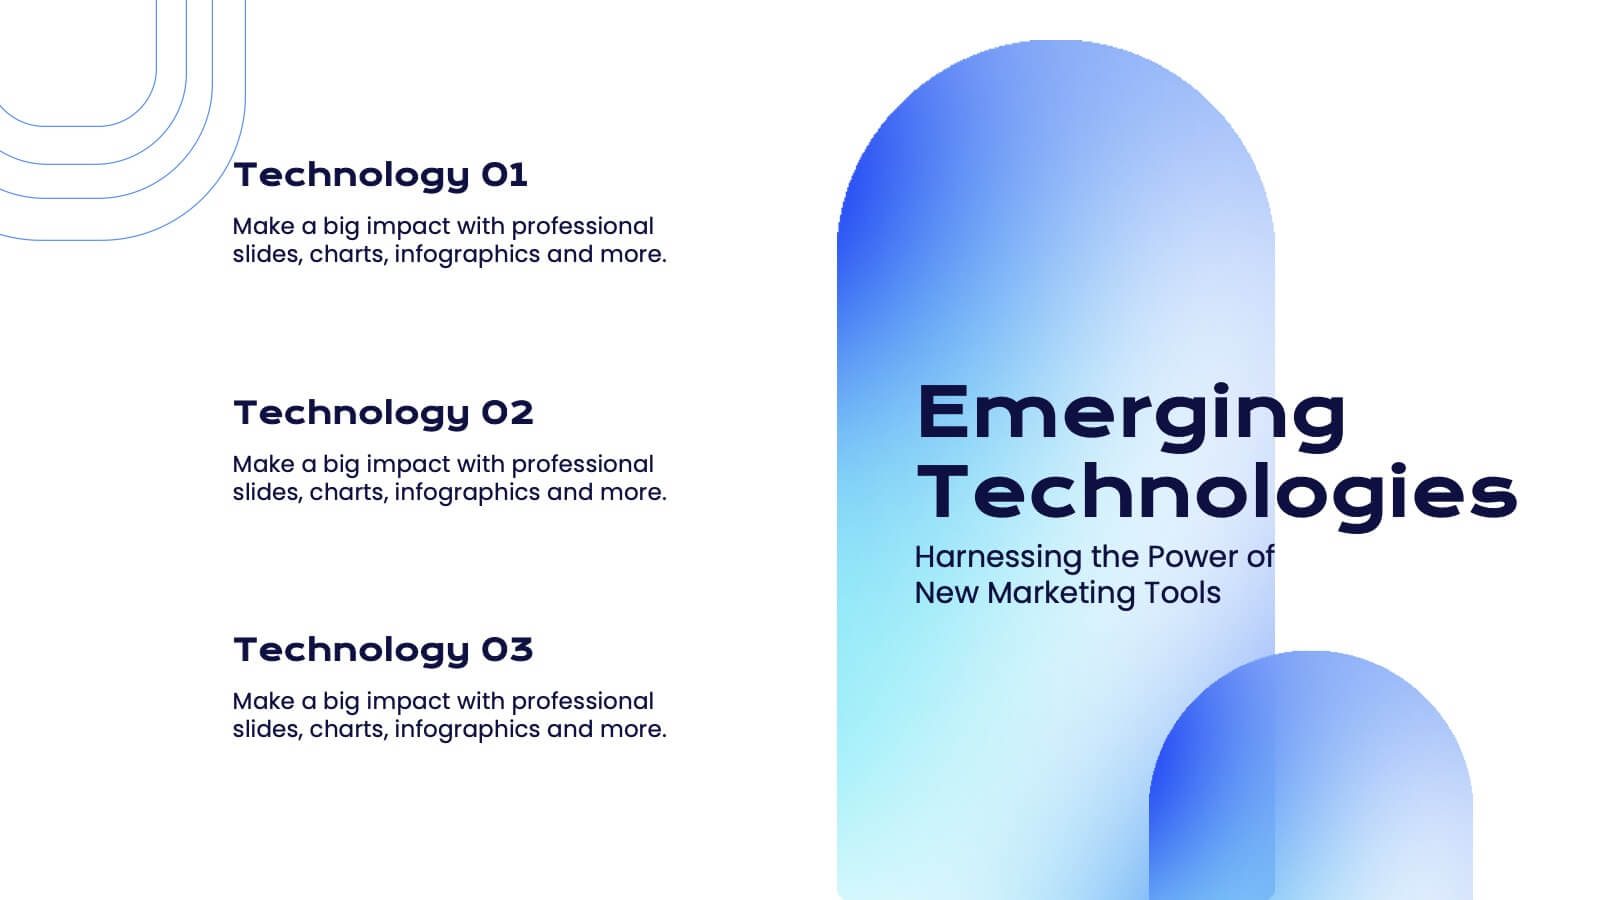
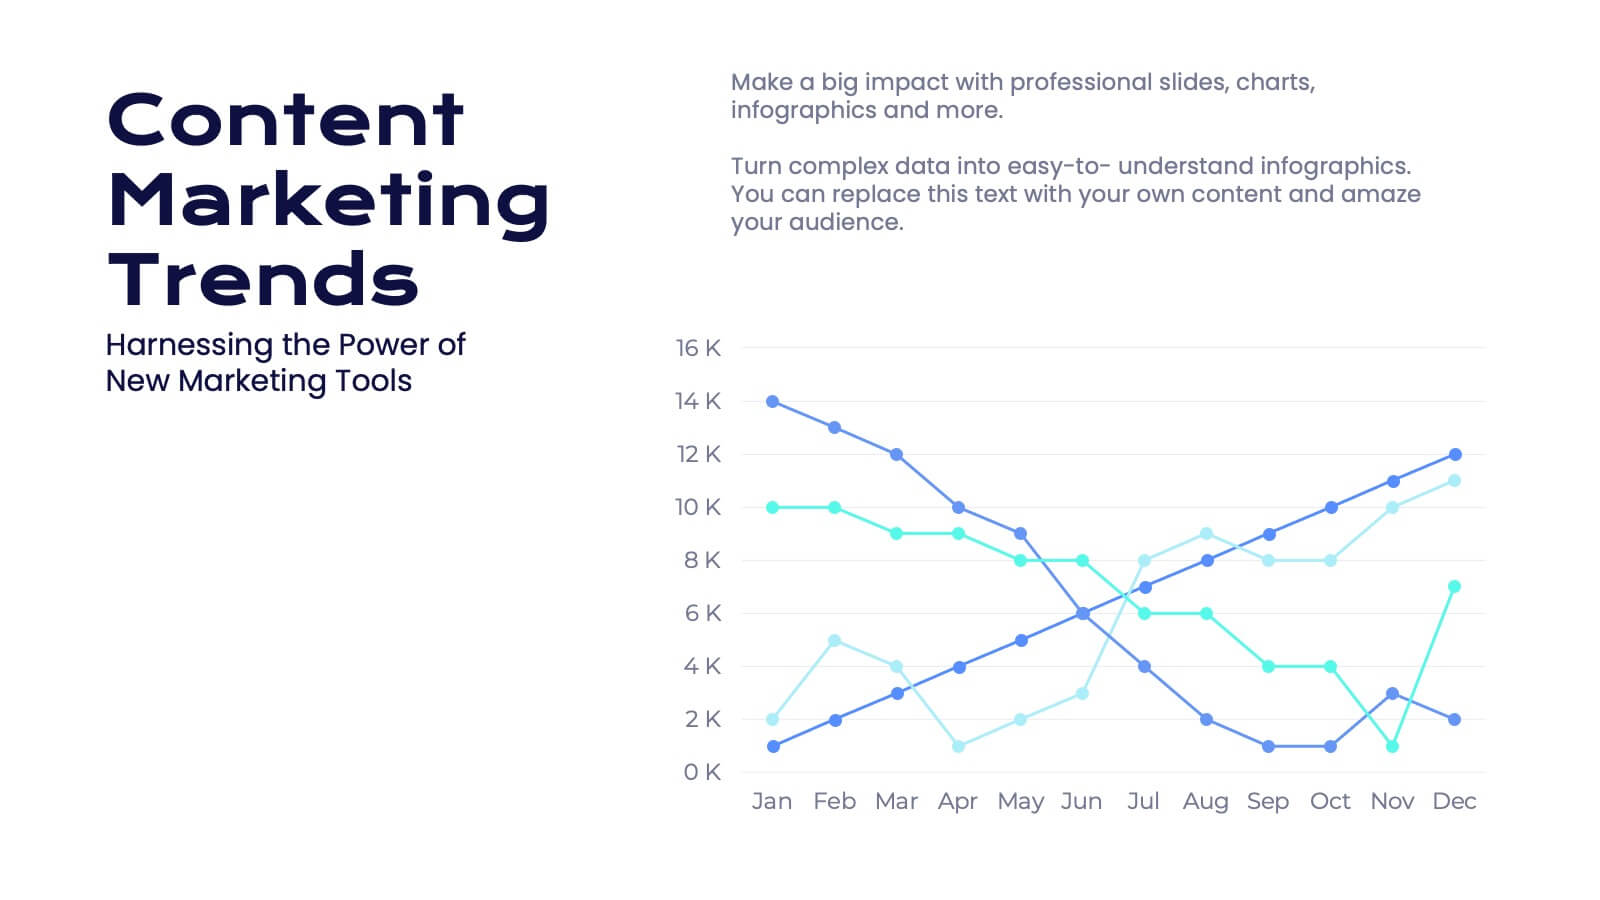
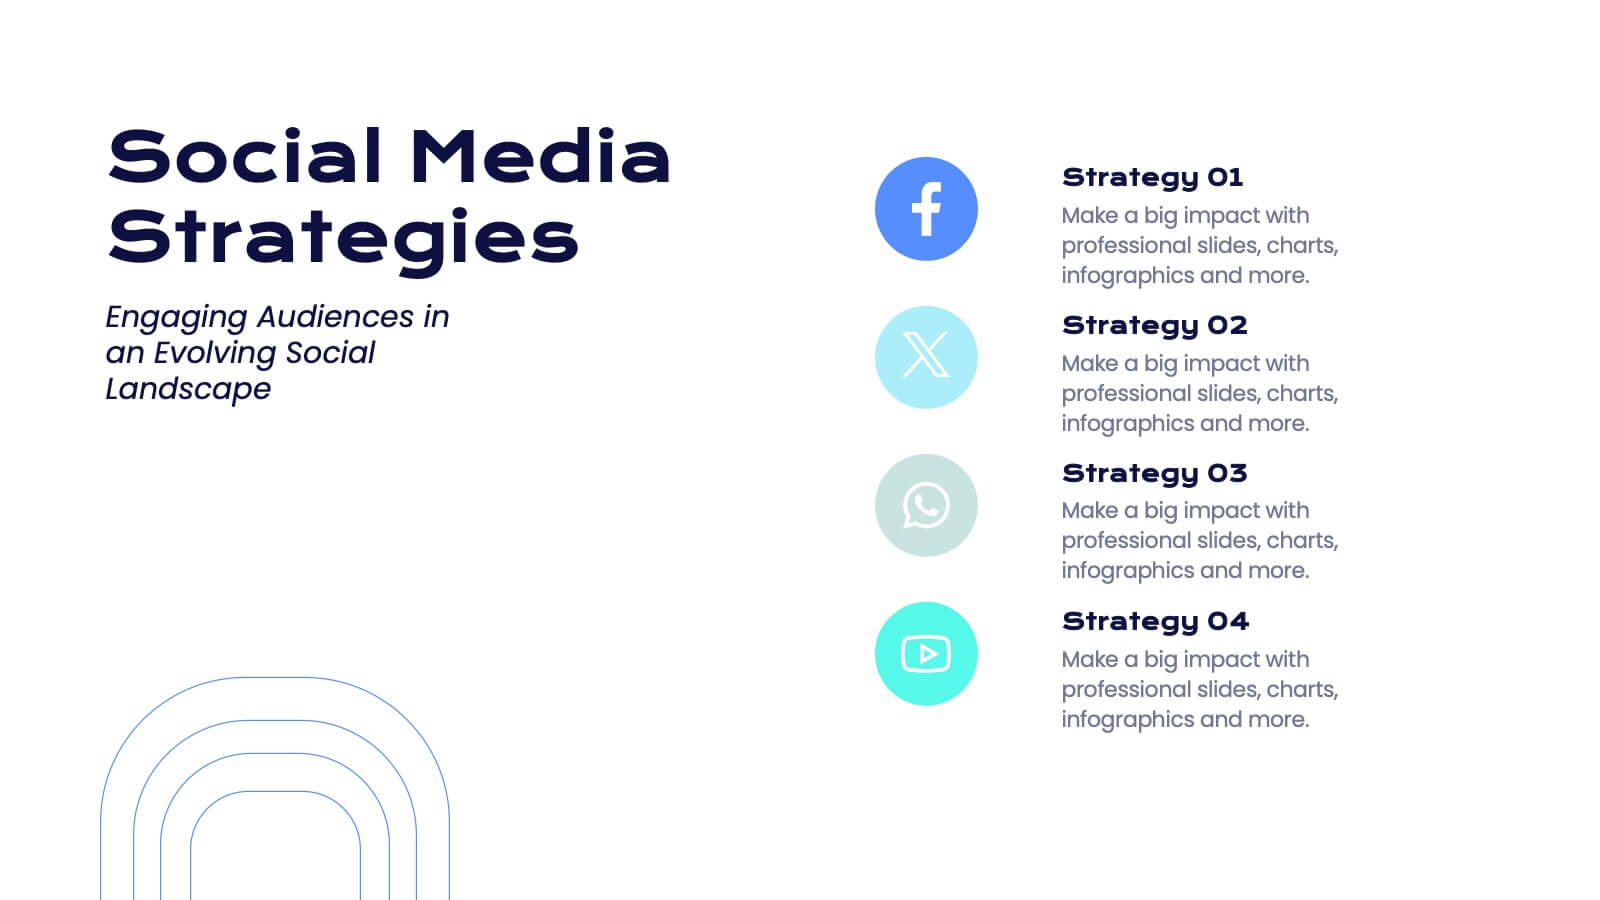
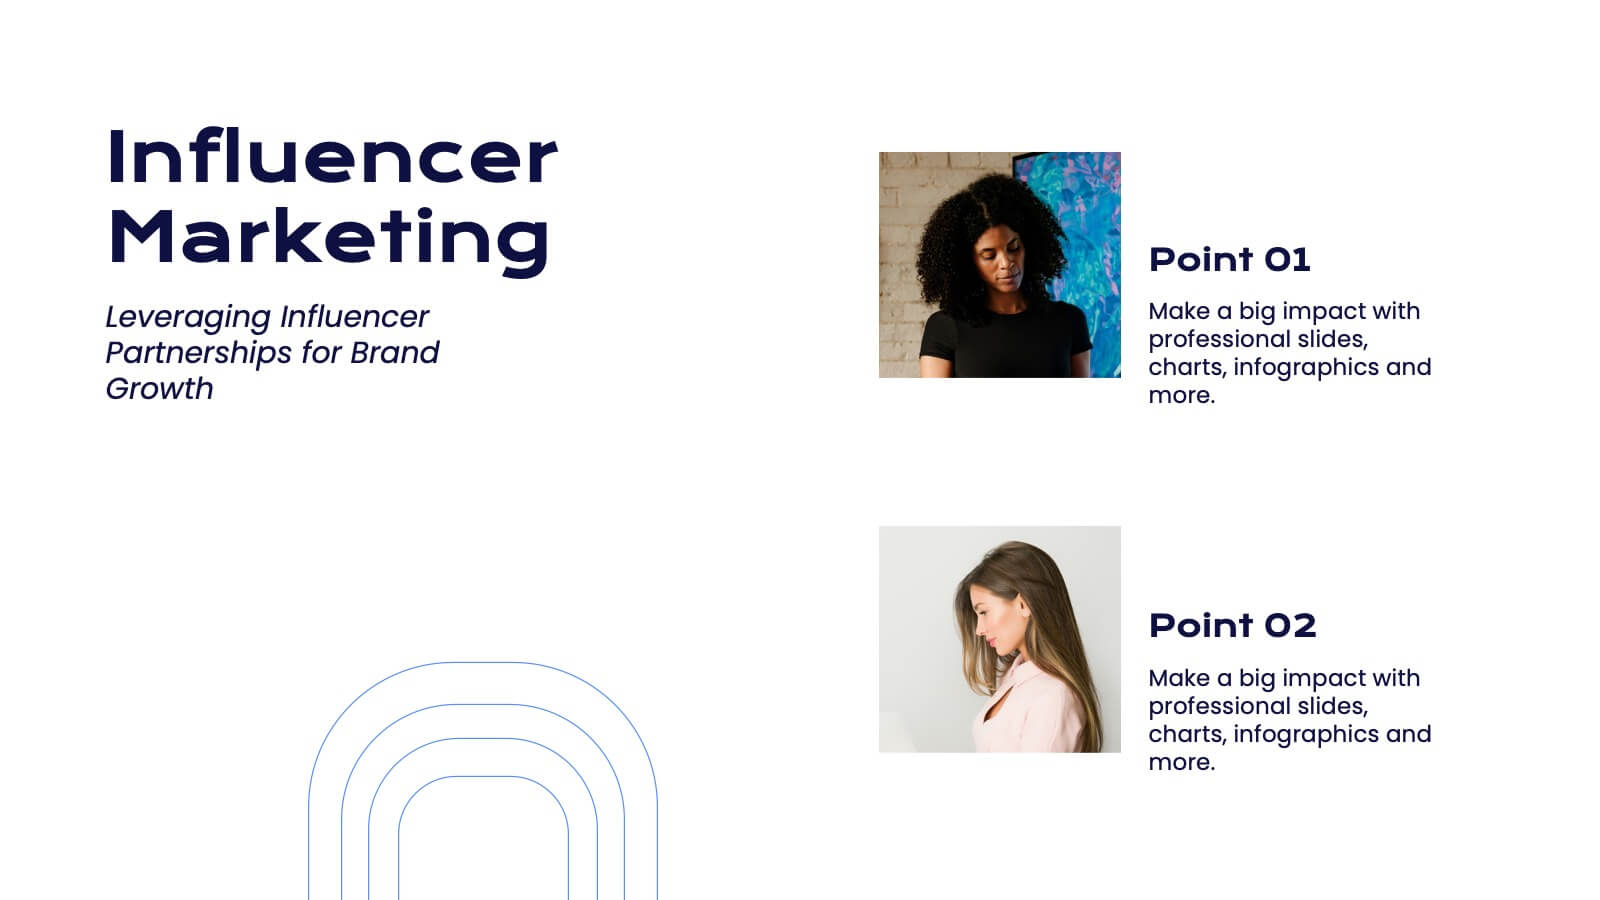
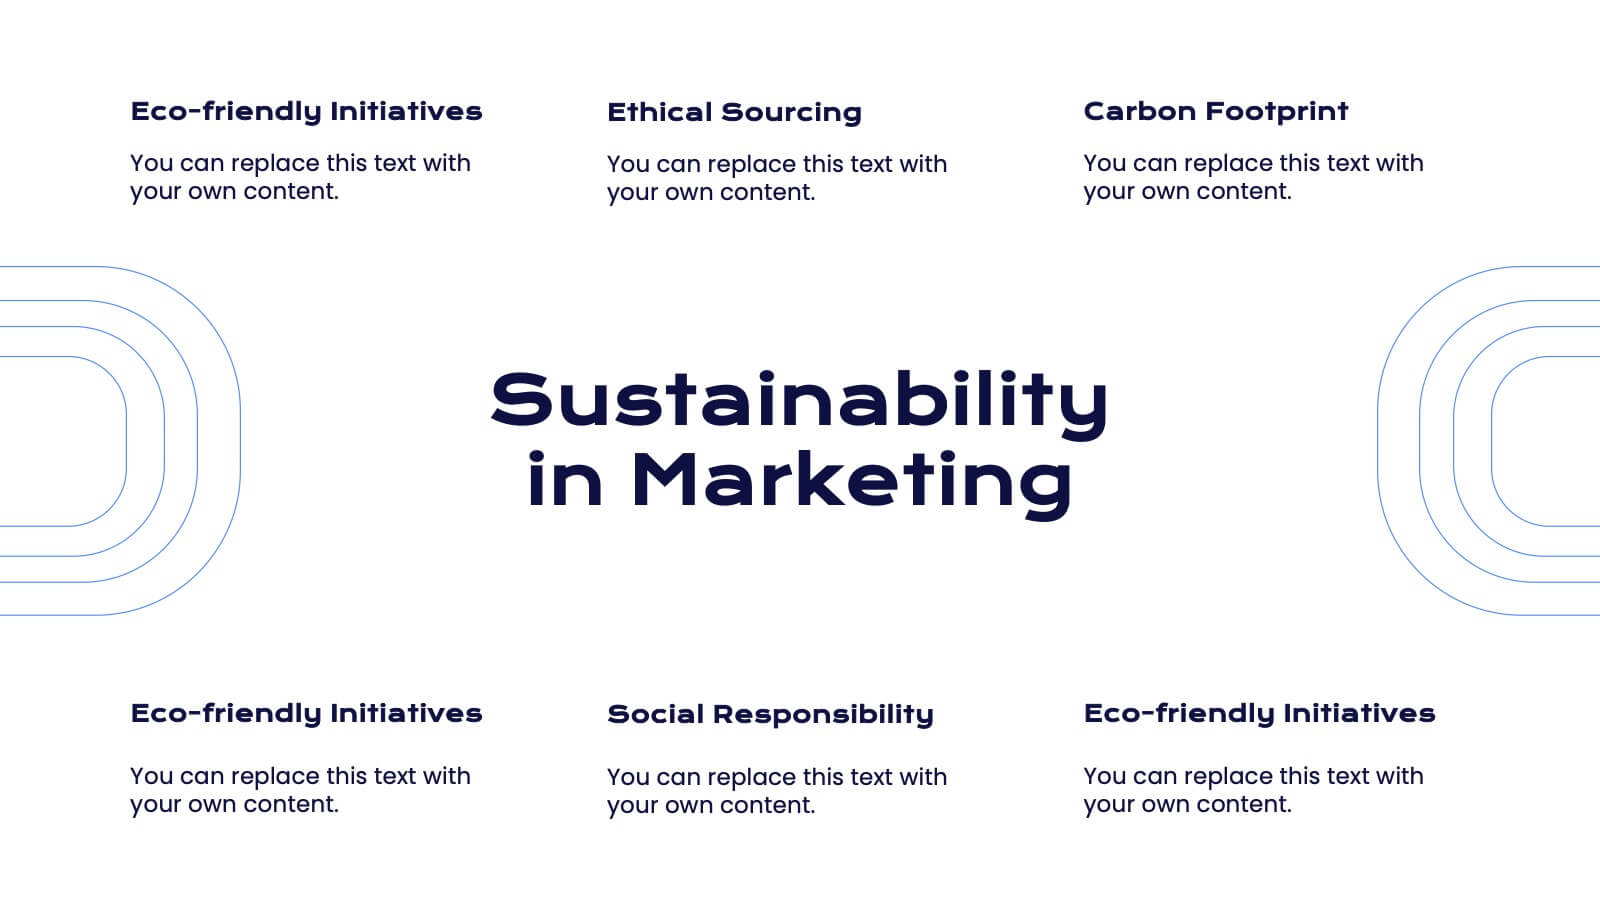
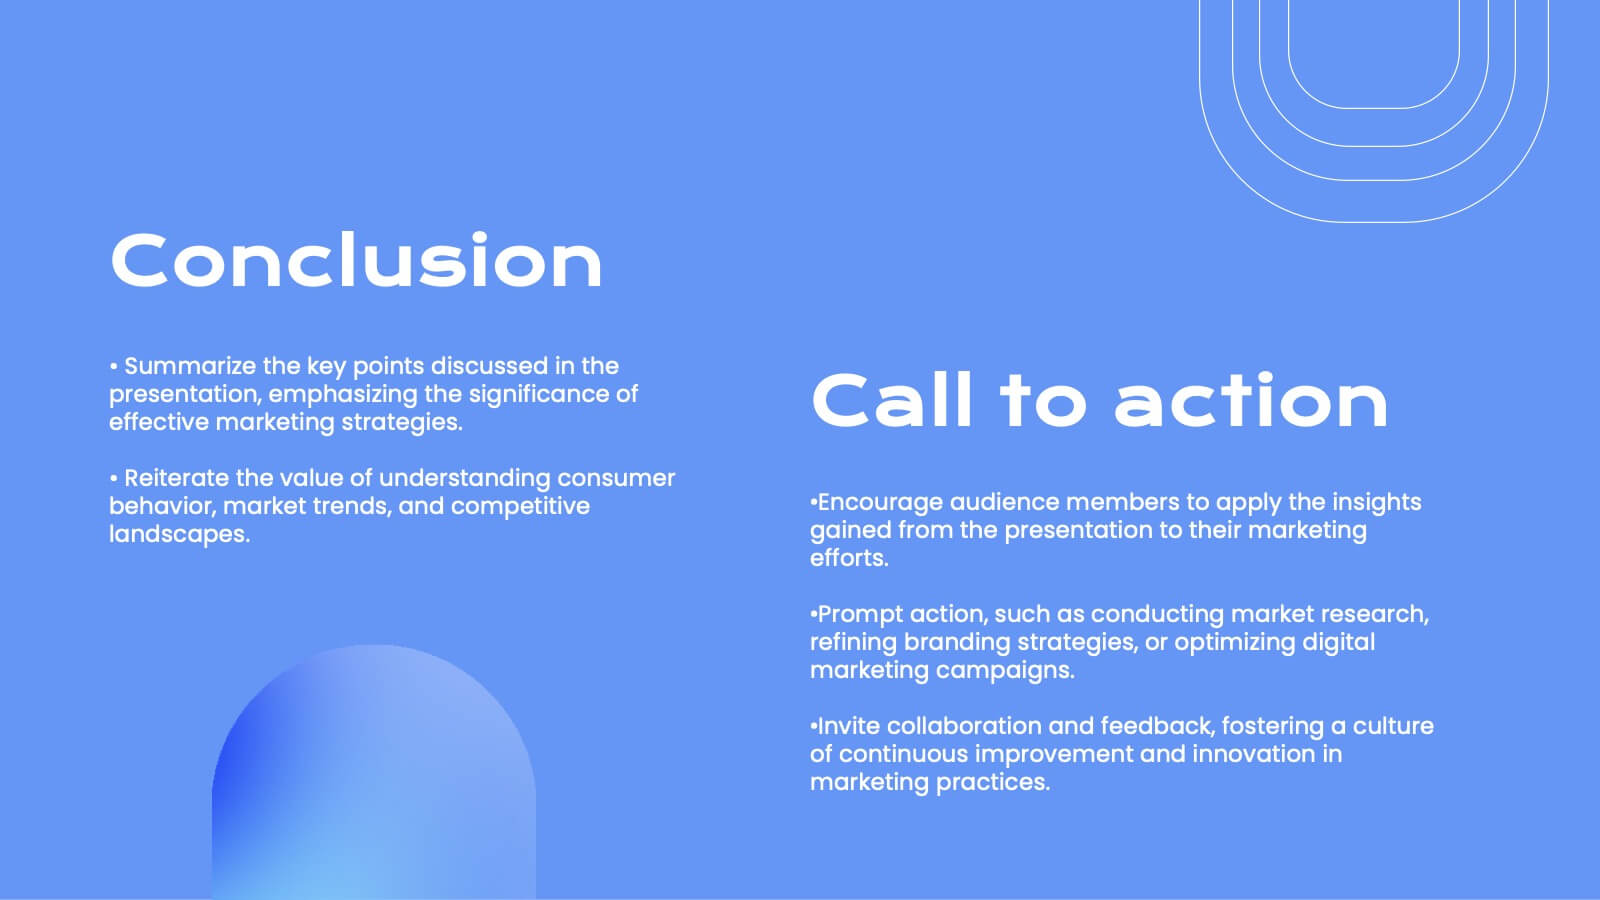
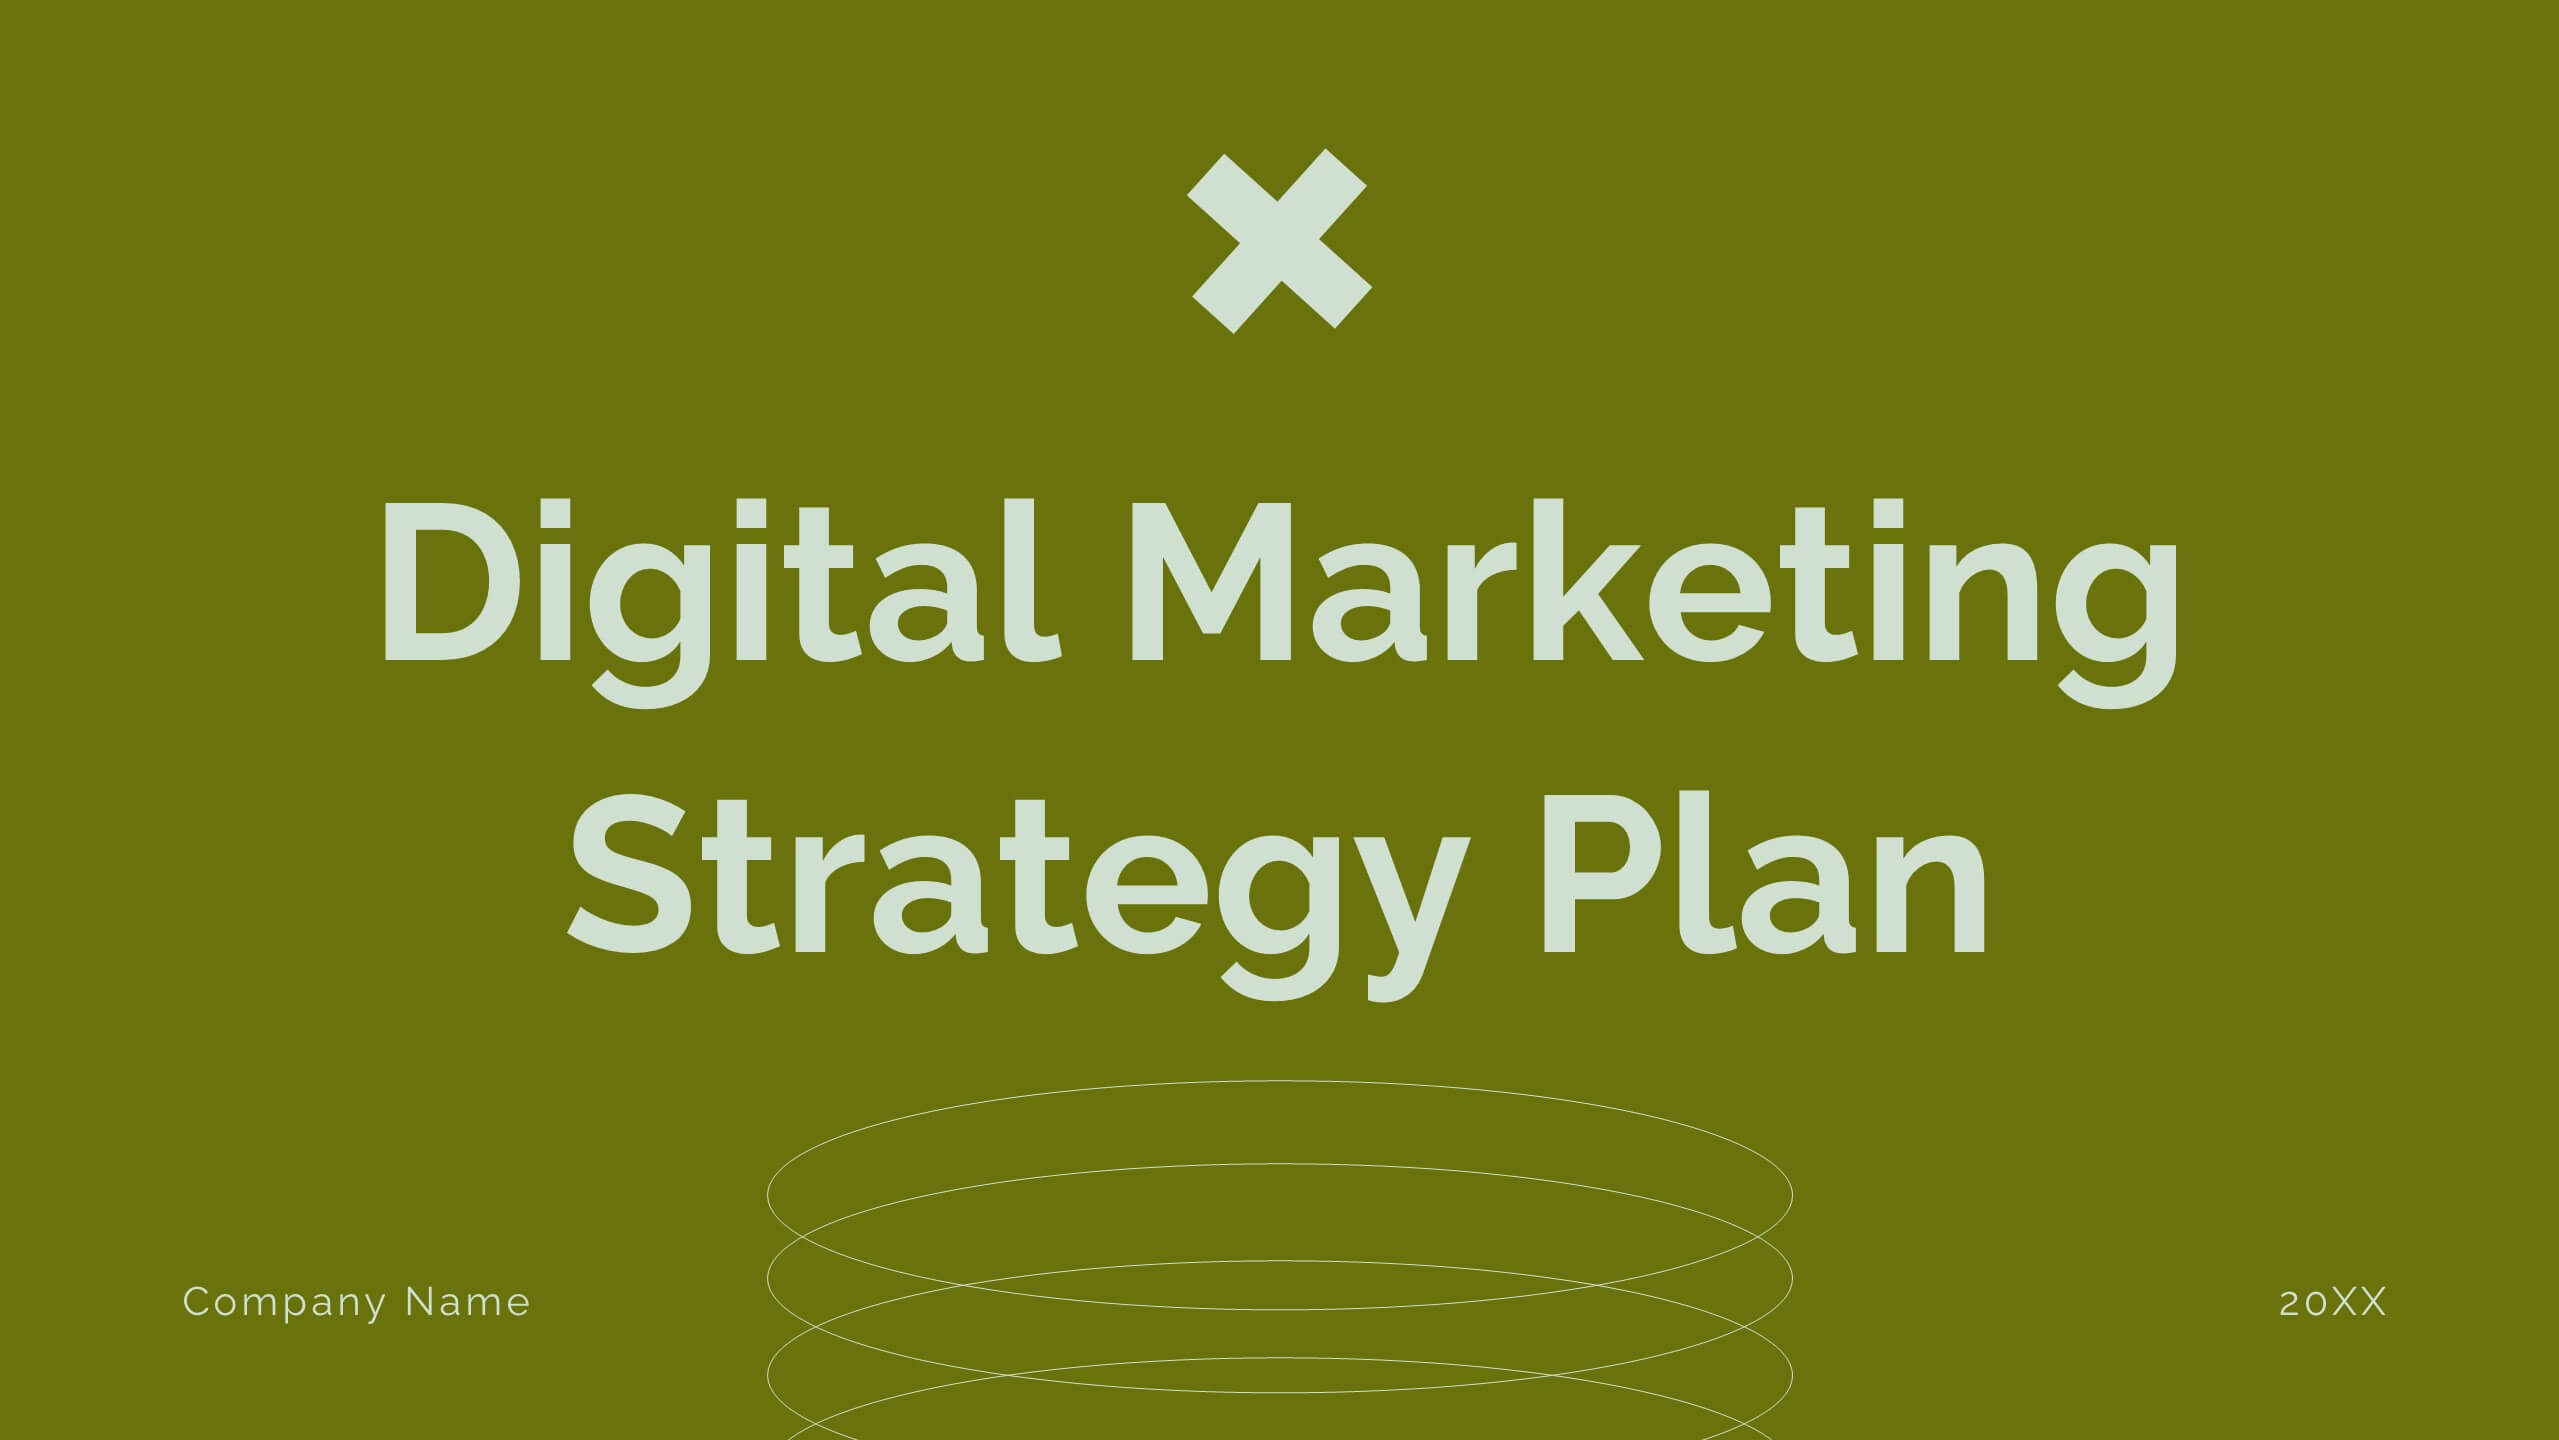
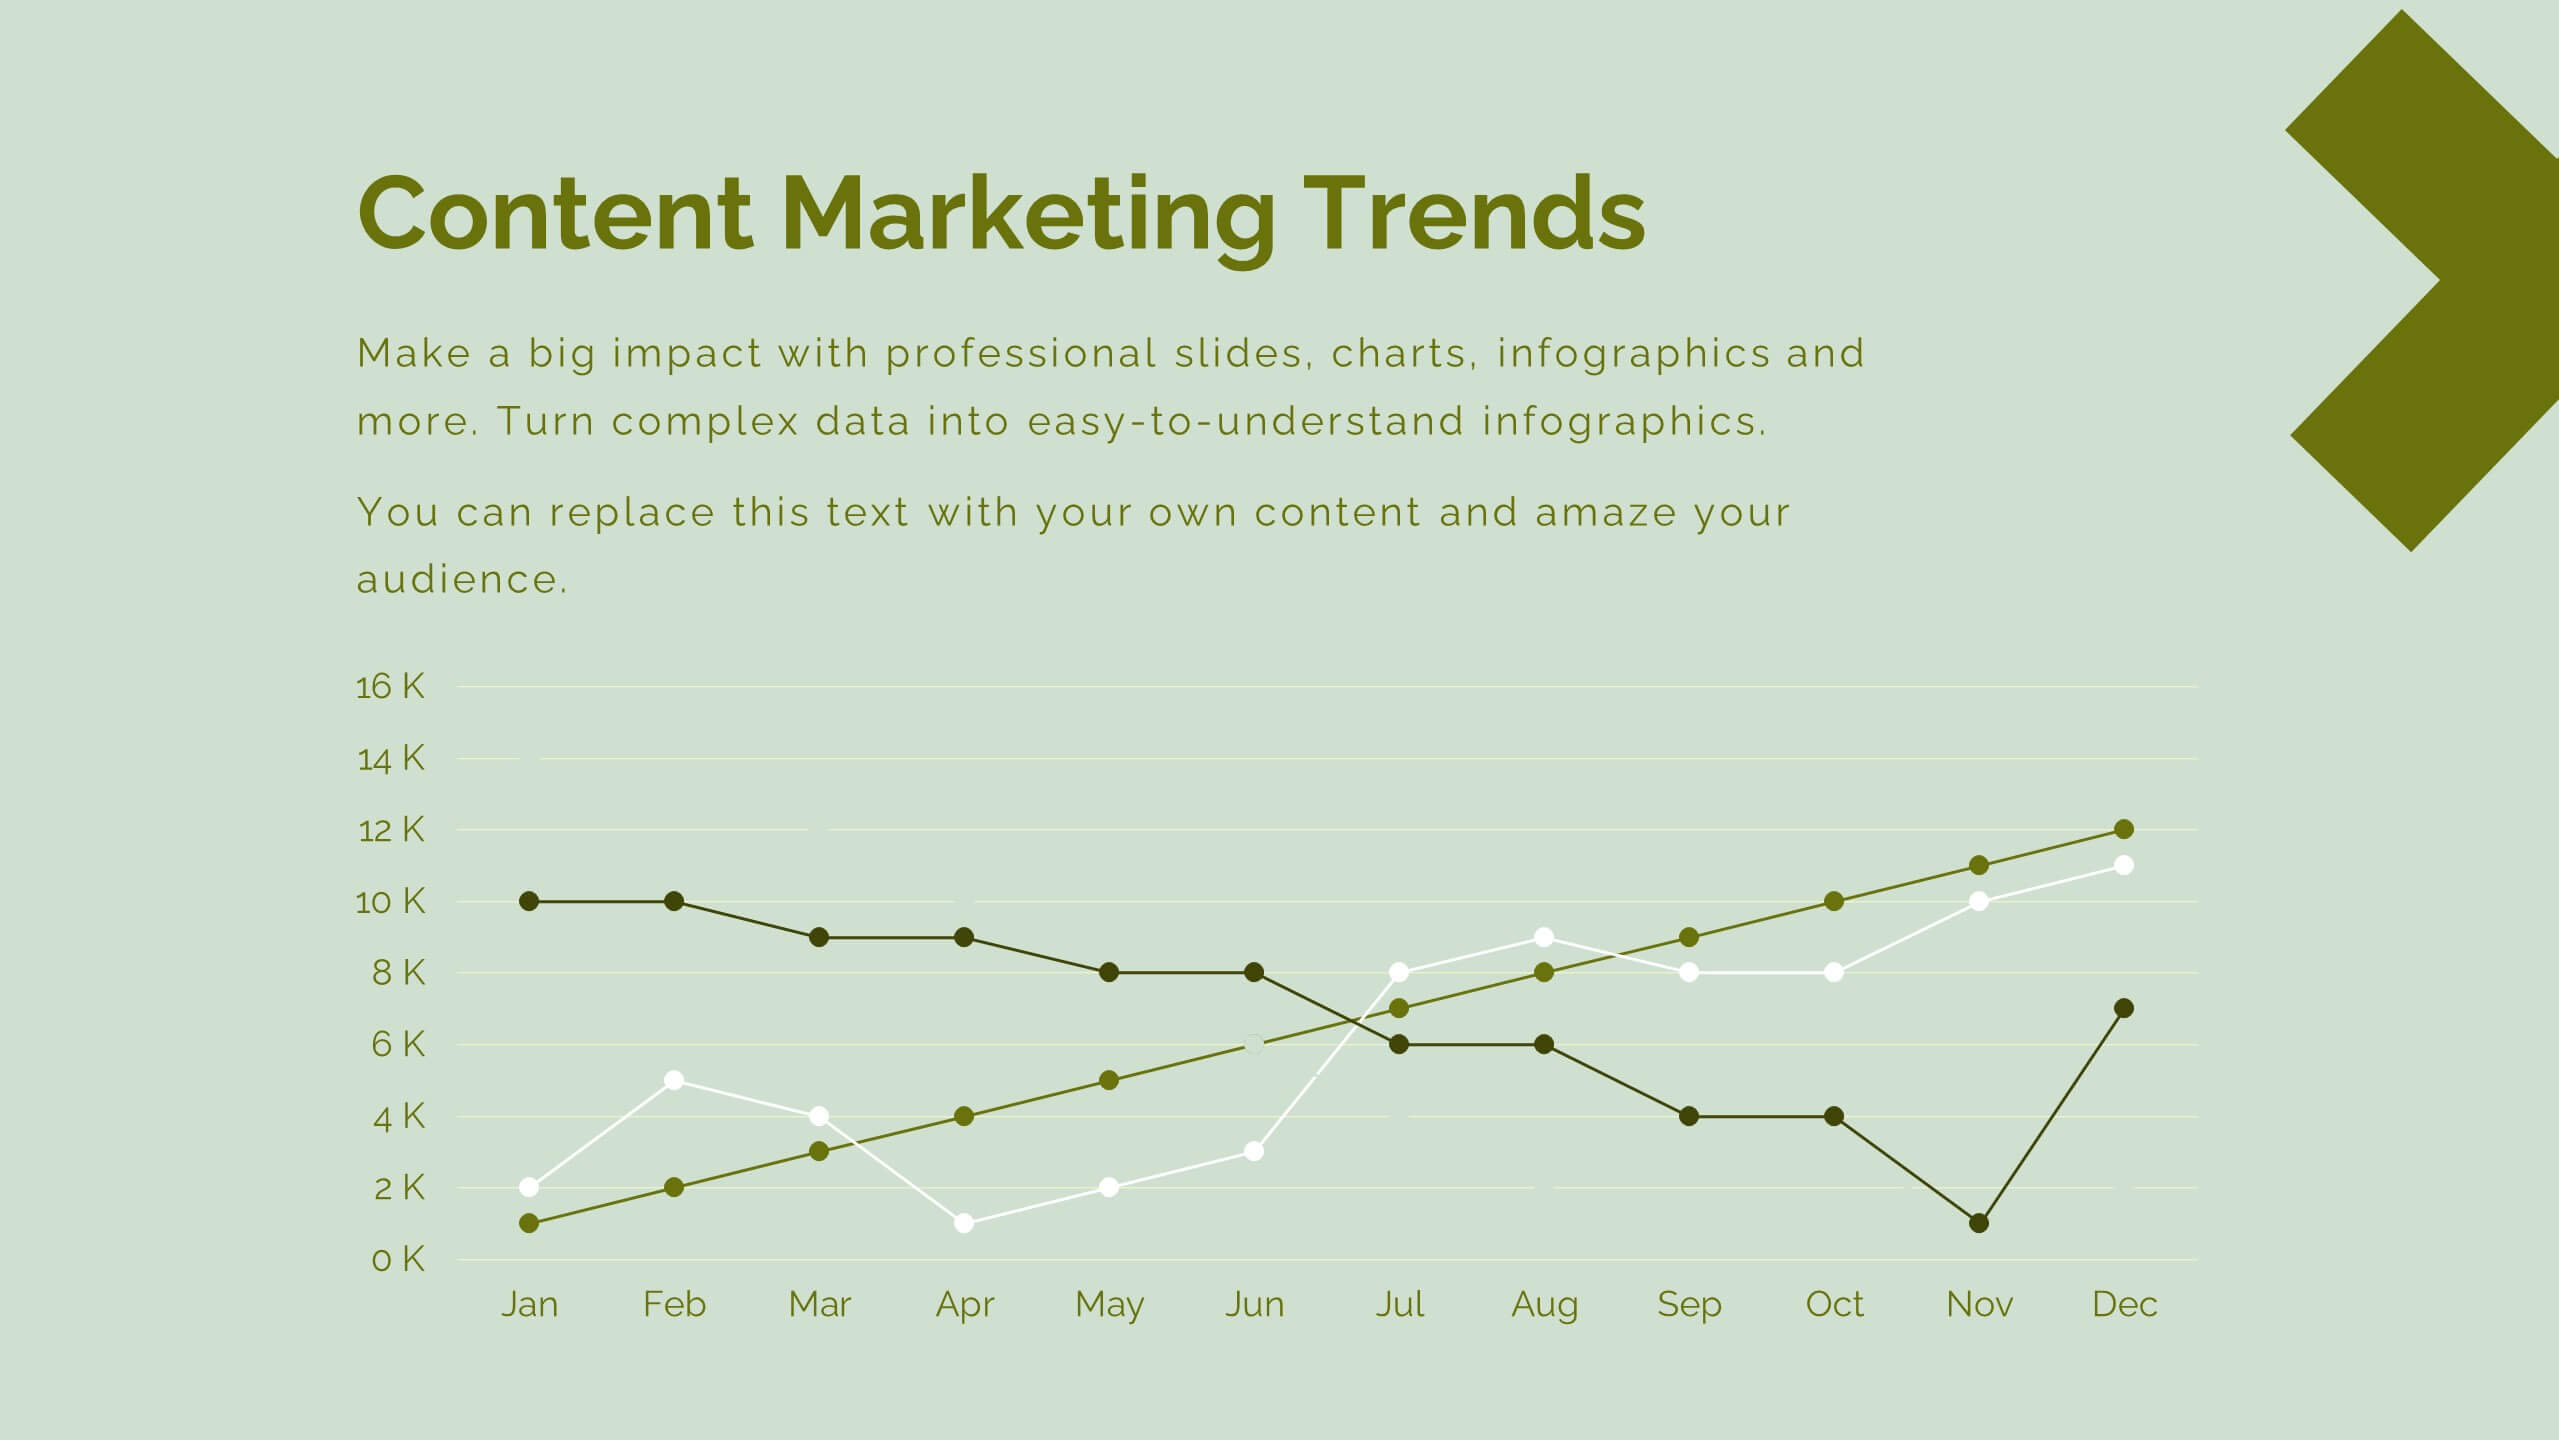
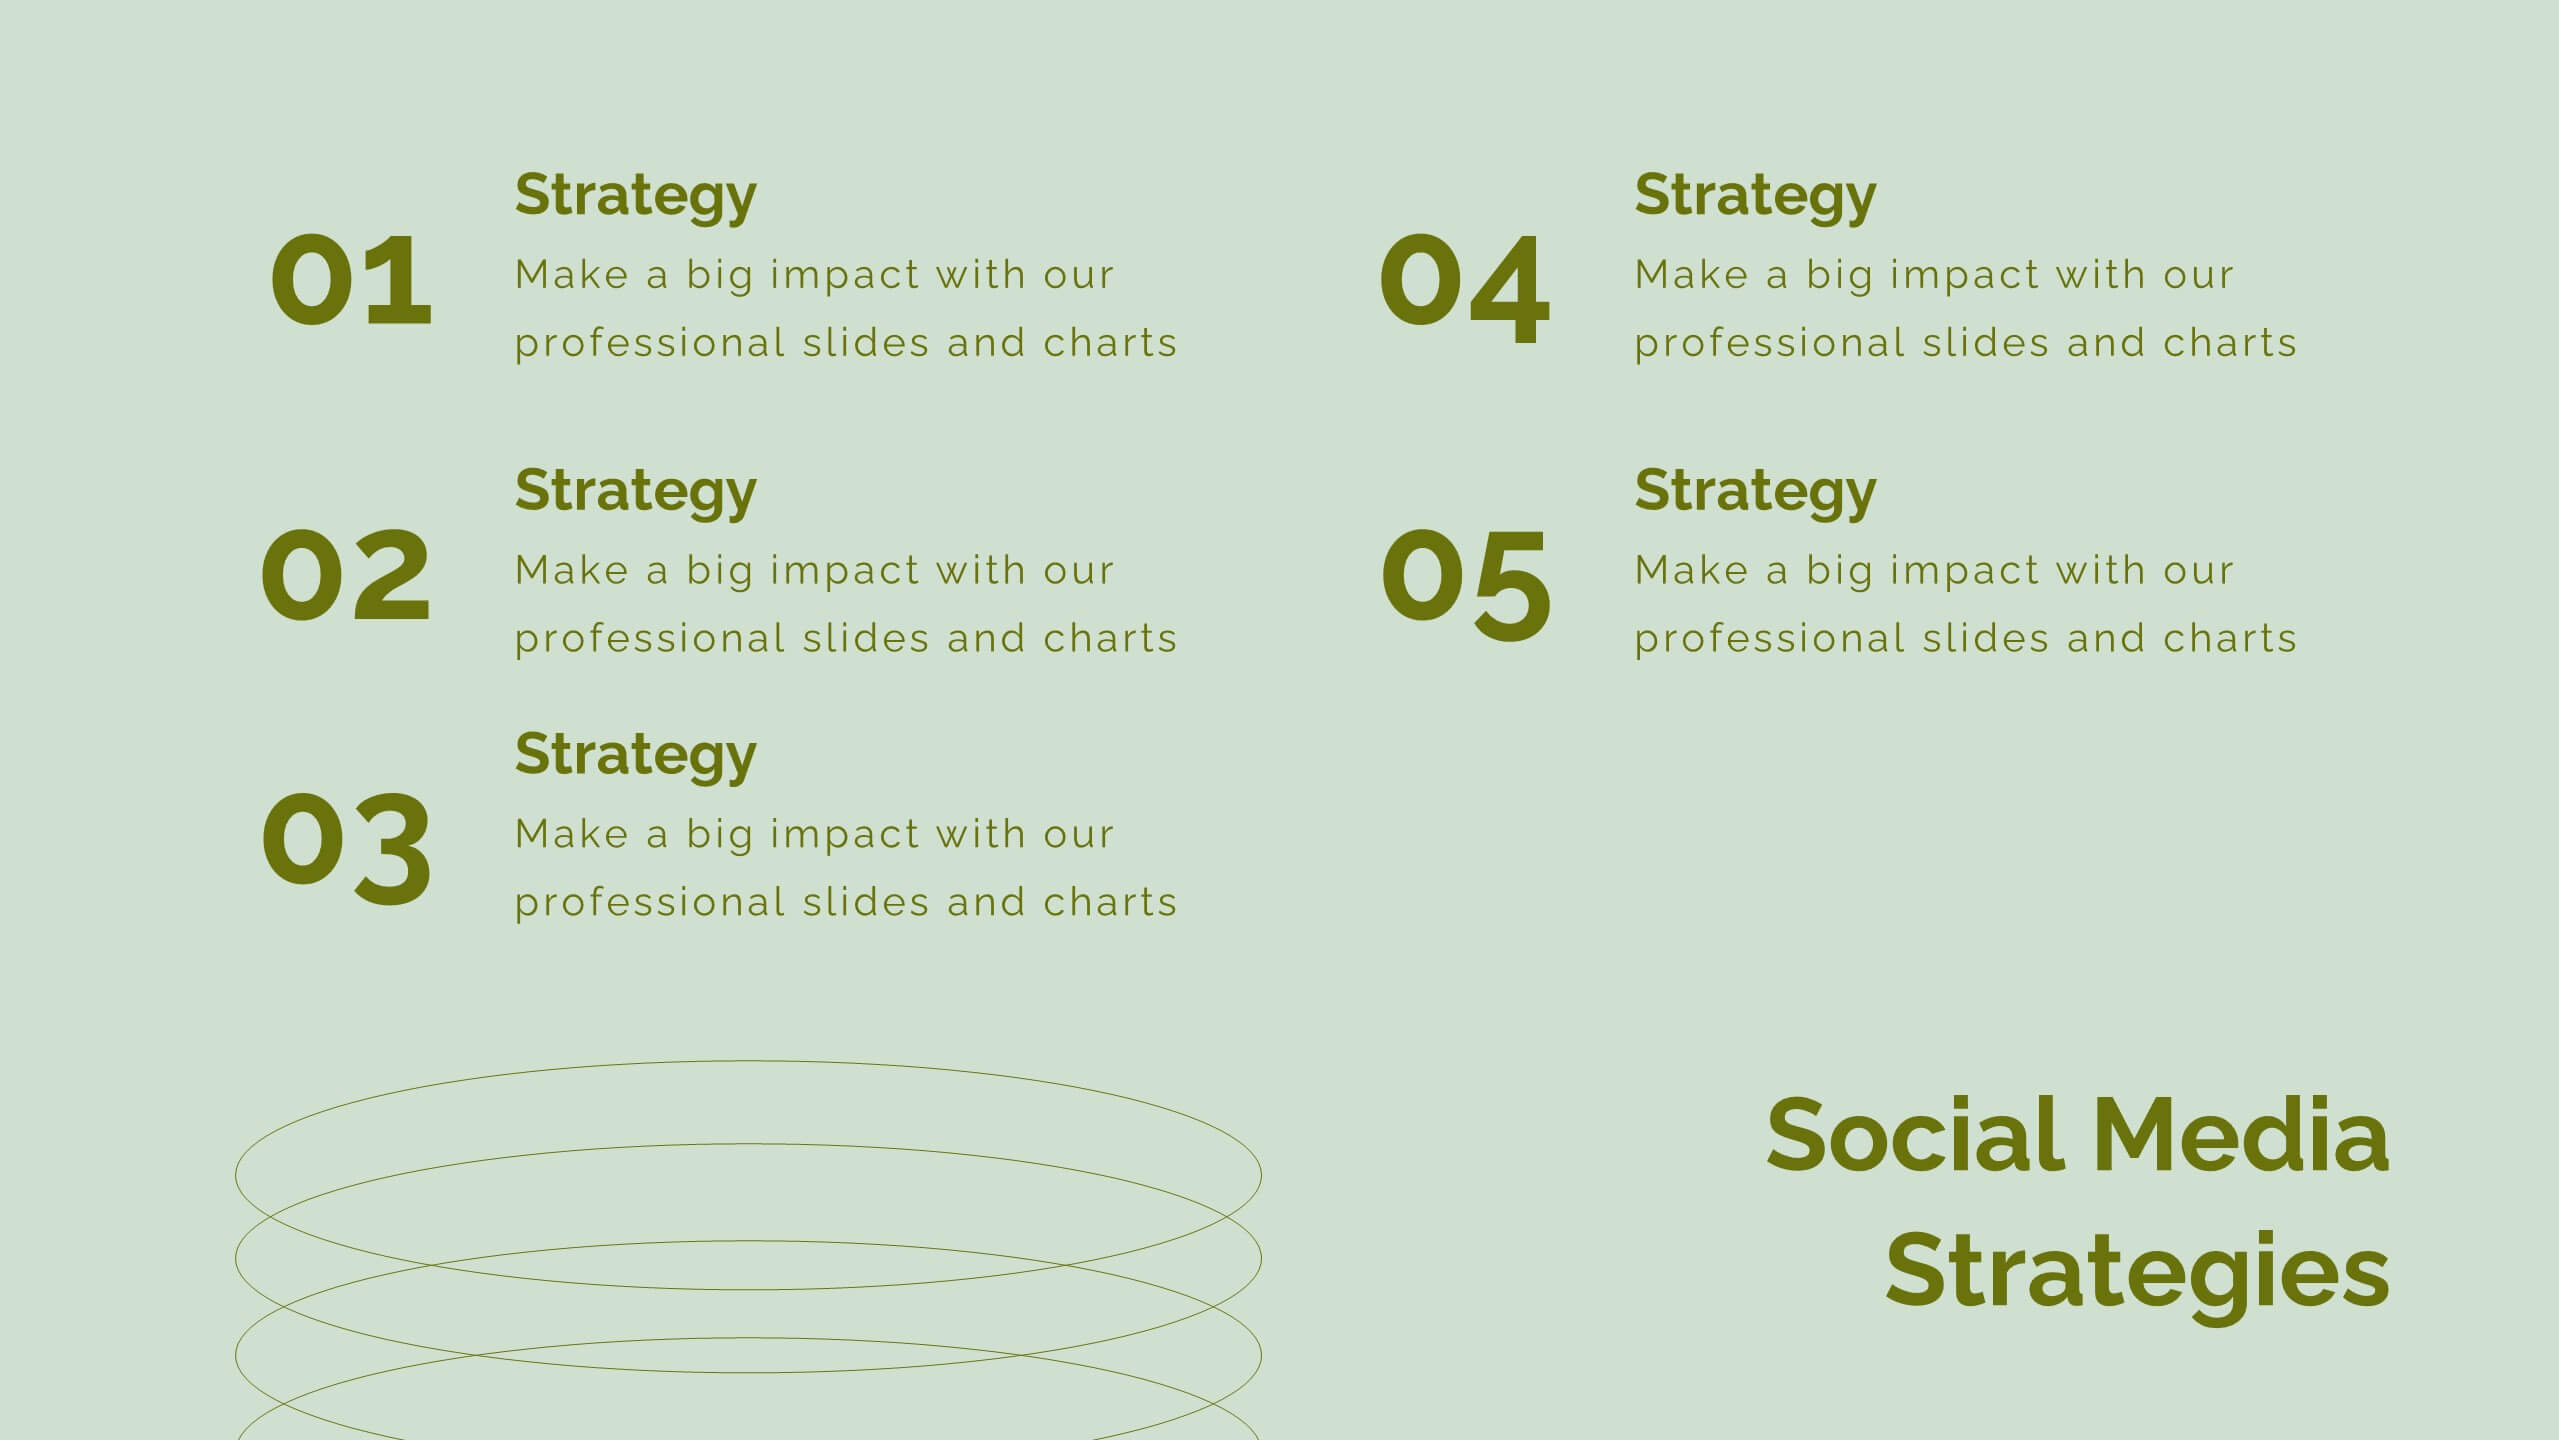
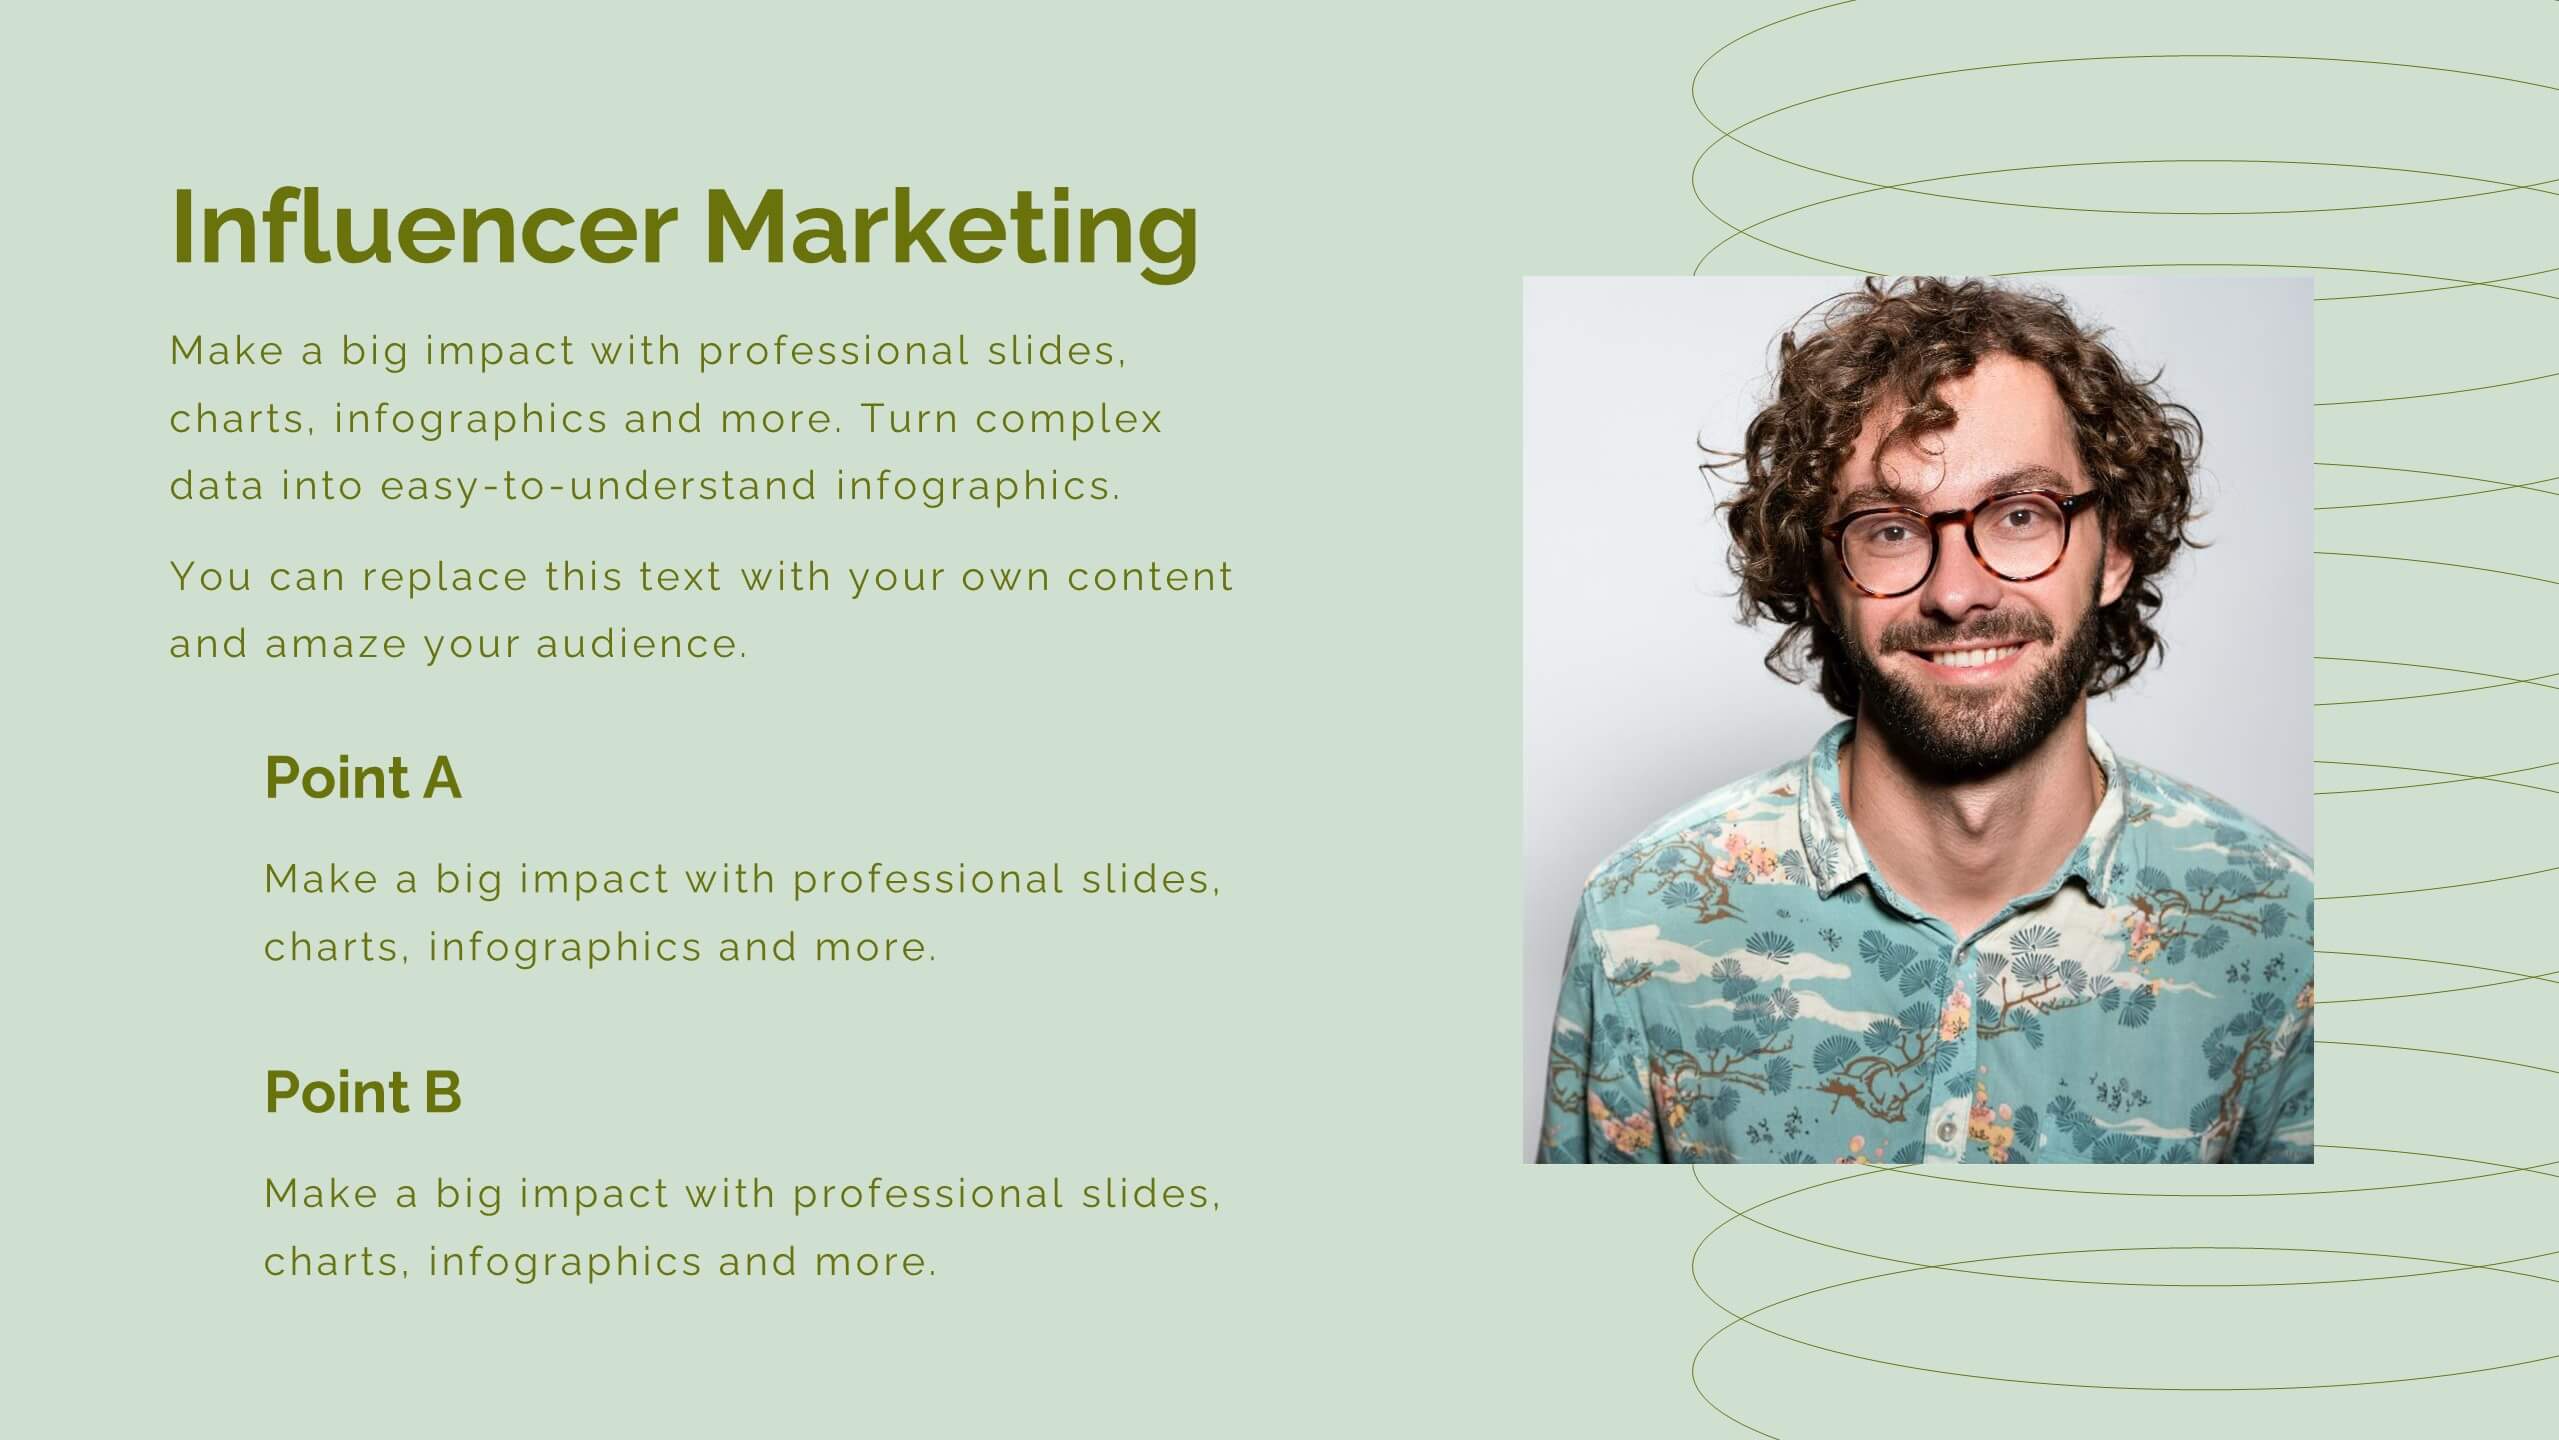
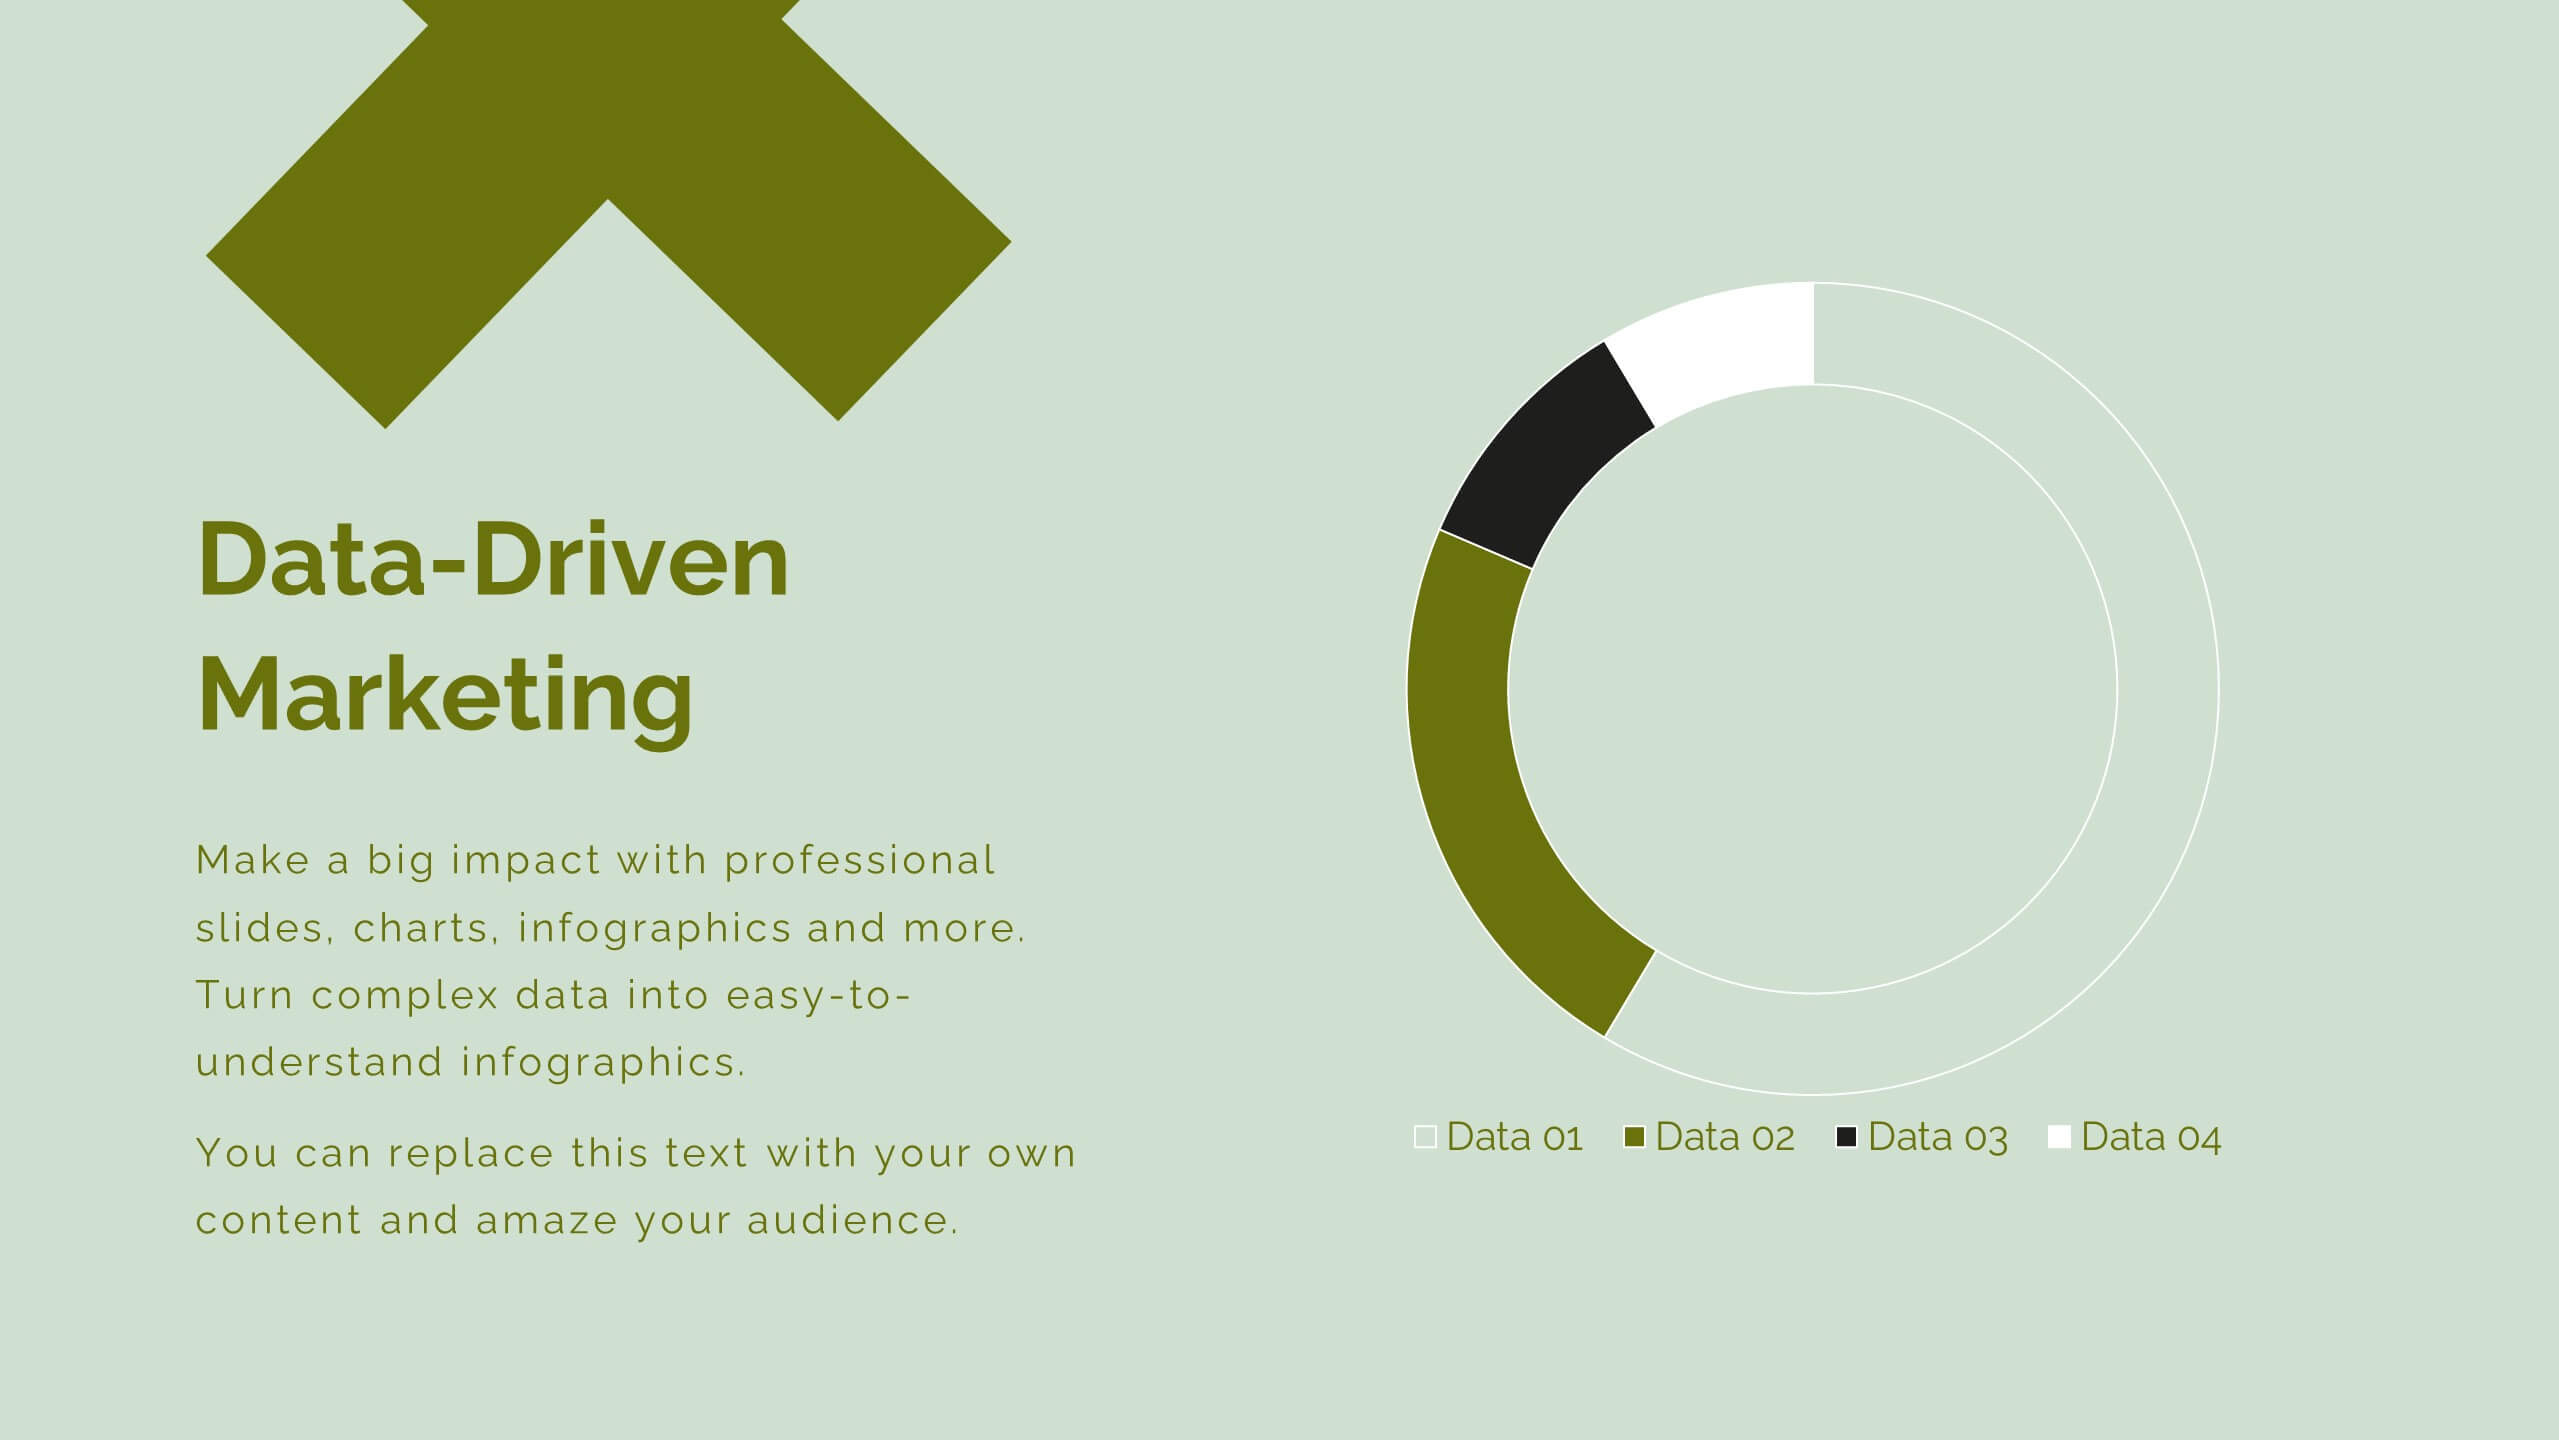
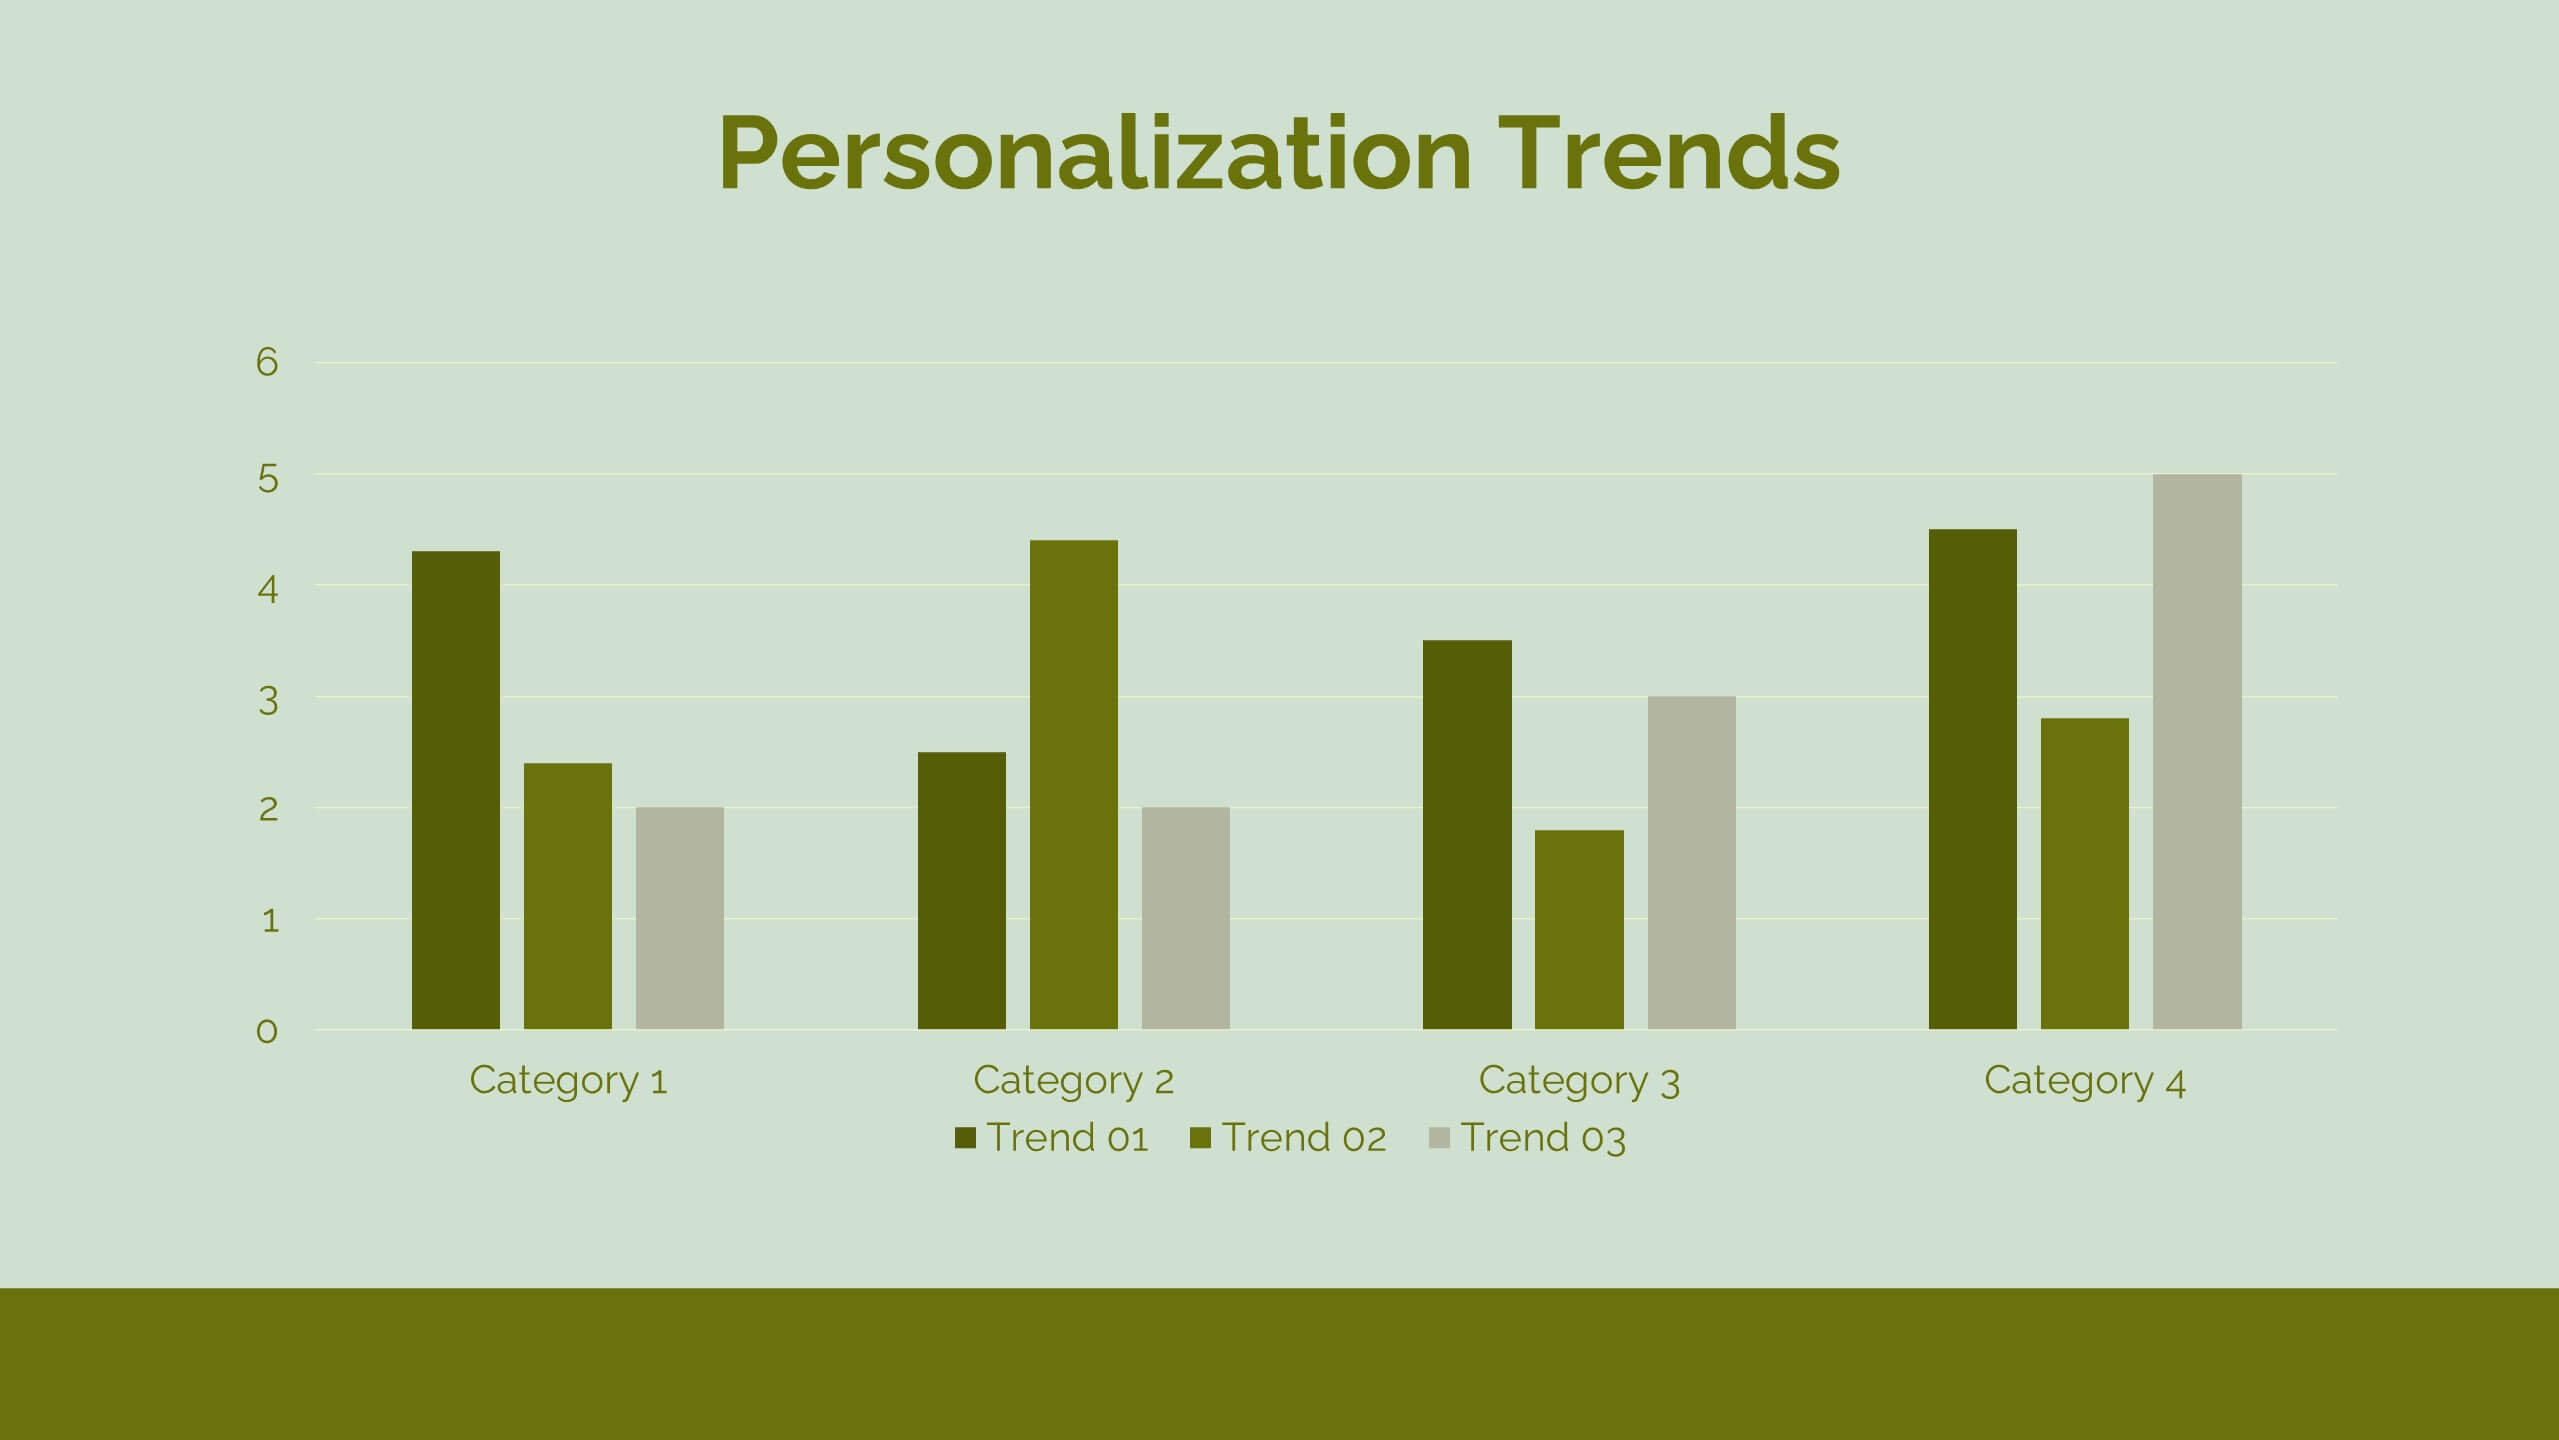
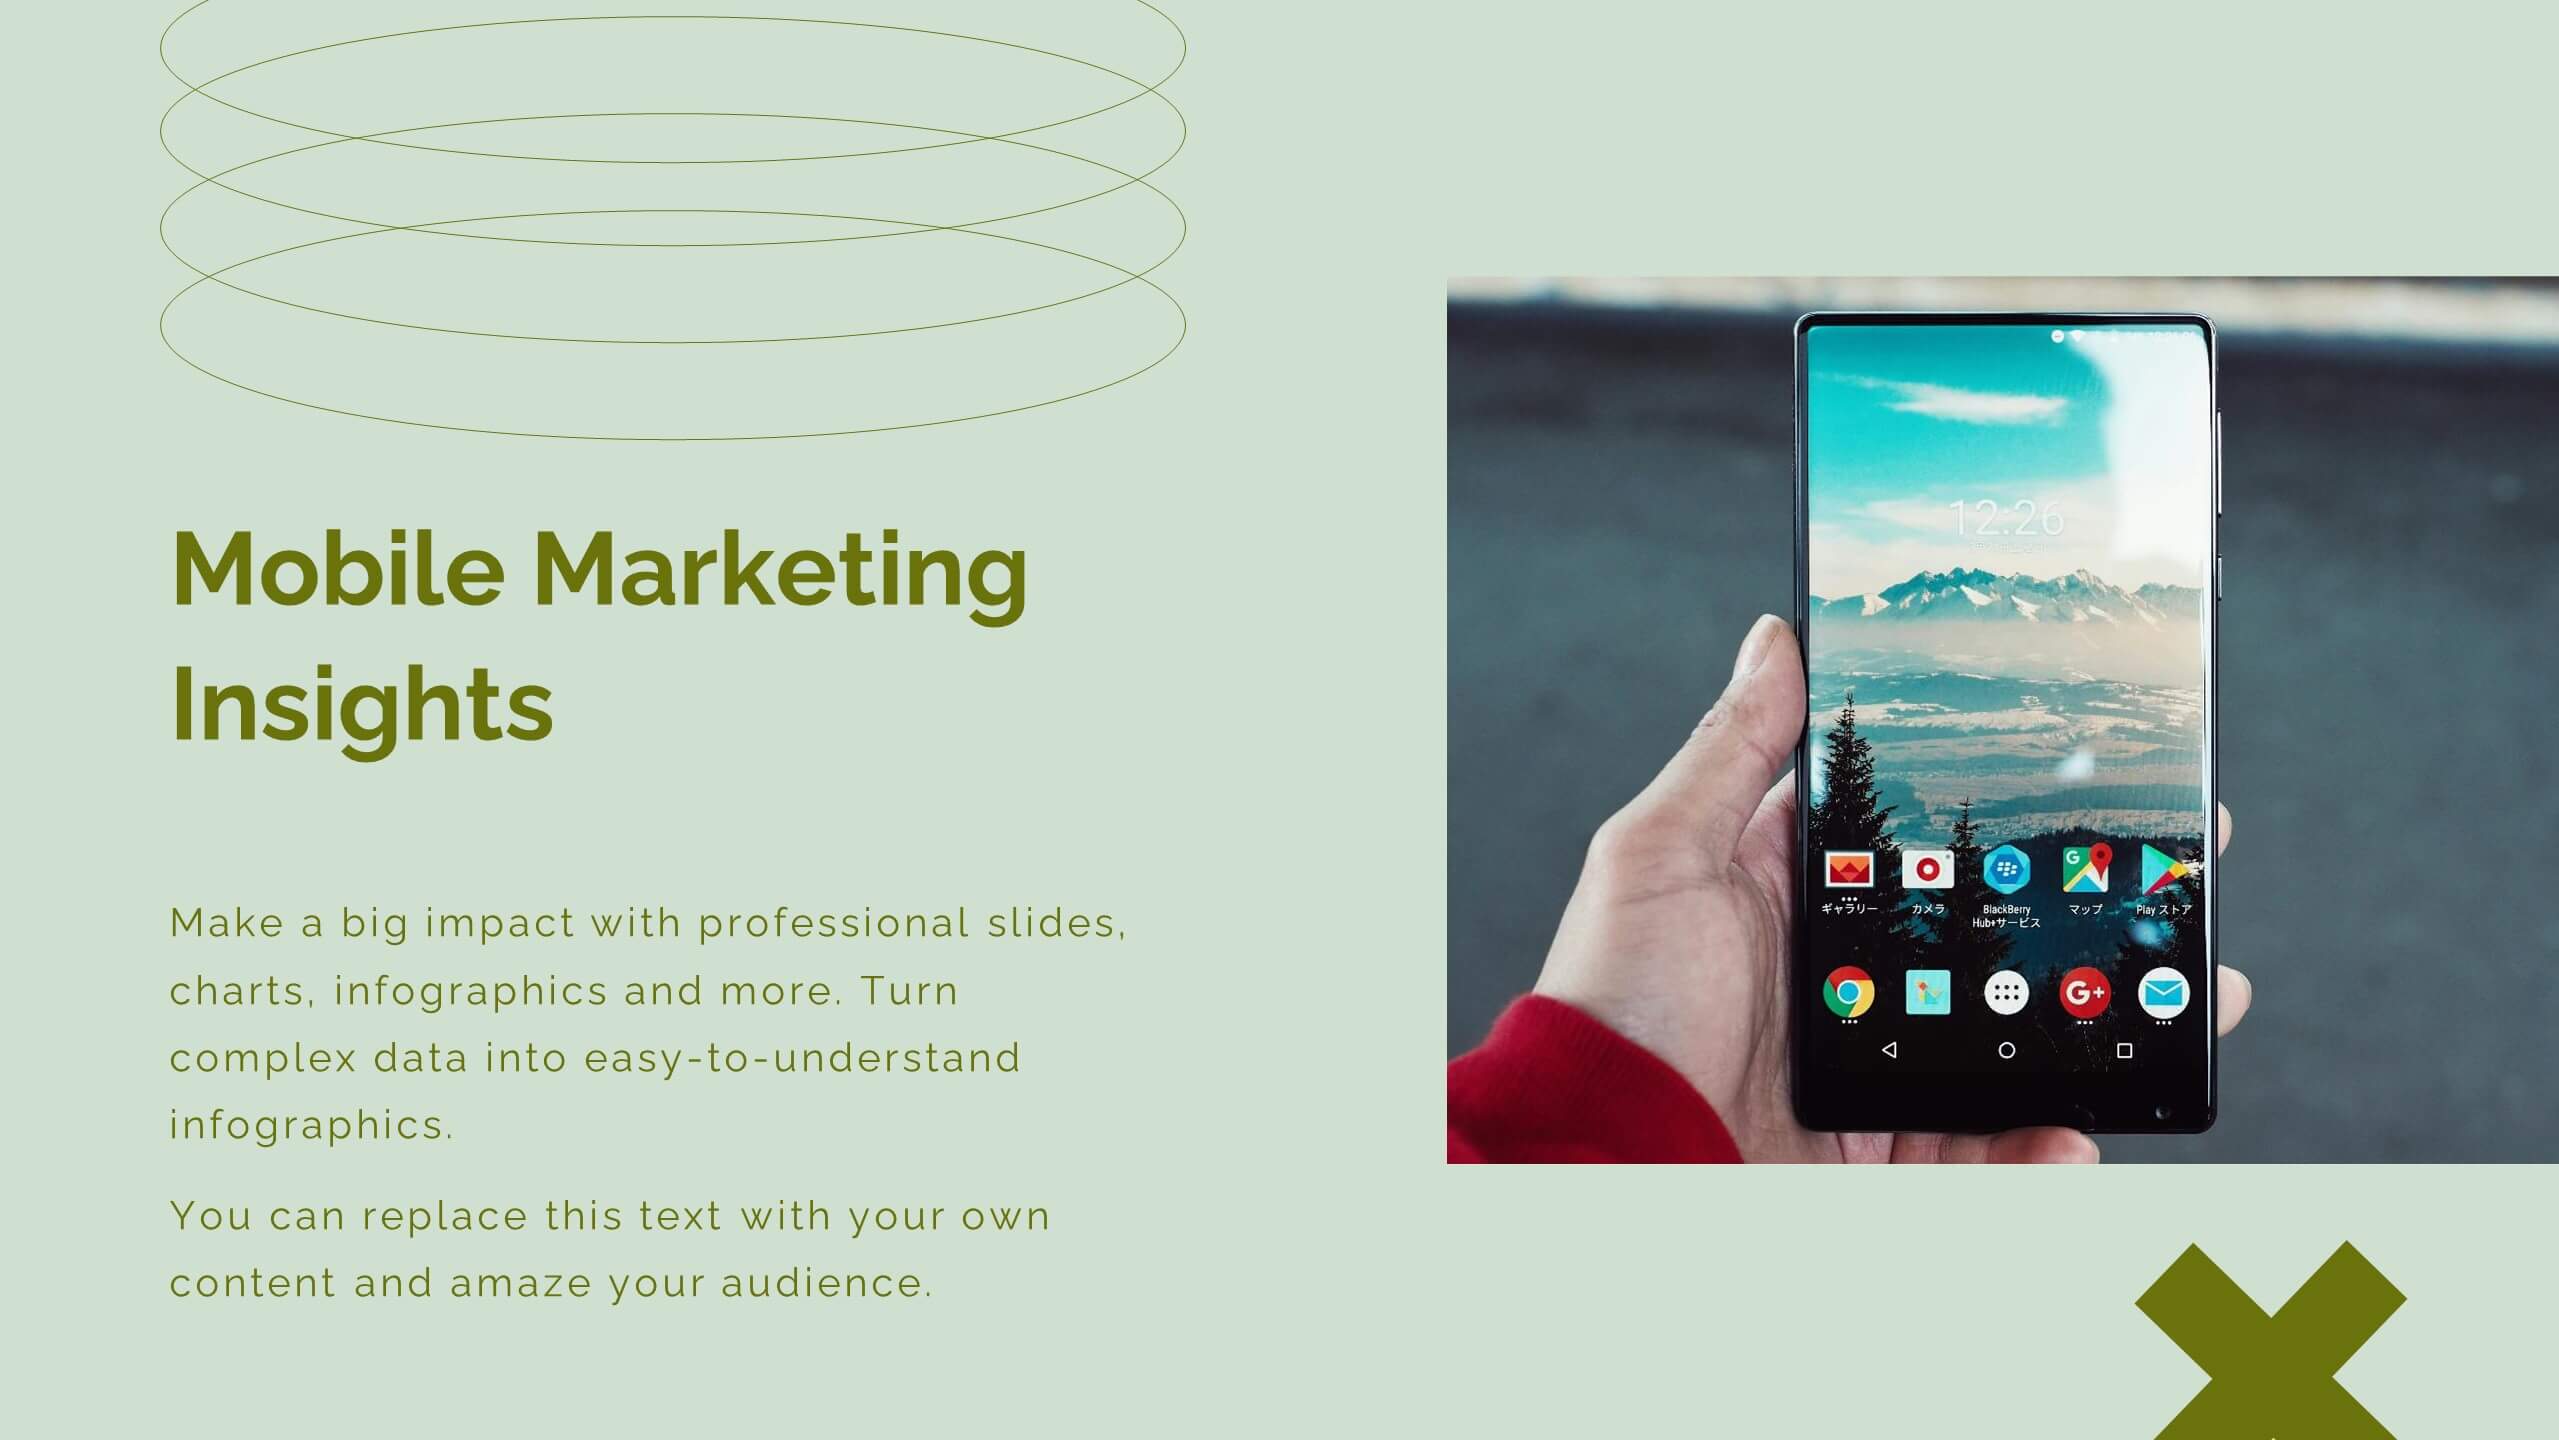
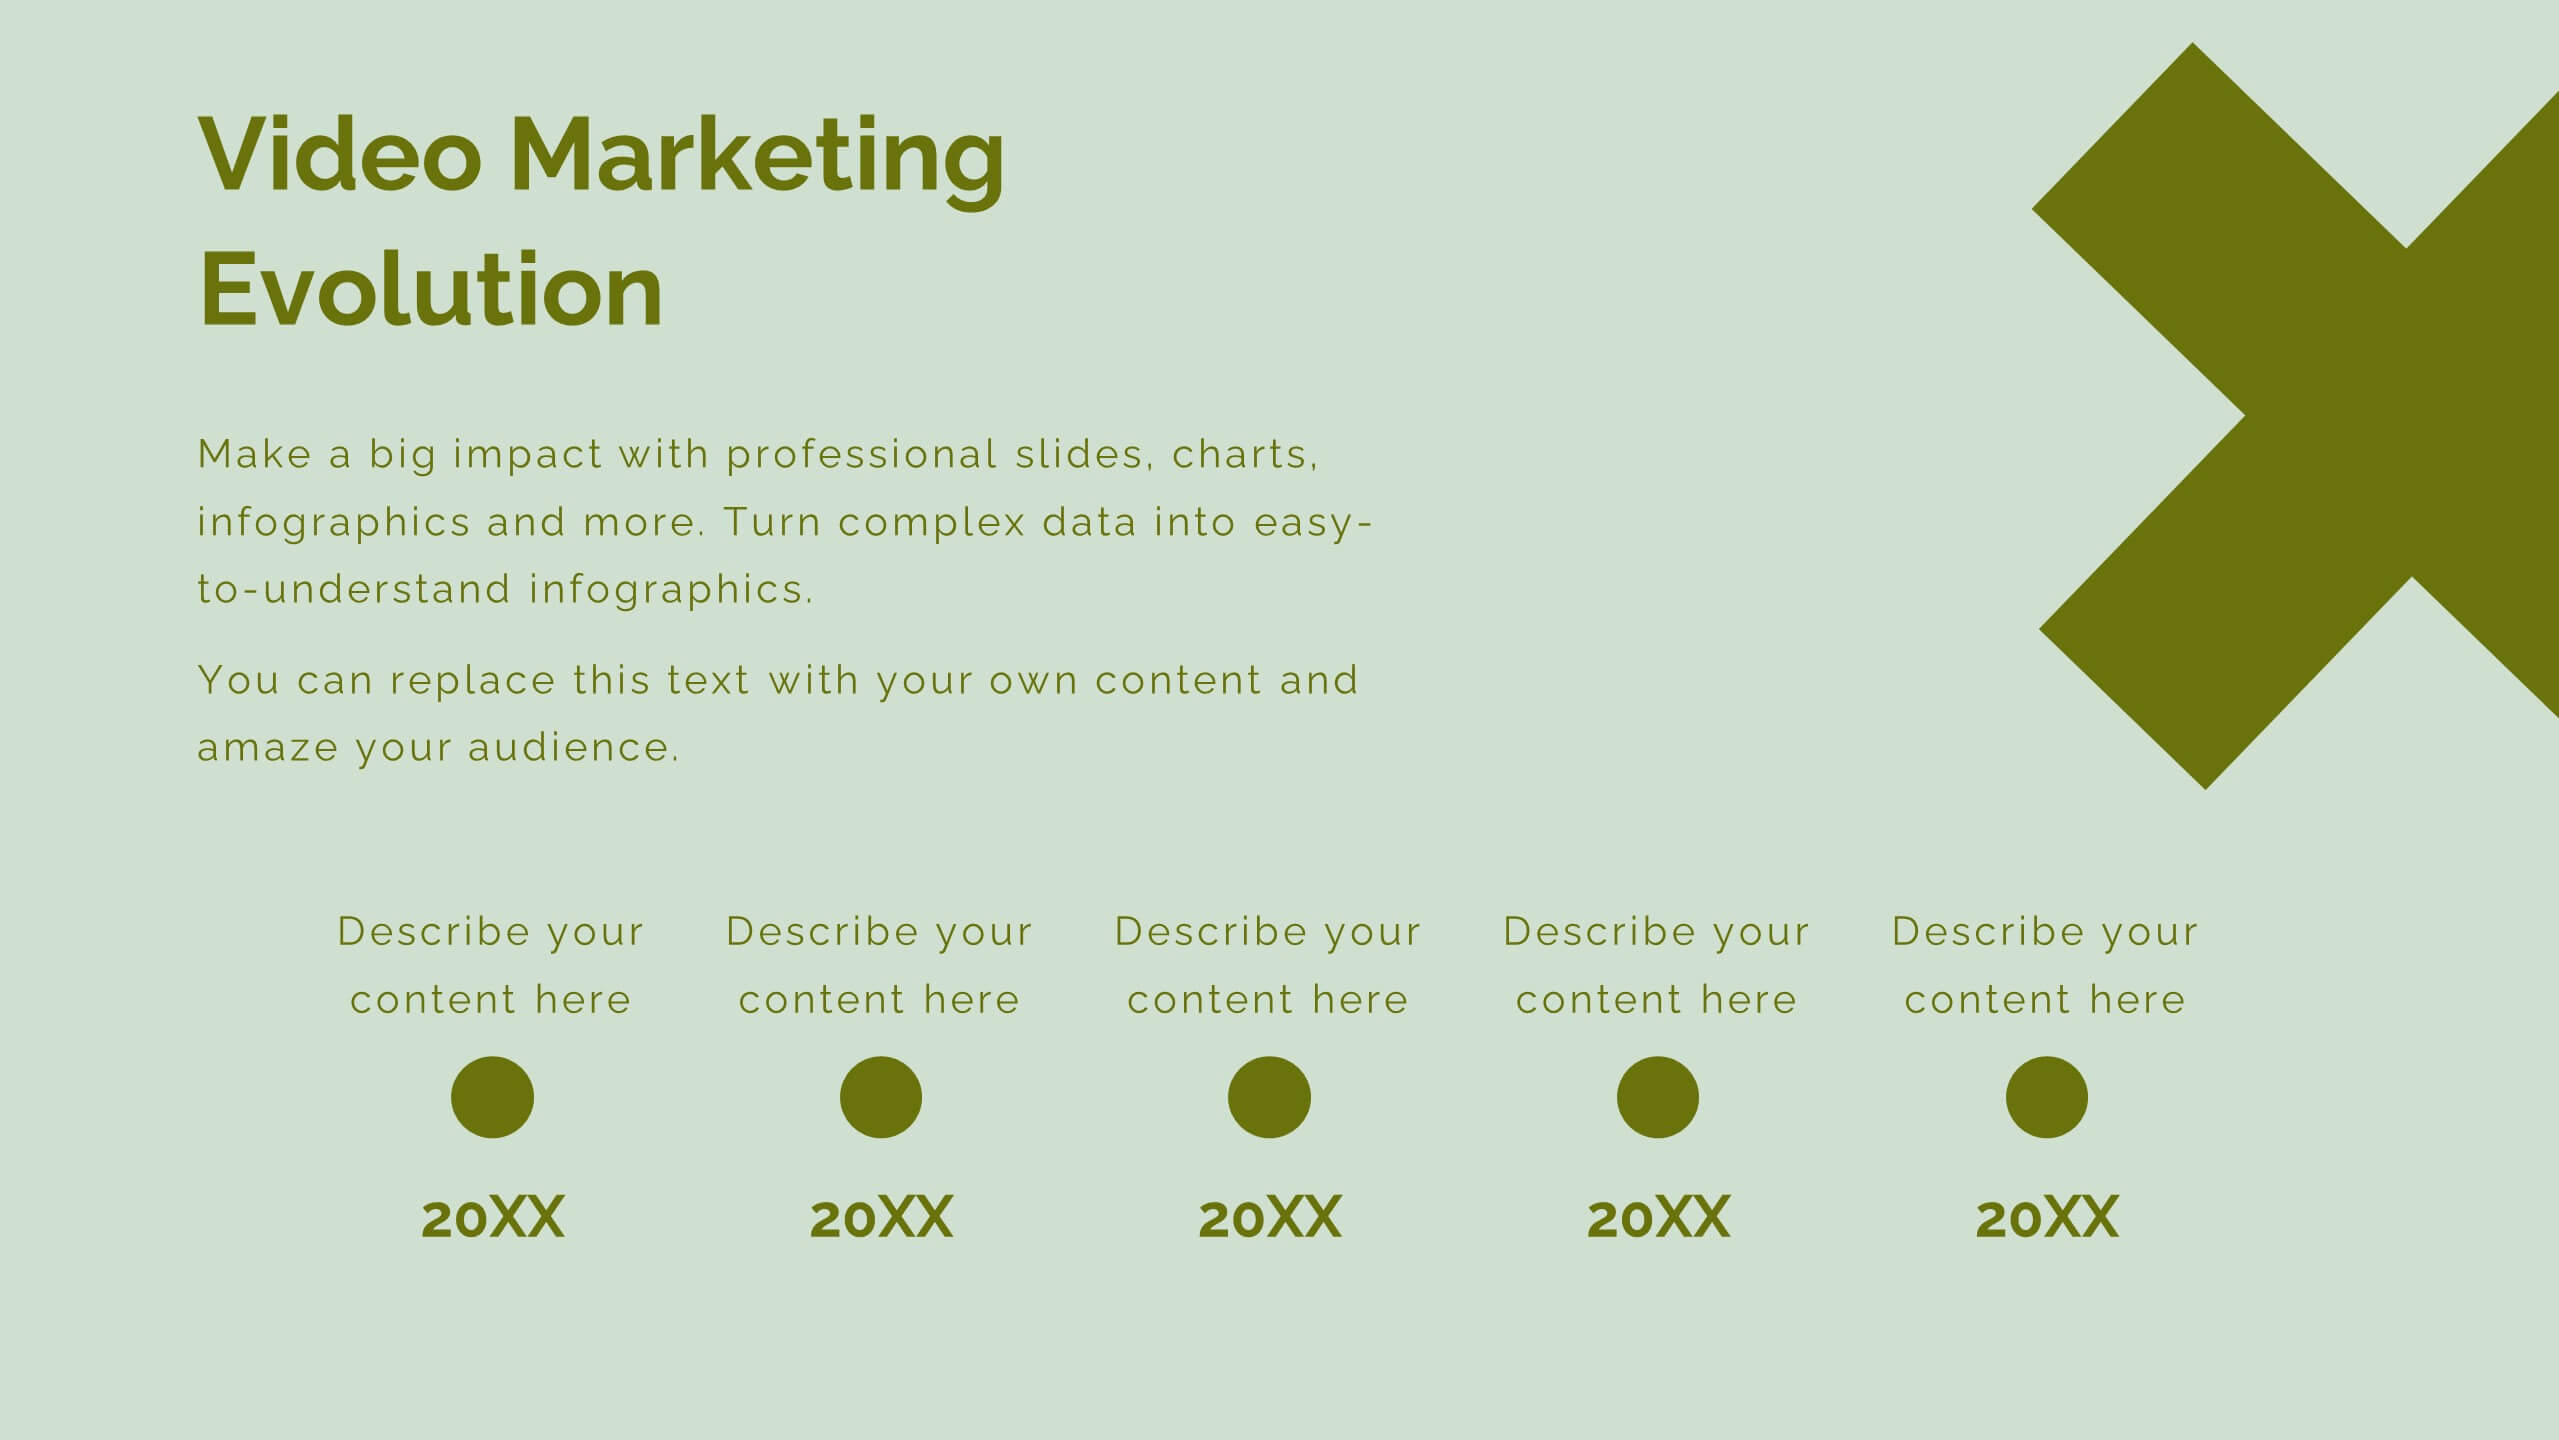
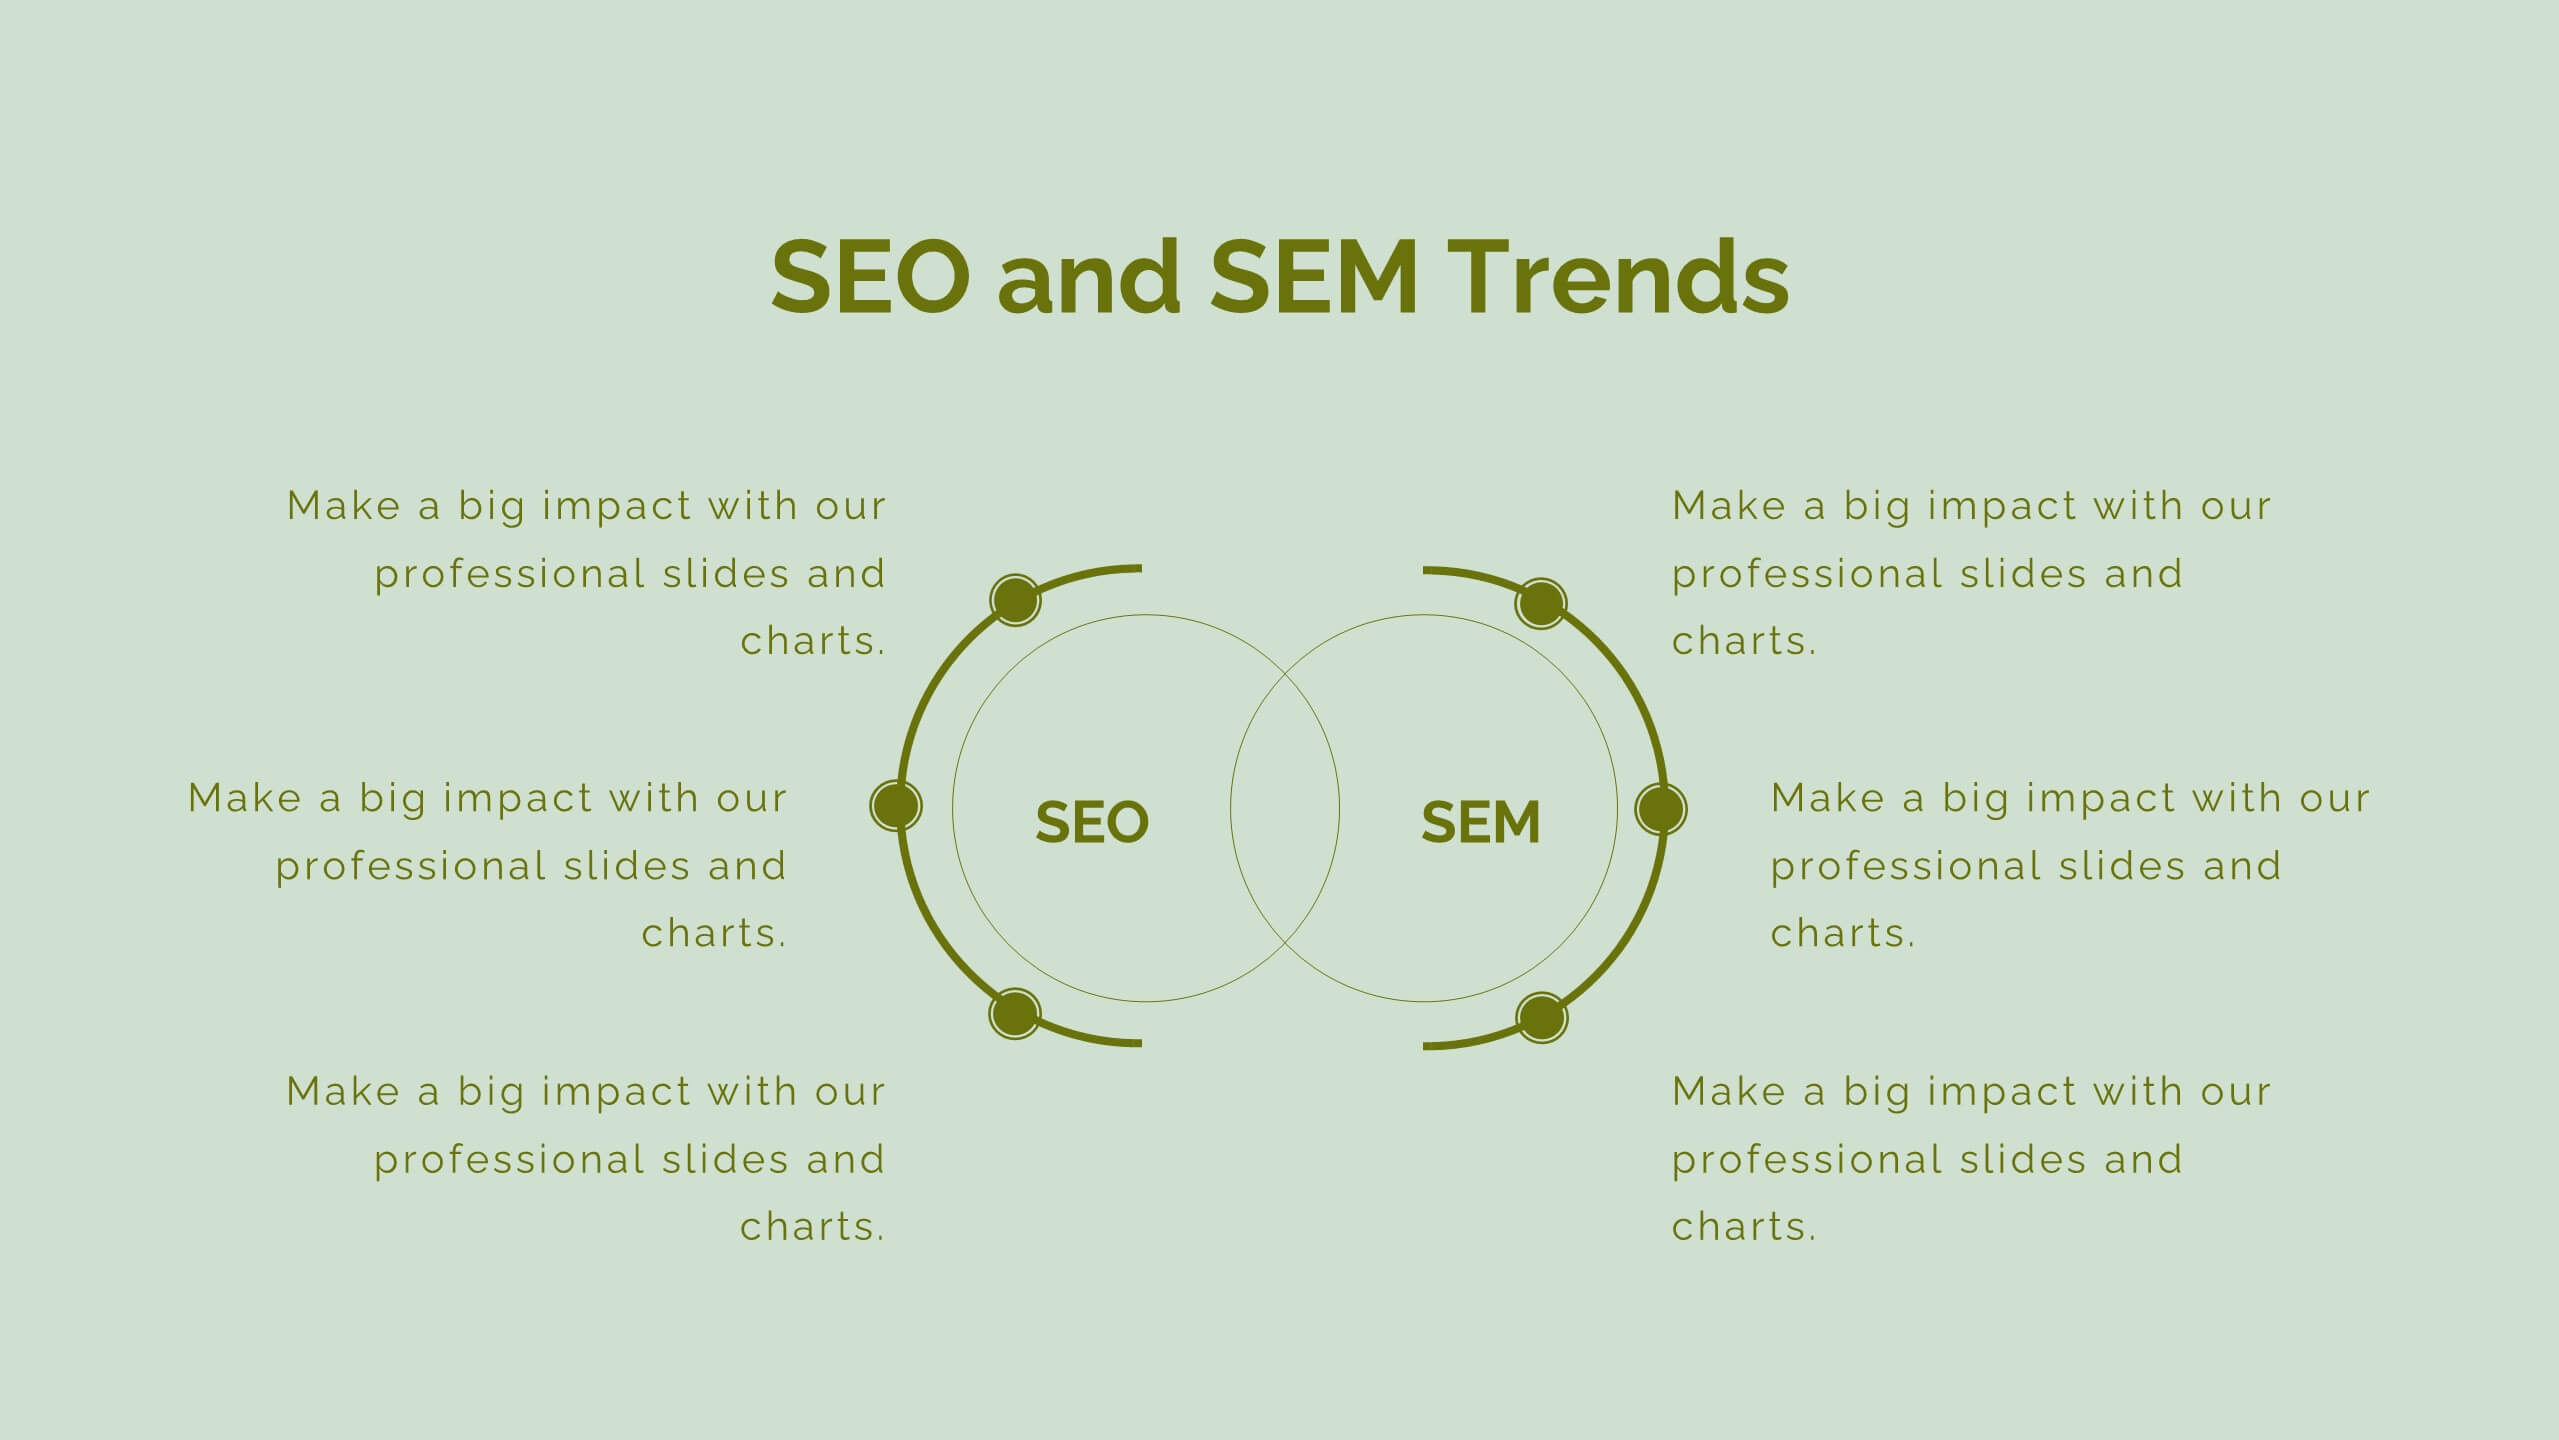
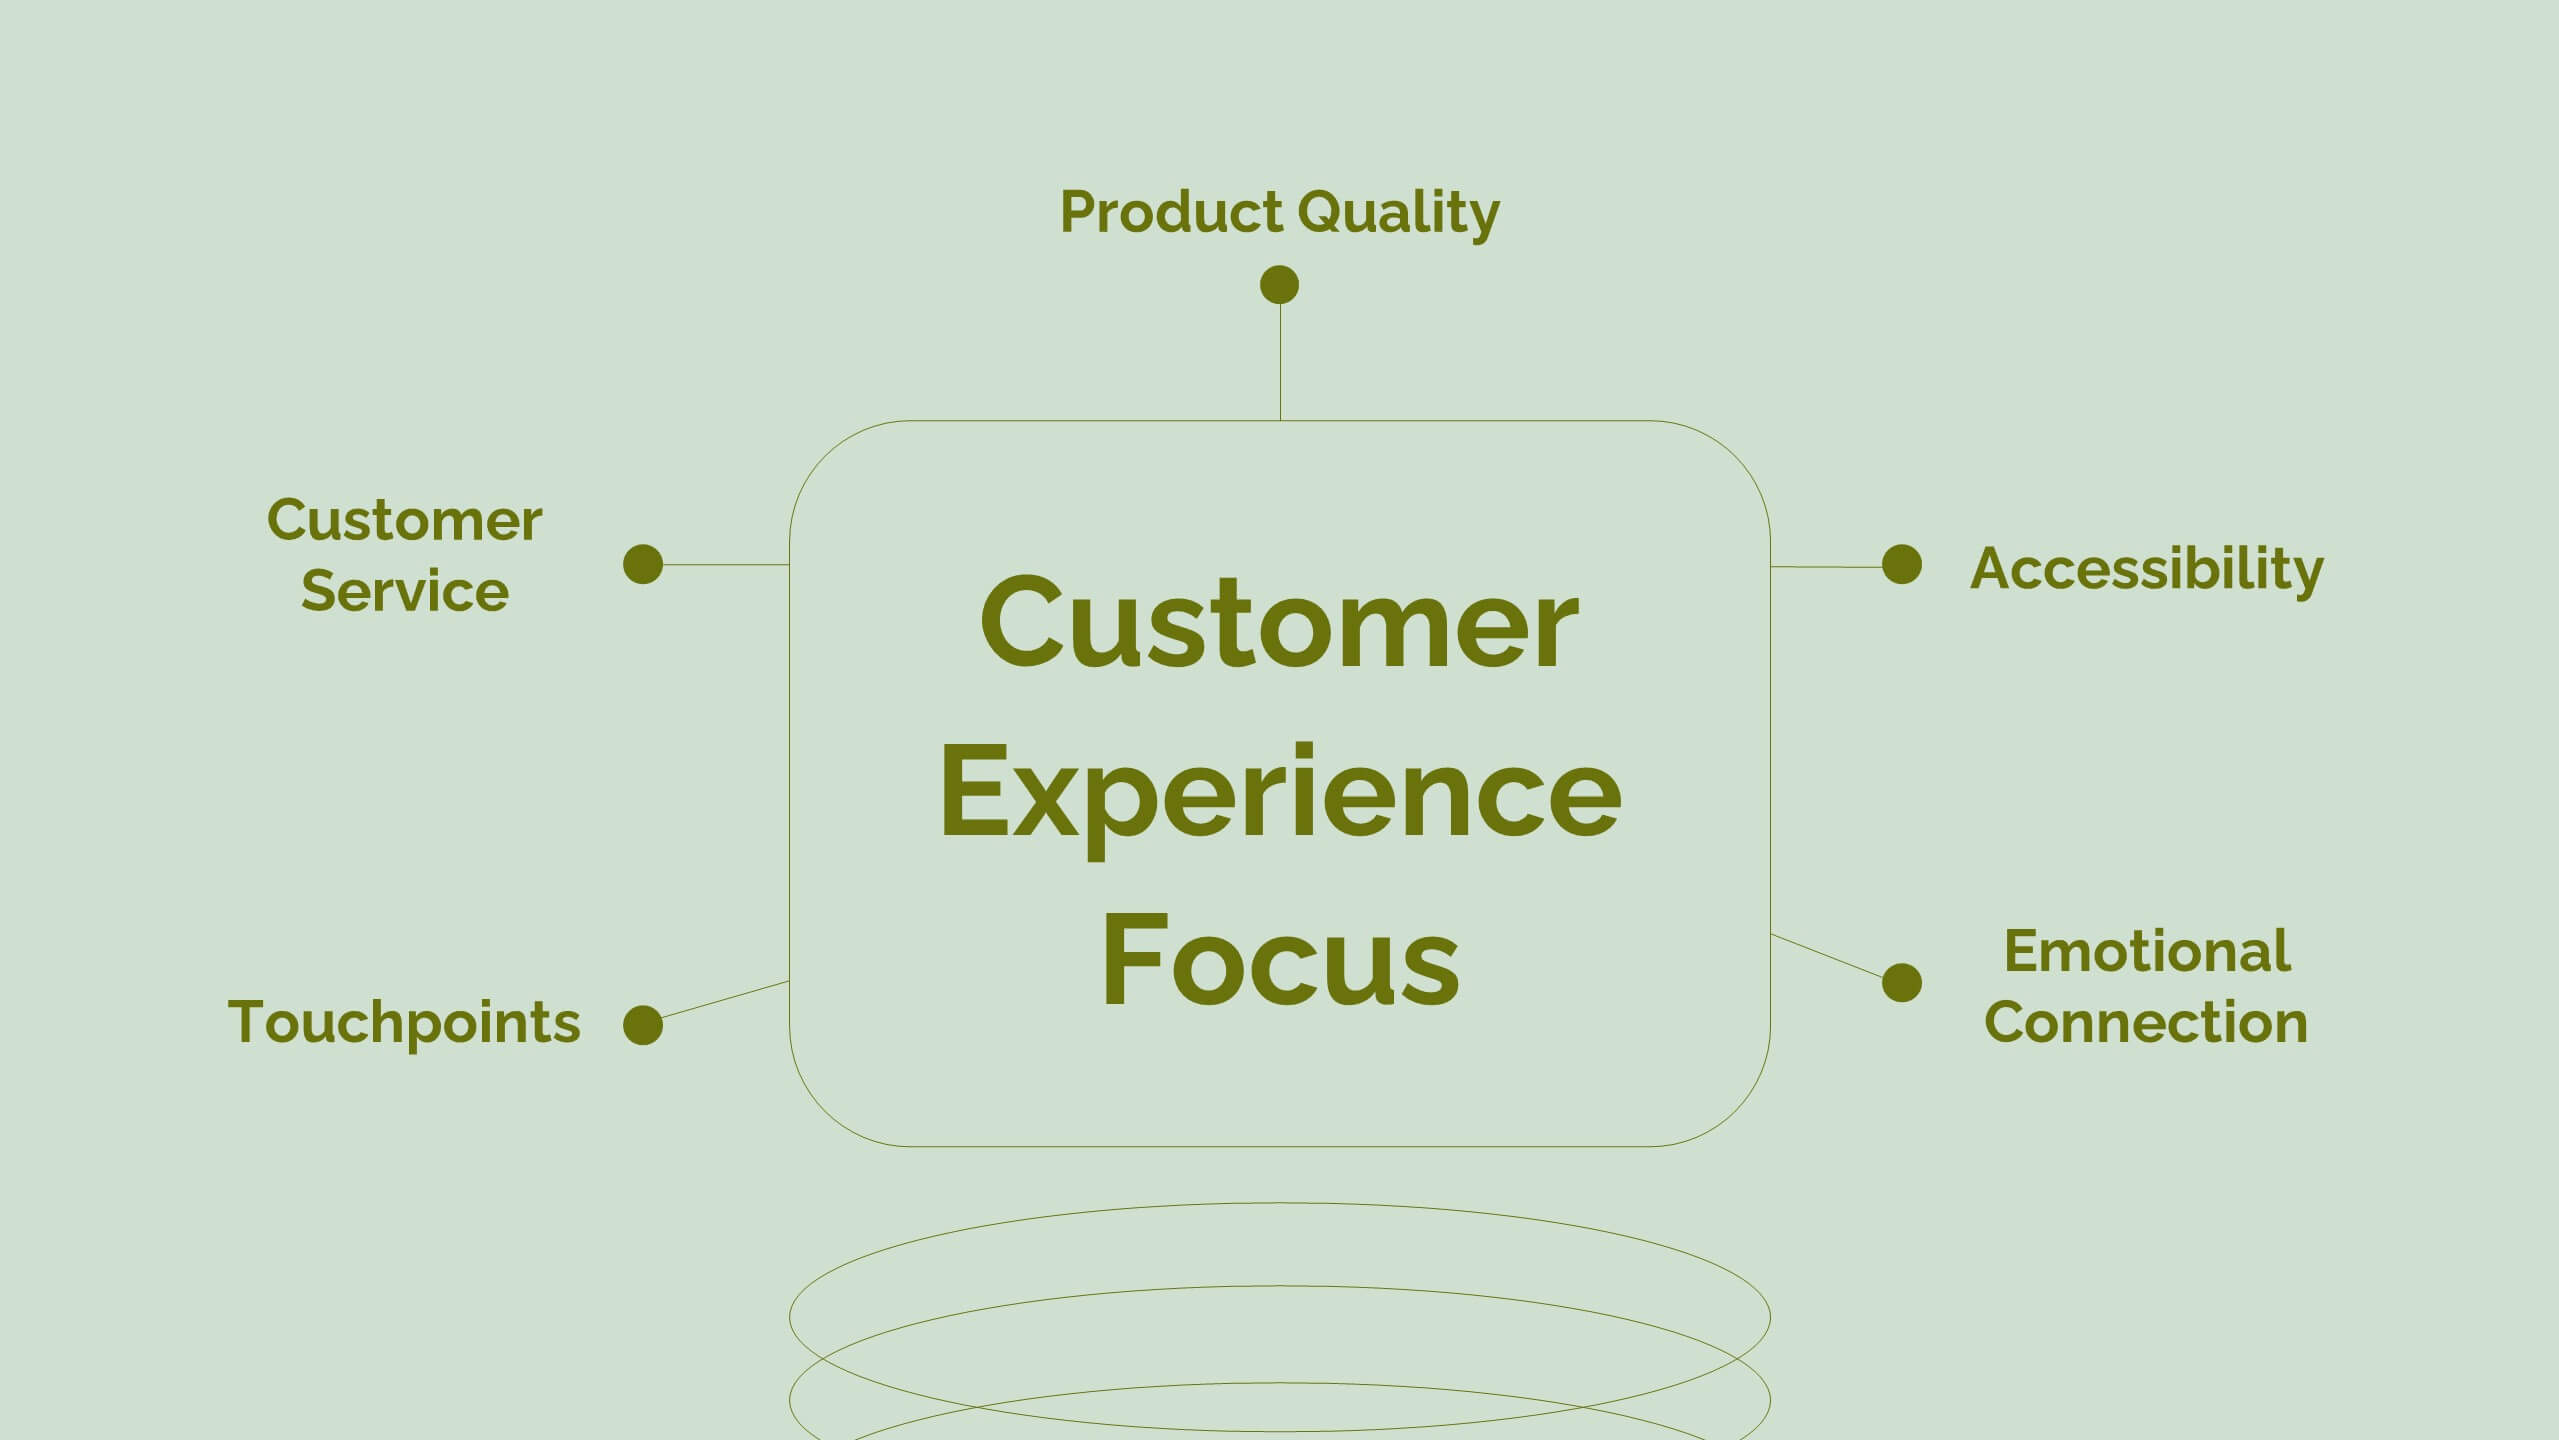
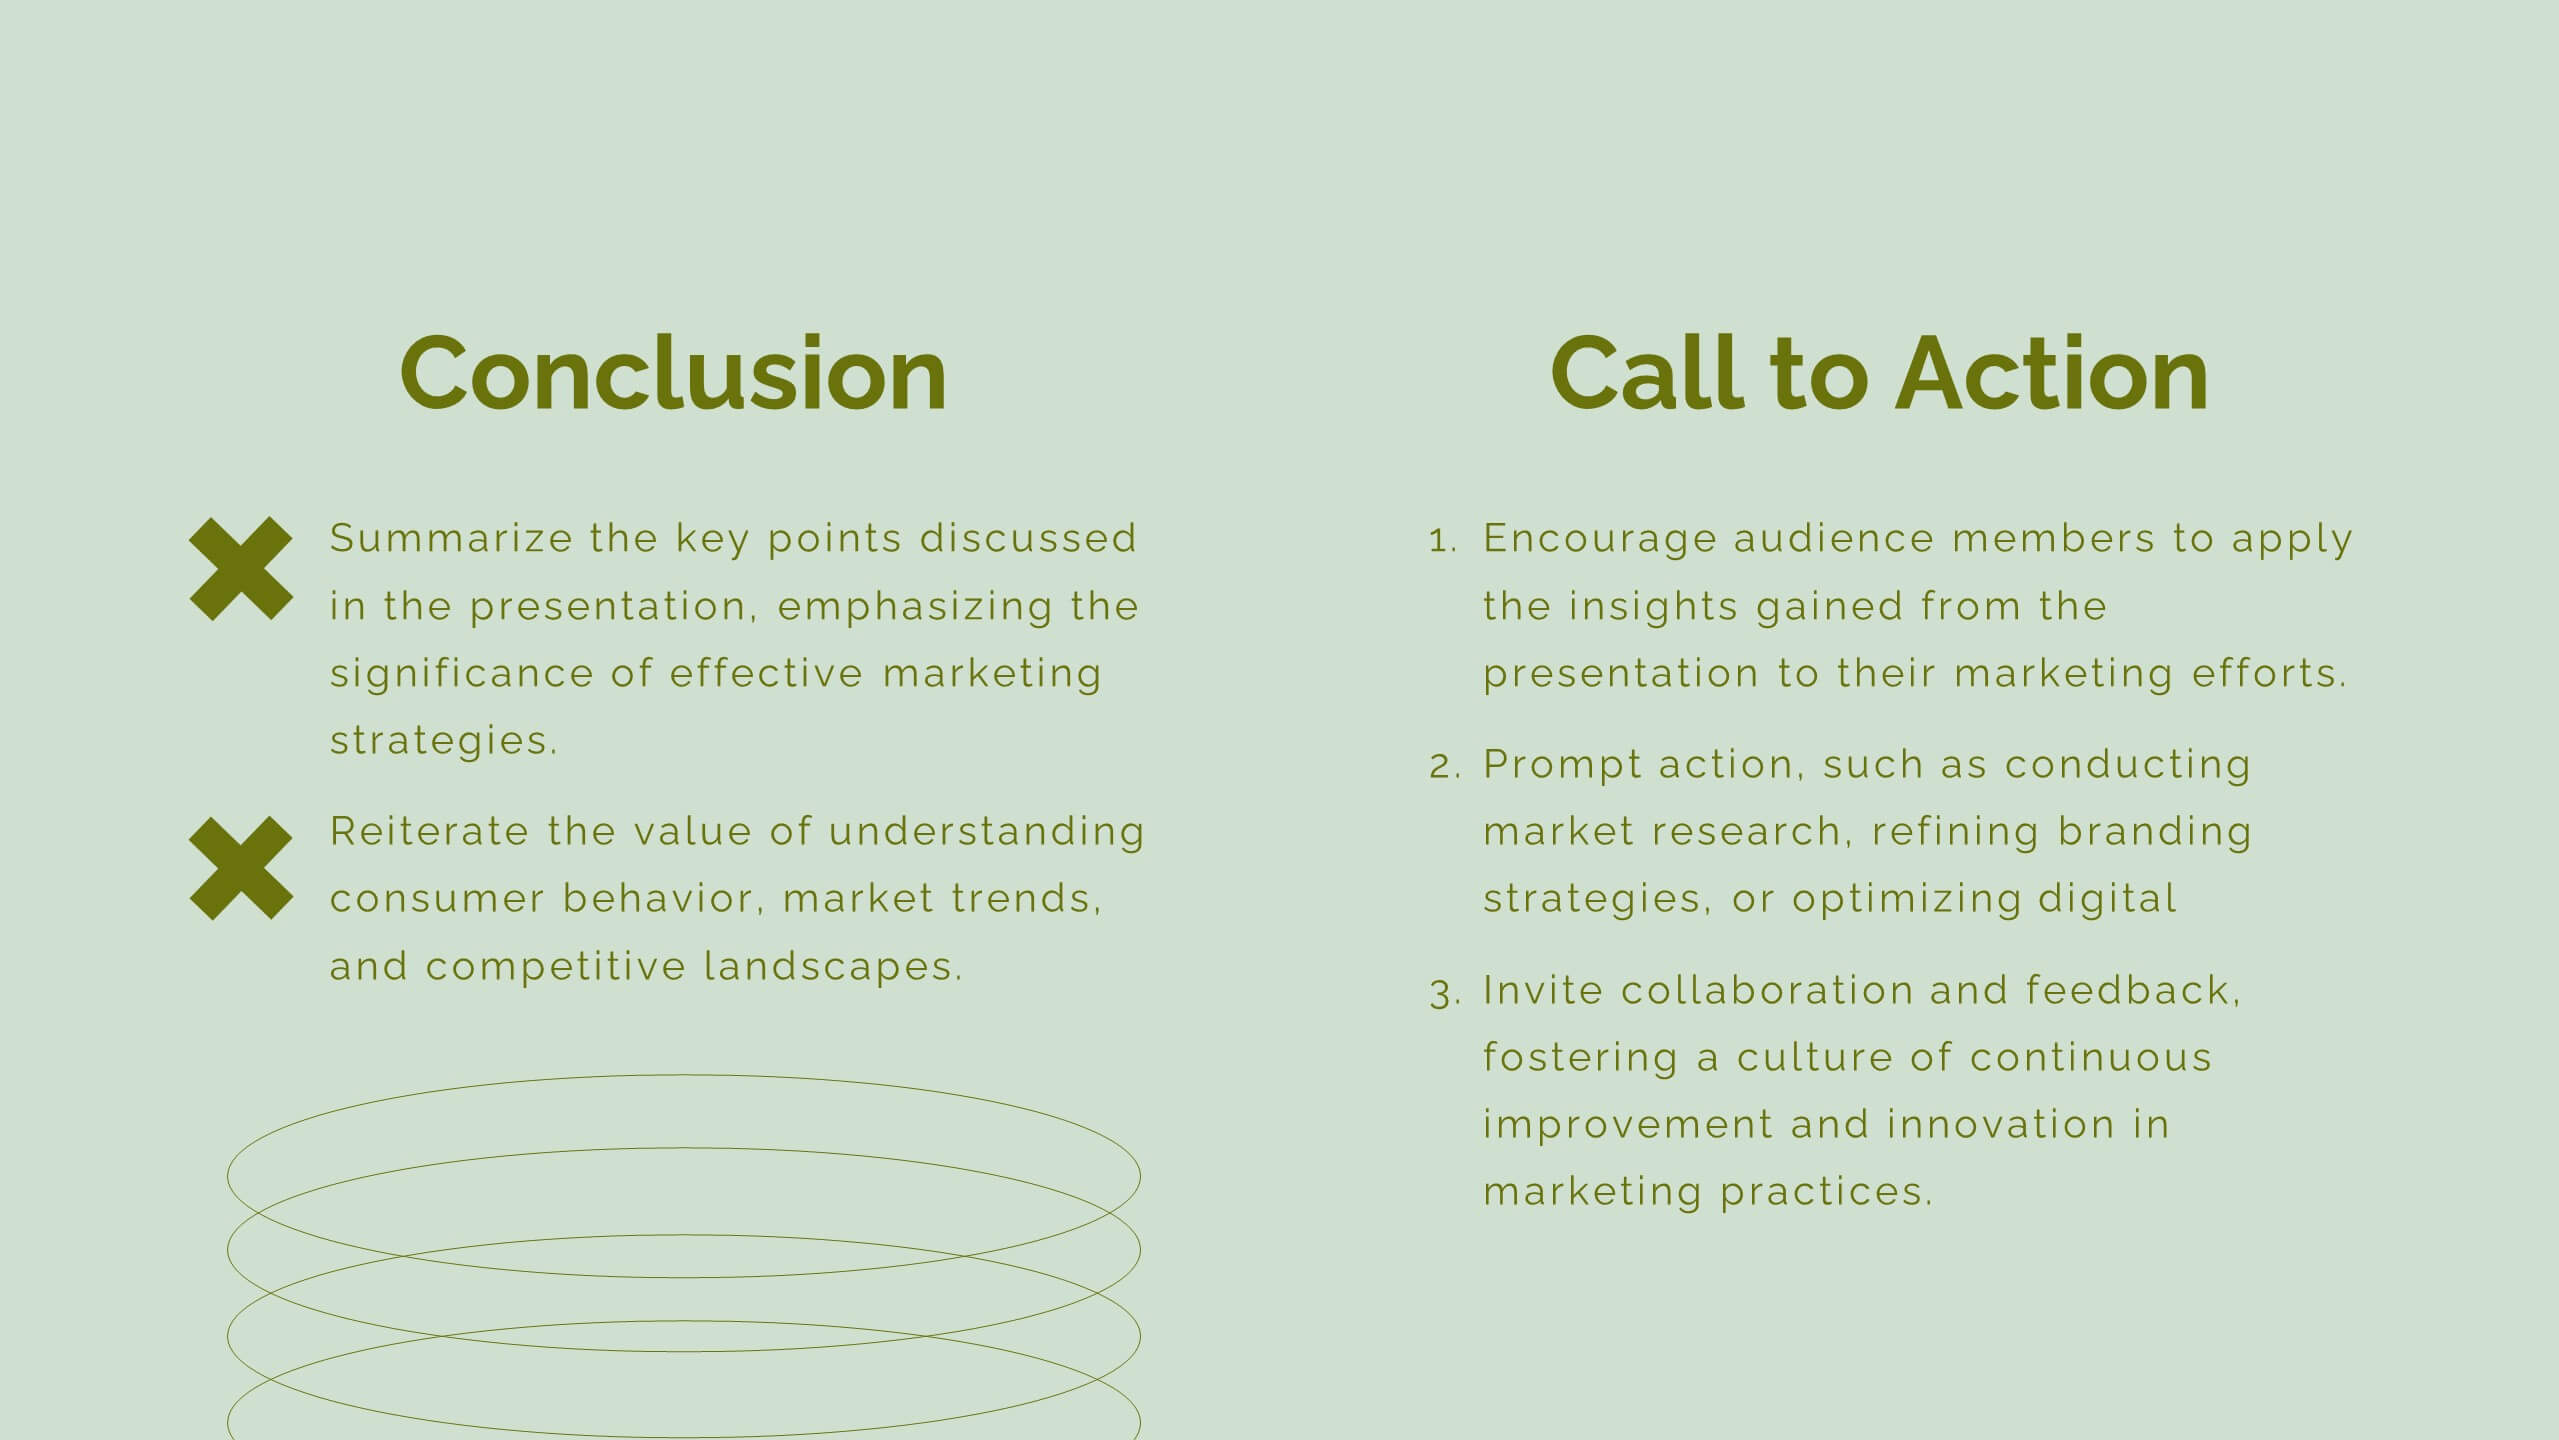
Faerie Digital Marketing Strategy Plan Presentation
Create a compelling marketing strategy with this sleek, modern template! It covers key topics like consumer behavior, social media strategies, and emerging trends. Perfect for showcasing insights in a clear, data-driven format. Fully customizable, it works seamlessly with PowerPoint, Keynote, and Google Slides for effective presentations.


4 diapositivas
Differentiation through Blue Ocean Framework Presentation
Make waves with this bold, eye-catching layout built to show what sets your strategy apart. This presentation template explores how to stand out in untapped markets using a simple comparison framework, perfect for teams shifting from competition to innovation. Easily editable and ready for PowerPoint, Keynote, and Google Slides.


6 diapositivas
Project Roadmap with Strategic Phases Presentation
Visually guide your team through every phase with the Project Roadmap with Strategic Phases Presentation. This template features a curved arrow layout to illustrate project milestones, making it perfect for planning, strategy, or progress updates. Fully customizable in PowerPoint, Google Slides, and Canva for seamless integration into any workflow.


6 diapositivas
Project Planning and Task Allocation Presentation
Streamline your project timelines with the Project Planning and Task Allocation Presentation. This template uses a clear horizontal flow to map out six key tasks or stages, making it ideal for visualizing schedules, assigning responsibilities, or showcasing milestones. Fully editable in PowerPoint, Google Slides, Keynote, and Canva.


5 diapositivas
Recycling Basics Infographics
Recycling is the process of converting waste materials into new products to reduce the consumption of raw materials, energy usage, and environmental pollution. These infographic templates are designed to educate and motivate individuals to embrace recycling as a sustainable practice. With its eye-catching design, concise information, and visually appealing graphics, this template will help raise awareness and inspire positive recycling behaviors in your audience. This template allows you to effectively communicate key information about recycling. This is compatible with Powerpoint, Keynote, and Google Slides.


4 diapositivas
Survey Response Data Visuals Presentation
Present your survey data clearly with this radial icon-based layout. Show response percentages alongside descriptive titles and modern visuals. Ideal for feedback analysis or research summaries. Fully editable in Canva, PowerPoint, or Google Slides, this template offers a clean, professional look to highlight key insights with ease.


7 diapositivas
Analyze Survey Results Infographic
Survey results refer to the outcomes and findings obtained from a survey conducted to gather information, opinions, feedback, or data from a specific group of individuals or a target audience. This visually appealing and insightful infographic template transforms survey findings into captivating visuals, enabling you to grasp trends, patterns, and valuable insights at a glance. Compatible with Powerpoint, Keynote, and Google Slides. This provides valuable insights and analysis based on the responses collected. Our infographic is a common research method used in various fields, including business, academia, social sciences, marketing, and more.


7 diapositivas
Implementation Models and Frameworks Slide Presentation
Visualize your entire process clearly with the Implementation Models and Frameworks Slide Presentation. This sleek arrow-based timeline features six distinct stages, each with icons and text placeholders to highlight key milestones, actions, or phases. Ideal for showcasing workflows, strategic initiatives, or rollout plans, this slide ensures your audience follows the journey from start to finish. Fully editable in PowerPoint, Keynote, and Google Slides, it’s perfect for project managers, consultants, and team leads aiming for clarity and impact.


6 diapositivas
Hexagon Layout for Core Concepts Presentation
Present key concepts with impact using the Hexagon Layout for Core Concepts Presentation. This modular design highlights up to six core ideas in a clean, symmetrical grid—perfect for showcasing features, pillars, or foundational elements. Fully customizable and compatible with Canva, PowerPoint, Google Slides, and Keynote.


20 diapositivas
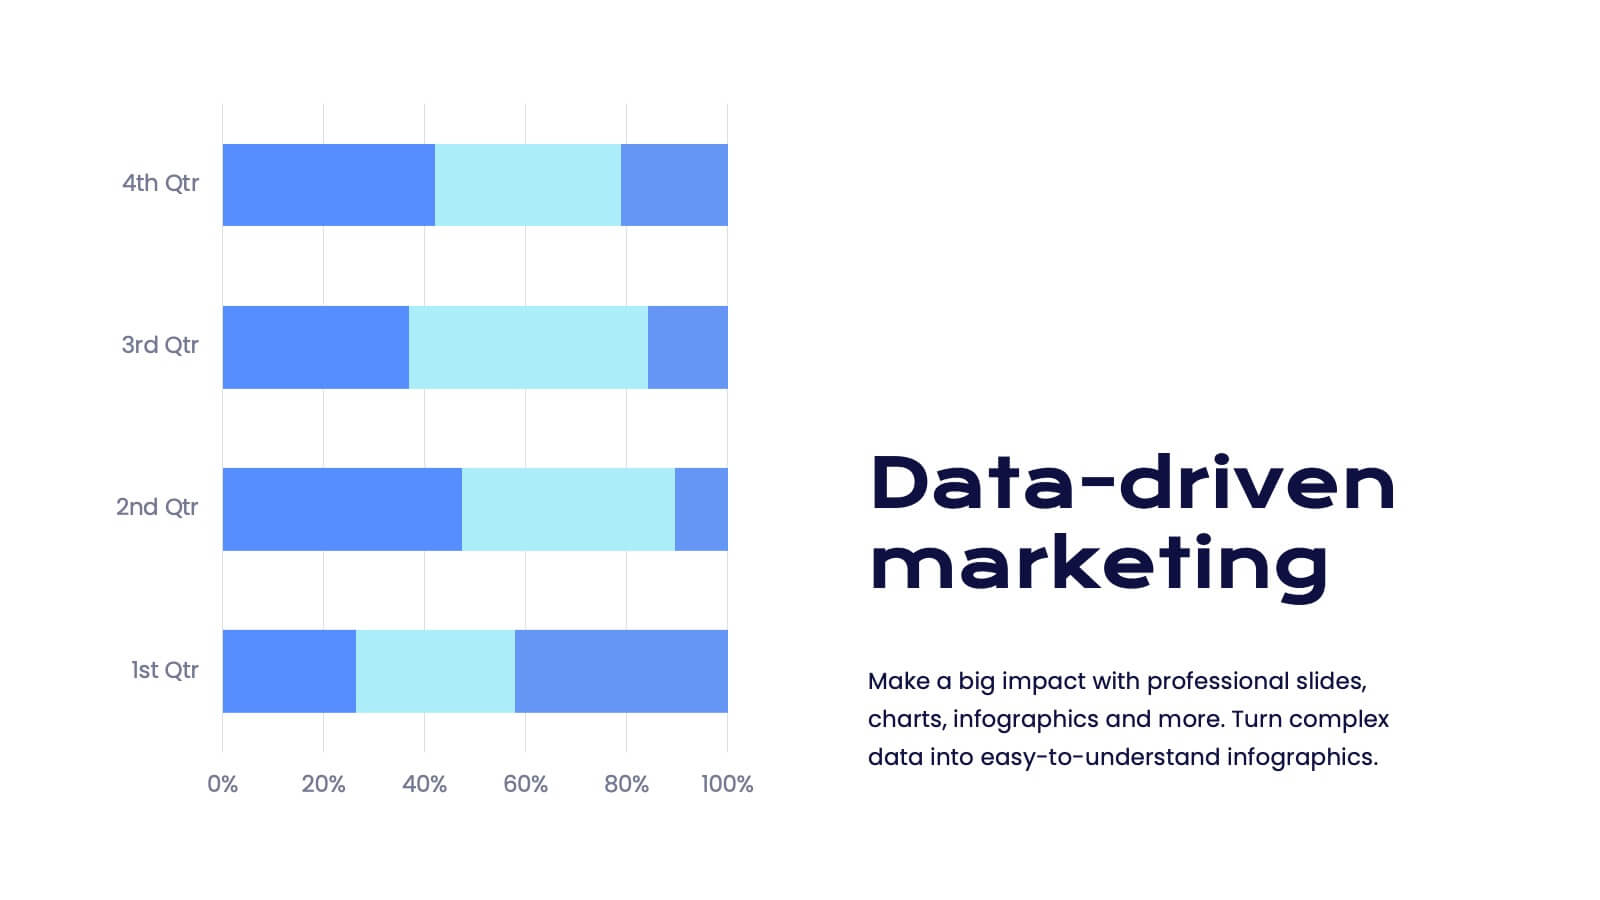
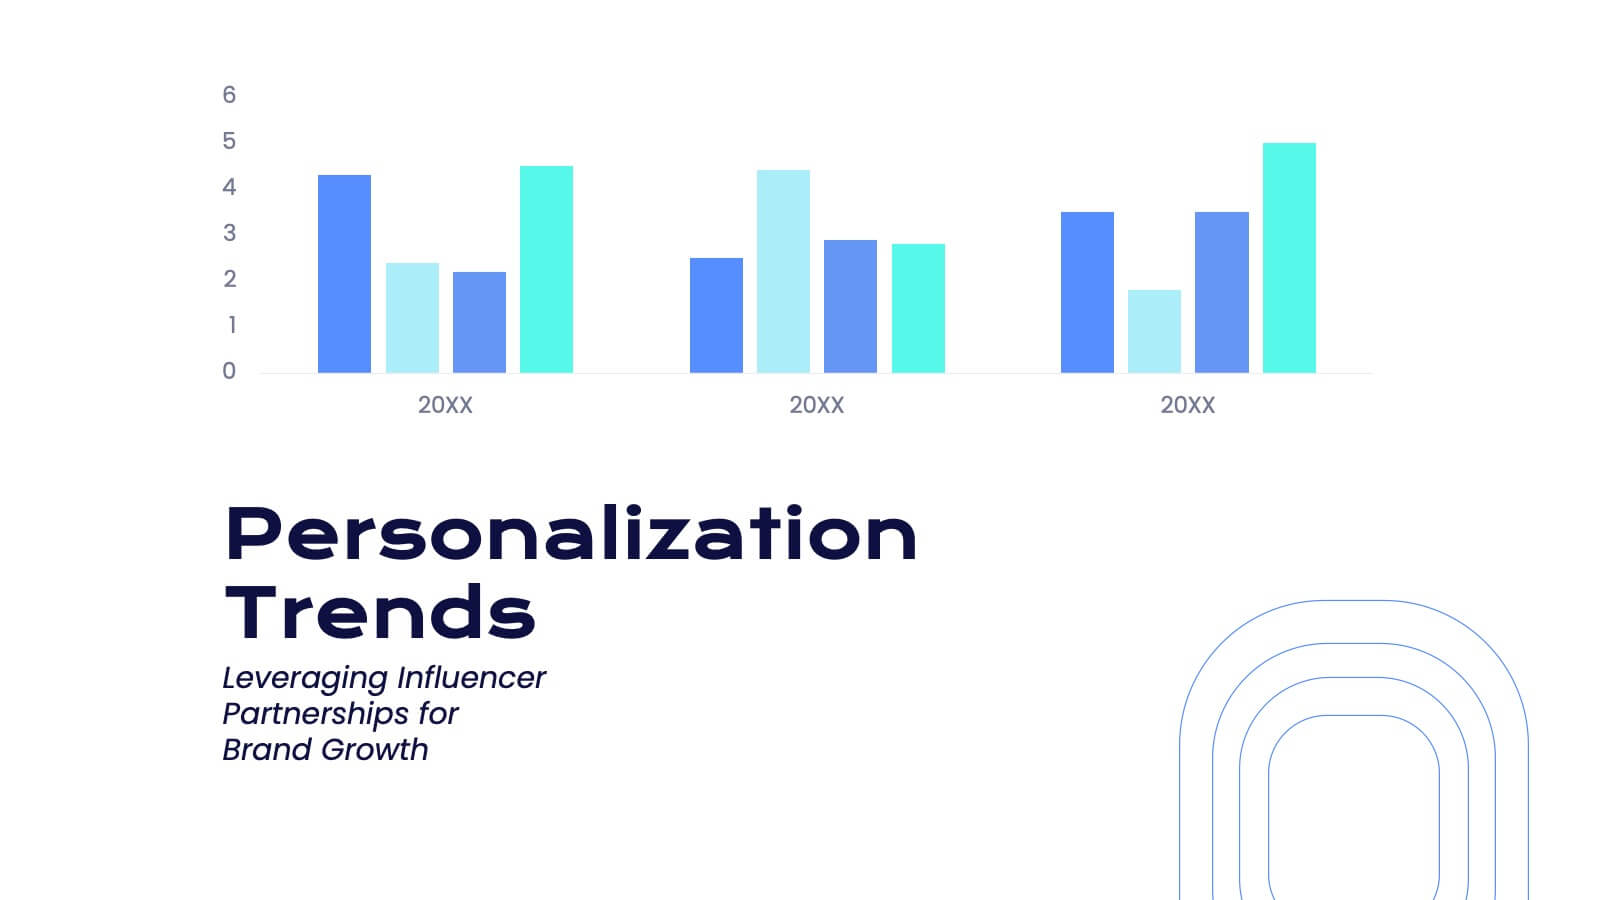
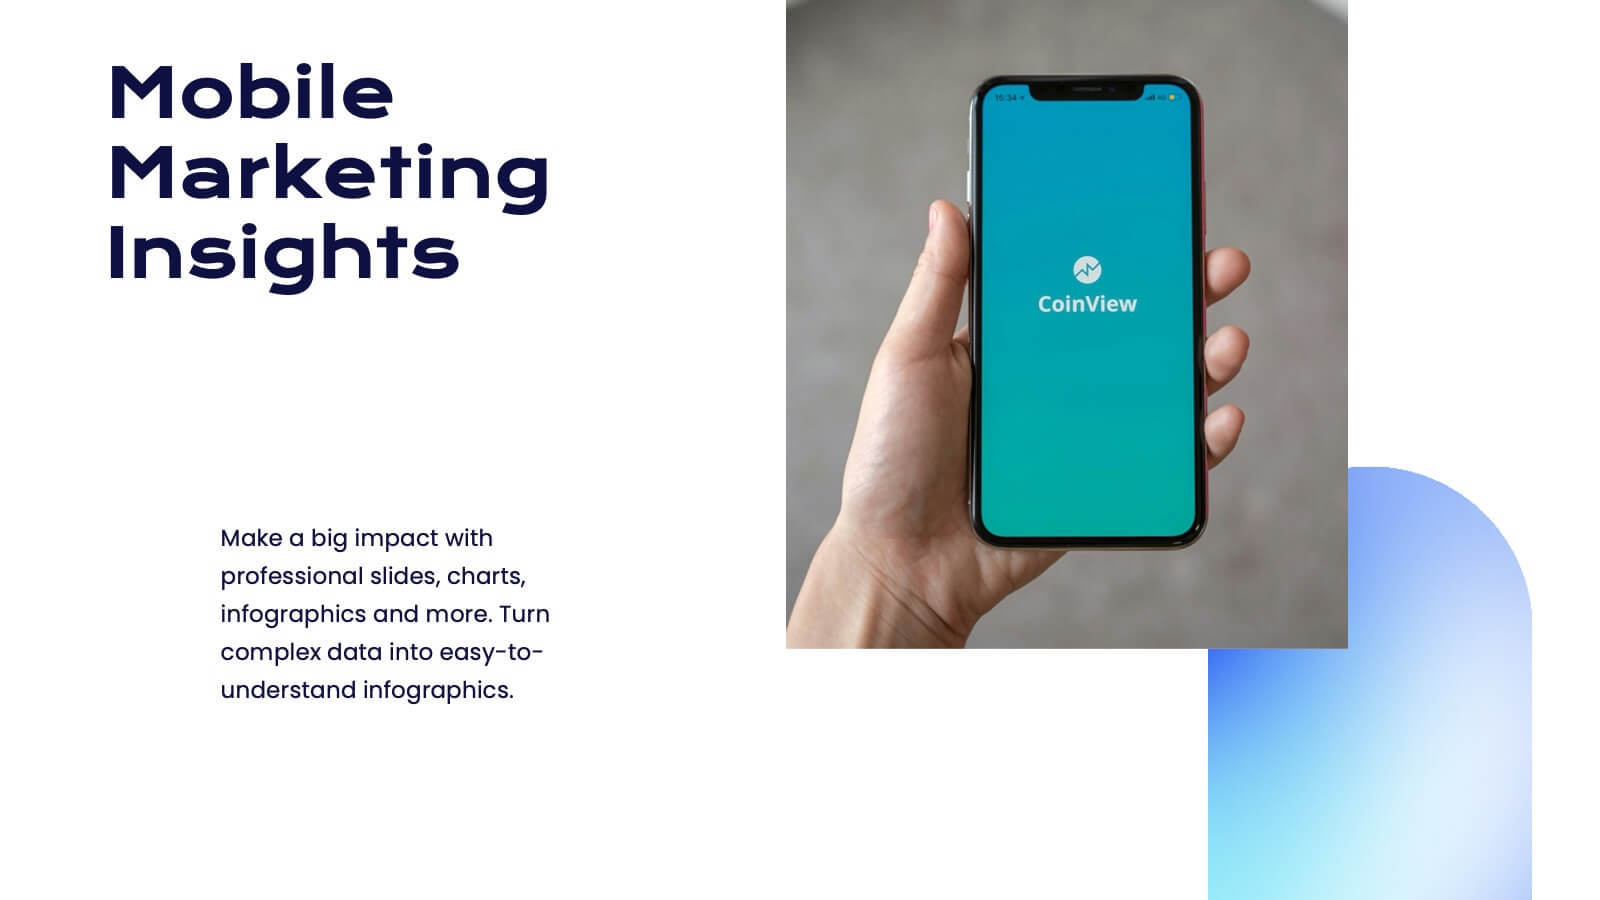
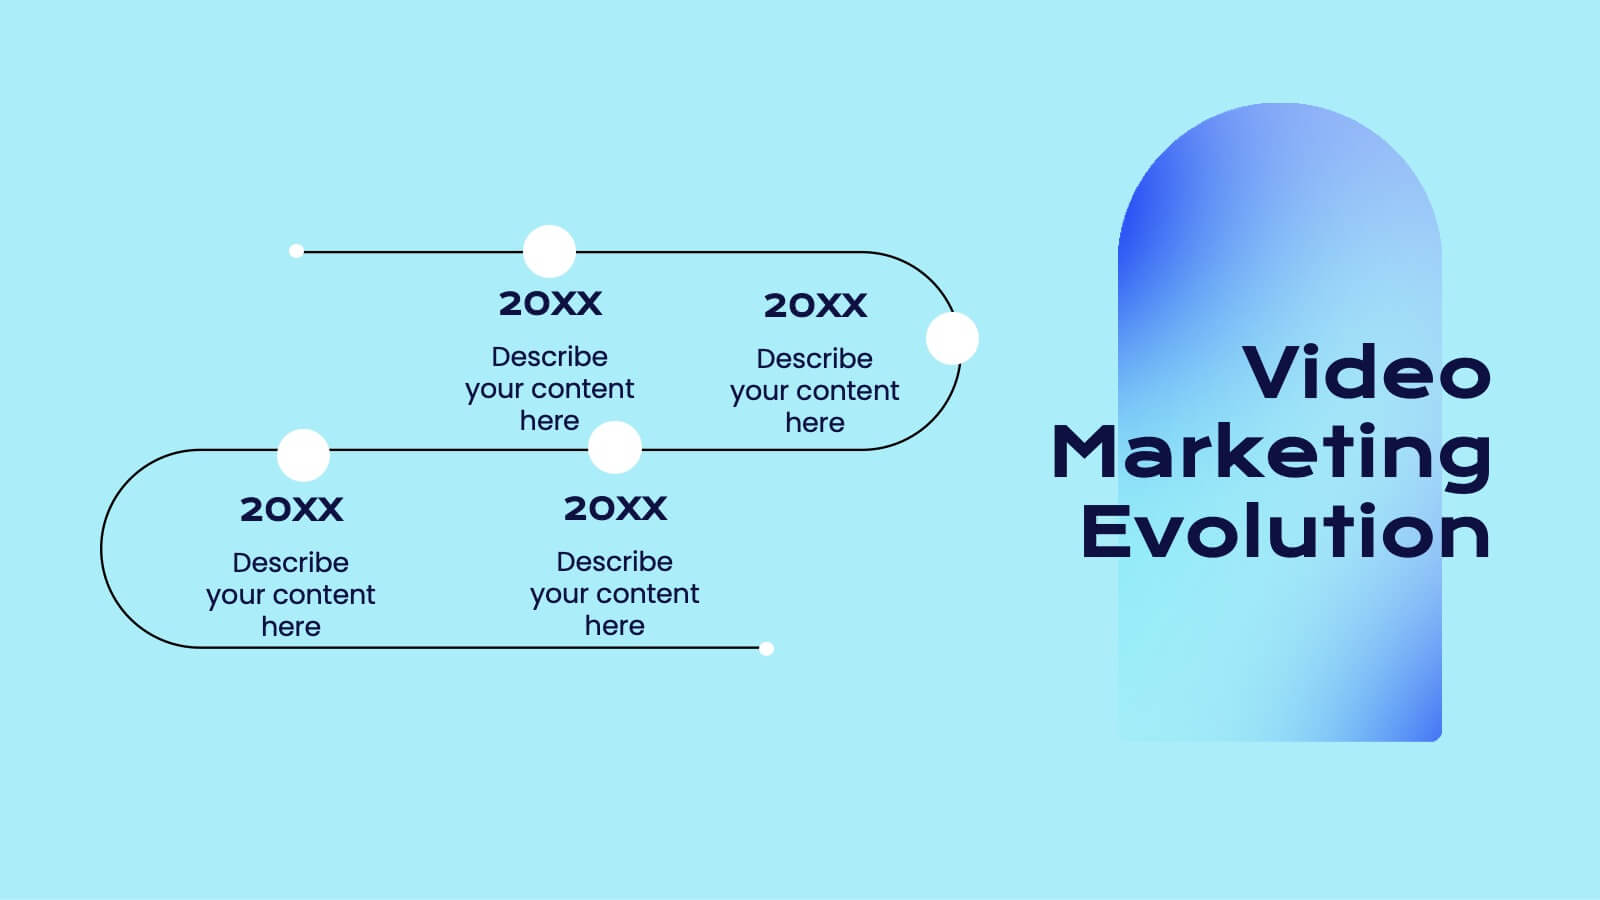
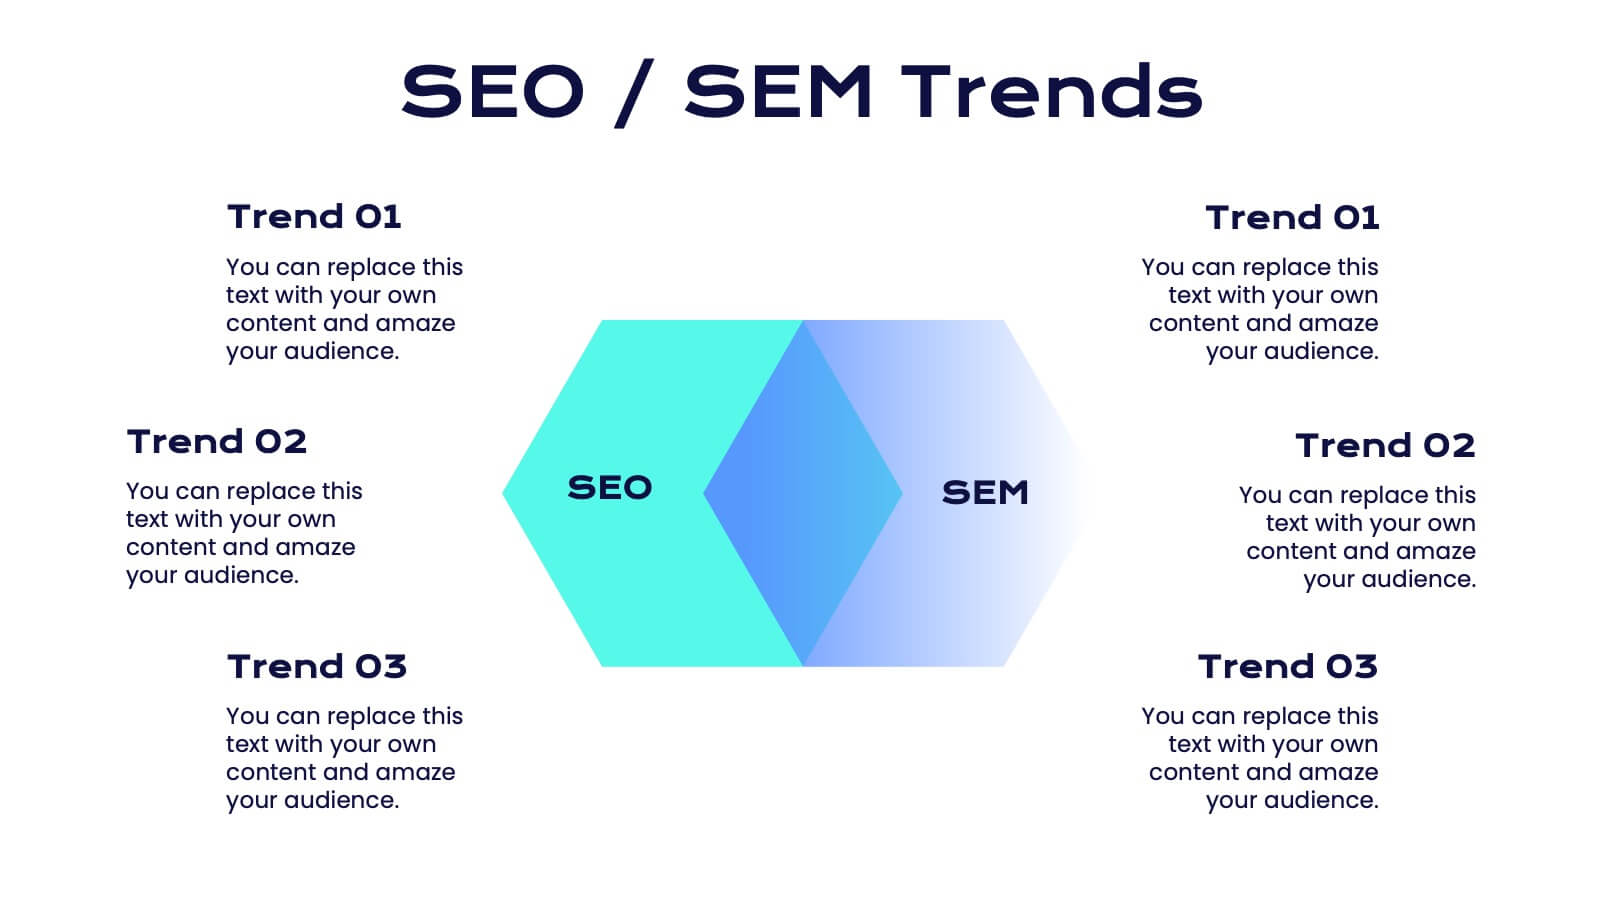
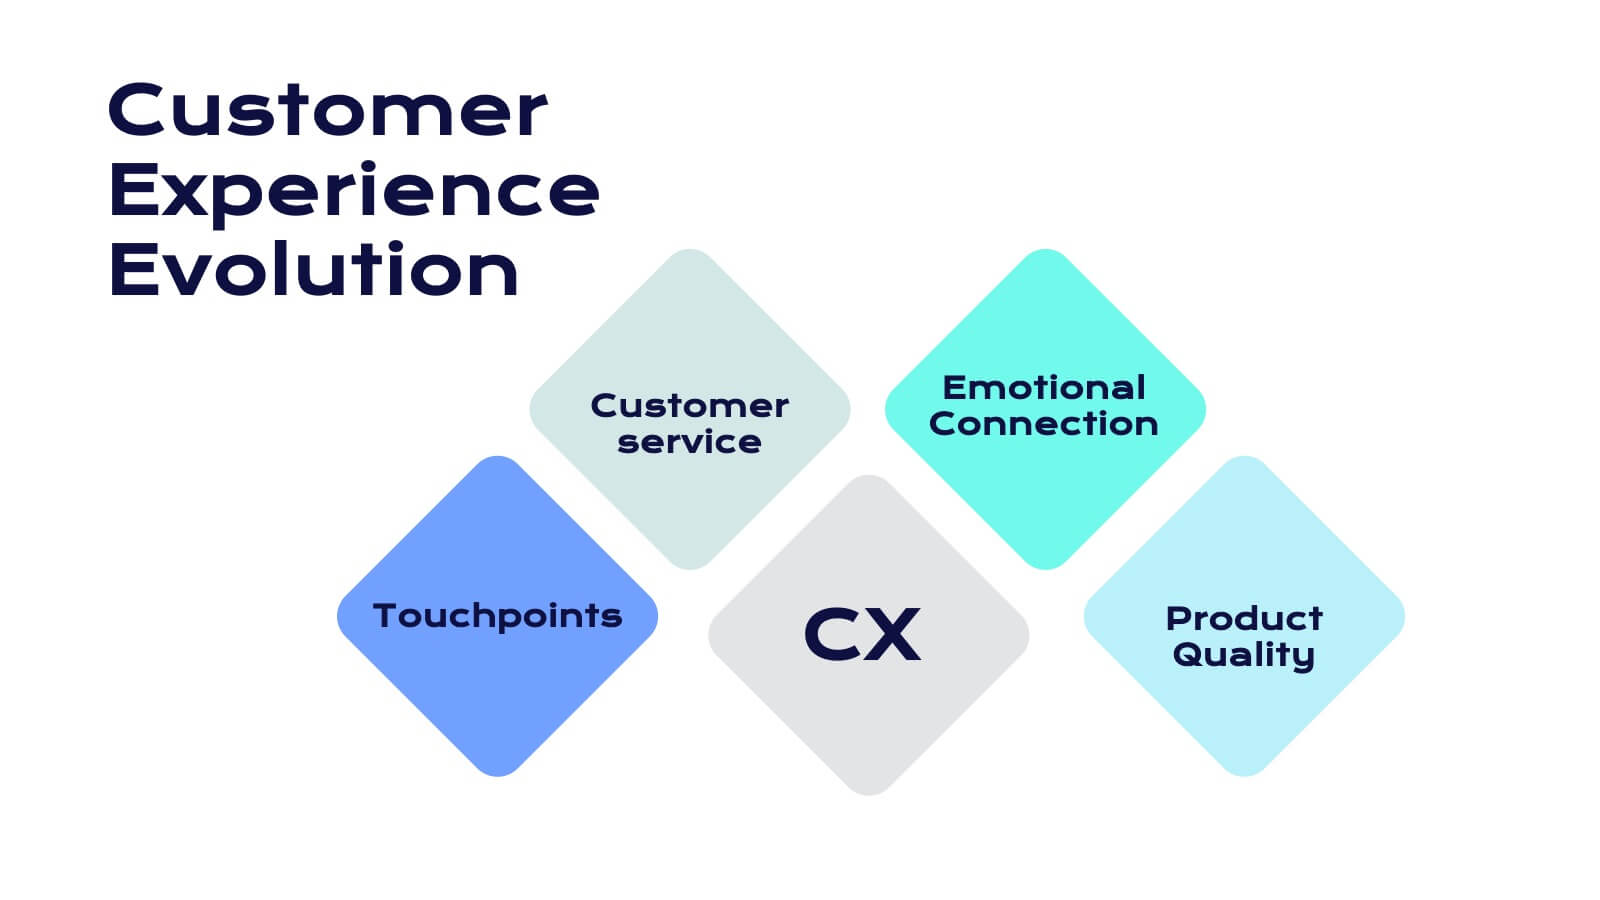
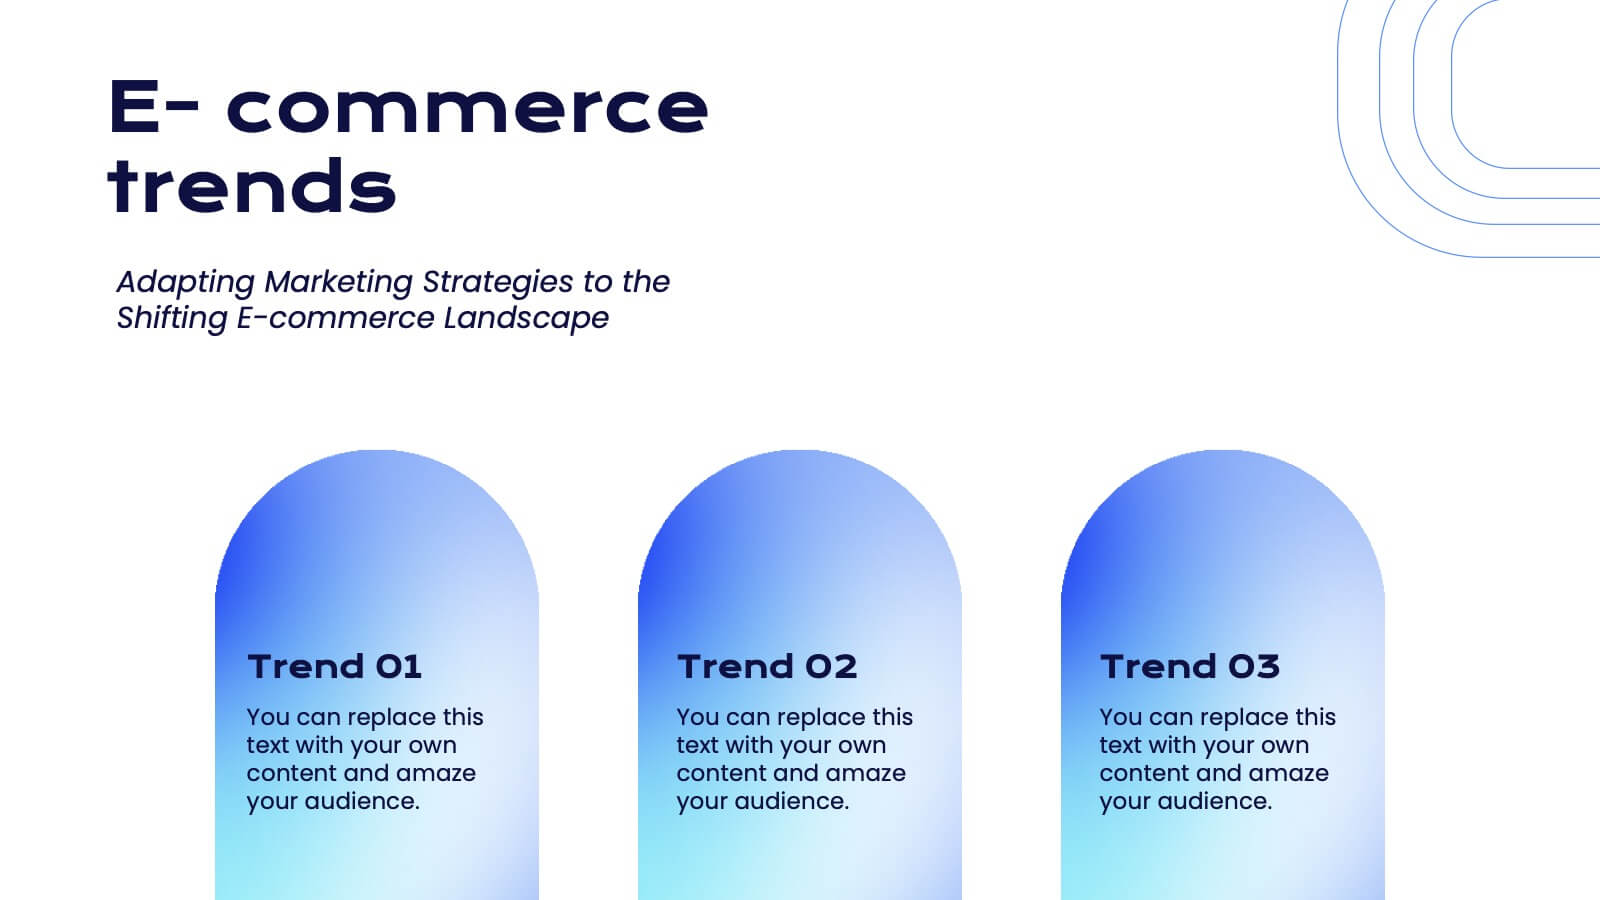
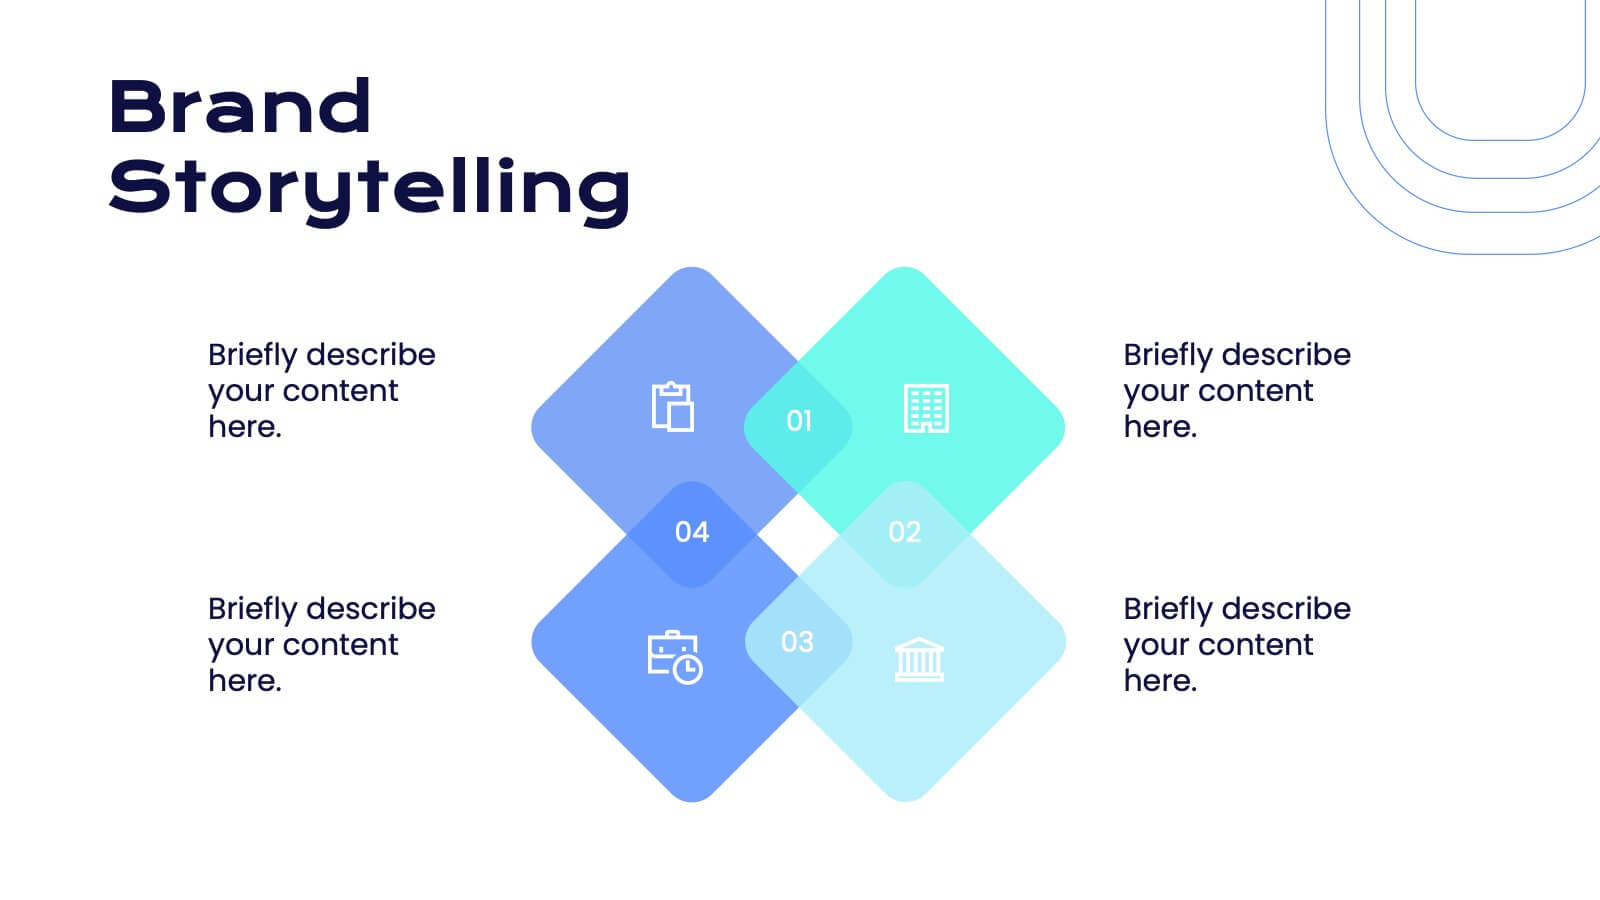
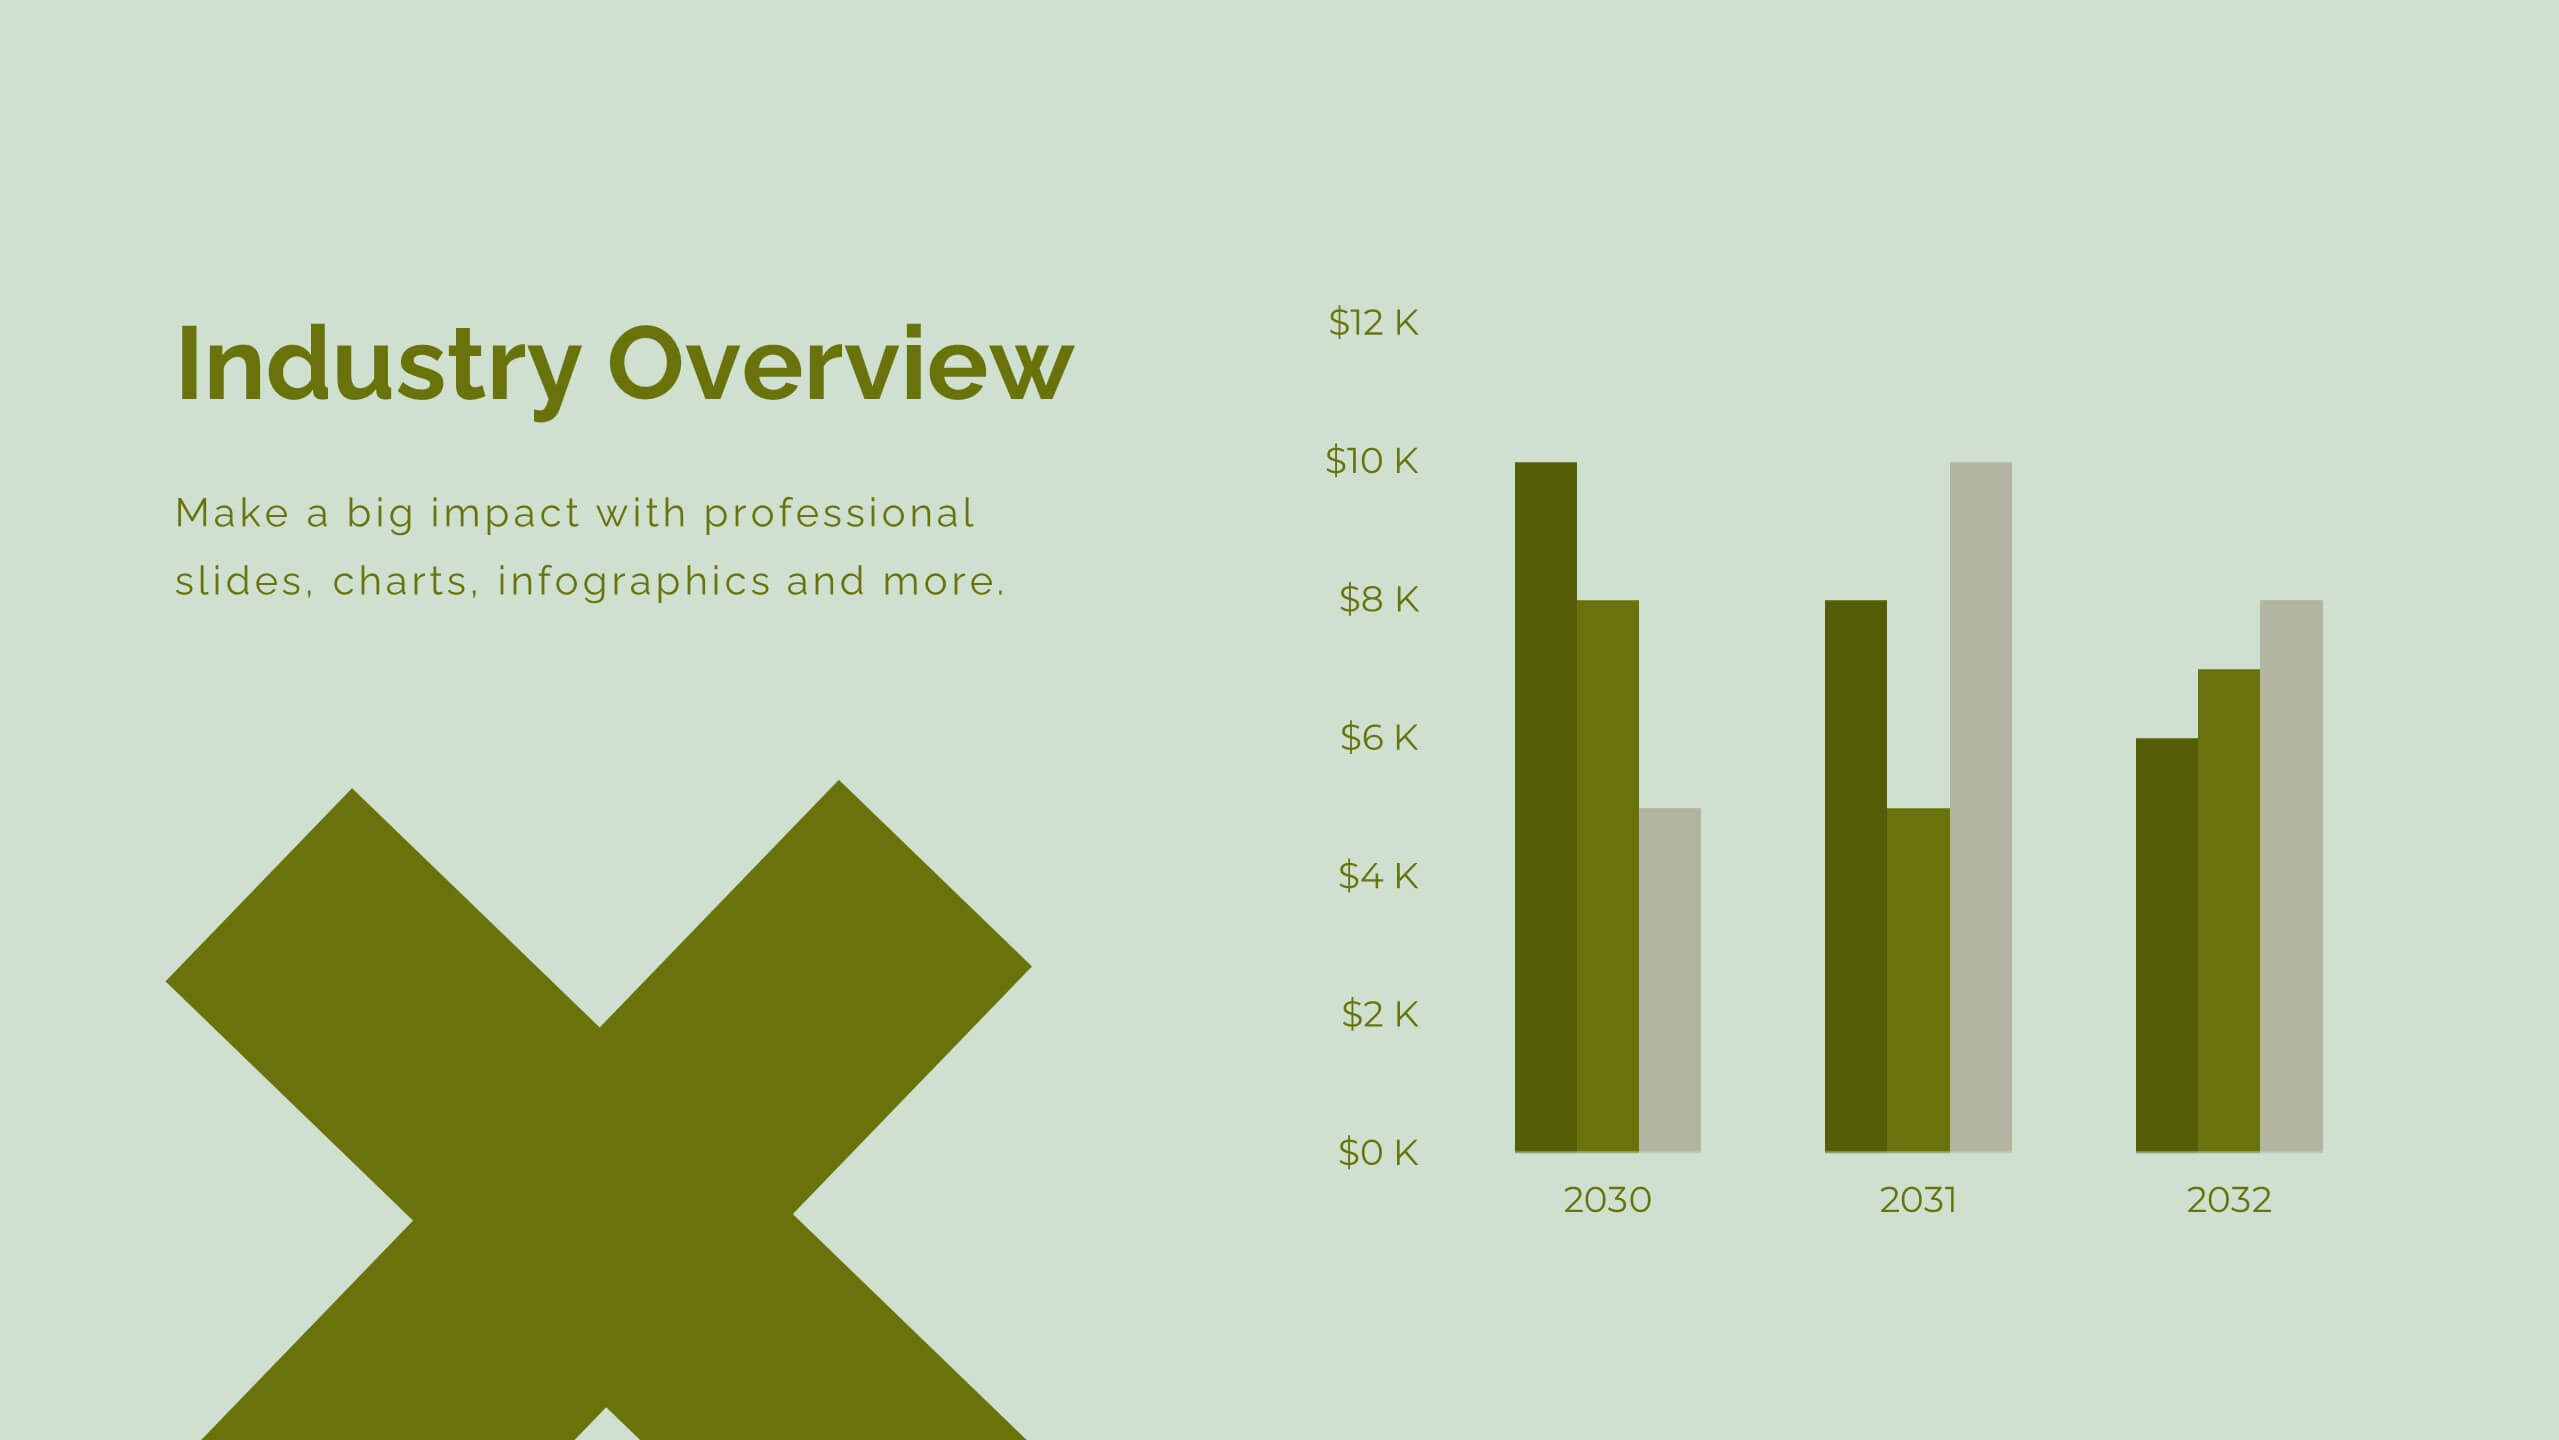
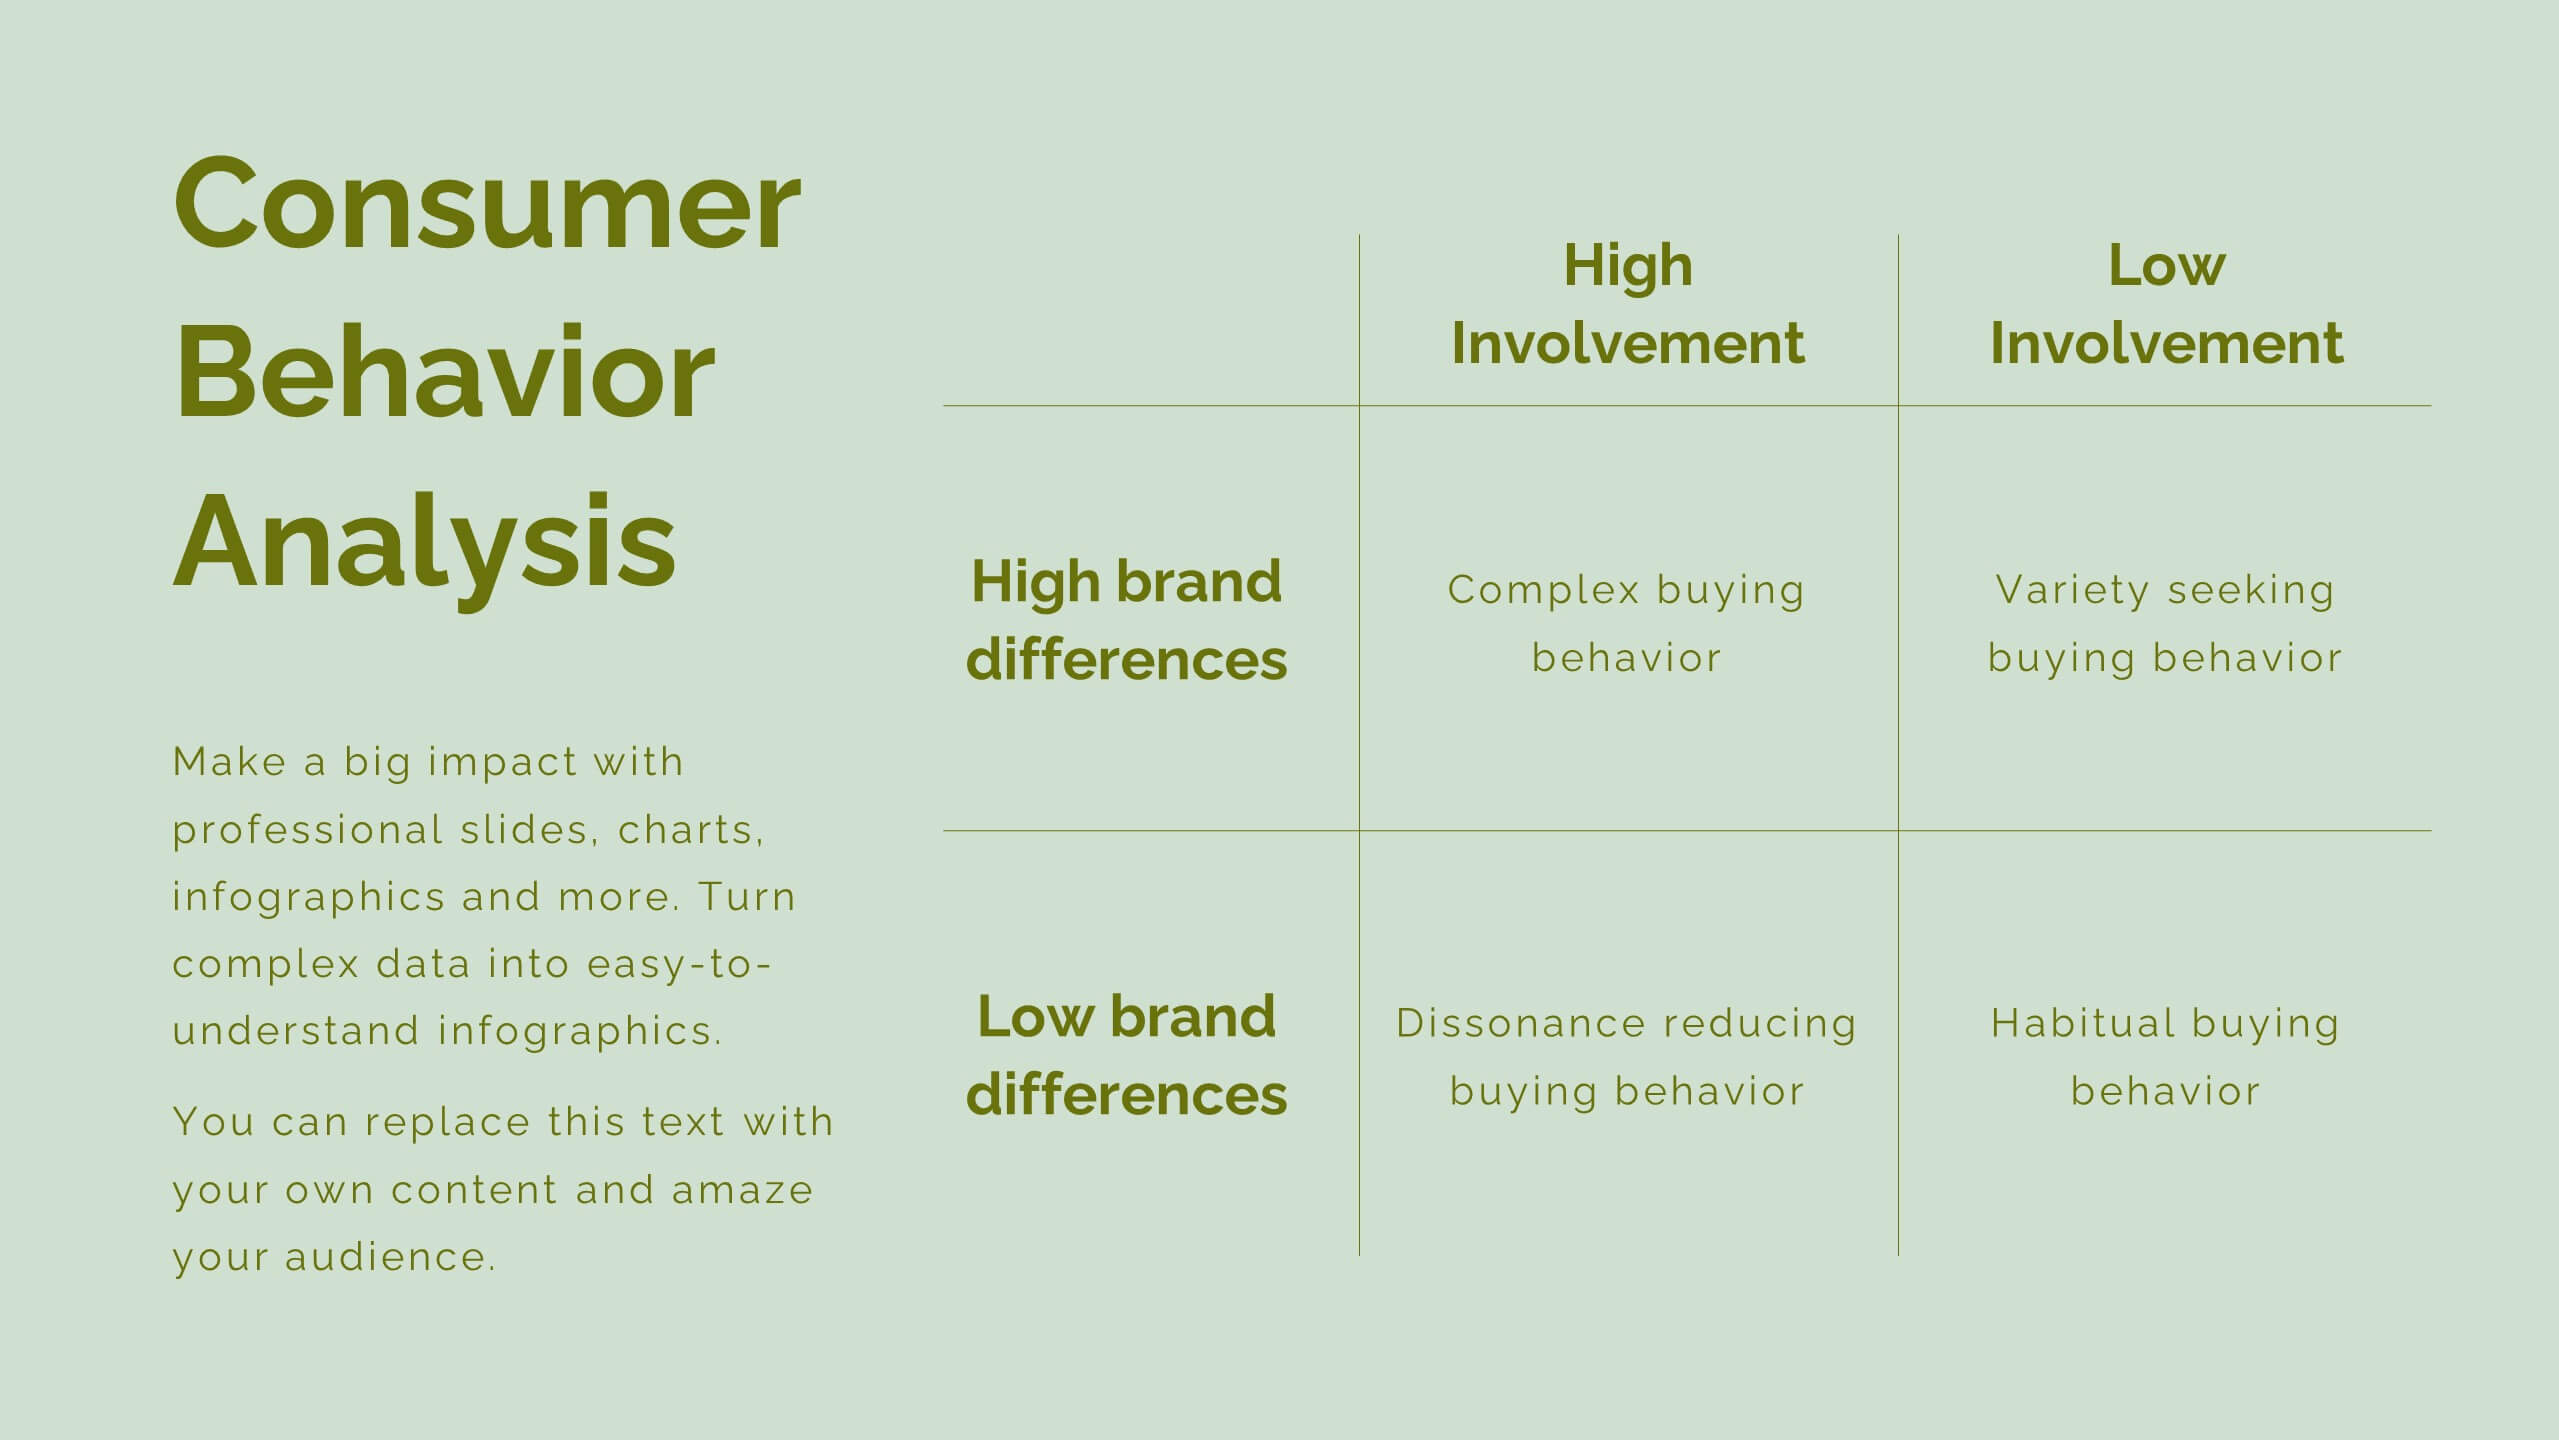
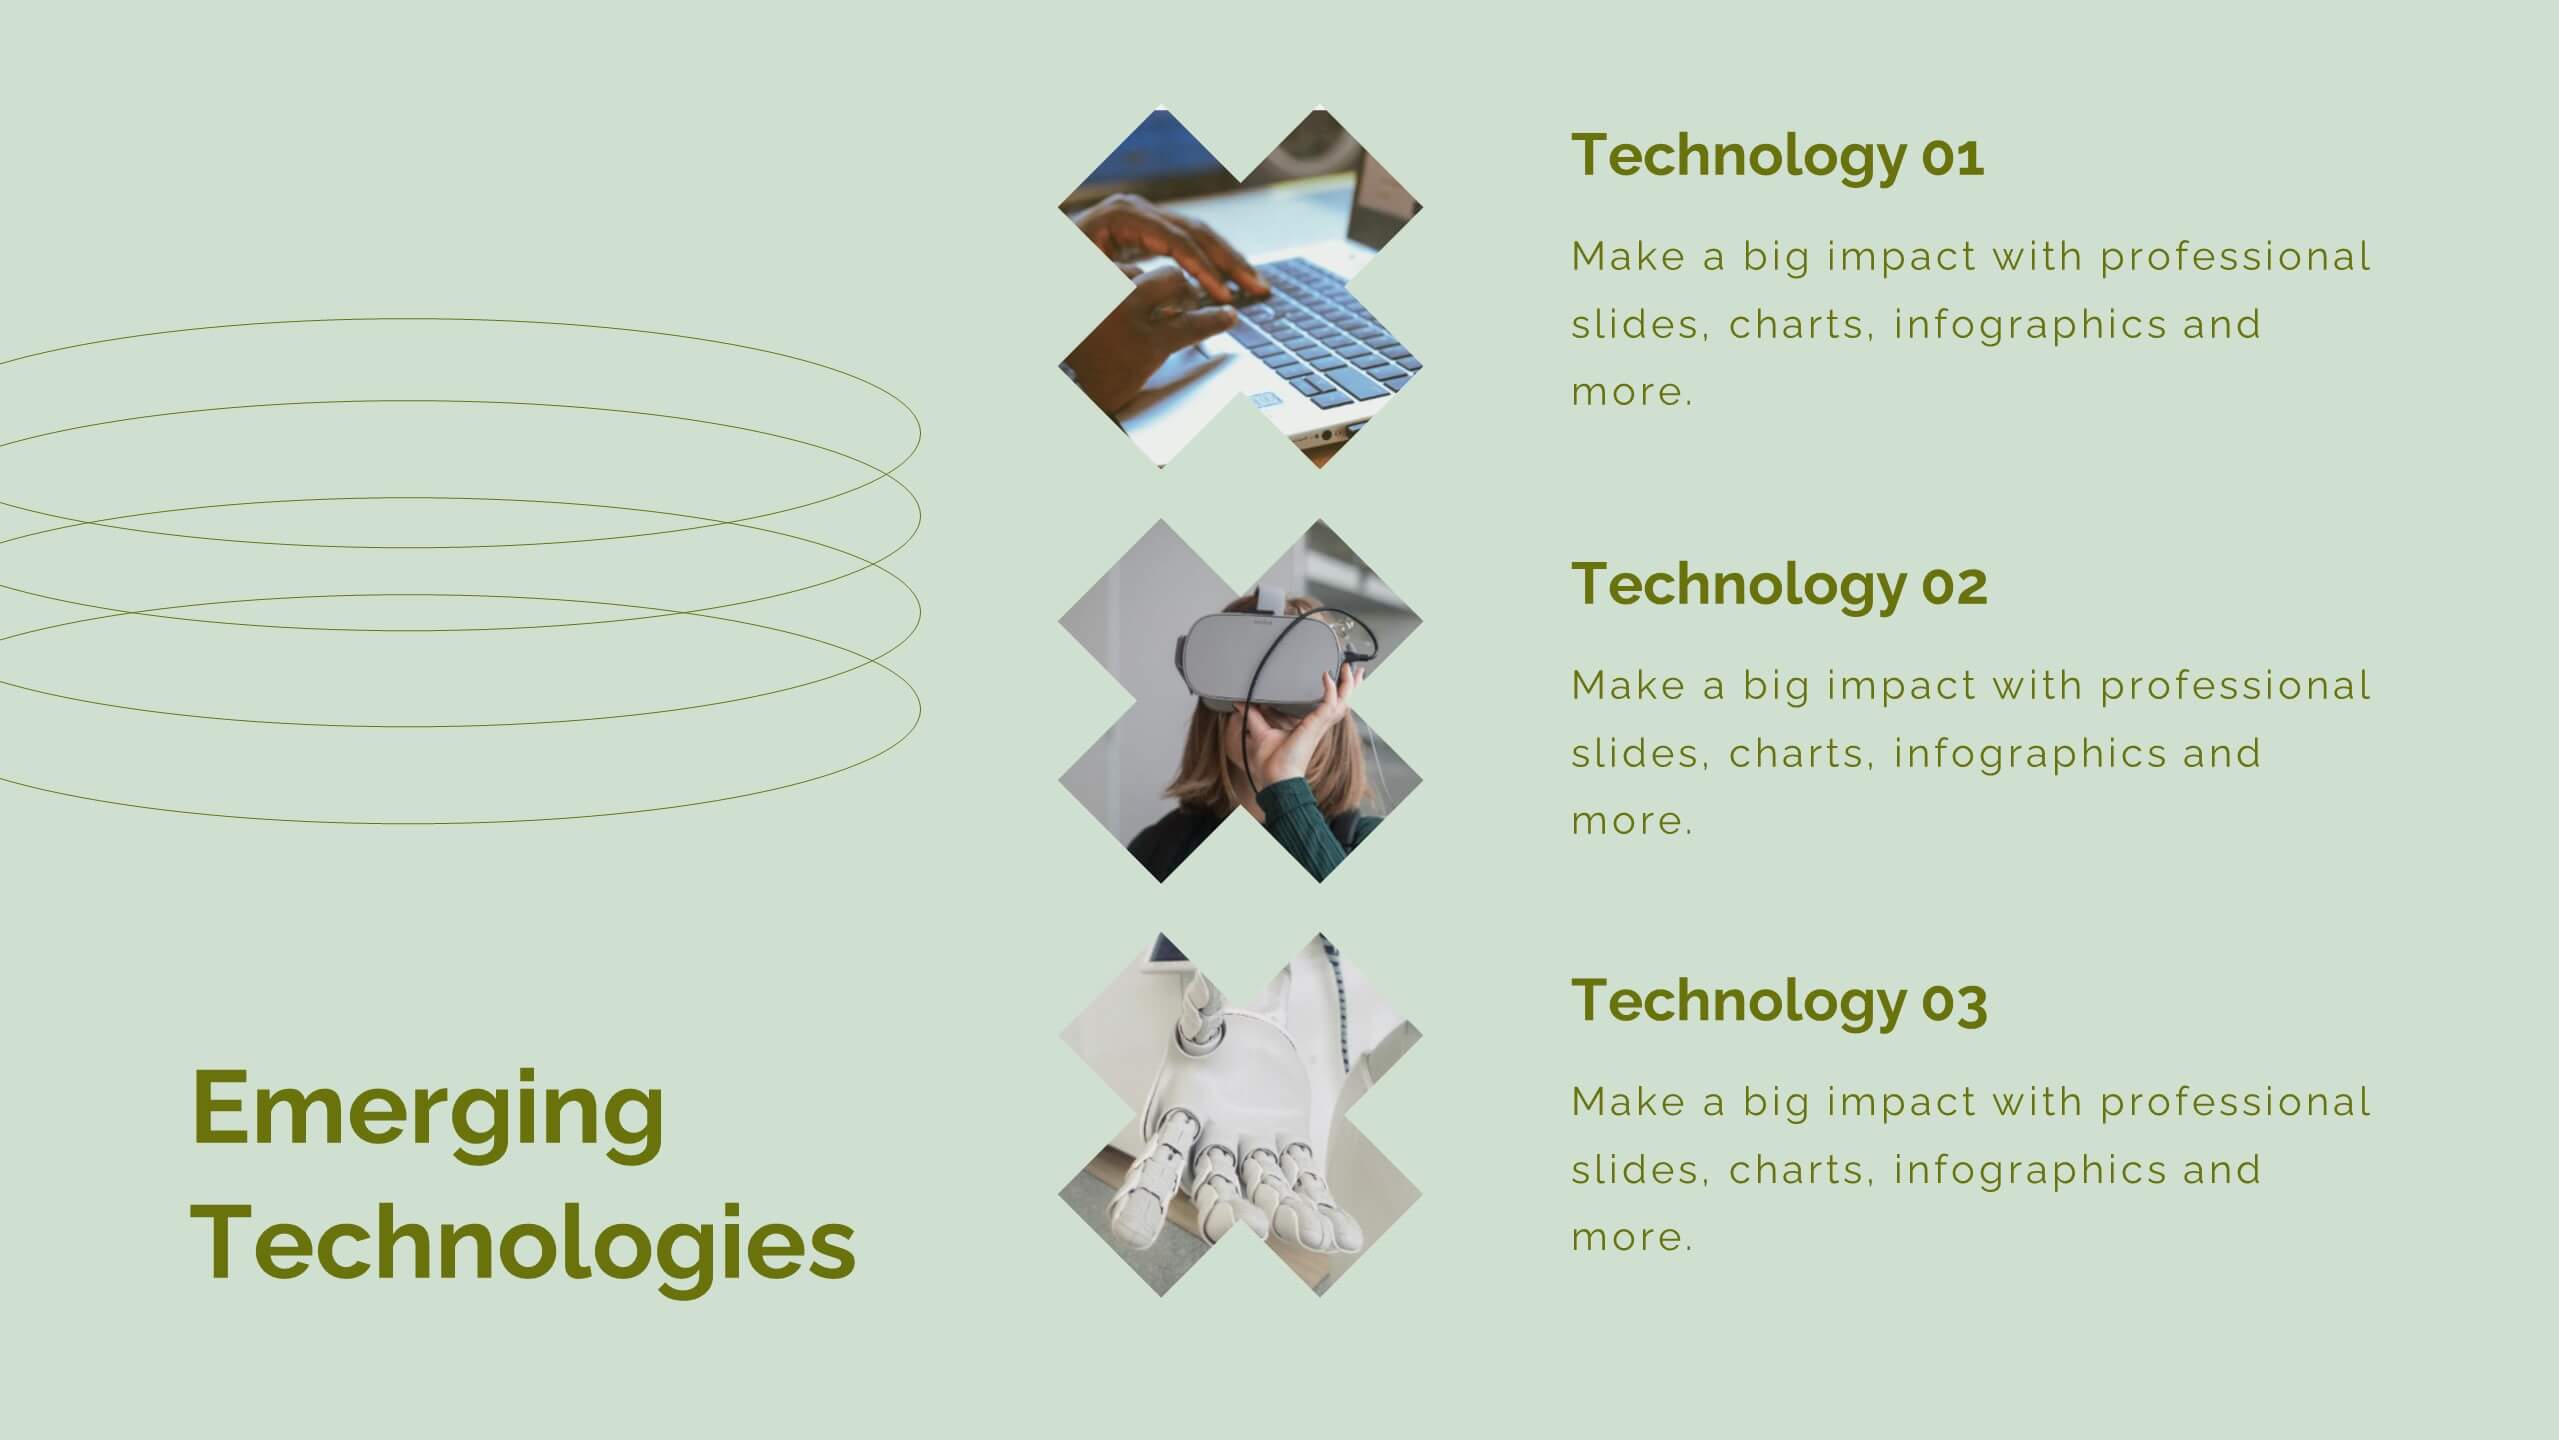
Aura Digital Marketing Strategy Plan Presentation
Revamp your digital marketing strategies with this dynamic template! Covering everything from industry overviews and consumer behavior analysis to emerging technologies and social media strategies, this template has it all. Perfect for creating compelling presentations that highlight data-driven marketing and brand storytelling. Compatible with PowerPoint, Keynote, and Google Slides.
6 diapositivas
Arrow Process Infographic
The Arrow Process Infographic offers a dynamic and directional flow to represent various stages or steps in a process. This template is designed with sharp arrows pointing the way forward, symbolizing progress and direction. Each arrow segment provides space for text to describe the step or milestone, making it an excellent tool for illustrating sequences,or timelines. The colors can be customized to match corporate branding or to highlight different phases distinctly. Suitable for PowerPoint, Google Slides, and Keynote presentations, this infographic can be effortlessly integrated into professional slideshows or training materials, ensuring an impactful delivery of process-related information.


7 diapositivas
Brain Infographic Presentation Template
Brain infographics can be used to communicate your business ideas in a unique way. The images provide a visual explanation of the project breakdown and how every step is important for a successful project execution. This brain infographic template is the perfect visual to show off your critical thinking skills, with a clear focus on planning and execution. Use this infographics template to illustrate the planning of your project, its control and monitoring, as well as its targets and execution. This template is a fun way to shed light on how our brains react to visuals in content.


21 diapositivas
Aetherion New Product Proposal Presentation
This Product Presentation Template is designed to effectively showcase your product's features, target market, and competitive advantages. It includes sections for customer pain points, pricing strategy, technical specifications, and marketing plans. Fully customizable for PowerPoint, Keynote, and Google Slides, it's perfect for product launches and investor pitches.