


Características


¿Tienes alguna pregunta?
Recomendar


7 diapositivas
Drawing Anatomy Infographic
Dive into the captivating world of human anatomy with our drawing anatomy infographic. Crafted with vibrant hues of green, orange, red, and blue, this template brings to life the intricacies and artistry of the human form. Whether you're an aspiring artist, a seasoned illustrator, or an educator, this infographic is tailored to enhance your understanding or teaching of anatomical details. The fun, colorful design ensures engagement, making learning a visually pleasing experience. Seamlessly incorporate it into PowerPoint, Keynote, or Google Slides for versatile and effective presentations.


6 diapositivas
Personal and Business Insurance Plans Presentation
Compare and Present Insurance Options effortlessly with this Personal and Business Insurance Plans Presentation template. Designed to clearly illustrate different insurance plans, this slide helps in comparing coverage options, benefits, and key features for both personal and business policies. Ideal for insurance agencies, financial consultants, and corporate presentations, this template is fully customizable and compatible with PowerPoint, Keynote, and Google Slides for seamless editing.


7 diapositivas
Summary Infographic
This collection of summary slides is expertly crafted to provide concise and clear overviews of complex information, making it ideal for concluding presentations, meetings, or reports. Each slide features a distinctive design with a strong focus on structure and readability, employing a balanced use of space and typography to highlight key points effectively. The slides utilize varied layouts, including bullet points, diagrams, and flowcharts, allowing for the presentation of summary data in a visually appealing and easily digestible format. These elements are crucial for summarizing the results of discussions, outlining project statuses, or presenting conclusions and next steps in a professional setting. Color coding and iconography are strategically used to categorize information and emphasize important metrics or conclusions, aiding in quick comprehension. This set is invaluable for professionals looking to present executive summaries, project outcomes, or strategic recommendations clearly and effectively, ensuring audiences grasp the essential takeaways without getting lost in details.


3 diapositivas
Early Detection and Prevention of Breast Cancer
Promote awareness and proactive care with this “Early Detection and Prevention of Breast Cancer” slide. Designed with an impactful visual of a female silhouette and icon-based health markers, it’s ideal for medical presentations, awareness campaigns, and corporate wellness programs. The infographic layout clearly communicates key statistics, risk factors, or steps for prevention. Fully editable in PowerPoint, Keynote, and Google Slides.


6 diapositivas
E-Learning Industry Infographic
E-learning, short for "electronic learning," refers to the use of digital technologies to deliver educational content and programs to learners via the internet or other digital platforms. This infographic template is a visual representation that provides key information and insights about the e-learning industry. This encompasses a wide range of online learning methods, tools, and resources that cater to various educational needs and goals. This template serves as a valuable tool to educate viewers about the e-learning landscape, its benefits, and its potential for transforming education and training.


6 diapositivas
Table of Content Layout Presentation
Kick off your presentation with a clean, modern layout that instantly guides your audience through each section with clarity and style. This design highlights key topics in a structured, easy-to-follow sequence, making navigation simple and intuitive. Fully compatible with PowerPoint, Keynote, and Google Slides for seamless use.


6 diapositivas
Profit Threshold Break-Even Calculation Presentation
Illustrate financial performance with this profit threshold timeline. The layout spans from big loss to high profit, marking each stage with flag icons and editable labels. Ideal for break-even analysis, sales strategies, or ROI comparisons. Easily customizable in PowerPoint, Keynote, and Google Slides to match your brand’s visual identity.


4 diapositivas
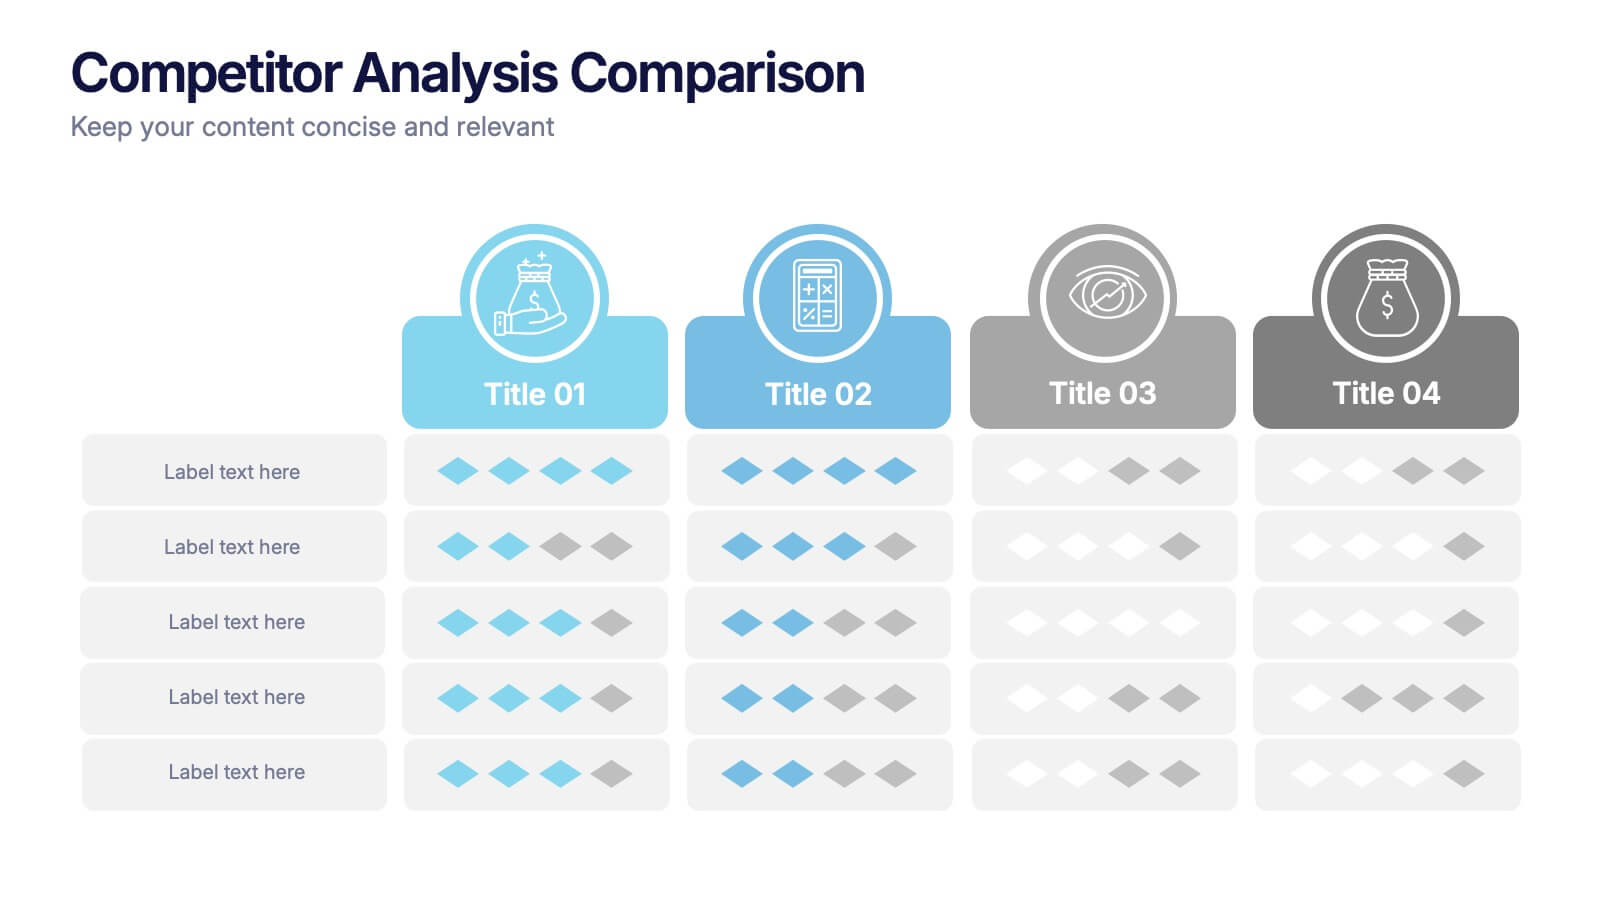
Competitor Analysis Comparison Presentation
Quickly evaluate strengths and weaknesses across your market landscape with this Competitor Analysis Comparison Presentation. Featuring clean tables, icons, and rating visuals, it's ideal for highlighting where your brand stands out. Fully editable in PowerPoint, Keynote, and Google Slides.


6 diapositivas
Multiple Business Solutions Options Slide Presentation
Explore diverse strategies with the Multiple Business Solutions Options Slide Presentation. Featuring a vertical stack of labeled briefcases (A–F), this slide is designed to compare and communicate multiple business ideas, solutions, or pathways in a clear, structured layout. Ideal for pitching product variations, workflow choices, or market entry tactics. Each option is paired with customizable text fields for added clarity. Compatible with PowerPoint, Keynote, and Google Slides for easy editing and integration into your existing decks.


5 diapositivas
Sports Industry Market Trends Presentation
Visualize key metrics in the sports sector with this dynamic Sports Industry Market Trends slide. Designed with a timeline layout and medal-inspired percentage rings, it allows you to highlight four core insights or data points. Ideal for industry overviews, competitor benchmarking, or annual sports business reports. Fully editable in PowerPoint, Keynote, and Google Slides.


26 diapositivas
Company Profile and Accomplishments Presentation
A company profile is a document that provides an overview of a business entity. This template serves as a company introduction, presenting essential information about company history, products or services, achievements, goals, and other relevant details. This template showcases the milestones and capabilities of a company. This presentation is perfect for businesses, startups, or organizations looking to highlight their success, growth, and overall expertise in their industry. The clean layout, engaging visuals, and comprehensive information, will help your presentation leave a lasting impression on your audience and enhance your company's reputation.


5 diapositivas
Employee and Team Performance Analysis Presentation
Visualize individual and team contributions with this clear and structured performance analysis template. Showcase key metrics, employee growth, and team achievements using easy-to-read layouts and progress indicators. Ideal for HR reports, performance reviews, and team evaluations. Fully editable in PowerPoint, Keynote, and Google Slides.


4 diapositivas
Preventative Healthcare Strategies Presentation
Present medical insights with clarity using this syringe-themed slide layout designed for preventative healthcare strategies. Ideal for showcasing public health plans, vaccination drives, or early intervention tactics. Fully editable in PowerPoint, Keynote, and Google Slides, this modern visual aids healthcare professionals in delivering data-driven, concise messages with professional impact.


7 diapositivas
Cryptocurrency Market Infographic Presentation
The importance of cryptocurrency includes decentralization, privacy, accessibility, investment potential, and innovation. This template introduces the most comprehensive cryptocurrency infographic to help you increase your understanding of cryptocurrencies. You can use this template to present examples and tips on how to navigate and make commercial use of cryptocurrency. This template is designed in Powerpoint, Keynote, and Google Slides which allows you to easily edit this presentation and include your data. The cryptocurrency theme allows you to make your data stand out with a unique design.


26 diapositivas
Becka Presentation Template
Becka is a modern and powerful template for people who want to present themselves in a professional but bold way. Perfect for the CEO or company executive who wants to have a strong presence on screen. Made with clear and crisp typography, with added bold colors that appeal to both men and women which can evoke powerful emotions and confidence. This template contains easy to edit maps, charts and image place holders that are ready to use. The dynamic slides make it quick and easy to create the perfect presentation.


4 diapositivas
Current vs Future State Gap Presentation
Take your audience on a journey of progress with this dynamic slide, designed to clearly compare where things stand today and where they’re headed next. It helps highlight key gaps, improvement areas, and strategic opportunities with a simple, visual flow. Fully compatible with PowerPoint, Keynote, and Google Slides.


4 diapositivas
Environmental Sustainability Best Practices Presentation
Promote eco-friendly initiatives with the Environmental Sustainability Best Practices Presentation template. This clean and modern slide deck is designed to highlight sustainable business strategies, green initiatives, and environmental impact assessments. Featuring an intuitive layout with clearly defined sections, this fully editable design is ideal for corporate sustainability leaders, educators, and environmental advocates. Compatible with PowerPoint, Keynote, and Google Slides for seamless customization and presentation.