


Características


¿Tienes alguna pregunta?
Recomendar


8 diapositivas
Pet Care and Veterinary Clinic Business Presentation
Highlight your clinic’s services with this engaging, paw-themed slide featuring a veterinarian illustration and four colorful pawprints. Perfect for pet care presentations, animal health pitches, or client brochures. Fully editable in PowerPoint, Keynote, or Google Slides for easy customization.


7 diapositivas
Enforcement Law Infographic Presentation
A Law Enforcement Infographic is a visual representation of key concepts, statistics, and procedures related to law enforcement. This template can be used to provide an overview of various aspects of law enforcement, such as crime rates, policing strategies, and legal procedures. This infographic includes a variety of icons, illustrations, and other design elements law themed to enhance the visual appeal and make it more appealing for your viewers. This template is compatible with Powerpoint, Keynote and Google Slides making it easy to customize and edit with your own text and information.


5 diapositivas
Educational A-Z Letter Design Presentation
Present your ideas with clarity using the Educational A-Z Letter Design Presentation. This slide uses a vertical layout with stylized book-like segments and bold A–D lettering, ideal for categorizing content or showcasing multi-part learning points. Fully editable and compatible with PowerPoint, Keynote, and Google Slides.


22 diapositivas
Tranquil Project Status Report Presentation
This dynamic project report template delivers key insights with a bold, modern design. From performance metrics to market trends and client feedback, it's crafted for comprehensive yet visually appealing updates. Perfect for team presentations, this template ensures clarity and engagement. Compatible with PowerPoint, Keynote, and Google Slides, it’s ideal for project leaders!


4 diapositivas
Business Goals and Objectives Presentation
Build a strong foundation for success with this business goals and objectives template! Designed to help organizations define clear targets and align strategies, this visual layout simplifies goal-setting and planning. Perfect for corporate teams, startups, and strategists. Fully customizable and compatible with PowerPoint, Keynote, and Google Slides for effortless editing.


6 diapositivas
Business Flow Chart Design Presentation
Bring clarity and momentum to your process with a clean, visual layout that turns complex steps into an easy-to-follow flow. This presentation helps teams map stages, responsibilities, and progress with confidence, making it perfect for planning, strategy, and operations. Fully compatible with PowerPoint, Keynote, and Google Slides.


21 diapositivas
Astromeda Product Launch Presentation
This Product Launch Presentation template offers a clean and modern design to showcase your product effectively. It covers key areas such as market analysis, competitive landscape, pricing strategy, and sales approach. Fully customizable and compatible with PowerPoint, Keynote, and Google Slides, it's perfect for startups and businesses launching new products.


7 diapositivas
5G Mobile infographic Presentation
5G technology is important because it has the potential to transform the way we live, work, and interact with the world around us. This template is designed to help you create an eye catching and informative infographic on the topic of 5G technology. With this template, you can easily showcase the benefits and capabilities of 5G in an easy to understand way. This template features a vibrant and clean design, with uniquely selected color schemes and fonts to ensure that the content is visually appealing. It includes a variety of slide layouts, including text slides, images, charts and graphs!


4 diapositivas
Project Workflow Steps and Flowchart Presentation
Map out each phase of your project with clarity using the Project Workflow Steps and Flowchart Presentation. This detailed template offers a visual grid layout for illustrating task sequences, decision points, and team responsibilities. Ideal for project managers, analysts, and operations teams. Fully editable and compatible with PowerPoint, Keynote, and Google Slides.

22 diapositivas
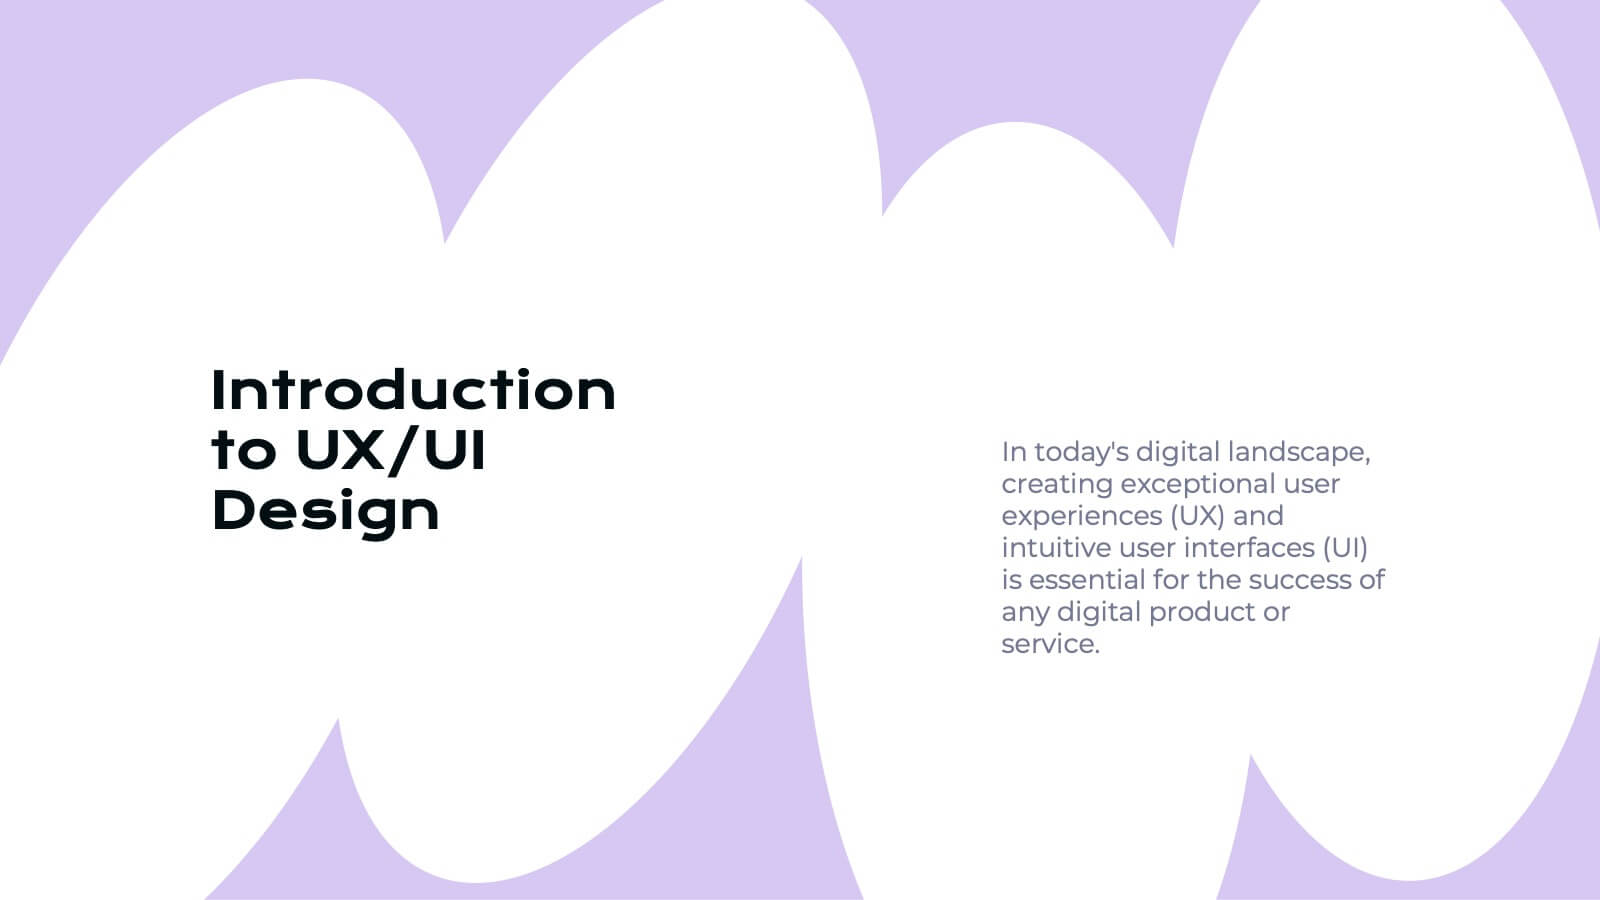
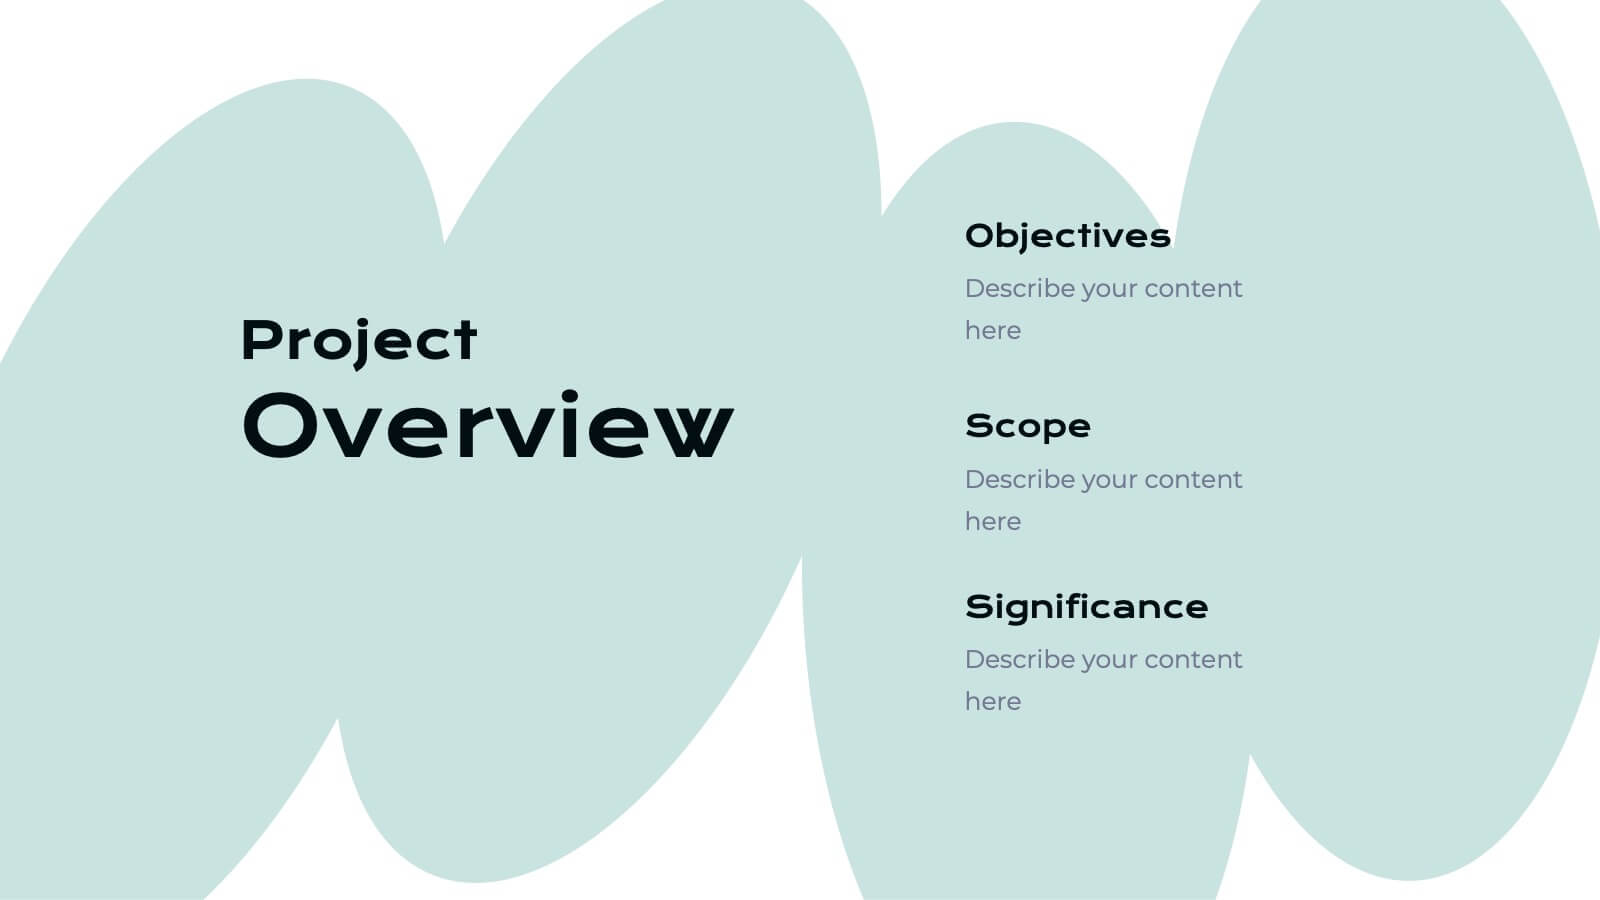
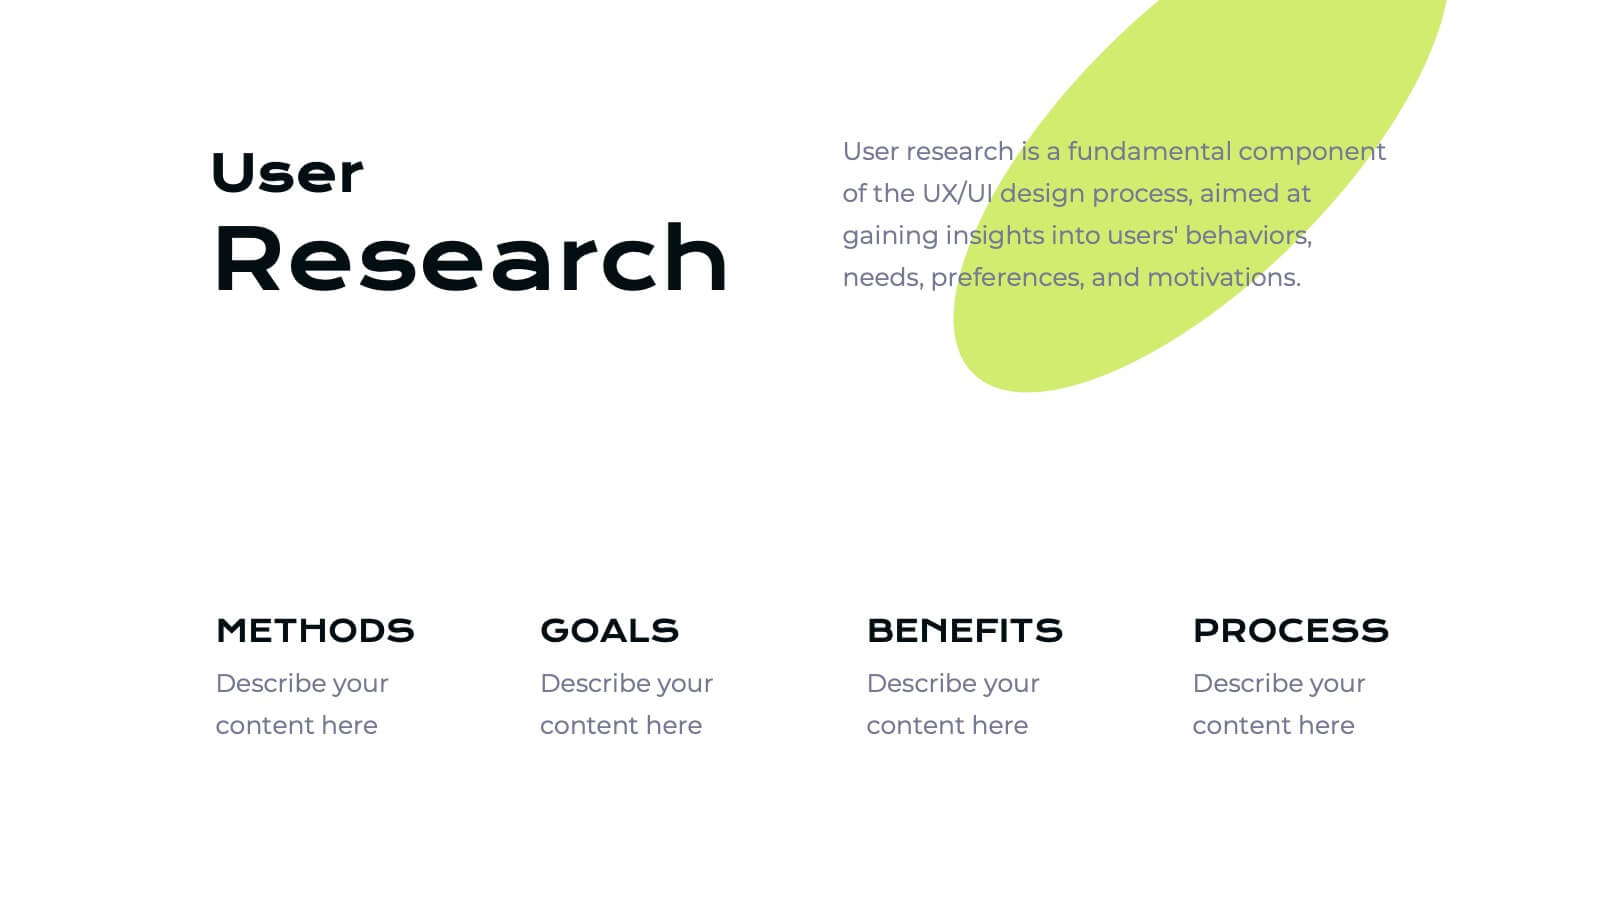
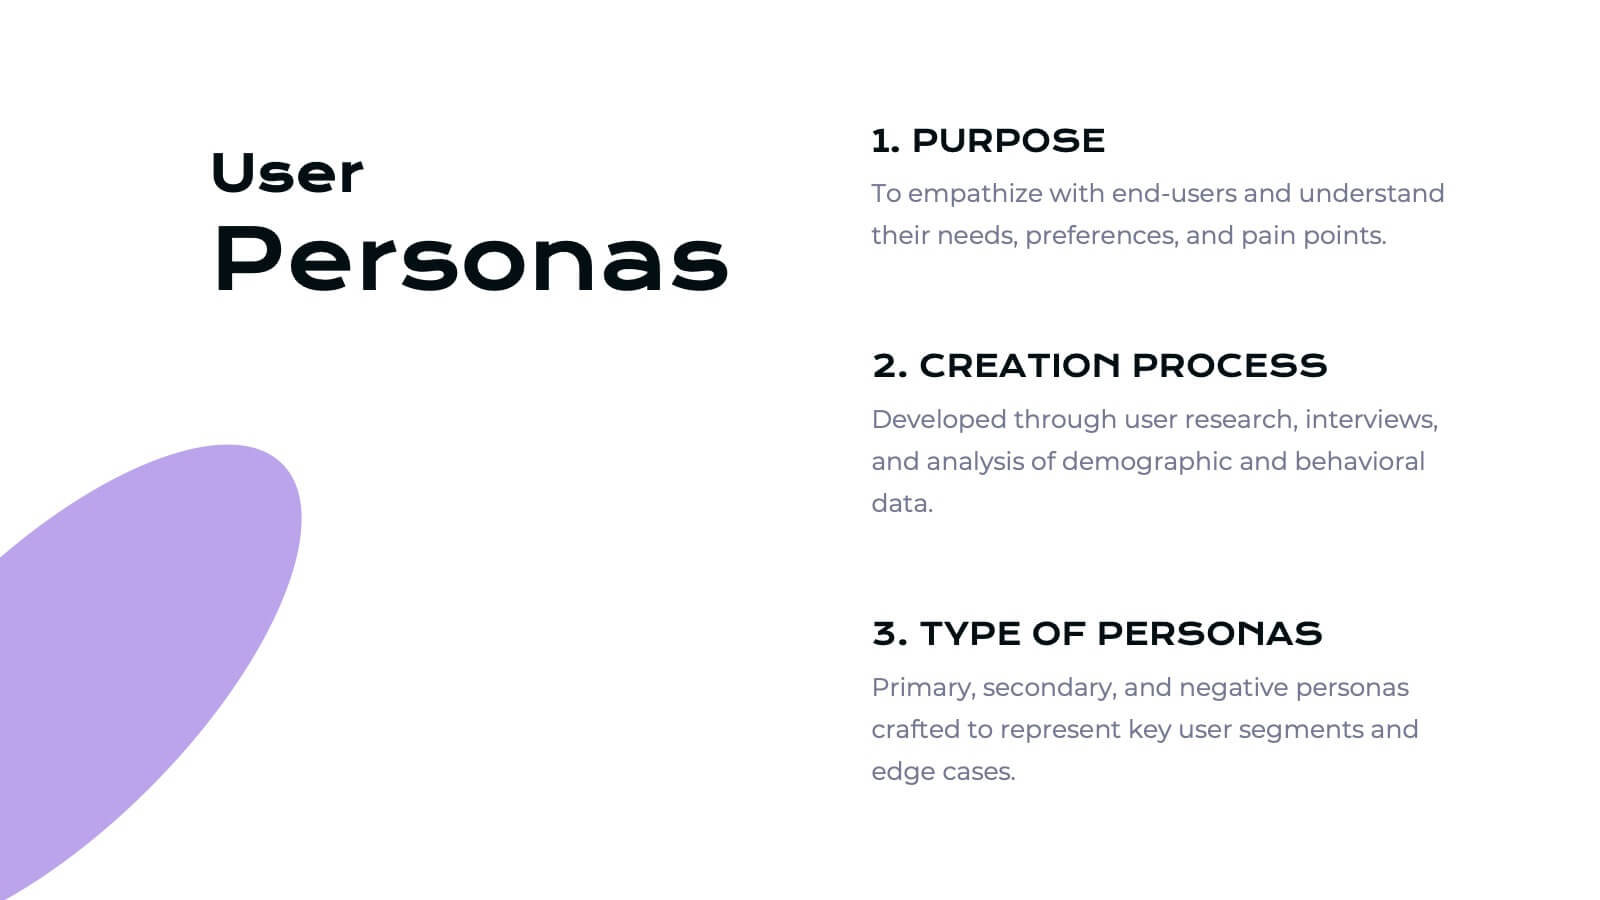
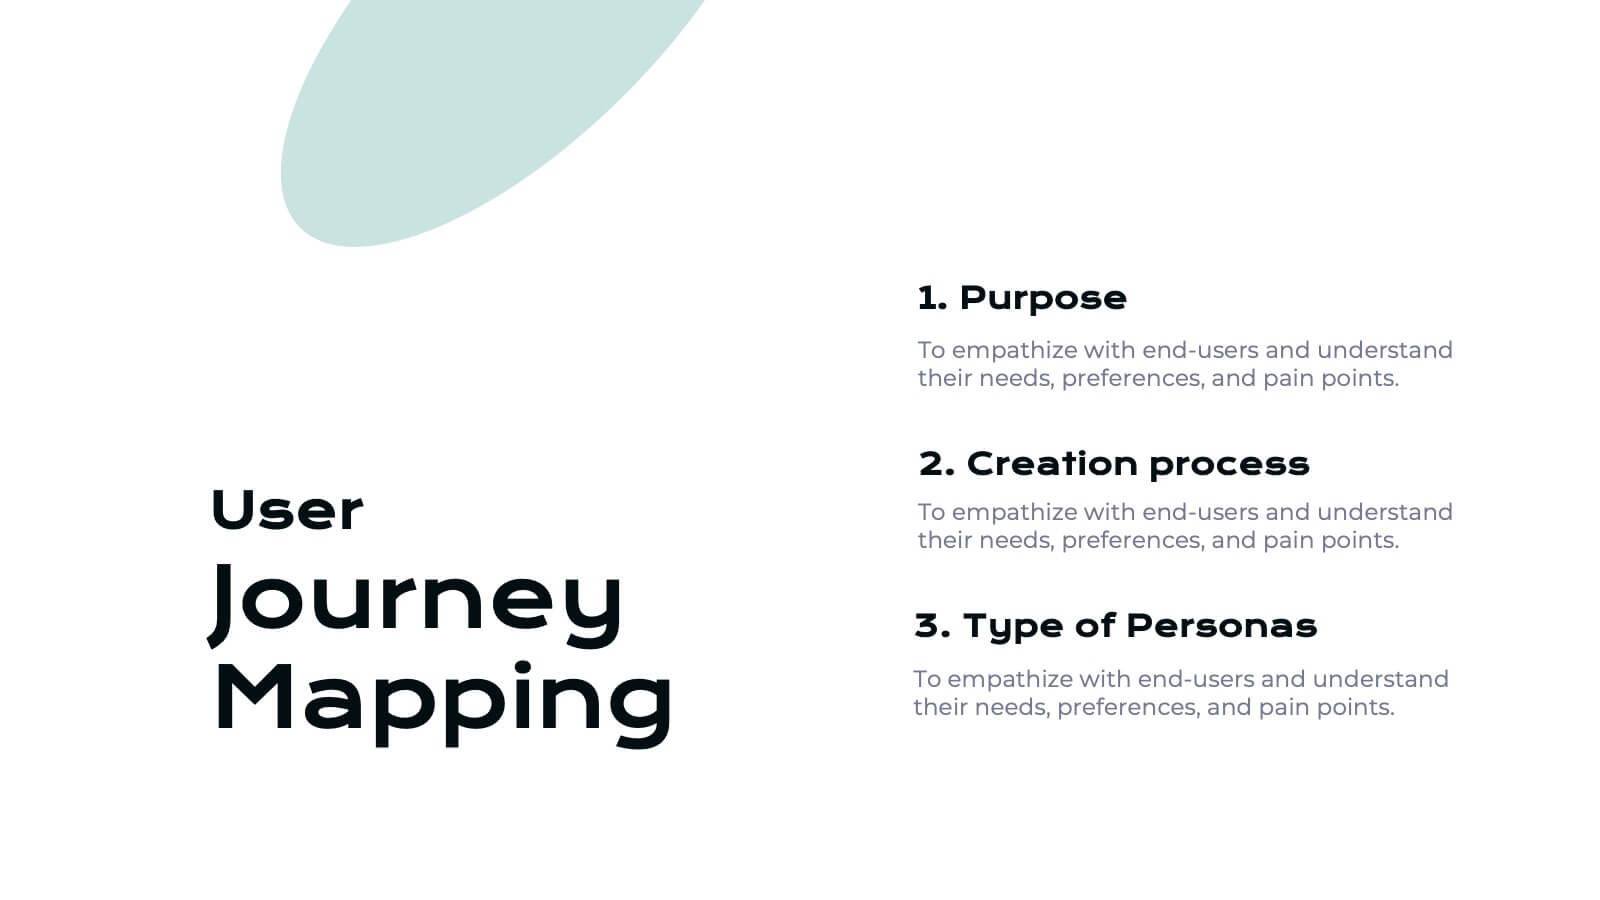
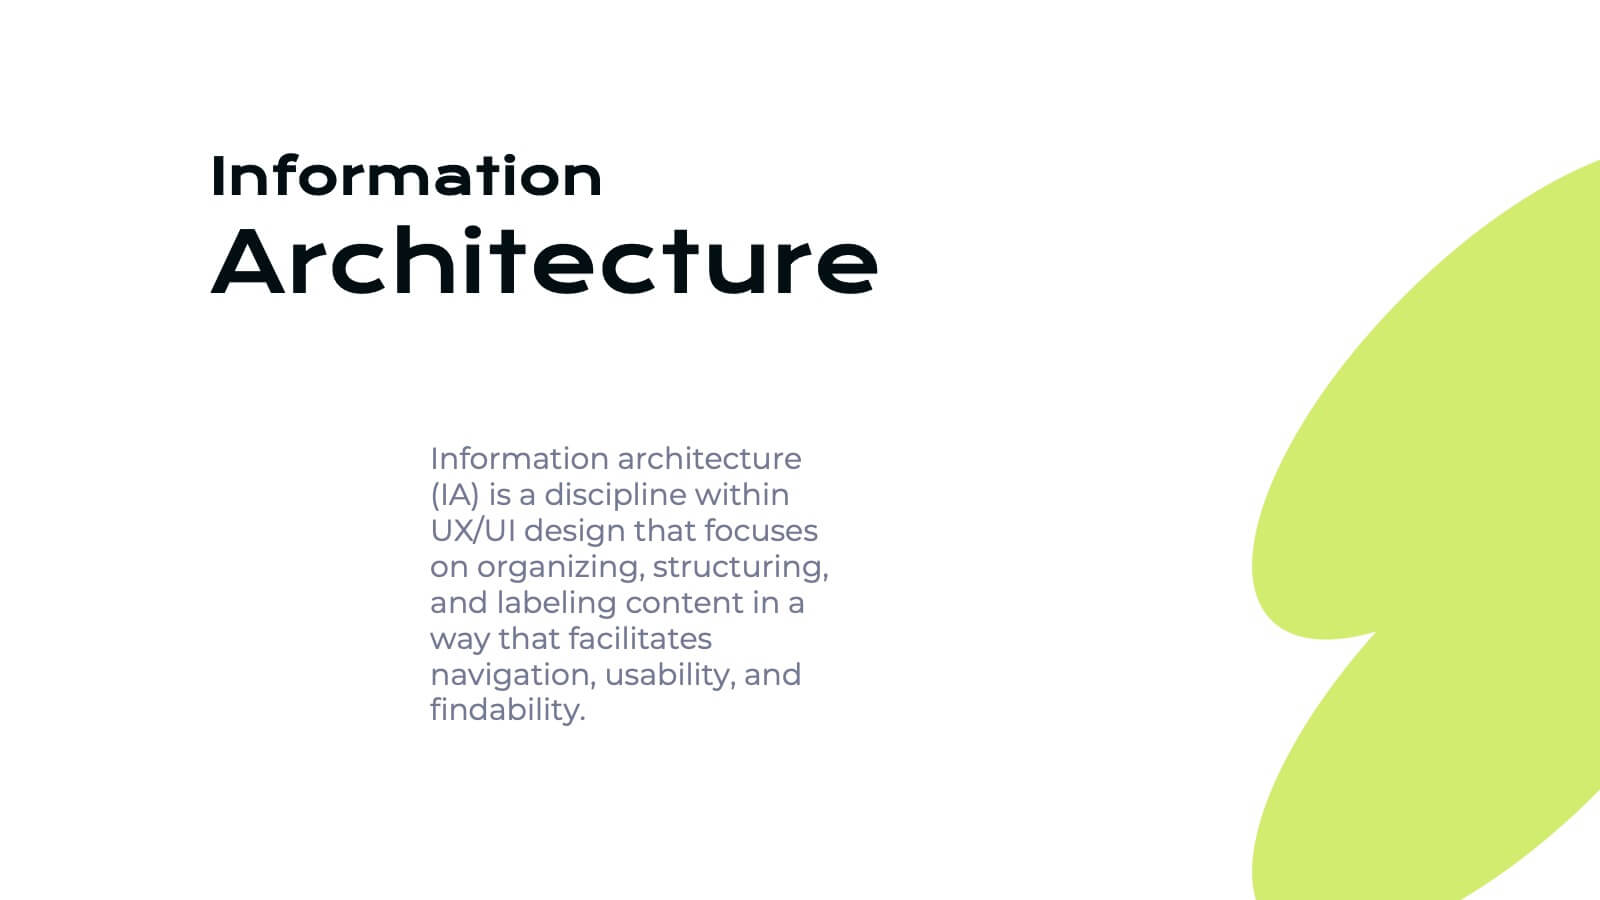
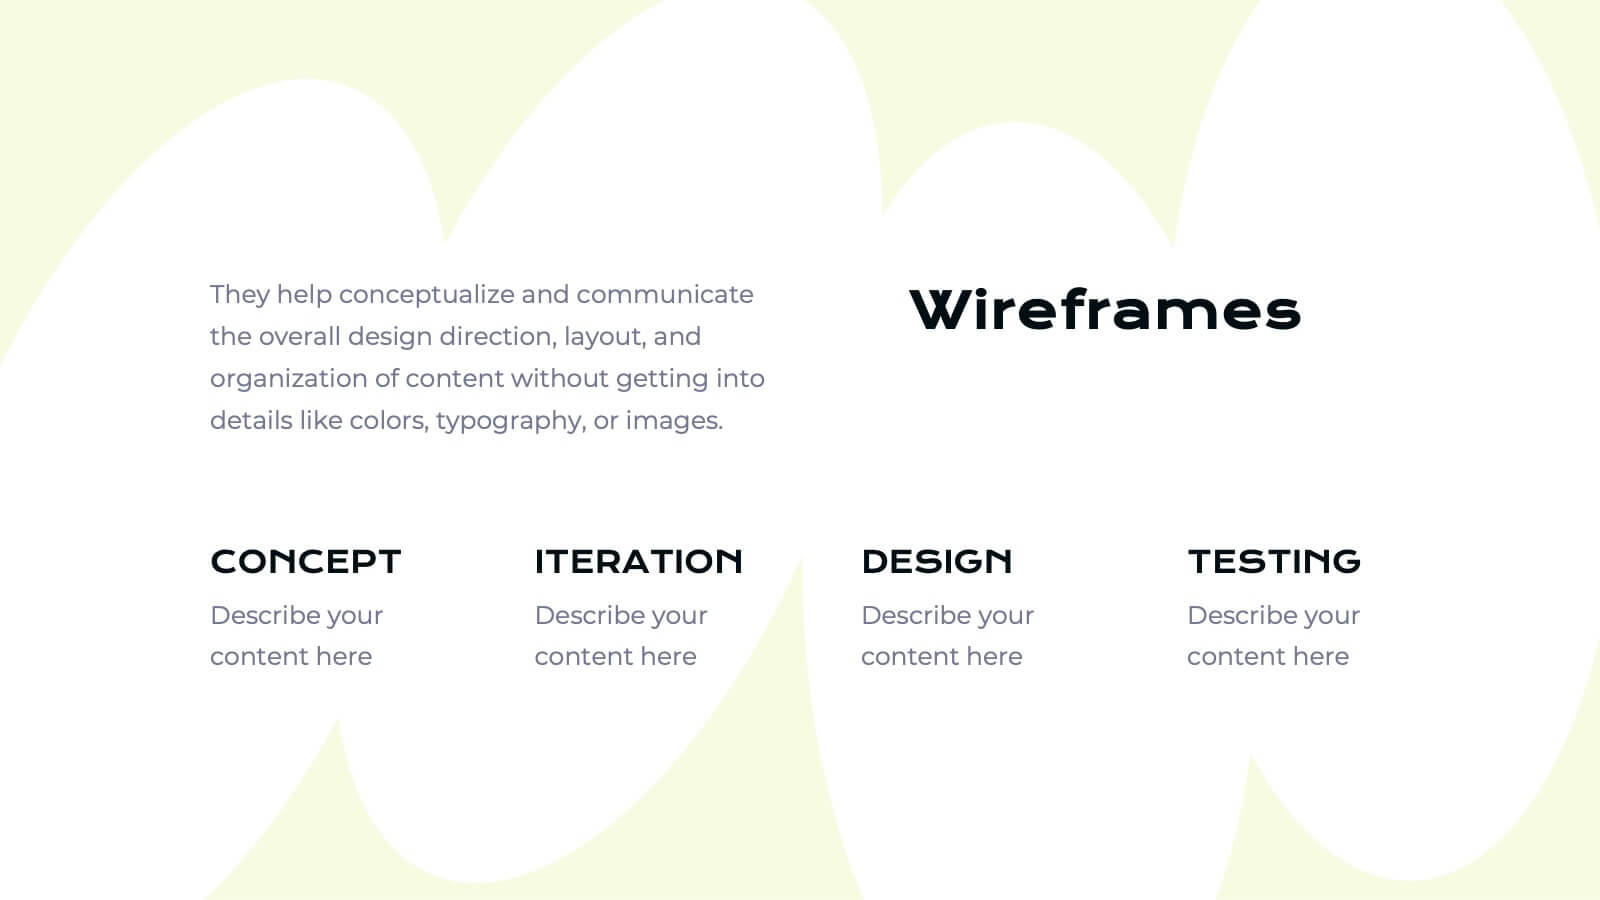
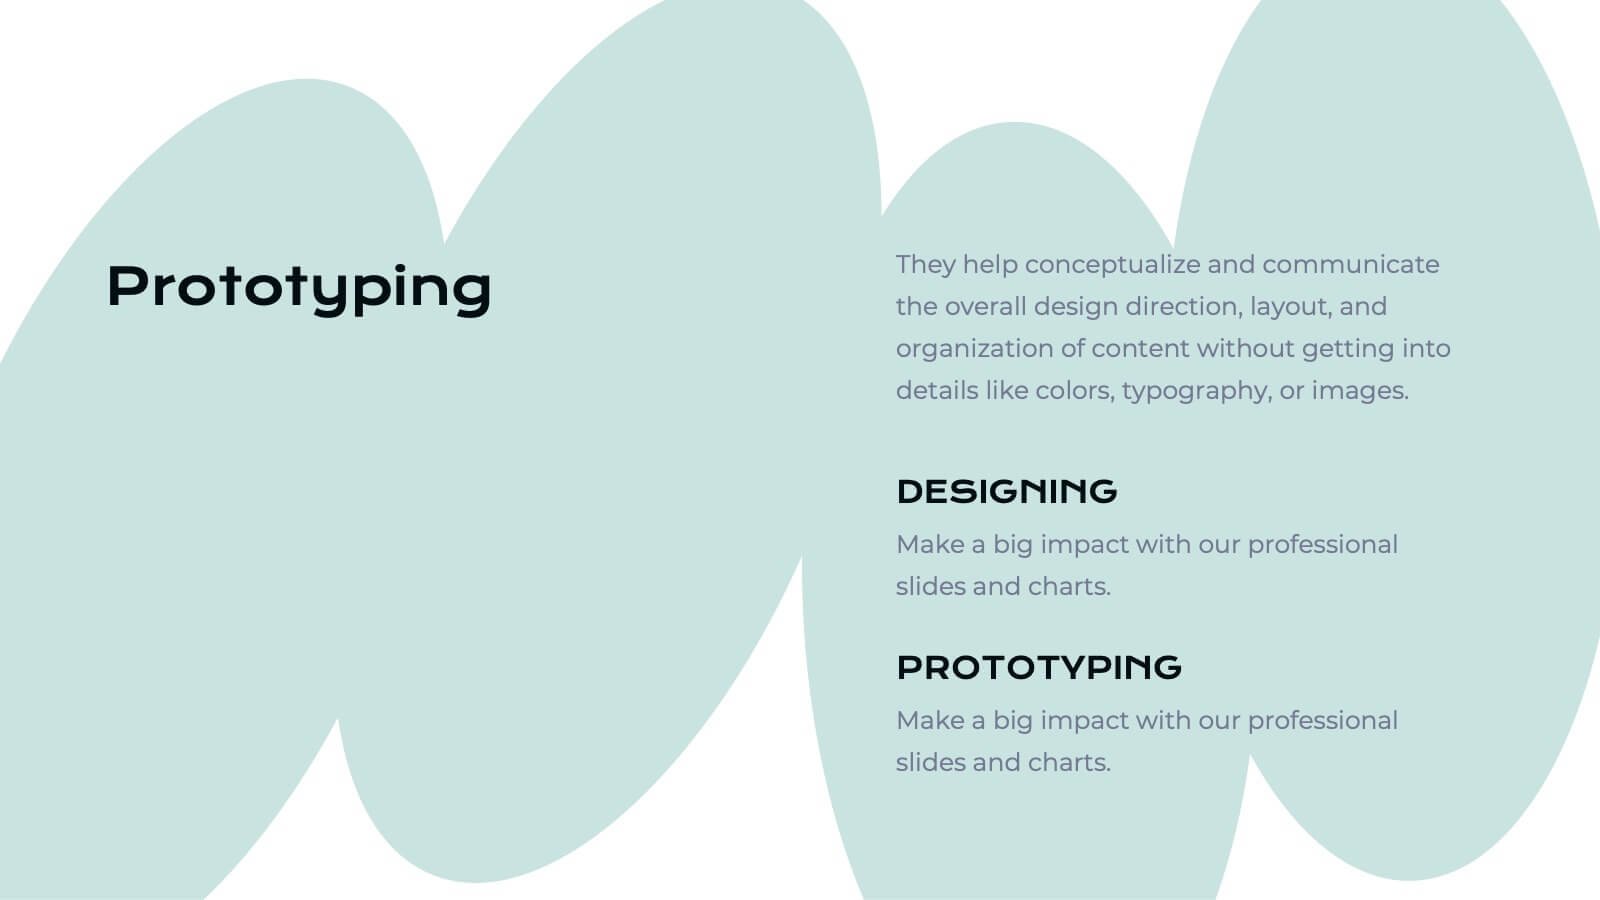
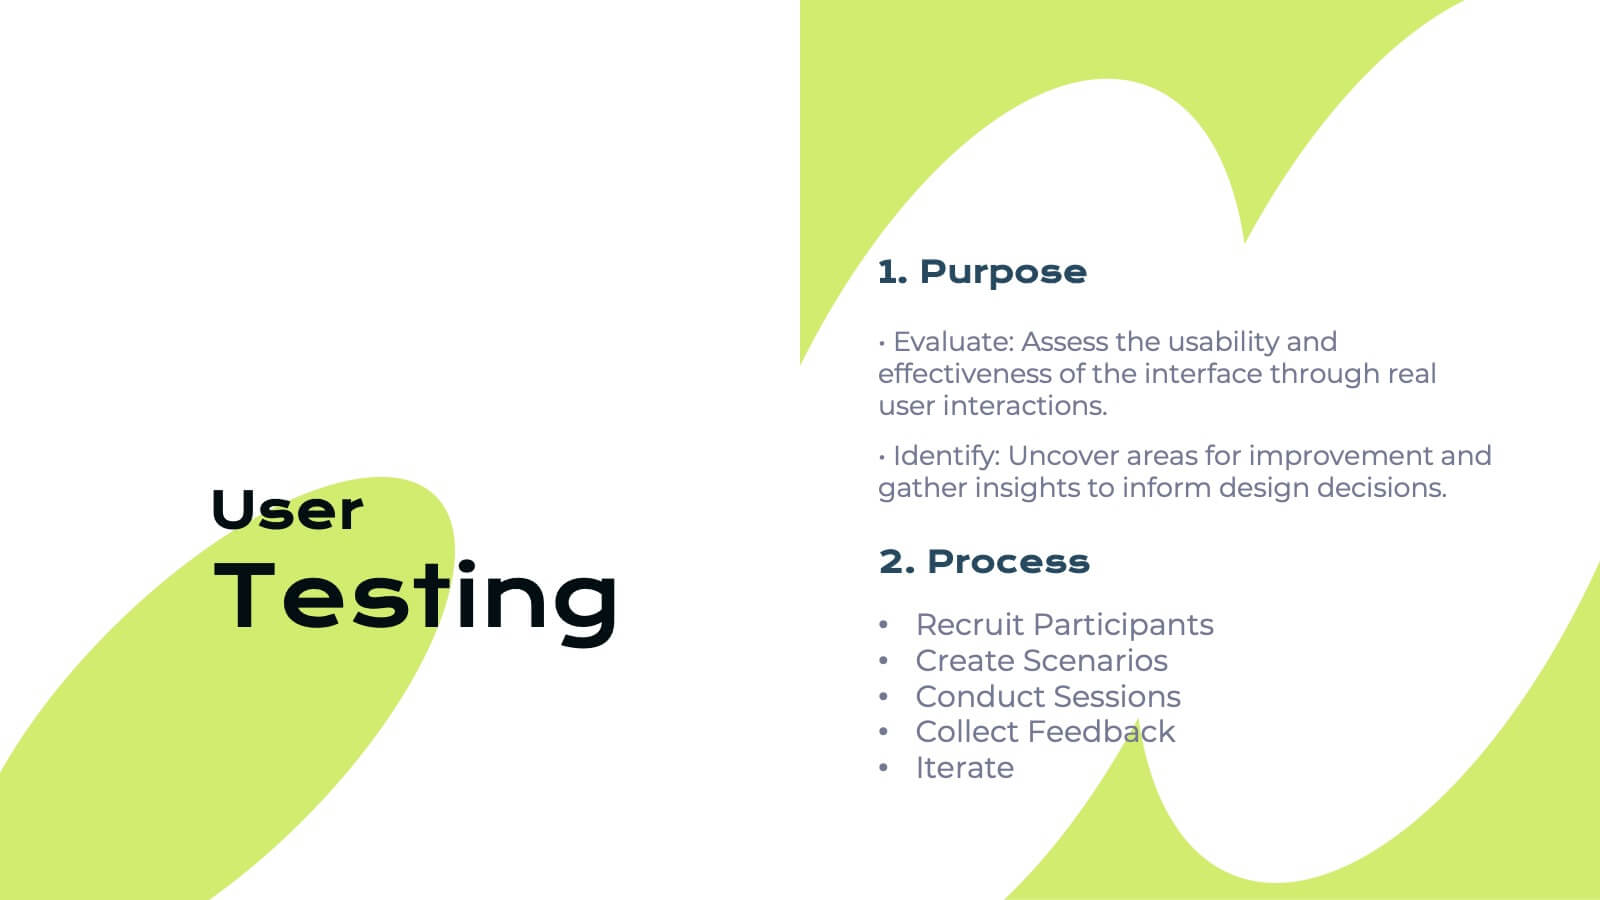
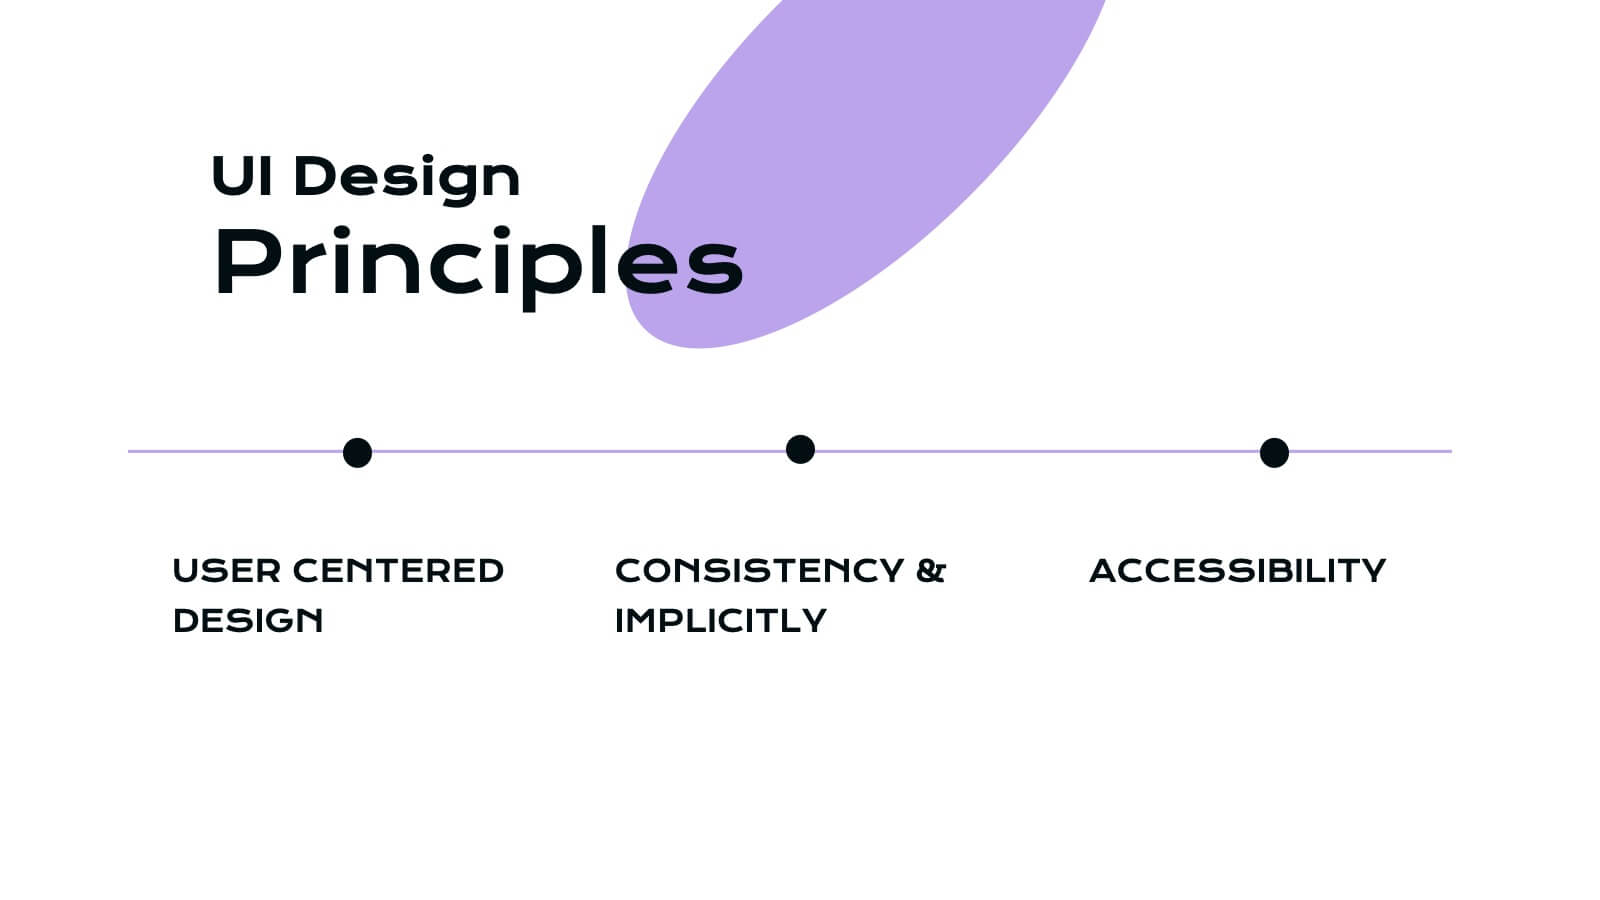
Ifrit User Experience Proposal Presentation
Unleash the power of great design with this fiery Ifrit-inspired presentation, perfect for delivering your user experience proposal! This template lets you showcase your UX strategies, research, and design process in a visually striking and well-organized format. Impress stakeholders with every slide. Compatible with PowerPoint, Keynote, and Google Slides.


5 diapositivas
Business Cycle and Wheel Diagram
Illustrate key stages, continuous workflows, or strategic frameworks with this circular business diagram. Ideal for visualizing four connected steps in a clean, modern style. Easily editable in PowerPoint, Keynote, and Google Slides for full customization.


7 diapositivas
Technology Innovations Infographic
Technology innovations refer to significant and novel advancements, improvements, or creations in processes, products, services, or systems that introduce new features, functionalities, or approaches. Get ready to ignite the tech world with our technology infographic. This infographic will journey your audience into the cutting-edge world of technology. Prepare your viewers for a mind-blowing showcase of innovation and progress. Compatible with Powerpoint, Keynote, and Google Slides. Inspire action and invite readers to step boldly into a new era of technological innovations.


5 diapositivas
Freight and Shipping Optimization Presentation
Streamline your logistics narrative with this world map–inspired layout designed for international freight strategies. This infographic-style slide features four customizable location markers with icons and descriptive text, perfect for mapping routes, warehouses, or shipping hubs. Ideal for global supply chain teams, logistics consultants, and shipping analysts. Fully editable in PowerPoint, Keynote, and Google Slides.


5 diapositivas
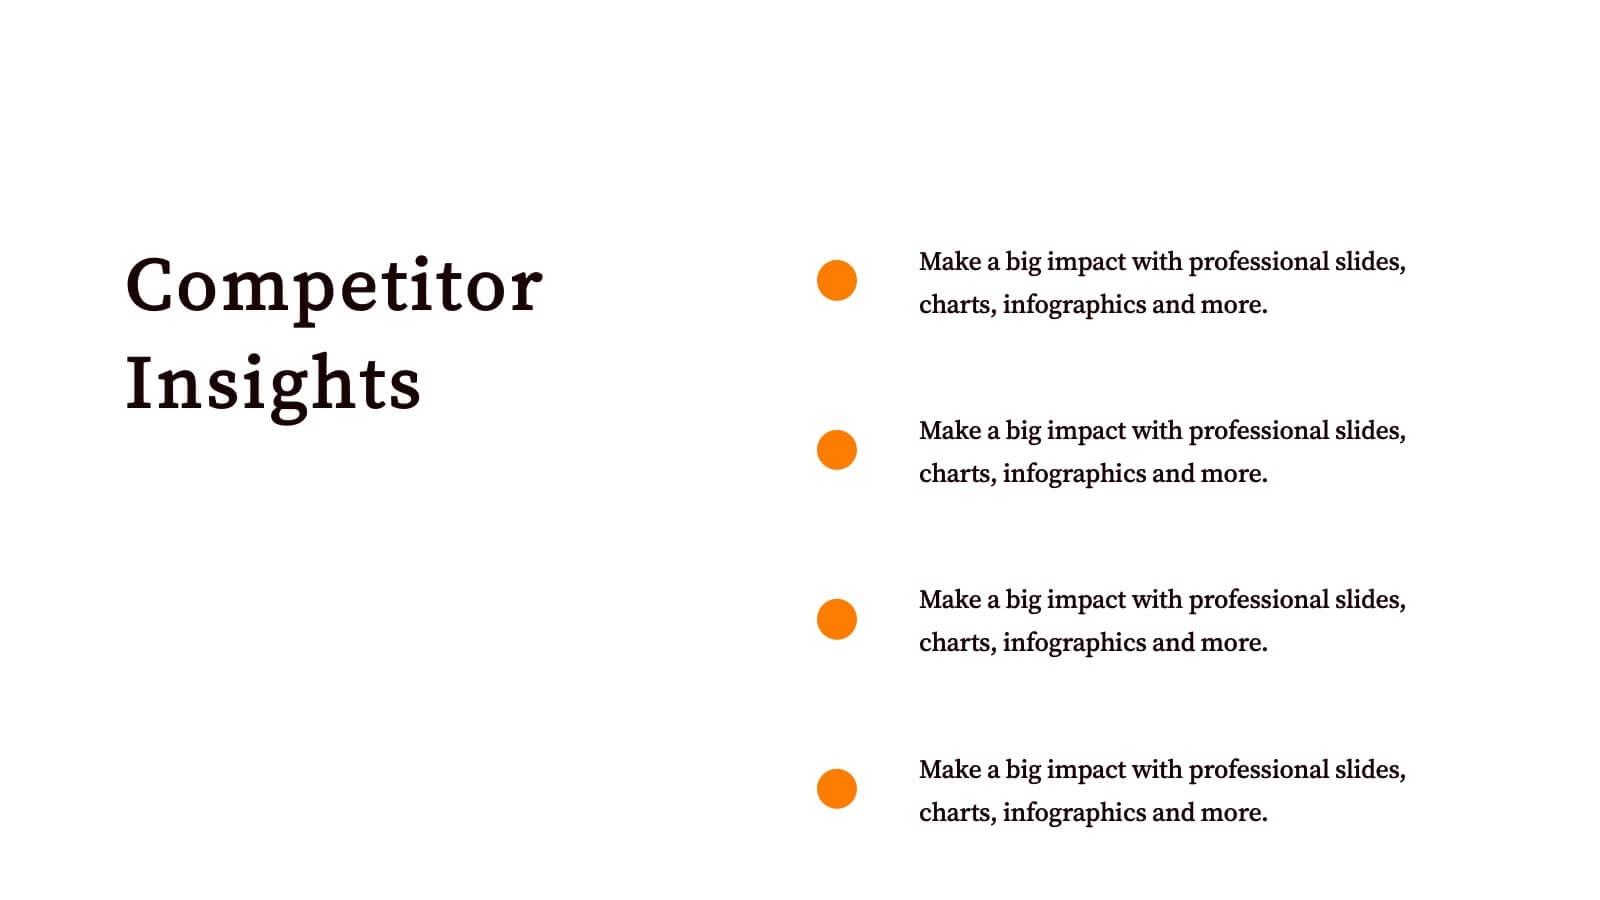
Market Competitive Analysis Report Presentation
Stand out with a clean, visual way to compare market trends and competitor performance. This presentation helps you showcase data, insights, and key differentiators in a professional format that’s easy to follow. Fully compatible with PowerPoint, Keynote, and Google Slides for seamless editing and customization.


10 diapositivas
Projects Completion Checklist Presentation
Keep every milestone visible and celebrate progress with a clean, structured layout designed to track project achievements. This presentation helps teams communicate goals, timelines, and completed tasks clearly and professionally. Fully customizable and compatible with PowerPoint, Keynote, and Google Slides for seamless editing and polished project reporting.


5 diapositivas
Transportation Industry Market Trends Presentation
Visualize industry shifts and delivery dynamics with this road-themed presentation layout. Featuring a stylized highway path and moving vehicle graphic, this template helps you break down four key market trends in a clear, visual progression. Each stop on the route includes editable icons and text blocks for streamlined storytelling. Perfect for logistics analysts, transportation planners, and consultants. Fully customizable in PowerPoint, Keynote, and Google Slides.


5 diapositivas
Workout Importance Infographics
Energize your audience with our dynamic workout importance infographics template. Bathed in the motivating shades of cream, blue, and orange, this collection is a powerhouse of fitness inspiration, perfect for personal trainers, fitness bloggers, health educators, and gym establishments. Compatible with Powerpoint, Keynote, and Google Slides. Its creative, fitness-oriented design showcases compelling graphics, icons, and image placeholders that vividly illustrate exercise routines, health stats, and motivational quotes. It's not just an infographic; it's your ally in promoting a healthy lifestyle, emphasizing the transformative power of physical activity.