


Características


¿Tienes alguna pregunta?
Recomendar


7 diapositivas
Thank You Infographic
Express your gratitude in style with this beautifully designed template, perfect for adding a touch of elegance and personalization to your messages of appreciation. Featuring a range of versatile layouts—from minimalist designs to vibrant color schemes and eye-catching typography—each slide offers a unique way to say thank you, whether it’s to clients, team members, or partners. Customize the visuals to align with your brand or personal style by integrating your own photos, logos, and text, making each expression of gratitude uniquely yours. Ideal for corporate settings, personal use, or charitable events, this template helps you create memorable, heartfelt thanks that resonate deeply with recipients, and is perfect for use in presentations, emails, or as special tokens of appreciation to leave a lasting impression.


10 diapositivas
Task and Role Allocation Matrix Presentation
Organize your team's responsibilities effectively with our Task and Role Allocation Matrix presentation template. Perfect for project managers and coordinators, this tool offers a clear, visual breakdown of who does what, using a color-coded system to assign tasks across multiple roles. It's ideal for streamlining project processes and ensuring accountability. Compatible with PowerPoint, Keynote, and Google Slides, this template is a must-have for any organized project team.


7 diapositivas
Mind Map Project Infographic
A mind map is a visual representation of information, ideas, or concepts arranged around a central topic or theme. This template is a powerful brainstorming and organizational tool that helps individuals or teams visually connect related ideas, explore new connections, and see the bigger picture. This diagram organizes information around a central theme or idea, with branches extending outwards to represent related concepts or tasks. This infographic is perfect for for capturing ideas, and presenting complex information in a structured and easily manner. This template is customizable and compatible with Powerpoint, Keynote, and Google Slides.


4 diapositivas
Case Study Insights and Outcomes Presentation
Showcase real-world takeaways with the Case Study Insights and Outcomes Presentation. This modern, folder-style infographic layout guides your audience through three key stages of a case study—process, insight, and results. Ideal for highlighting lessons learned, performance reviews, or client success journeys. Fully editable in PowerPoint, Keynote, and Google Slides.


6 diapositivas
Professional Business Portfolio Presentation
Present your work with confidence using this sleek Professional Business Portfolio presentation. Designed to showcase your project highlights, performance data, and key insights, this layout features a clean two-column structure with space for visuals, icons, and statistics. Perfect for consultants, agencies, or entrepreneurs wanting to highlight business outcomes. Fully customizable and compatible with PowerPoint, Keynote, and Google Slides.


10 diapositivas
Modern Geometric Shapes Presentation
The "Modern Geometric Shapes" presentation template uses a series of cascading, colorful shapes to organize and present data clearly and effectively. This layout is particularly suited for displaying hierarchical information or a series of processes that flow from one to the next, enhancing visual interest and readability. Each segment is distinctly colored to differentiate the sections while maintaining a cohesive design aesthetic, making it ideal for business presentations that require a blend of professionalism with modern graphic elements.


8 diapositivas
Air Travel Trends and Safety Presentation
Explore global air travel dynamics with the 'Air Travel Trends and Safety' presentation template. Designed to deliver critical insights into aviation safety standards and travel patterns, this template facilitates impactful presentations for industry stakeholders. Tailored for use in platforms like PowerPoint, Keynote, and Google Slides, it serves as an essential tool for discussing regulatory impacts, operational safety, and market trends, ensuring your data is not only presented but persuasively communicated.


5 diapositivas
RAPID Decision-Making Roles Overview Presentation
Clarify accountability and streamline decisions with the RAPID Decision-Making Roles Overview Presentation. This visual layout breaks down the five essential roles—Recommend, Agree, Perform, Input, and Decide—into a clear quadrant diagram. Ideal for project teams, leadership alignment, or decision-making workshops. Fully editable in PowerPoint, Google Slides, Keynote, and Canva.


8 diapositivas
Territorial Reach Map of United States Presentation
Showcase your national footprint with the Territorial Reach Map of United States Presentation. This slide visually highlights specific states and aligns them with key data points—perfect for illustrating market penetration, sales concentration, or operational presence. Designed for clarity and impact, it's fully customizable in Canva, PowerPoint, and Google Slides.


8 diapositivas
International Marketing Infographic
International Marketing refers to the strategies and activities undertaken by businesses to promote and sell their products or services in markets outside of their home country. This infographic template highlights key aspects of international marketing strategies and best practices. It is designed to help businesses understand the complexities and opportunities of marketing products or services in global markets. This provides an overview of international marketing concepts and strategies. Compatible with Powerpoint, Keynote, and Google Slides. This template is suitable for businesses aiming to expand their reach and succeed in the global marketplace.


21 diapositivas
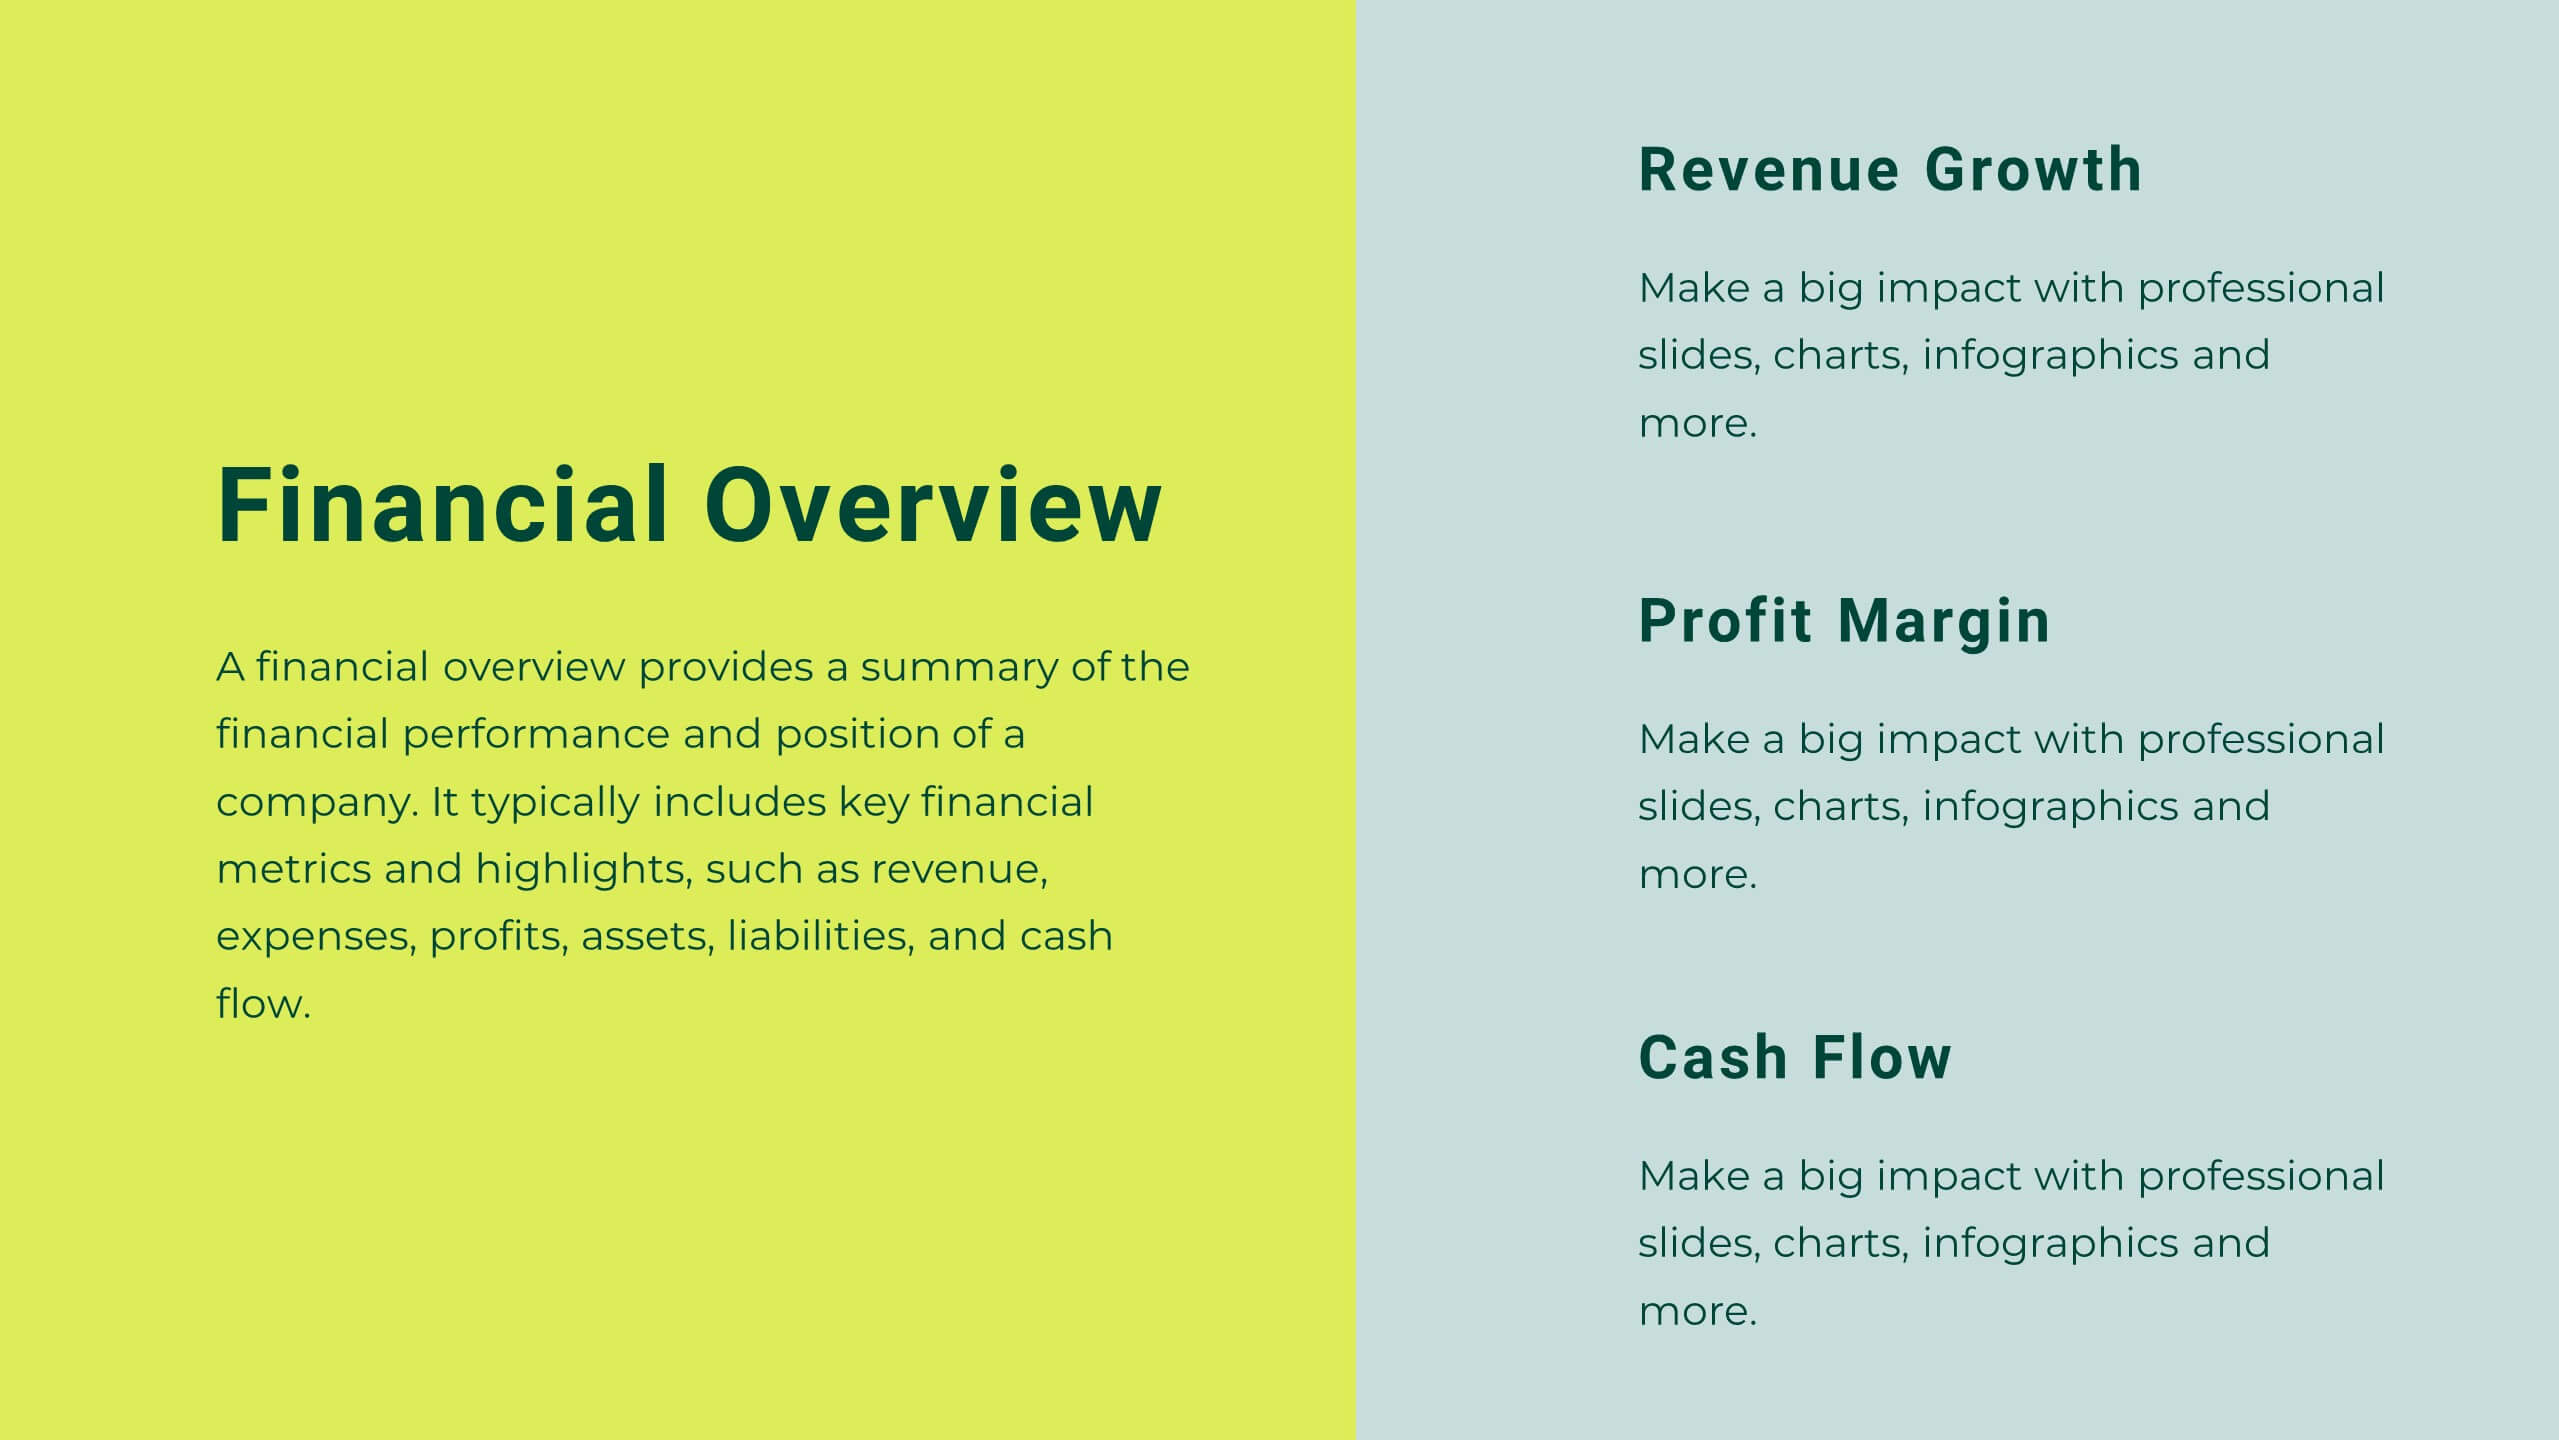
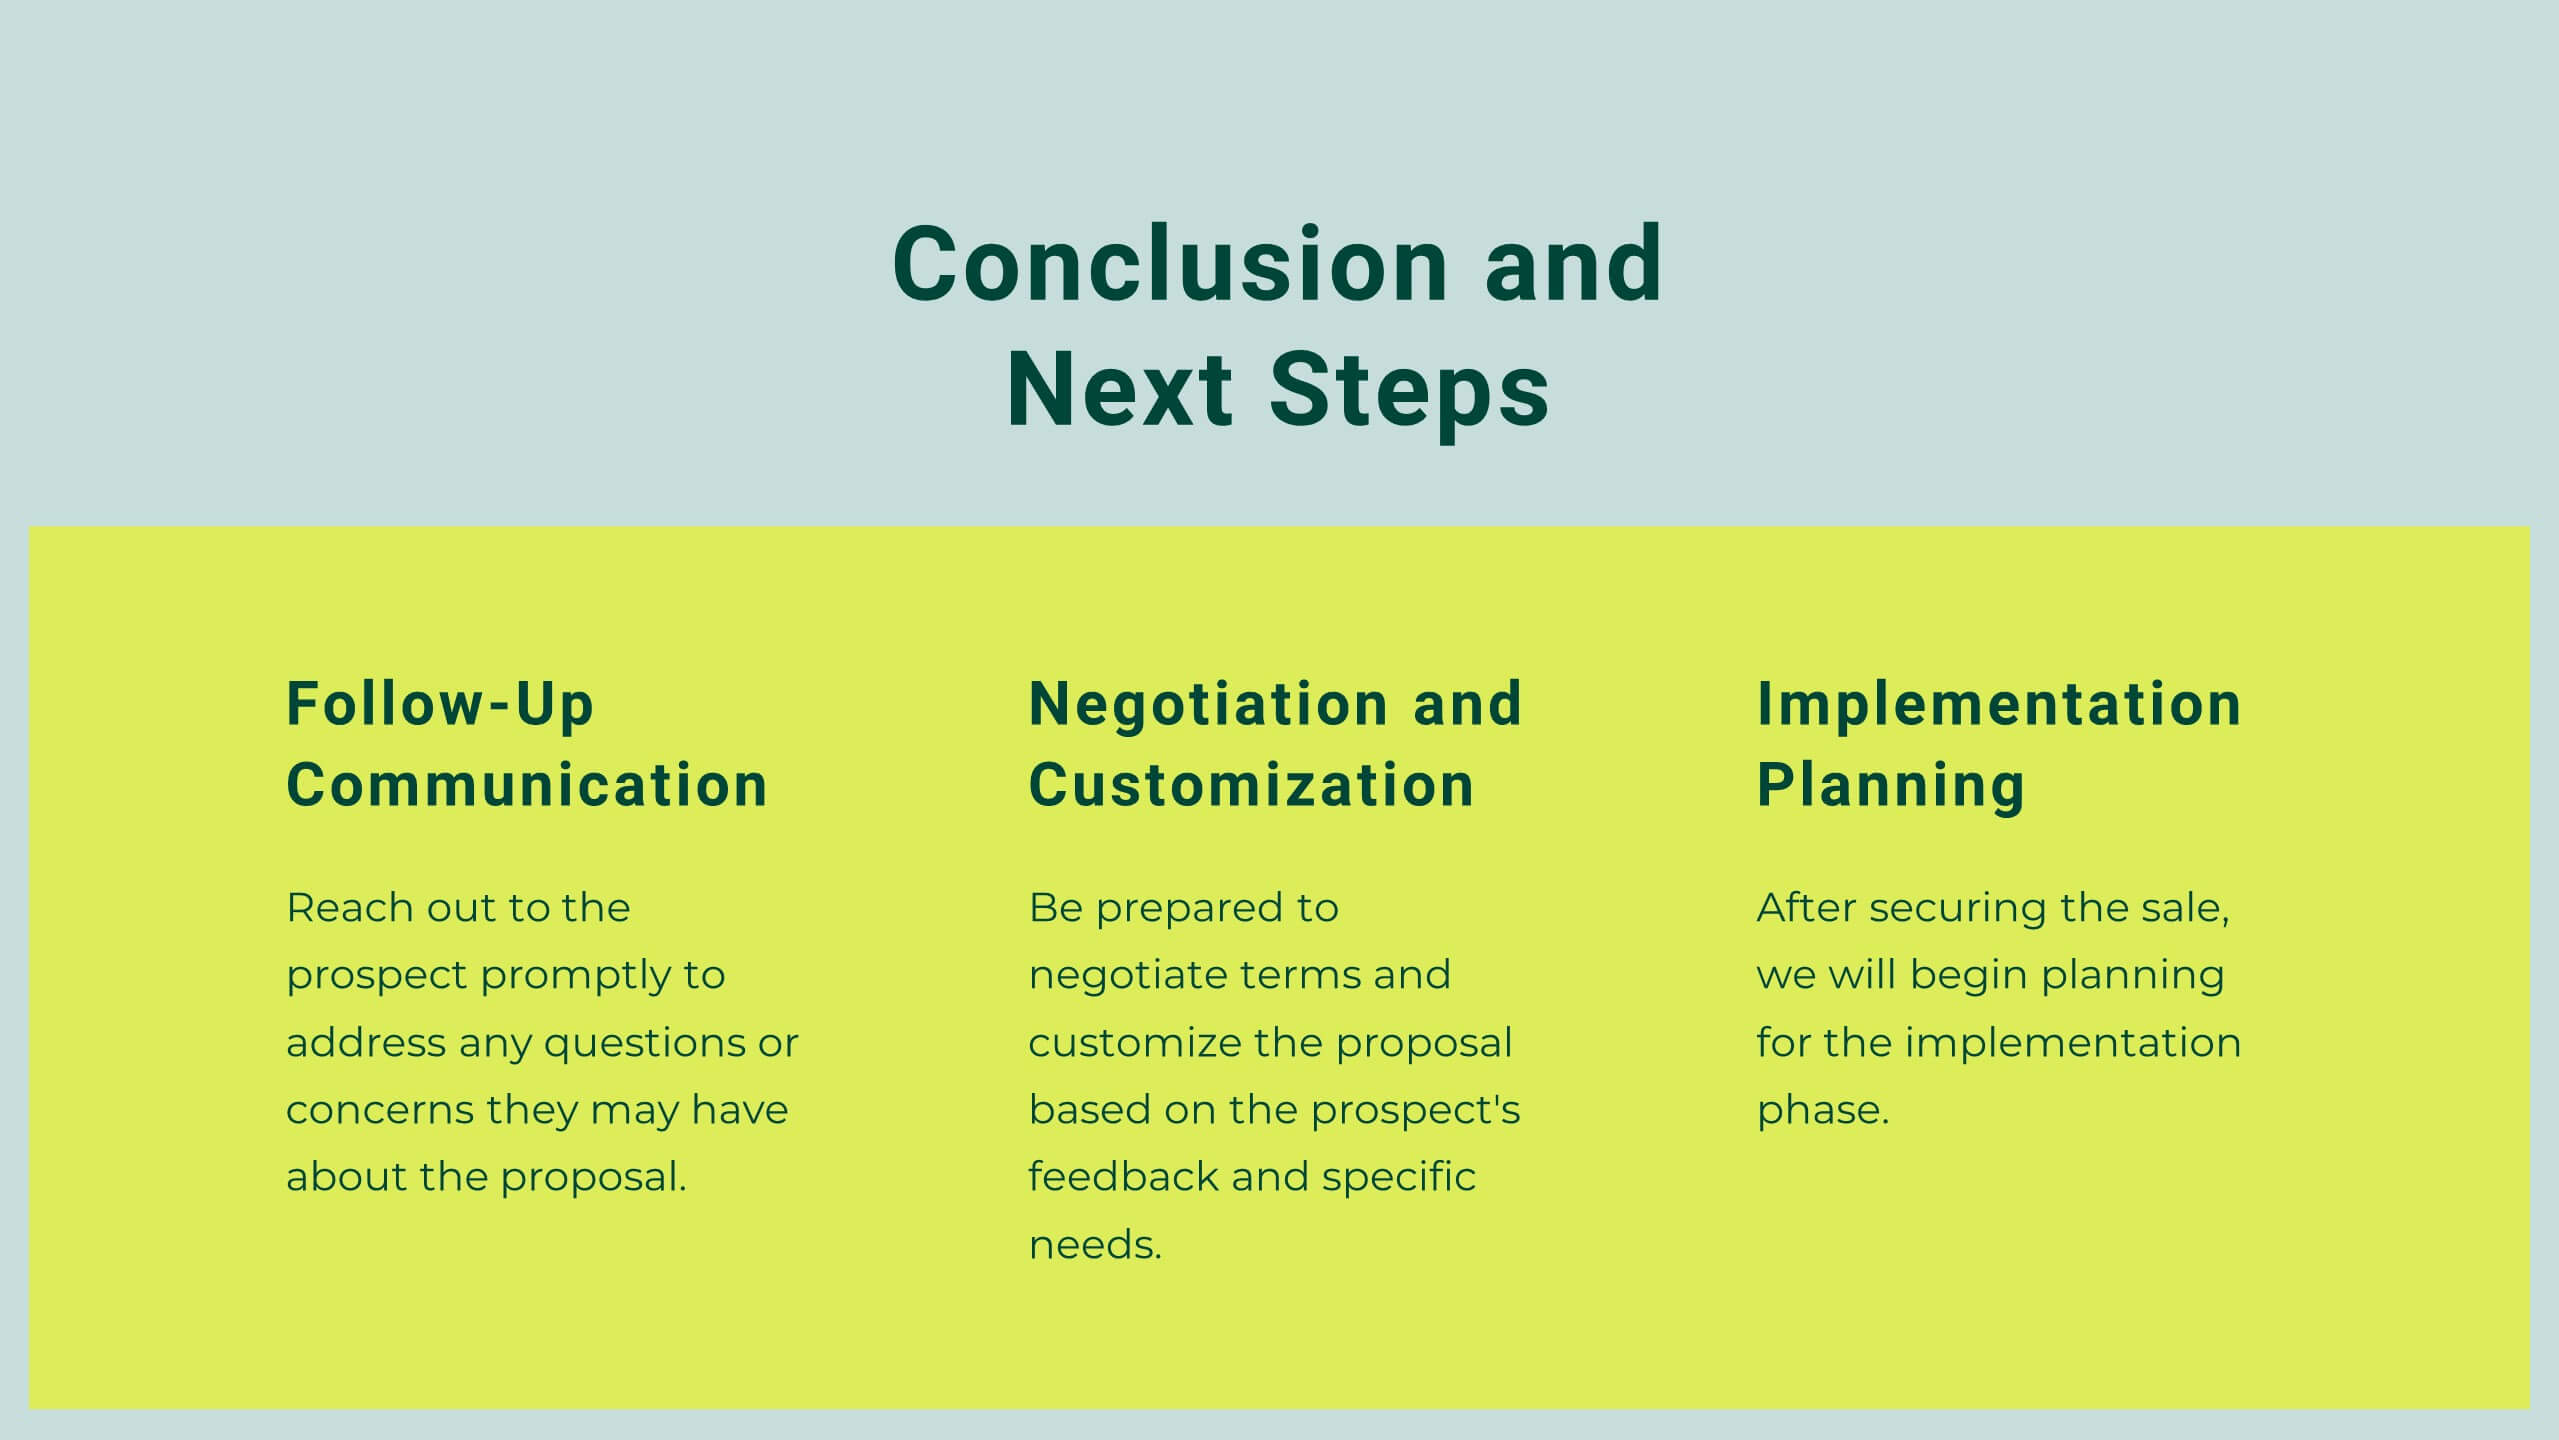
Nimbus Startup Growth Plan Presentation
Supercharge your startup's growth with this vibrant presentation template! Ideal for outlining your business plan, it includes slides for mission, market analysis, and financial overview. Capture investor attention with clear visuals and compelling content. Compatible with PowerPoint, Keynote, and Google Slides for a seamless presentation experience on any platform.


12 diapositivas
Tourism Trends and Destination Analytics Presentation
Visualize travel patterns and insights effortlessly with this Tourism Trends and Destination Analytics Presentation. Featuring a suitcase-themed layout with icon blocks, this template is ideal for travel analysts, tourism boards, and destination marketers. Use it to highlight travel behaviors, key locations, or seasonal preferences. Fully customizable in PowerPoint, Keynote, and Google Slides.


7 diapositivas
Marketing Calendar Schedule Organizer
Stay on top of every post, caption, and campaign with this simple and stylish visual planner—built to make your content calendar finally feel manageable. Designed to help marketers organize platforms, posting times, and links all in one place, it’s your go-to tool for streamlined weekly planning. Fully compatible with PowerPoint, Keynote, and Google Slides.


7 diapositivas
Food Recipes Infographic Presentation
Food is a source of energy, nutrients and other substances. These are the basic necessities for growth and development of the body. Help your audience take a closer look at the ingredients of your food with this infographic! This template will allow you to easily convey the healthy benefits of certain foods and what to avoid. It features a variety of visual styles and easy to use editing tools like text boxes, shapes, icons and other editable elements. It is completely customizable and compatible with Powerpoint, Keynote, and Google Slides, so you can change colors, fonts and more.


21 diapositivas
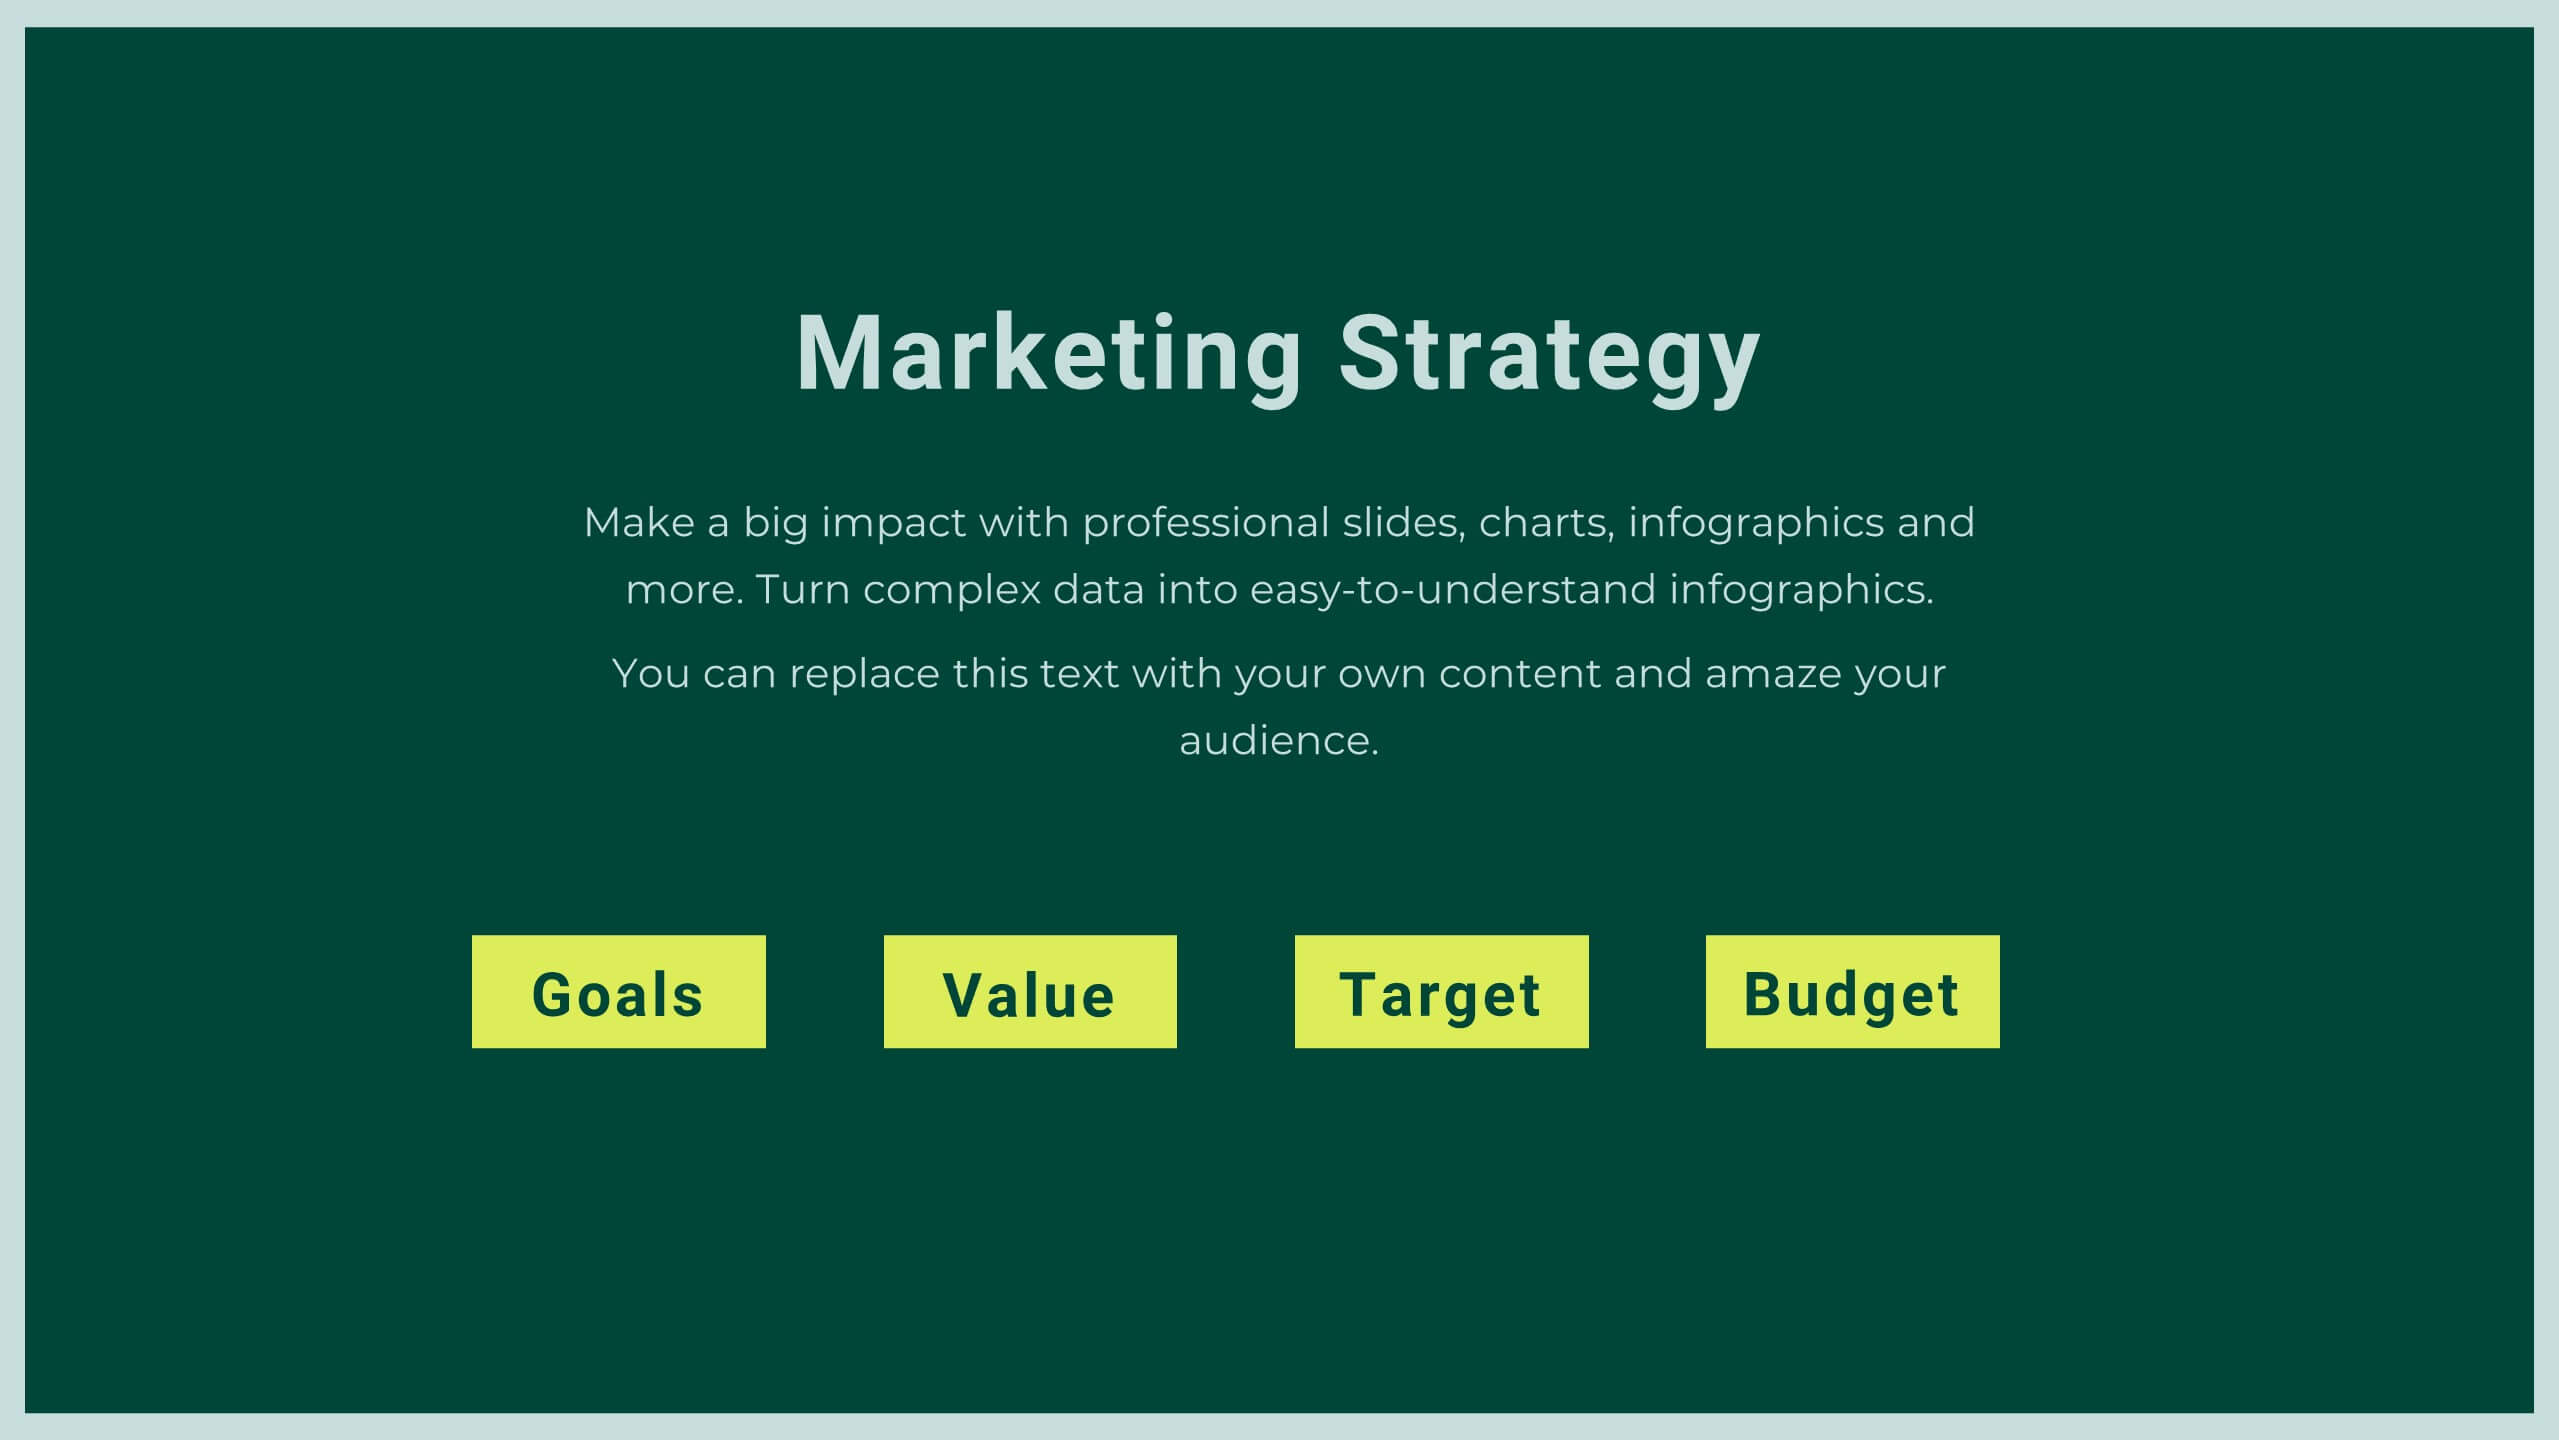
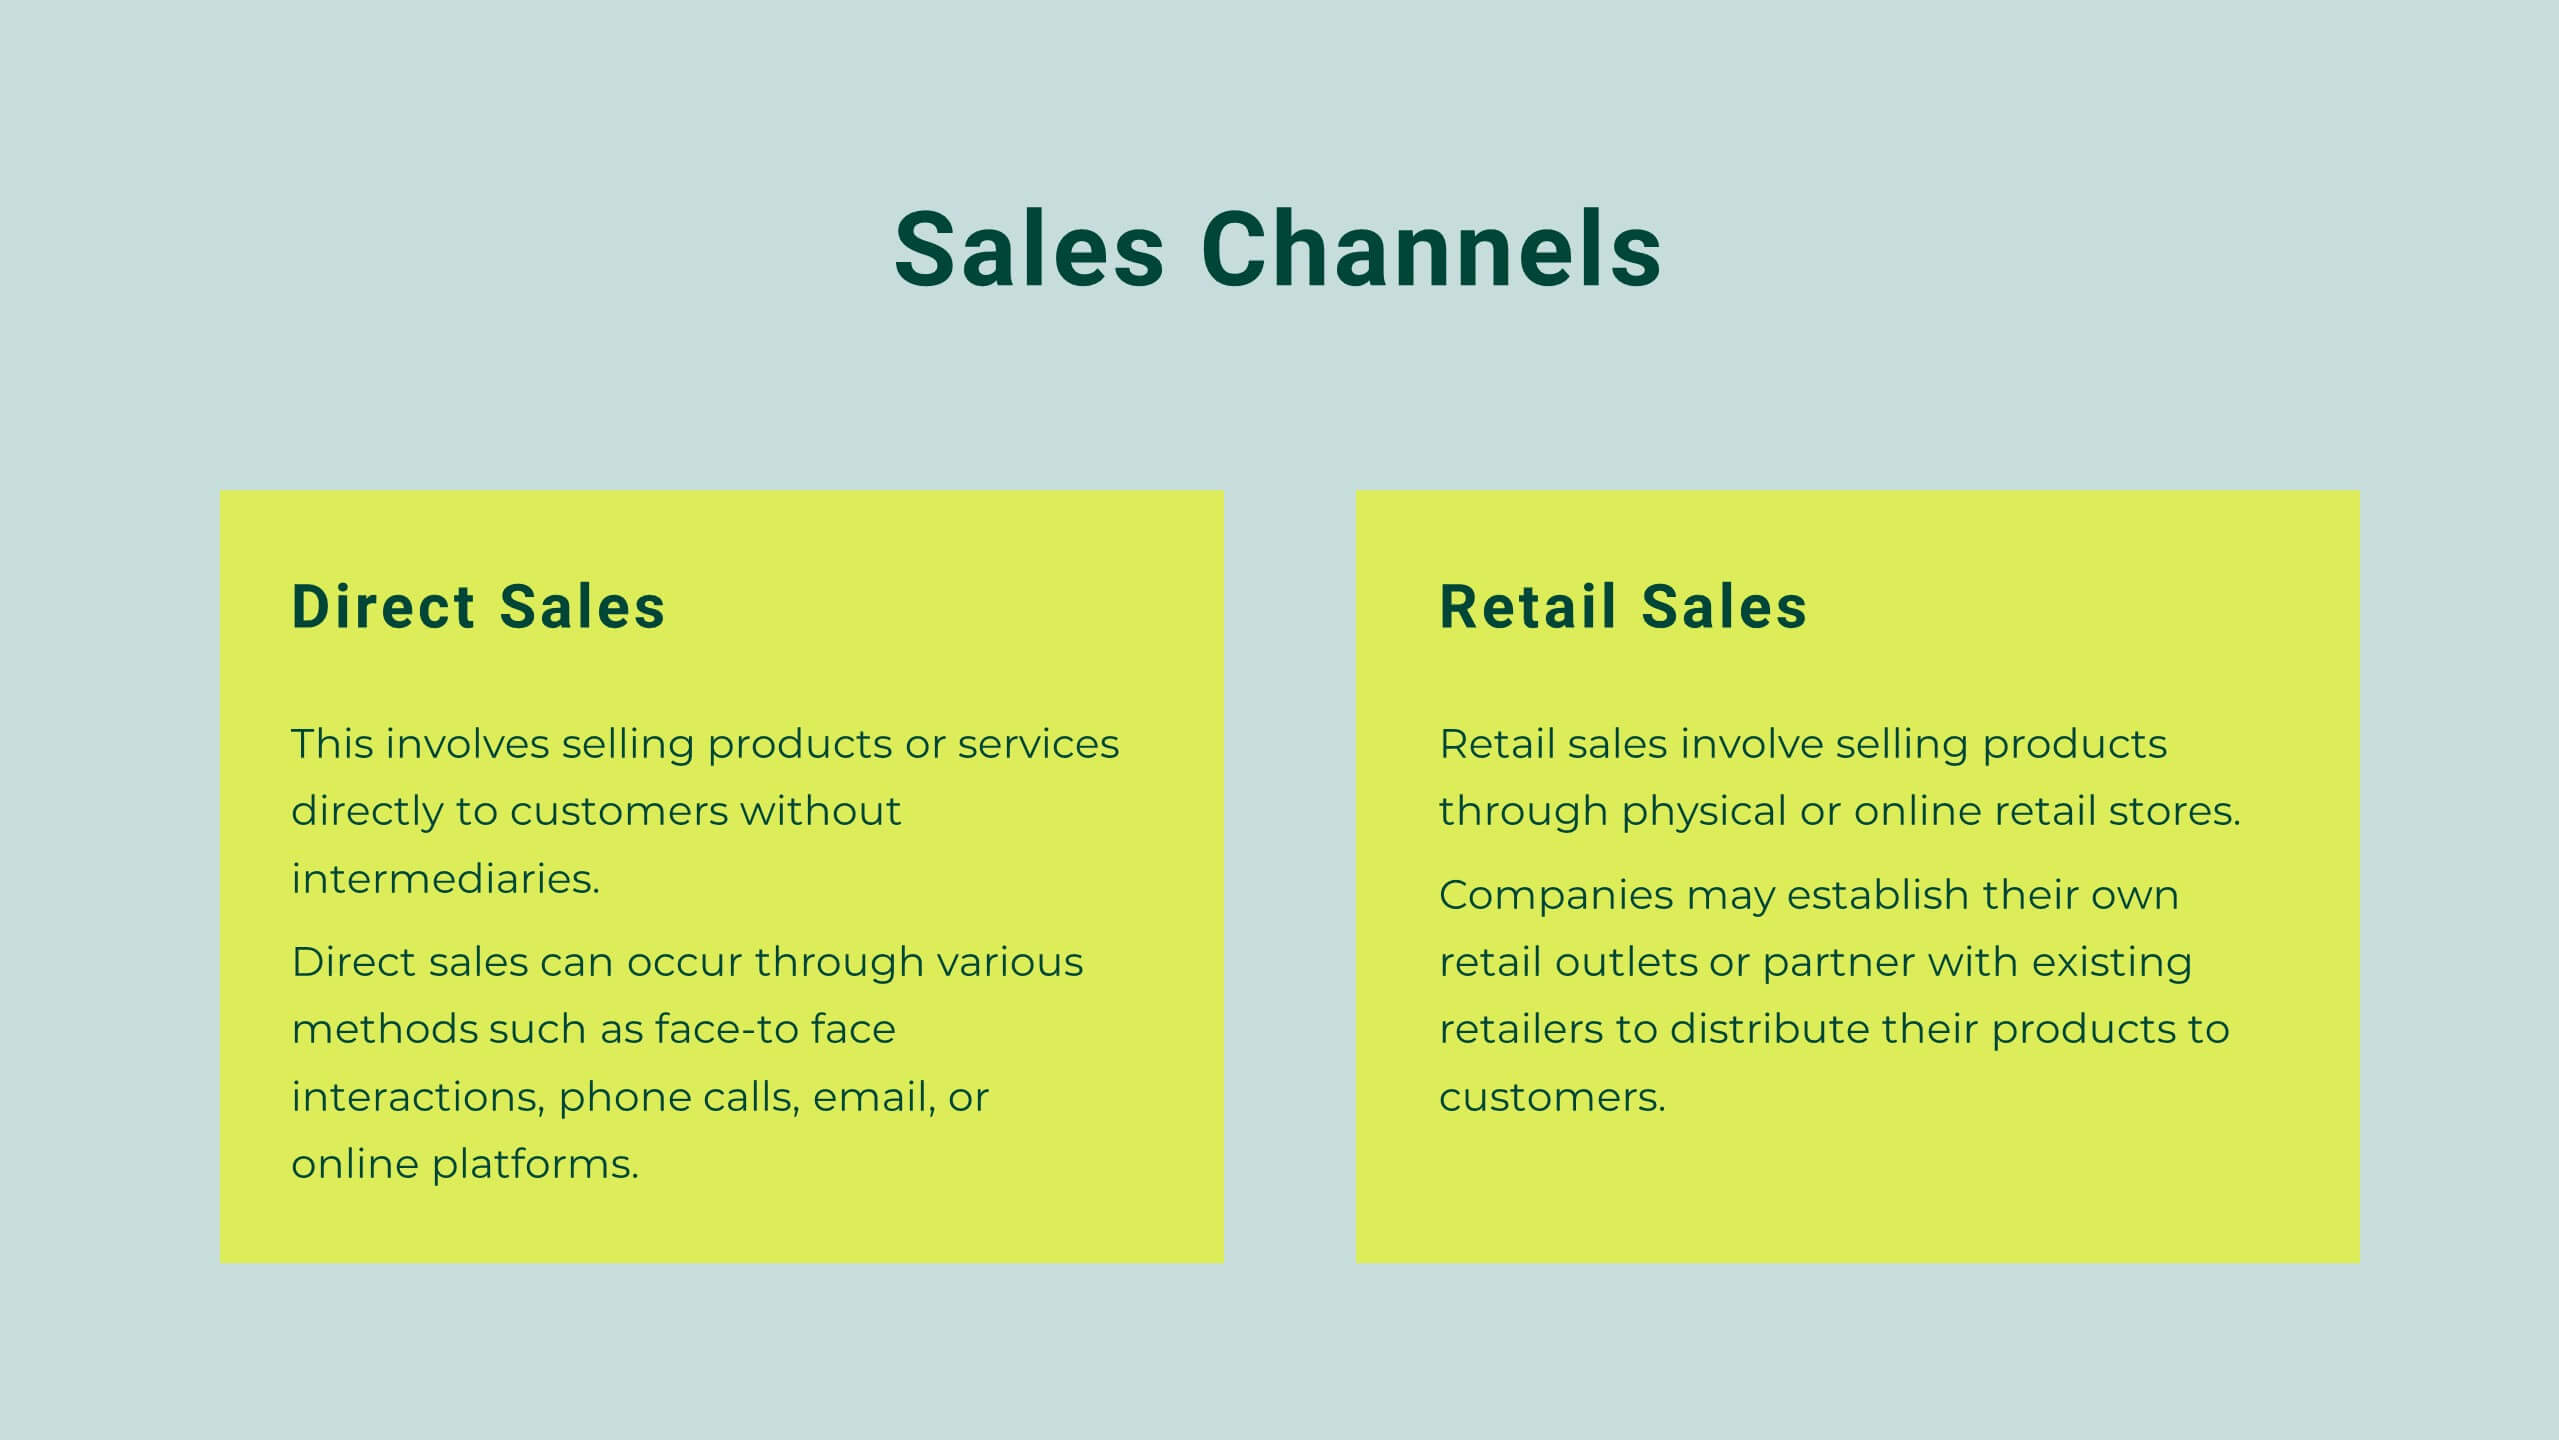
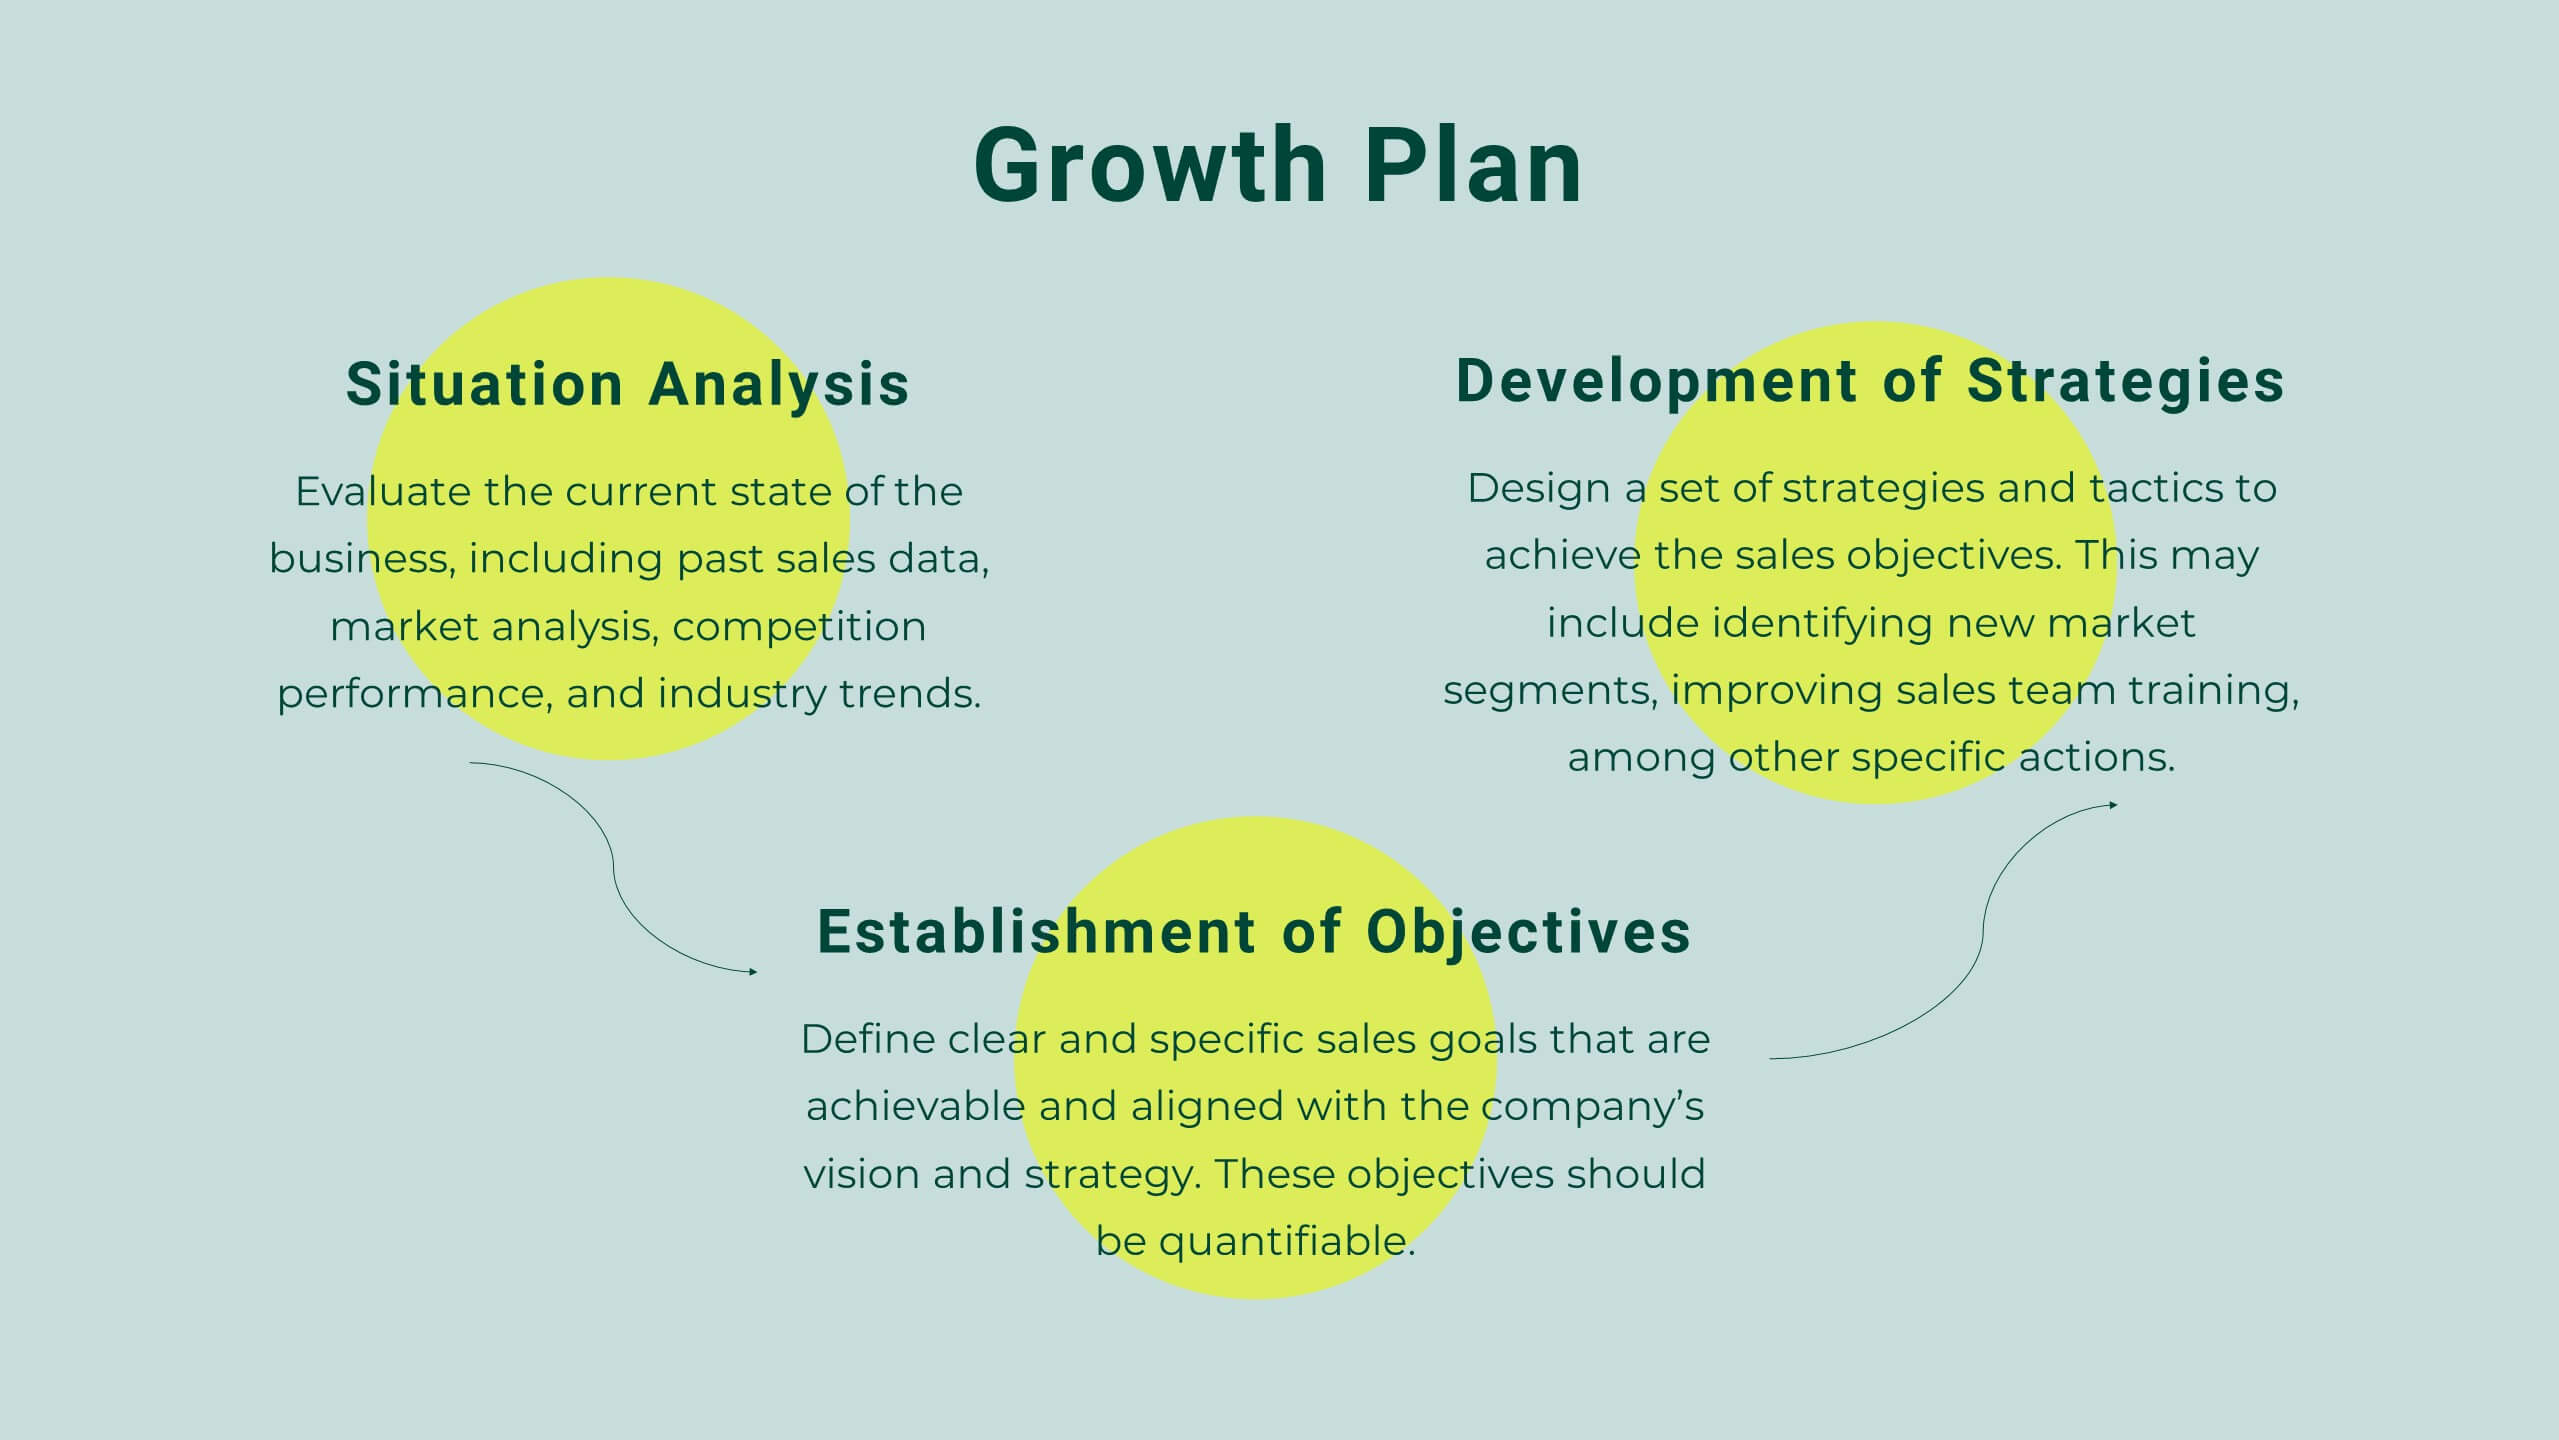
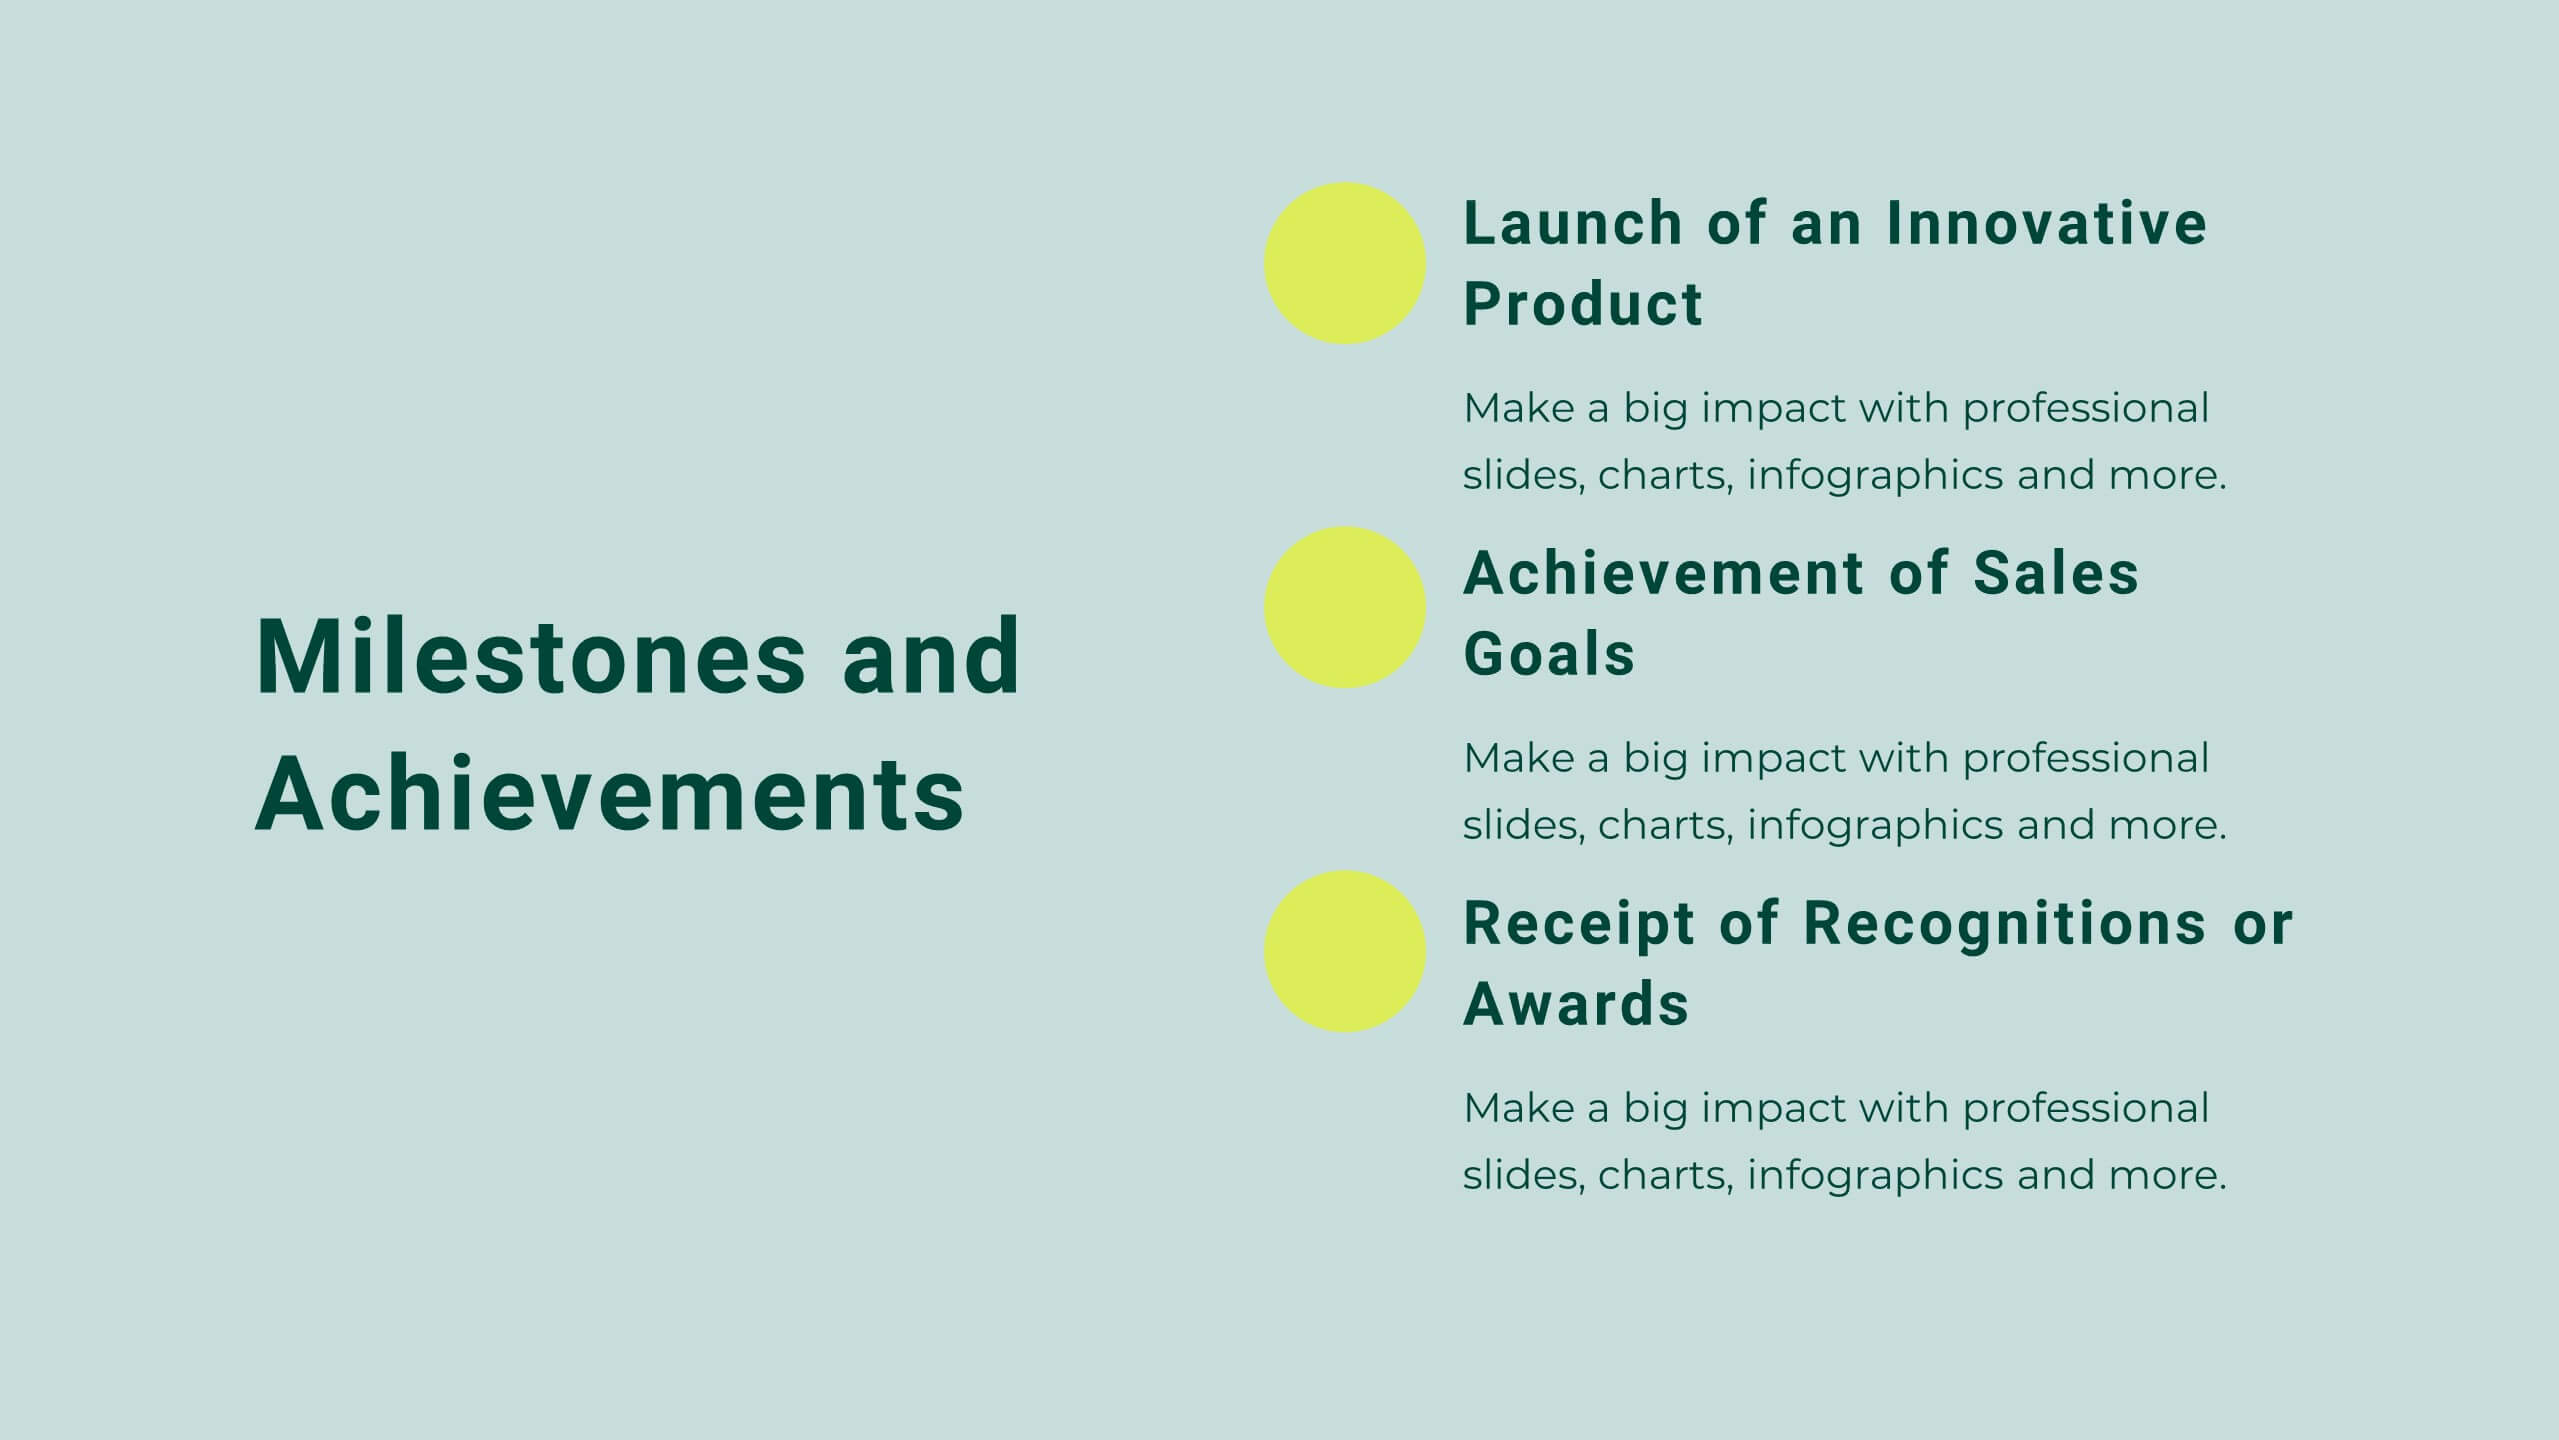
Dreamwood Sales Pitch Deck Presentation
Deliver powerful sales presentations with this vibrant and engaging sales pitch deck template! It provides all essential sections, including sales objectives, customer testimonials, pricing strategy, and performance metrics, to help you leave a lasting impact. Perfect for business teams and client pitches, it’s compatible with PowerPoint, Keynote, and Google Slides for seamless customization.


4 diapositivas
Professional Team Member Slides Presentation
Meet your team in a fresh, dynamic way with a layout that highlights personalities, roles, and key contributions at a glance. This presentation helps introduce members clearly, supporting stronger collaboration and professional communication across any project. Fully customizable and compatible with PowerPoint, Keynote, and Google Slides.


25 diapositivas
Draco Photography Portfolio Template Presentation
Showcase your photography portfolio with this dynamic template! Highlight your projects, style, client testimonials, and awards. Includes sections for pricing, services offered, and social media links. Ideal for photographers to create impactful presentations. Compatible with PowerPoint, Keynote, and Google Slides.