


Características


¿Tienes alguna pregunta?
Recomendar


7 diapositivas
Harvey Ball Assessment Infographic Presentation
A Harvey Ball Infographic is a graphic design element that utilizes the iconic Harvey Ball. This Harvey Ball template is designed as a way to increase morale and productivity in the workplace. This infographic is useful for businesses and organizations who want to present data or information in a way that is easy to understand and engaging to their audience. By incorporating the harvey ball into your presentations it adds a fun and lighthearted element to an otherwise dry or complex topic. Designed in Powerpoint, Keynote, and Google Slides, customized the text and graphs to fit your brand.


6 diapositivas
Product Development Roadmap Presentation
Visualize your innovation journey with this Product Development Roadmap template. Perfect for outlining each stage from concept to launch, it keeps teams aligned on goals and timelines. Ideal for startups, tech teams, or product managers. Fully editable in PowerPoint, Keynote, and Google Slides for flexible, streamlined use.


5 diapositivas
Business Model Canvas Overview Presentation
Streamline your business strategy with the Business Model Canvas Overview Presentation. Designed for entrepreneurs, startups, and strategists, this template visualizes key partners, activities, value propositions, customer segments, revenue streams, and more. Fully editable for PowerPoint, Keynote, and Google Slides, ensuring a structured and professional business plan presentation.


6 diapositivas
Data-Driven Decision Making with Numbers Presentation
Turn insights into action with this segmented visual template, perfect for showcasing analytics, KPIs, or data-backed strategies. The semi-pie layout organizes information into six labeled sections, making it easy to interpret at a glance. Great for business reports, research summaries, or executive dashboards. Fully editable in PowerPoint, Keynote, and Google Slides.


7 diapositivas
Medical Insurance Infographic
The Medical Insurance Infographic provides a clear and concise visualization of insurance policy features, coverage details, and benefits. Ideal for insurance companies, healthcare professionals, and policyholders, this infographic simplifies complex insurance information into digestible segments. With a clean and professional design, the infographic outlines key insurance concepts such as premium rates, deductibles, copayments, and coverage limits. It also offers a visual comparison of different plans, aiding customers in making informed decisions regarding their healthcare coverage. Customizable for different audiences, this SEO-optimized infographic can be used on websites, in marketing materials, or during consultations to enhance understanding of medical insurance options. Employ our Medical Insurance Infographic to effectively communicate the value of insurance plans and help individuals navigate their healthcare needs with confidence.


4 diapositivas
SEO Keyword Planning and Ranking Goals Presentation
Stand out in the crowded digital space with bold visuals that simplify complex strategies! This infographic presentation helps you break down SEO keyword planning and ranking goals into clear, layered steps using a funnel format that’s intuitive and professional. Perfect for SEO agencies, marketers, and digital strategists aiming to communicate data-driven insights effectively. Compatible with PowerPoint, Keynote, and Google Slides.


6 diapositivas
Employee Survey Results Infographic
"Survey results" typically refer to the collected data and findings from a survey conducted to gather information from a specific group of people, often for the purpose of research or decision-making. This infographic template is a visual representation of the data collected from an employee survey. It presents key findings, insights, and trends in a visually engaging format. This allows you to summarize the importance of employee feedback, and the positive impact of improvement efforts. This survey results infographic can be shared within the organization to communicate the survey outcomes to employees, managers, and leadership.


23 diapositivas
Sunstone Investor Pitch Presentation
Captivate investors with this professionally crafted pitch deck, showcasing sections for company overview, problem and solution, market opportunity, revenue model, competitive landscape, and growth projections. Present your team, financials, milestones, and funding requirements effectively. Ideal for securing investment and support. Fully customizable for PowerPoint, Keynote, and Google Slides.


21 diapositivas
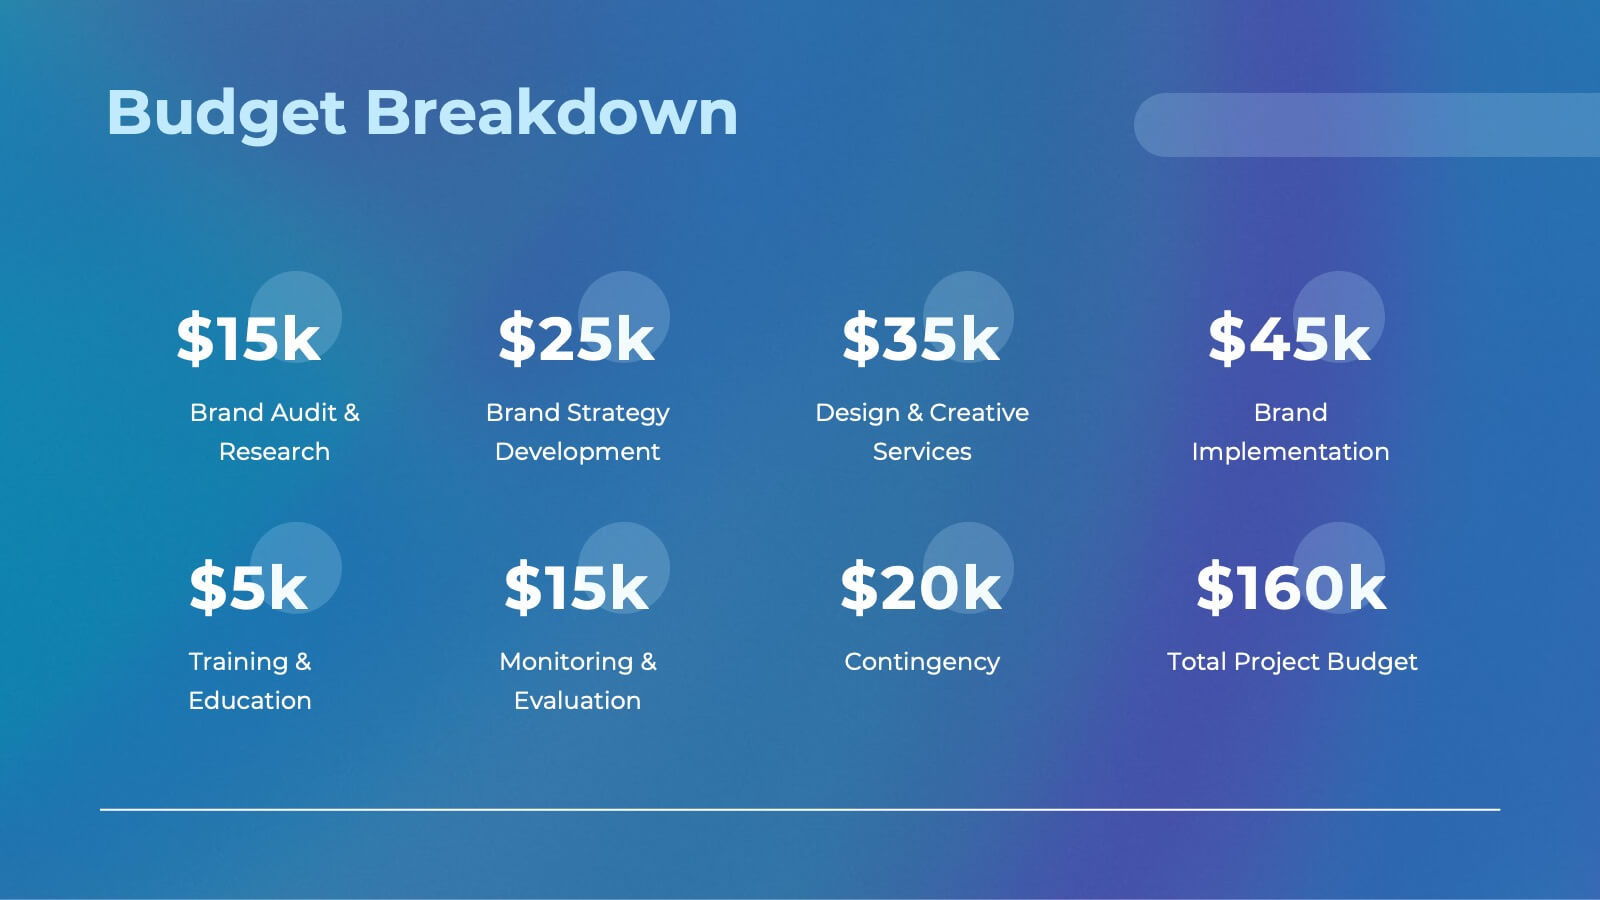
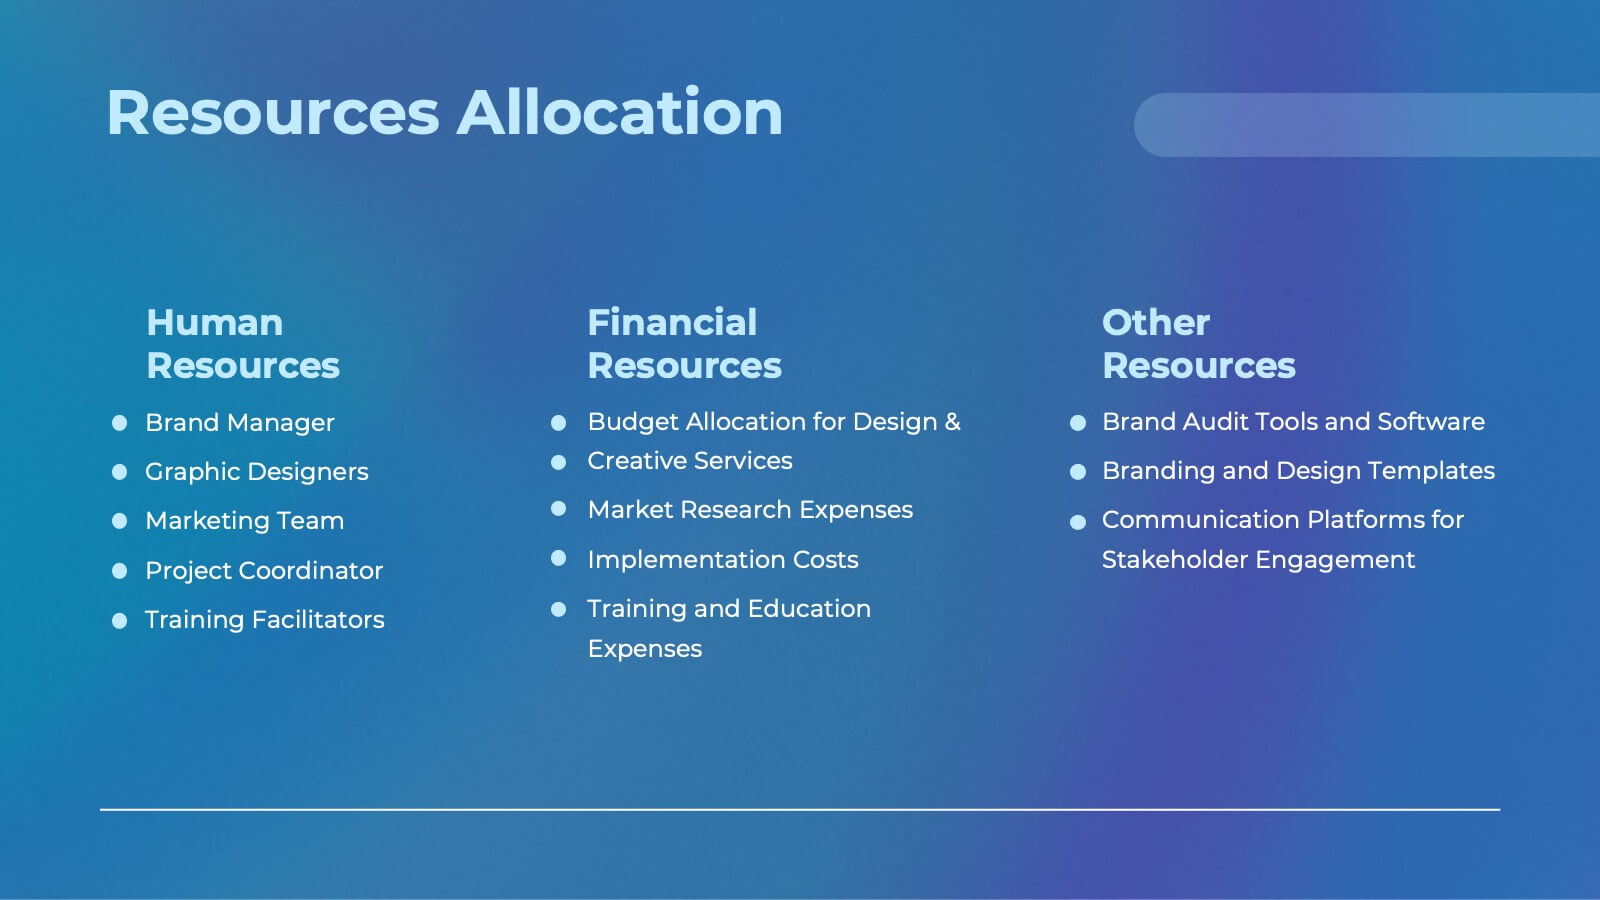
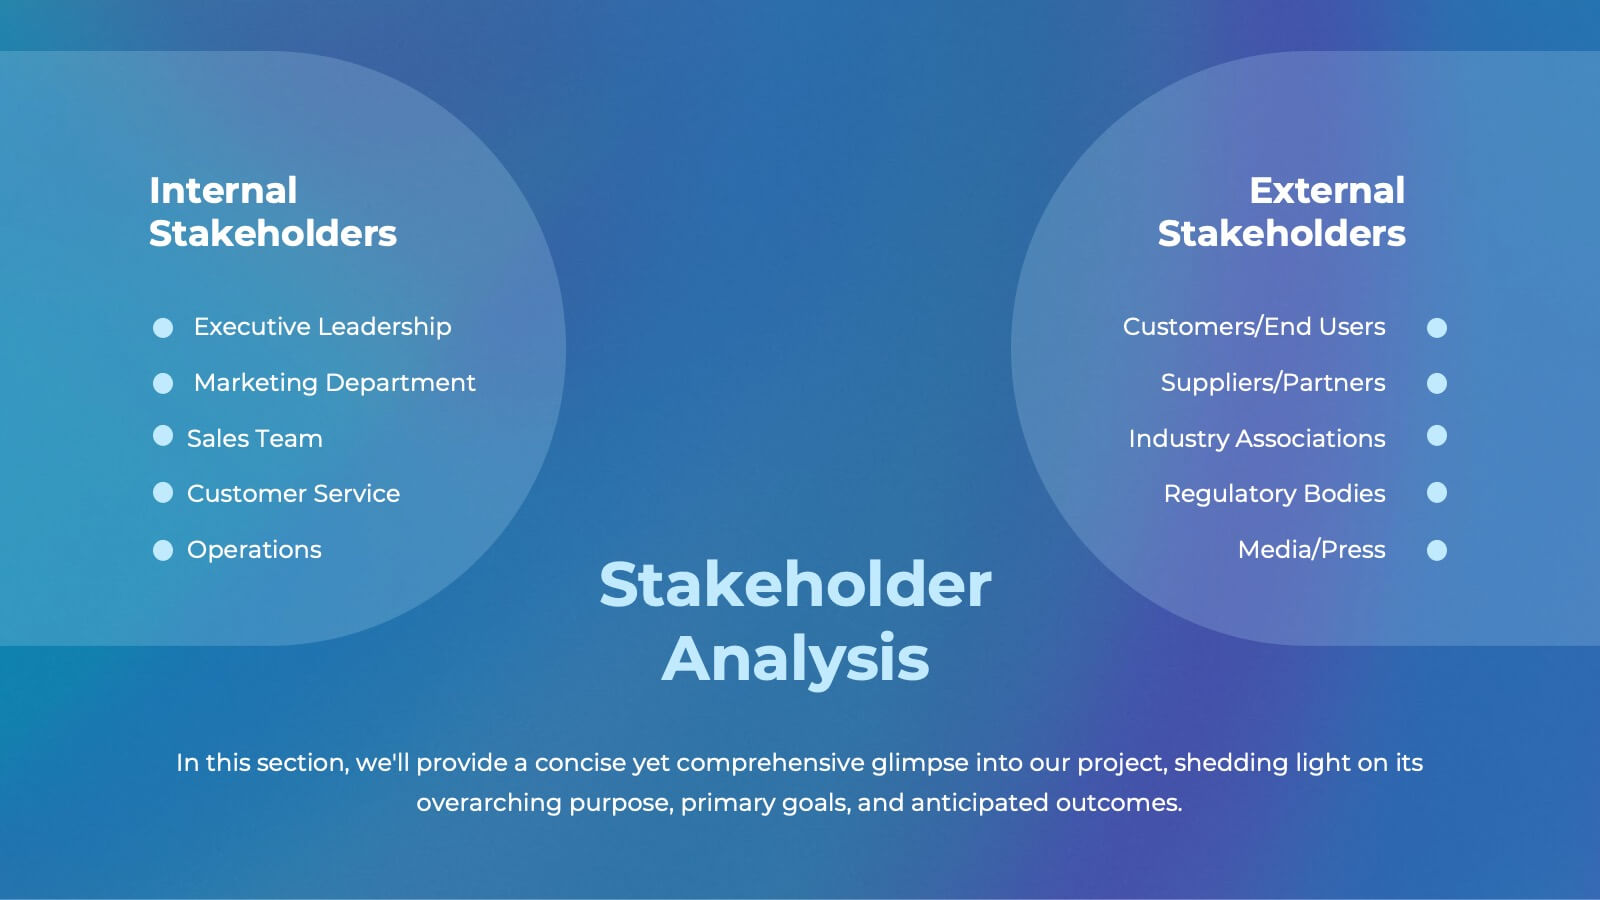
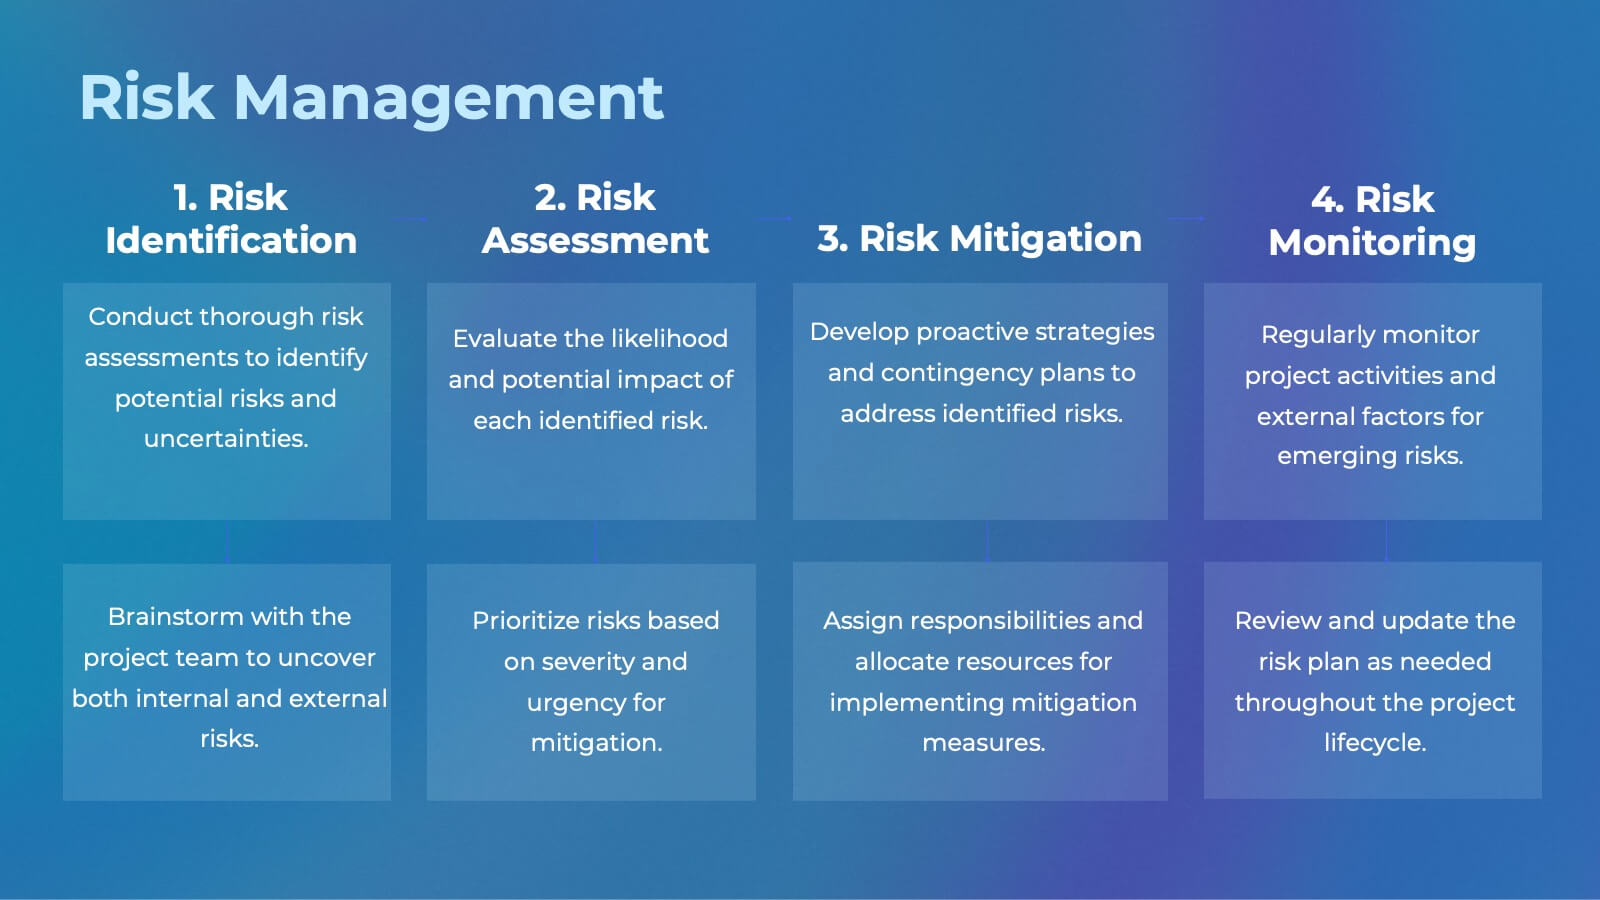
Ember Agile Project Plan Presentation
Ready to ace your next project proposal? This sleek presentation template is perfect for outlining objectives, timelines, and budgets. Designed for professionals aiming to impress stakeholders and secure approvals. Compatible with PowerPoint, Keynote, and Google Slides, it ensures a smooth and professional presentation every time. Ideal for project managers and business leaders.


4 diapositivas
Sustainable Farming Practices Presentation
Explore the essentials of sustainable farming with our visually engaging presentation template. Perfect for educational and advocacy purposes, it outlines key practices that promote environmental sustainability in agriculture. This template features easy-to-understand graphics and placeholders for comprehensive discussions on eco-friendly farming techniques.


7 diapositivas
Supply Chain Process Mapping Presentation
Streamline your logistics and operations presentations with the Supply Chain Process Mapping Presentation. Featuring a linked-chain visual, this editable template is ideal for outlining each step in your supply flow—from sourcing to delivery. Highlight dependencies, bottlenecks, or key stages with customizable color coding. Fully compatible with PowerPoint, Keynote, and Google Slides.


6 diapositivas
Meeting Planner Infographics
Efficiently plan and organize meetings with our Meeting Planner infographic template. This template is fully compatible with popular presentation software like PowerPoint, Keynote, and Google Slides, allowing you to easily customize it to illustrate and communicate the key steps and strategies for effective meeting planning. The Meeting Planner infographic template offers a visually engaging platform to outline the meeting planning process, including scheduling, agenda creation, participant coordination, and follow-up actions. Whether you're a project manager, event planner, or business professional, this template provides a user-friendly canvas to create informative presentations and educational materials on meeting planning best practices. Optimize your meeting planning skills and efficiency with this SEO-optimized Meeting Planner infographic template, thoughtfully designed for clarity and ease of use. Customize it to showcase tips for successful meetings, tools for scheduling, and strategies for engaging participants, ensuring that your audience becomes more proficient in planning and executing productive meetings. Start crafting your personalized infographic today to become a more effective Meeting Planner.


5 diapositivas
Healthcare Lifestyle Infographic
Maintaining a healthy lifestyle can prevent or manage many health problems and improve one's quality of life. These vertical infographics are an effective way to convey information about health and wellness to a wide audience. This infographic can be used to showcase statistics, health tips, and other information related to healthy living. It is a visually stunning and informative way to present important health and wellness information. This template includes special sections for showcasing key statistics and facts related to health and wellness, as well as tips for maintaining a healthy lifestyle.


10 diapositivas
SEO and Social Media Marketing Presentation
Shine a spotlight on your brand’s digital growth with this bold and professional layout designed to showcase analytics, engagement, and SEO strategies. Ideal for marketers, strategists, and agencies, it transforms data into visuals that persuade and inform. Fully compatible with PowerPoint, Keynote, and Google Slides for easy editing.


5 diapositivas
Behavioral Psychology Insights Presentation
Dive deep into the human mind with our 'Behavioral Psychology Insights' presentation template. Perfect for educators and professionals, this template offers a structured way to present complex psychological concepts visually. Ideal for delivering engaging presentations on human behavior, it is compatible with PowerPoint, Keynote, and Google Slides.


7 diapositivas
Artificial Intelligence Presentation Template
An Artificial Intelligence infographic is a visual representation of information related to AI. This high-definition infographic is completely customizable and will allow you to see advances in AI and other networks. Artificial Intelligence, is evolving rapidly. It's important that we understand what's going on so that we can ensure the future of this technology is beneficial to society. In this informative infographic, you will be able to learn and inform about everything from the difference between artificial intelligence and the differences between expert systems by adding you own data.


20 diapositivas
Solstice Research Proposal Presentation
This sleek research proposal template is crafted to impress! Highlighting sections like research methodology, literature review, key findings, and recommendations, it’s designed for in-depth presentations with a modern touch. Perfect for academic, business, or technical reports, this template is fully compatible with PowerPoint, Keynote, and Google Slides. Ideal for delivering insights with style!