


Características


¿Tienes alguna pregunta?
Recomendar


4 diapositivas
IT Security Best Practices Presentation
Strengthen your digital defense with this IT Security Best Practices template. Designed for IT professionals, security teams, and business leaders, this slide visually presents key security measures, compliance protocols, and risk management strategies. Featuring a modern security framework with a step-by-step progression, it effectively illustrates data protection, encryption, and system resilience. Fully editable and compatible with PowerPoint, Keynote, and Google Slides for seamless customization.


7 diapositivas
Stock Market Sectors Infographic
Dive deep into the intricacies of stock market sectors with our comprehensive infographic. Utilizing a palette of white, green, and red, this visual tool breaks down the vast expanse of the stock market into distinct sectors, making it easier to comprehend and analyze. Ideal for investors, stock market enthusiasts, financial educators, and students alike, this infographic provides a clear snapshot of the financial landscape. With its effortless integration into PowerPoint, Keynote, and Google Slides, sharing and presenting this crucial market information becomes seamless and engaging.


7 diapositivas
Agile Methodology Process Infographic
Introducing our agile methodology infographic template, designed to help you visualize and communicate the principles and processes of Agile project management. Agile is about flexibility, collaboration, and achieving efficient results. This template makes it easy to convey these concepts in a clear and engaging manner. This infographic is fully customizable and compatible with Powerpoint, Keynote, and Google Slides. This is clearly structured and sectioned to represent key aspects of Agile, from sprints to retrospectives. Utilize pie charts, timelines, and process flows to demonstrate Agile workflows and iterations.


8 diapositivas
Leadership and Management Presentation
The "Leadership and Management" presentation template uses a mountain metaphor to visually depict the challenges and achievements in leadership and management roles. Each slide features a series of peaks, symbolizing different stages or goals within a project or initiative. The climbers on various parts of the mountain can represent team members or leaders at different phases of their tasks. This template is versatile, suitable for presentations aimed at discussing strategies, milestones, or team dynamics in corporate settings. It offers a clear and engaging way to present complex information through a straightforward visual narrative.


8 diapositivas
Value Creation Strategy
Present your strategic pillars with clarity using this linear, milestone-style layout. Ideal for business consultants, growth strategists, and product teams aiming to showcase value drivers, innovation stages, or competitive differentiators. Fully editable in PowerPoint, Keynote, and Google Slides—customize icons, colors, and text for a branded, professional finish.


4 diapositivas
Strategic Gap Planning Template Presentation
Visually map the journey from current state to strategic goals with this puzzle-themed gap analysis template. Ideal for identifying key disconnects, setting priorities, and aligning teams. Fully editable and designed for clarity, this presentation works in PowerPoint, Keynote, and Google Slides—perfect for planning sessions, roadmaps, and executive briefings.


23 diapositivas
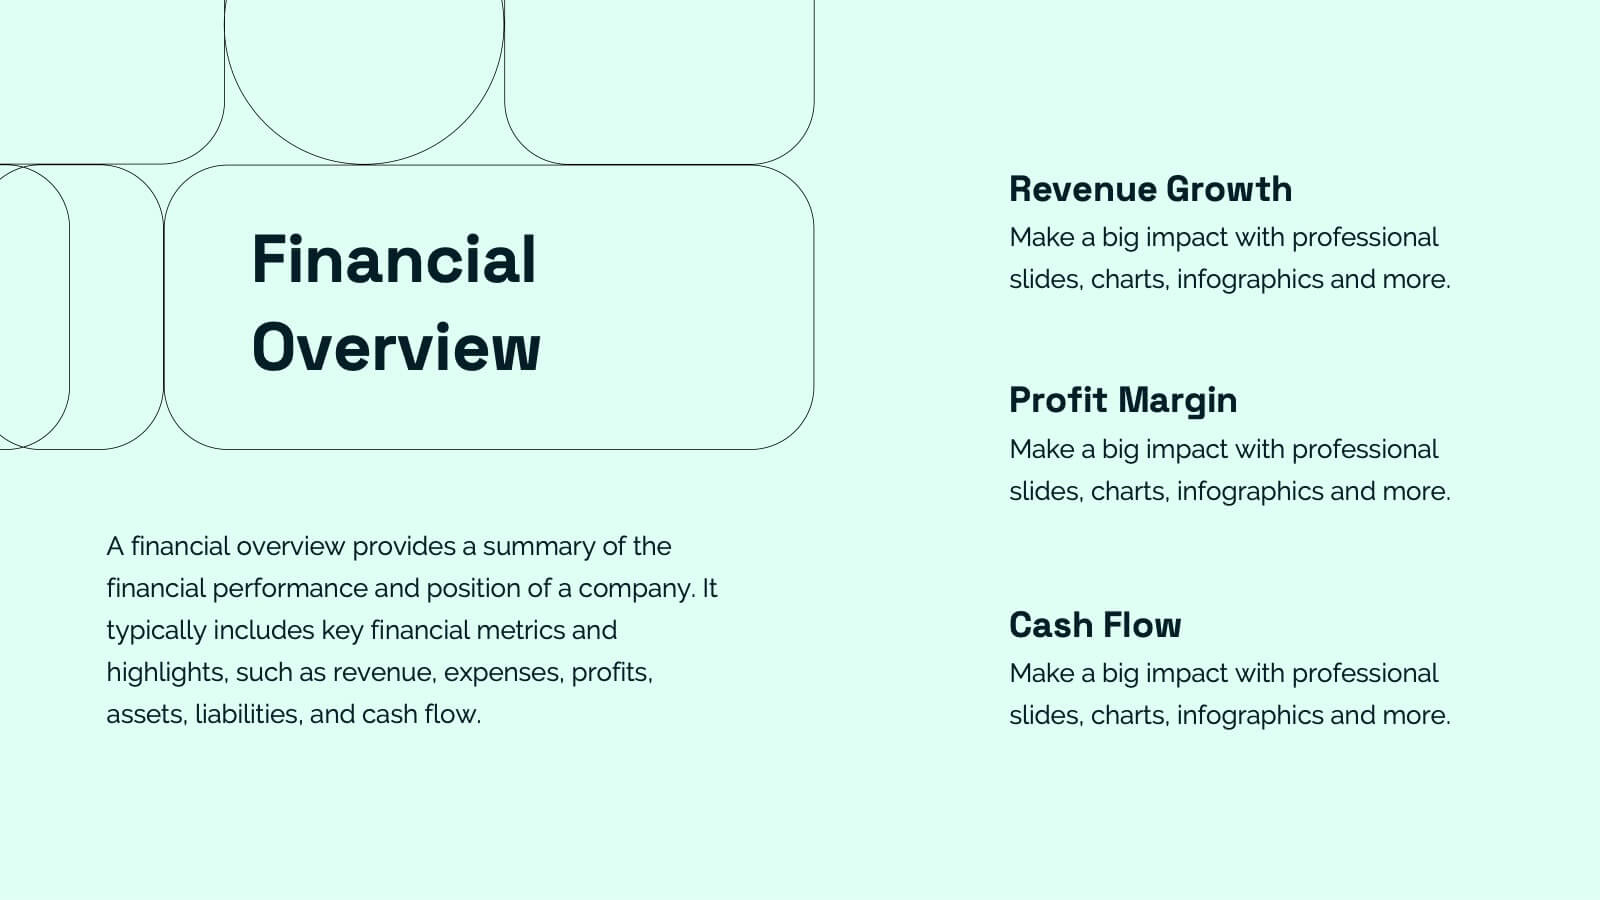
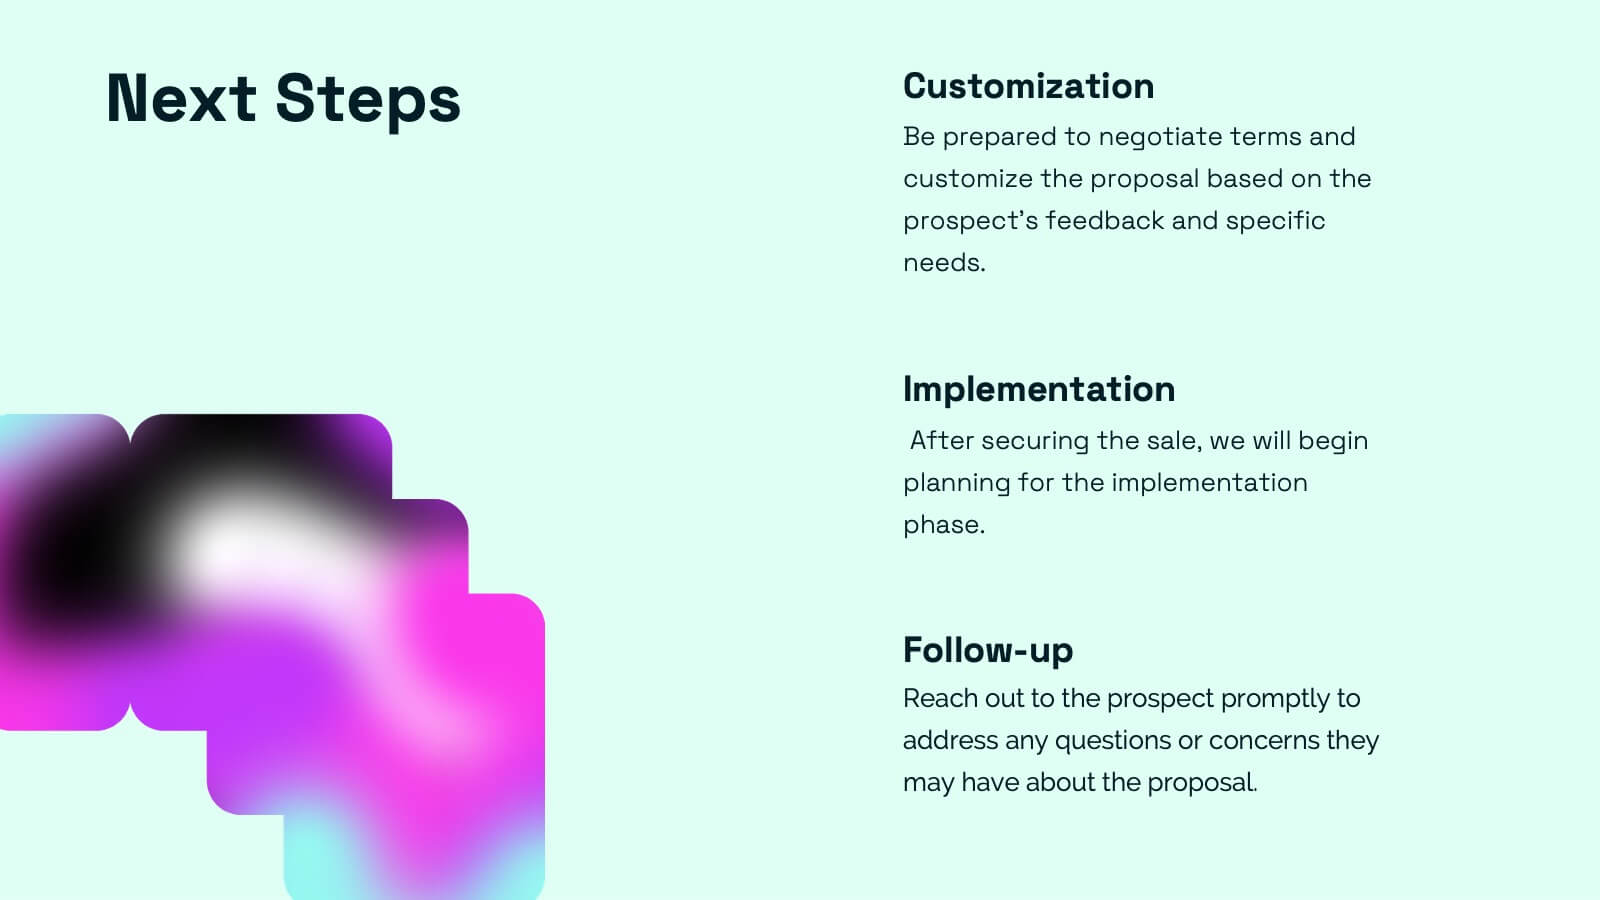
Nymph Startup Pitch Deck Presentation
This startup pitch deck template covers all the essentials for presenting a business. It includes slides for mission and vision, business model, market analysis, value proposition, and financial overview. Easily customizable for any startup industry, this modern design makes presenting your ideas a breeze. Compatible with PowerPoint, Keynote, and Google Slides.


6 diapositivas
Travel Insurance Infographics
Our "Travel Insurance" infographic template, compatible with PowerPoint, Keynote, and Google Slides, is crafted for insurance companies, travel agencies, and financial advisors. This template is an excellent tool for explaining the benefits and details of travel insurance to clients and customers. The template comprehensively covers vital elements such as coverage options, emergency assistance services, and claim procedures. Its clear and organized layout makes it easy to convey complex insurance information in a manner that is both accessible and engaging. This is particularly useful for presentations aimed at educating travelers about the importance and benefits of travel insurance. Designed with a bright and inviting travel-themed color scheme, the template incorporates elements that reflect global travel and security. This not only makes the presentation visually appealing but also resonates with the theme of travel and protection. Whether used in client consultations, marketing materials, or informational workshops, this template ensures that the key aspects of travel insurance are presented clearly and attractively.


7 diapositivas
Decision Points Infographic
Decision points are specific moments or junctures within a process, project, or any situation where a decision needs to be made. This infographic template is designed to illuminate the path of choices, empowering you to make informed decisions and steer towards success. Compatible with Powerpoint, Keynote, and Google Slides. This infographic symbolizes the diverse options one encounters in their journey, and the importance of choosing wisely. The graphs and charts depicting the dilemmas encountered, emphasize the analytical process of weighing pros and cons to arrive at the best decision.


21 diapositivas
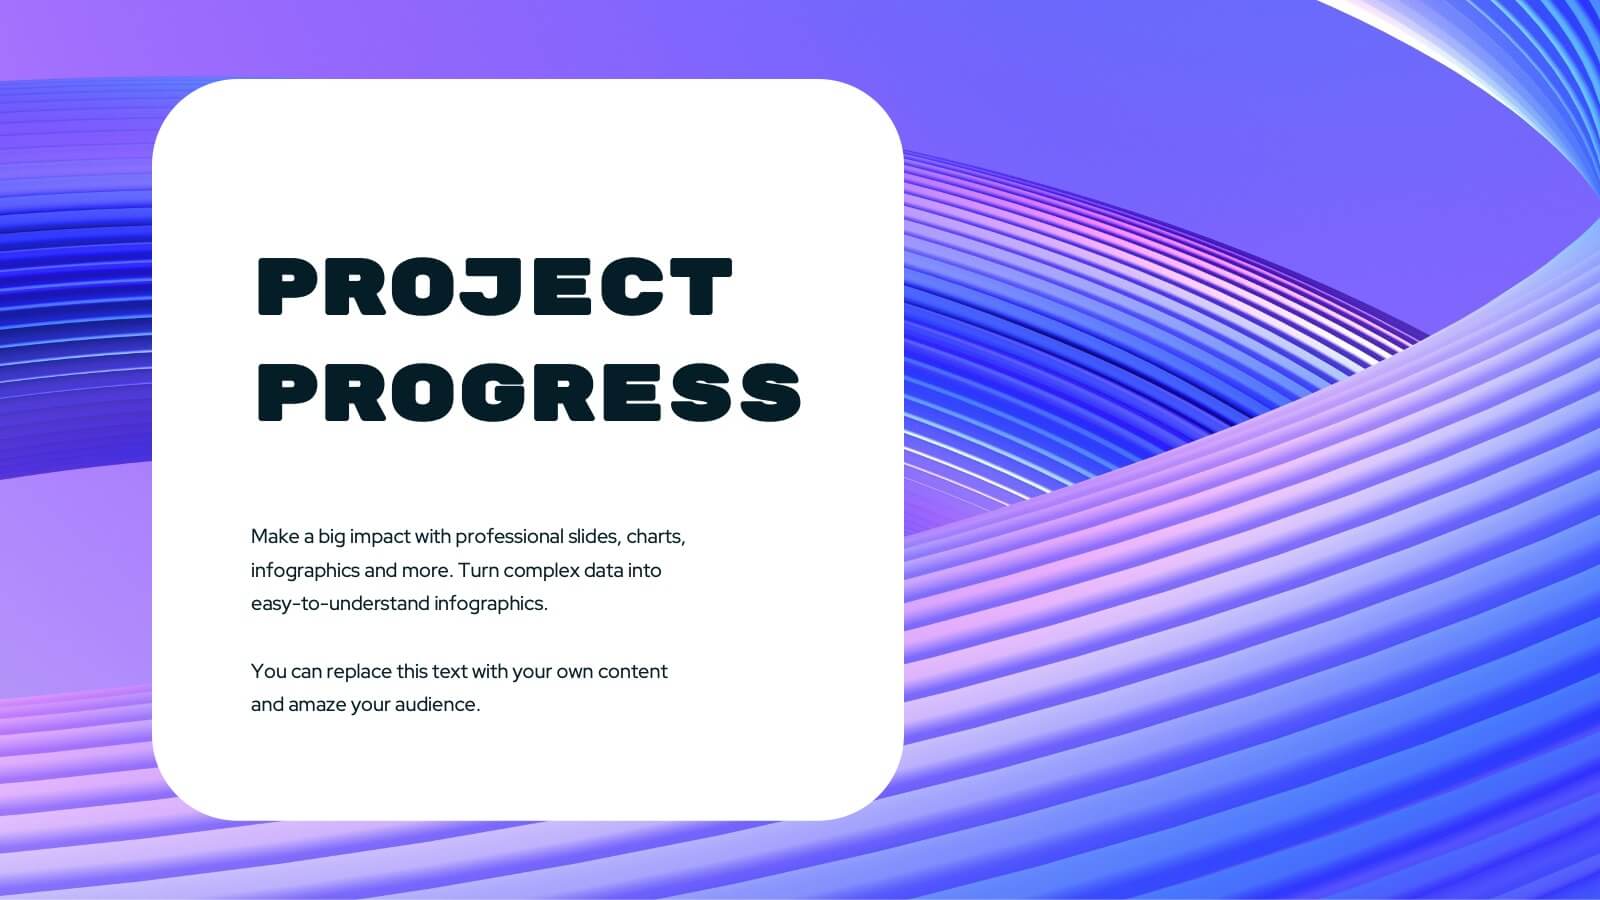
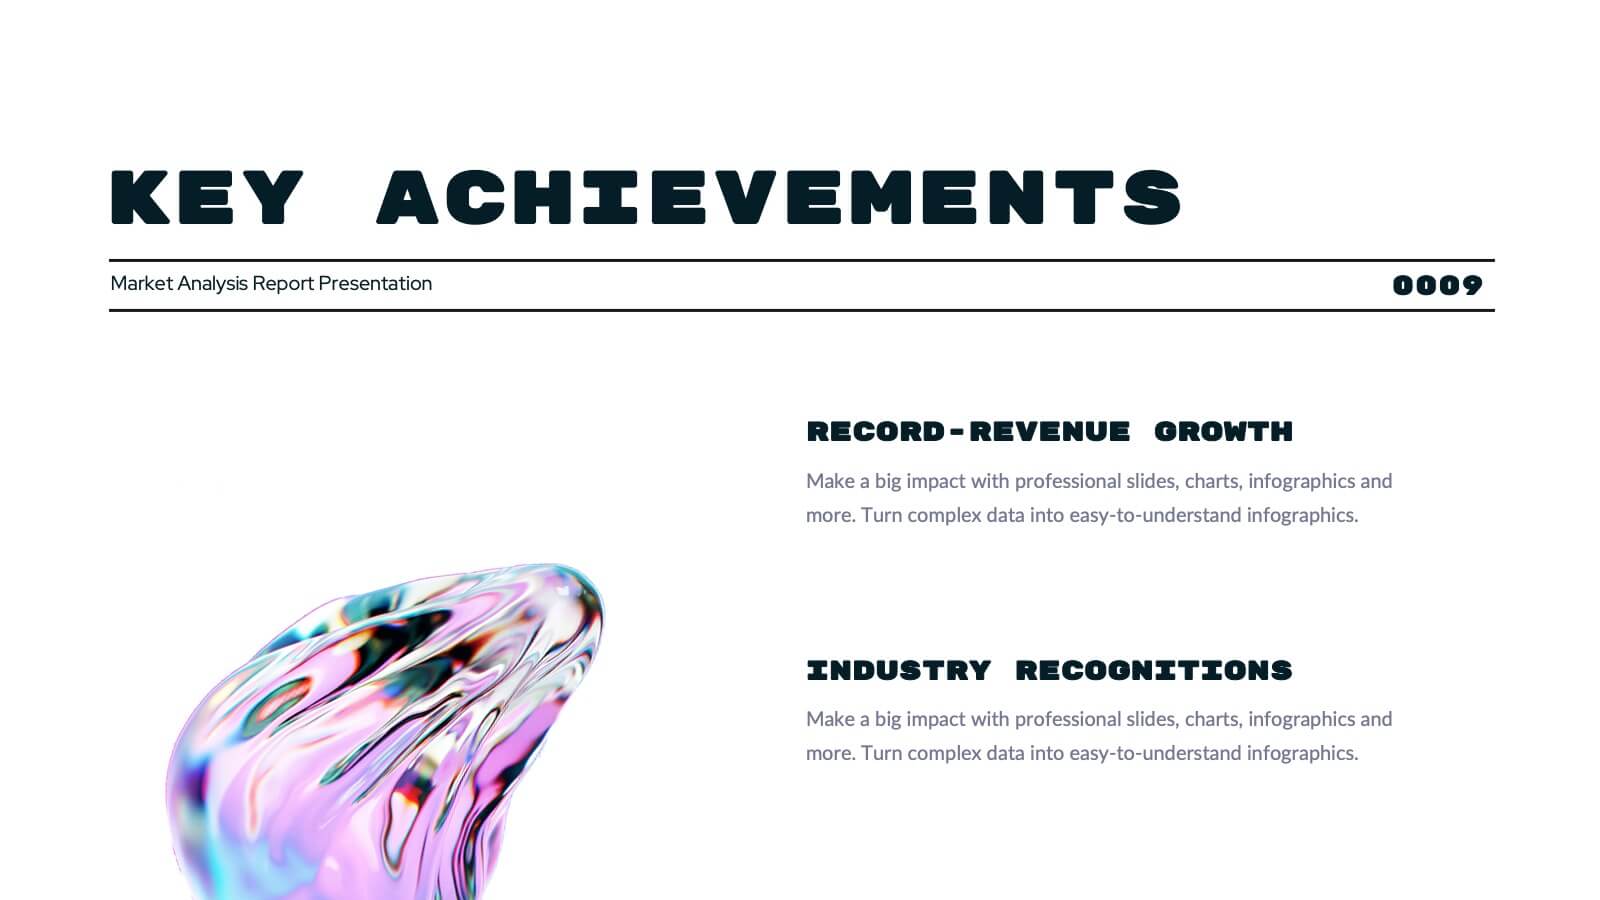
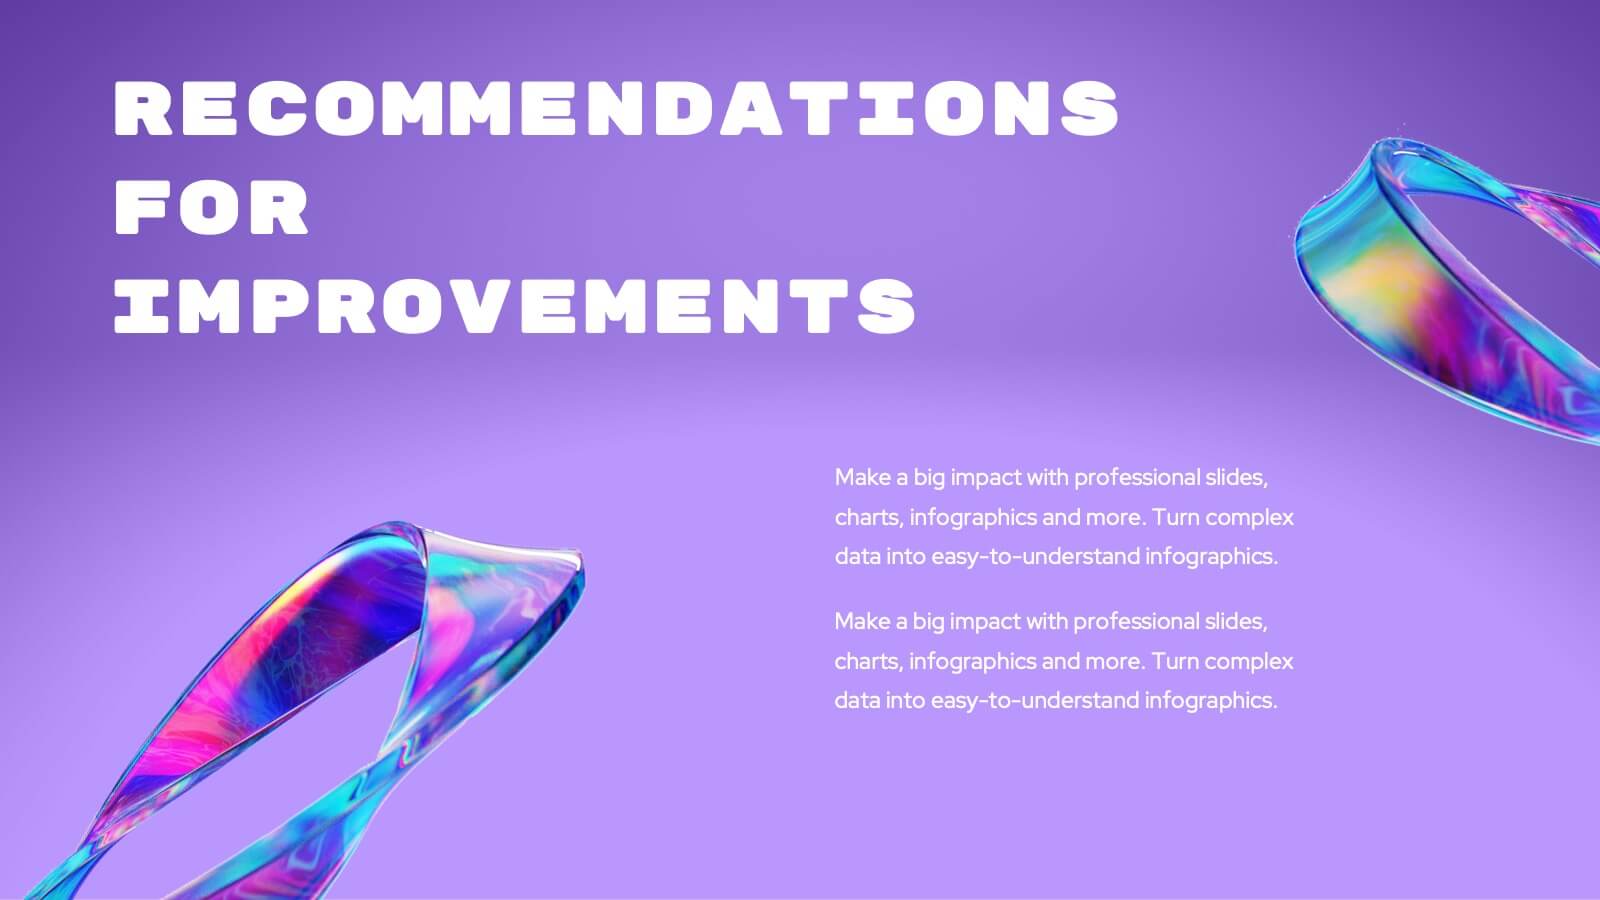
Turquoise Market Analysis Report Presentation
This sleek report presentation template covers essential sections like key performance metrics, market analysis, and strategic initiatives. It’s designed for a professional yet modern look, perfect for showcasing updates and insights. Compatible with PowerPoint, Keynote, and Google Slides, it’s ideal for delivering engaging and impactful business reports.


5 diapositivas
International Reach World Map Presentation
Bring your global story to life with a clean, modern layout that highlights key regions and data points in a visually engaging way. This presentation helps you showcase international impact, market presence, or worldwide performance with clarity and confidence. Fully compatible with PowerPoint, Keynote, and Google Slides.


6 diapositivas
5-Level Risk Assessment Diagram Presentation
Simplify complex risk analysis with a clean, layered design that walks your audience through five key levels of impact and probability. Perfect for corporate reports, project management, or strategic planning, this presentation ensures clarity and engagement. Fully compatible with PowerPoint, Keynote, and Google Slides for easy customization.


4 diapositivas
4-Quadrant RACI Chart Slide Presentation
Bring structure and clarity to your workflow with a bold, pyramid-style layout that makes responsibilities instantly understandable. This presentation helps teams outline who leads, supports, approves, and informs across key tasks, turning complex processes into a clean visual map. Fully editable and compatible with PowerPoint, Keynote, and Google Slides.


6 diapositivas
2-Option Comparison Chart Presentation
Make your decision-making story pop with a clean, energetic layout that clearly contrasts two paths side by side. This presentation helps you compare options, outline pros and cons, and guide audiences toward confident choices with sharp visual structure. Fully compatible with PowerPoint, Keynote, and Google Slides.


26 diapositivas
Company Profile Geometric Presentation
A company profile is a document or presentation that provides an overview of a business or organization. This presentation template serves as a marketing tool to showcase the company's strengths, capabilities, products, history, and achievements. Use this template to effectively showcases your company's identity, values, and services. The presentation is designed to leave a lasting impression on potential clients, partners, investors, and stakeholders. With its clean lines and geometric elements, the template exudes a sense of sophistication and contemporary style. Compatible with Powerpoint, Keynote, and Google Slides.


5 diapositivas
IT Security and Data Protection Presentation
Communicate your cybersecurity objectives with impact using this clean, shield-based visual layout. This presentation slide features five distinct steps with matching icons, perfect for detailing protocols like data governance, firewall strategies, or access control measures. Ideal for IT professionals, network admins, or compliance teams. Fully customizable and compatible with PowerPoint, Keynote, and Google Slides.


20 diapositivas
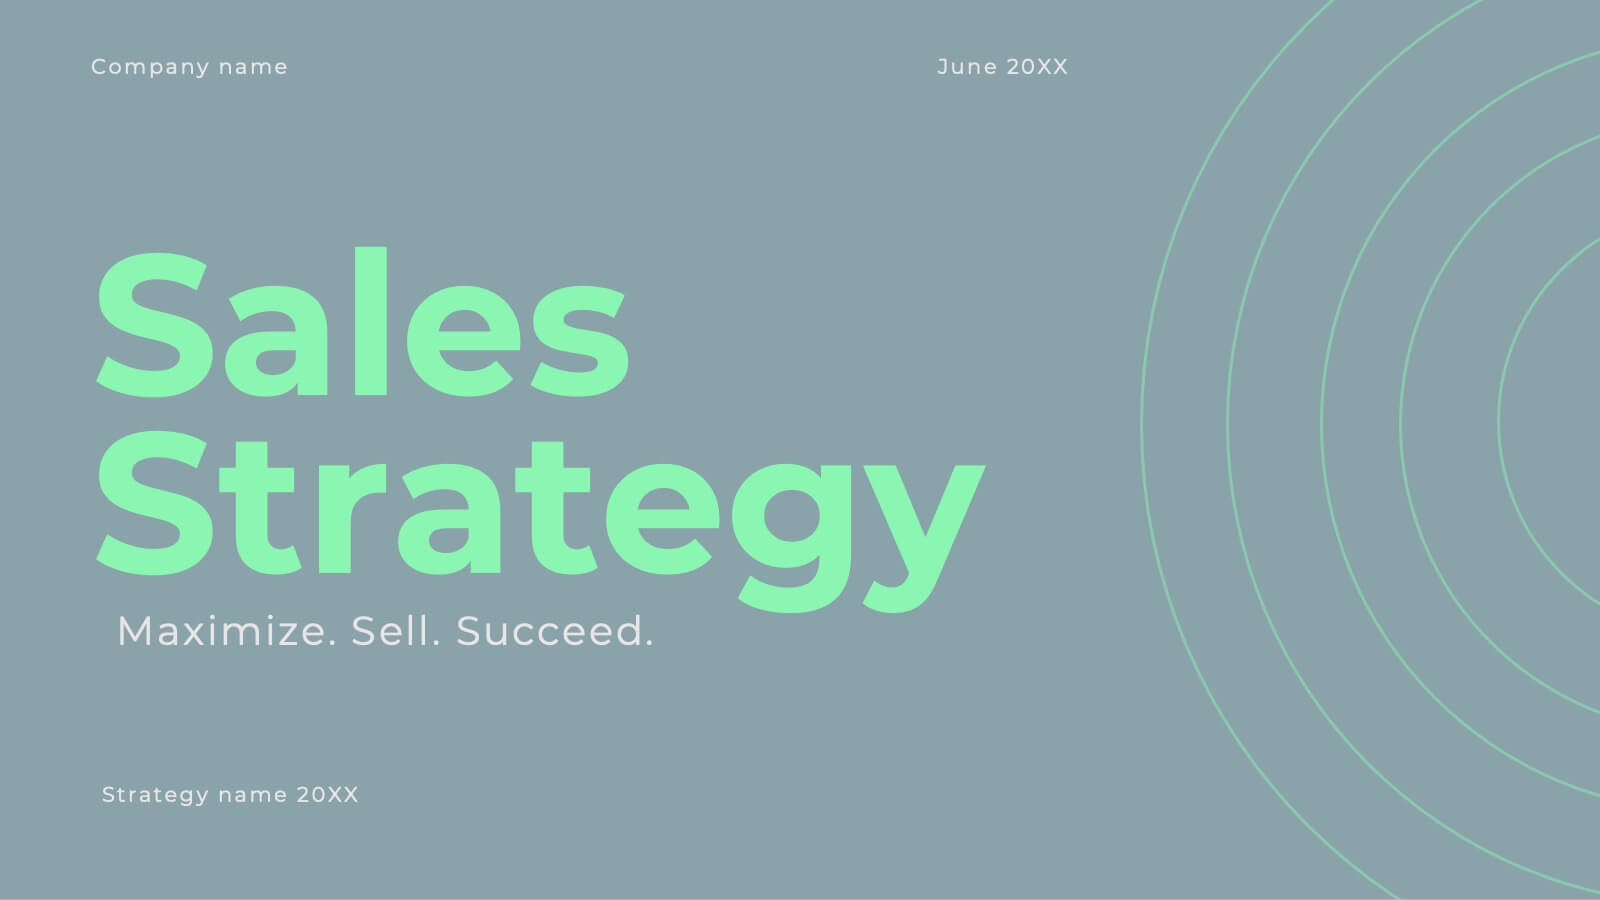
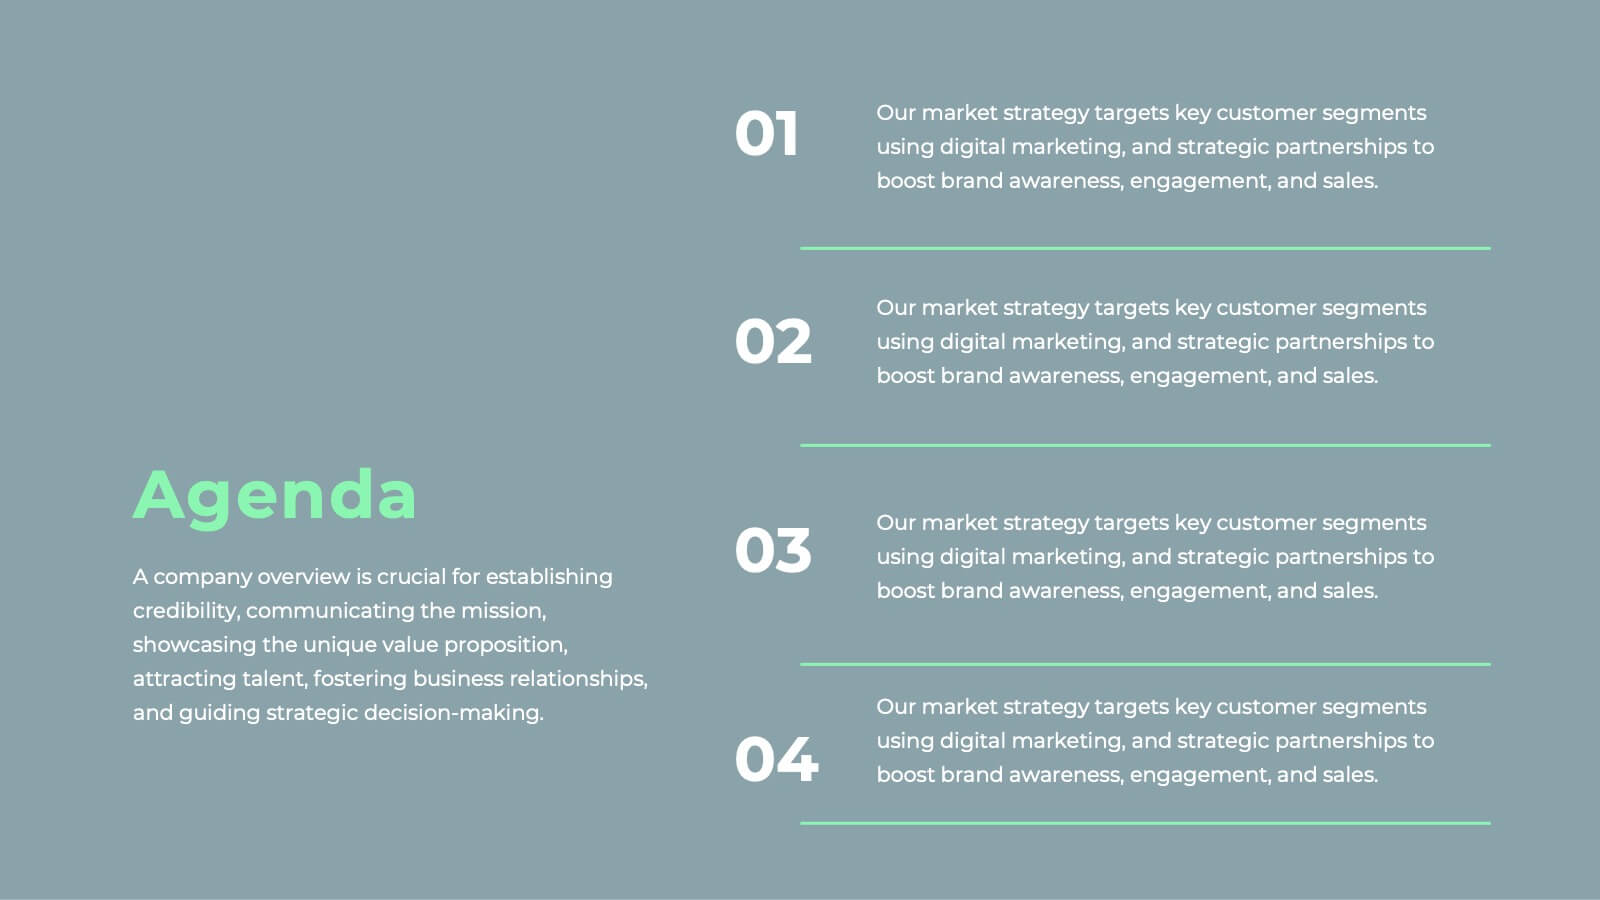
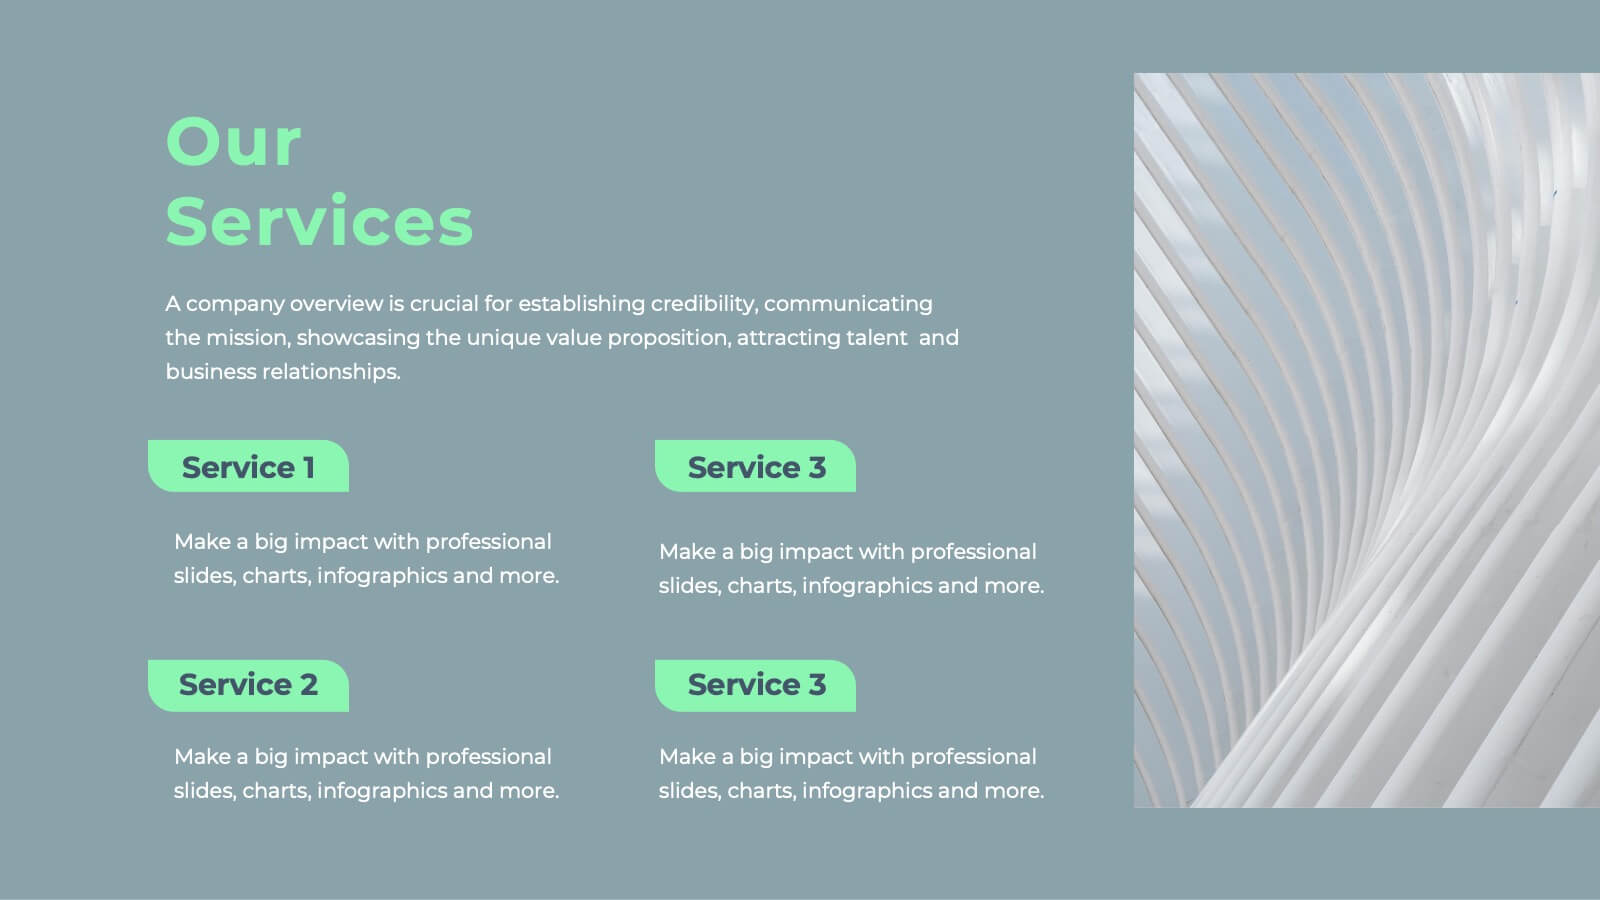
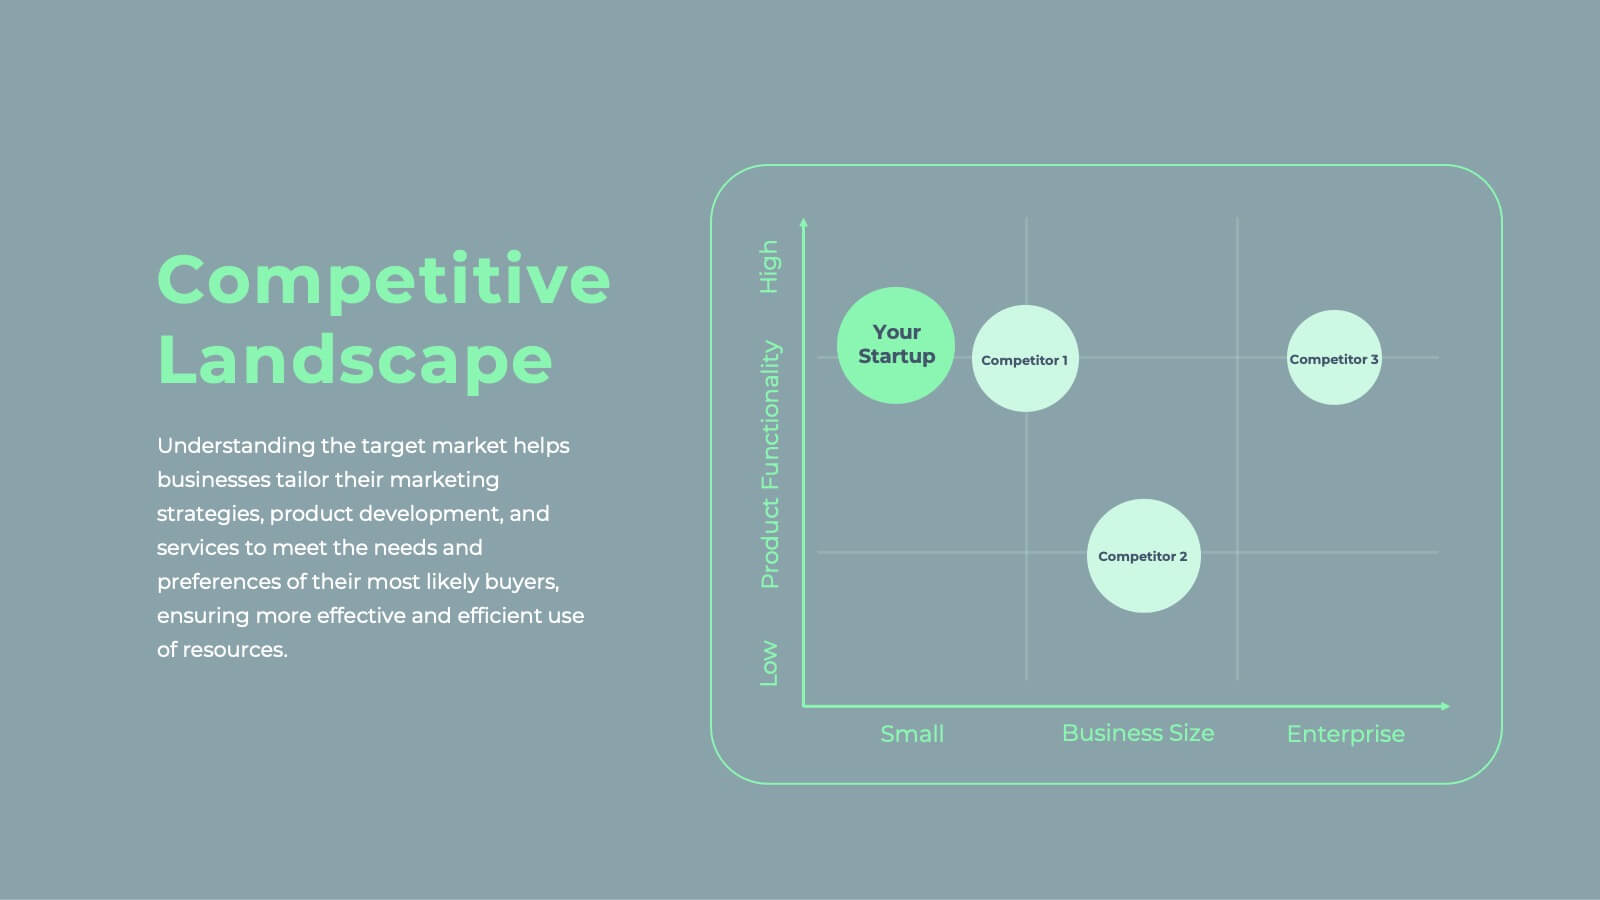
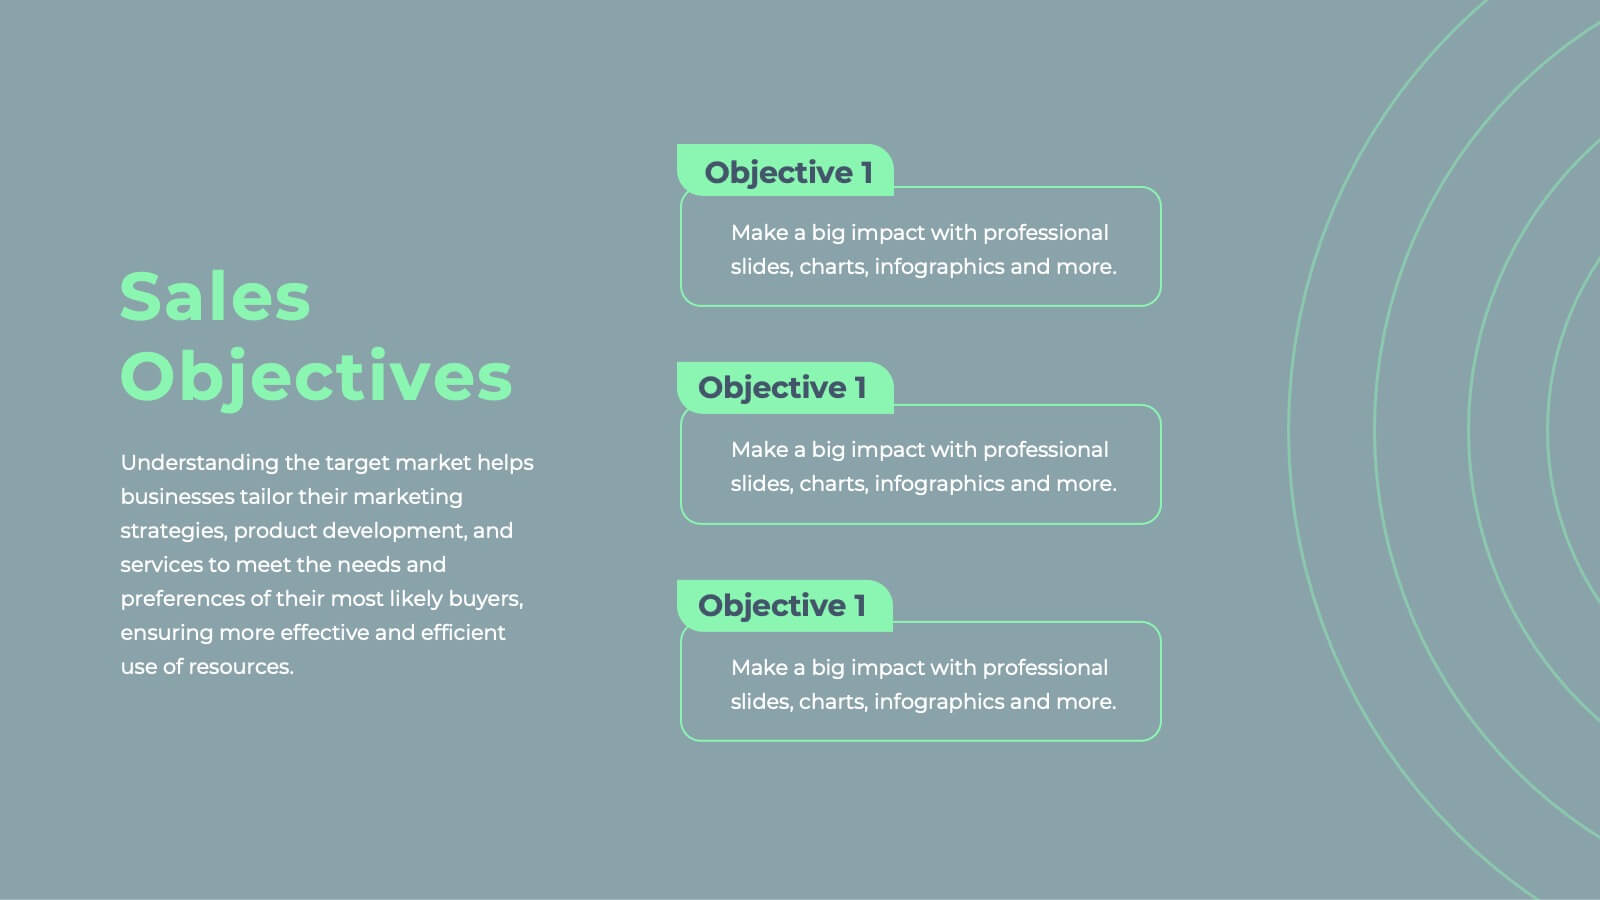
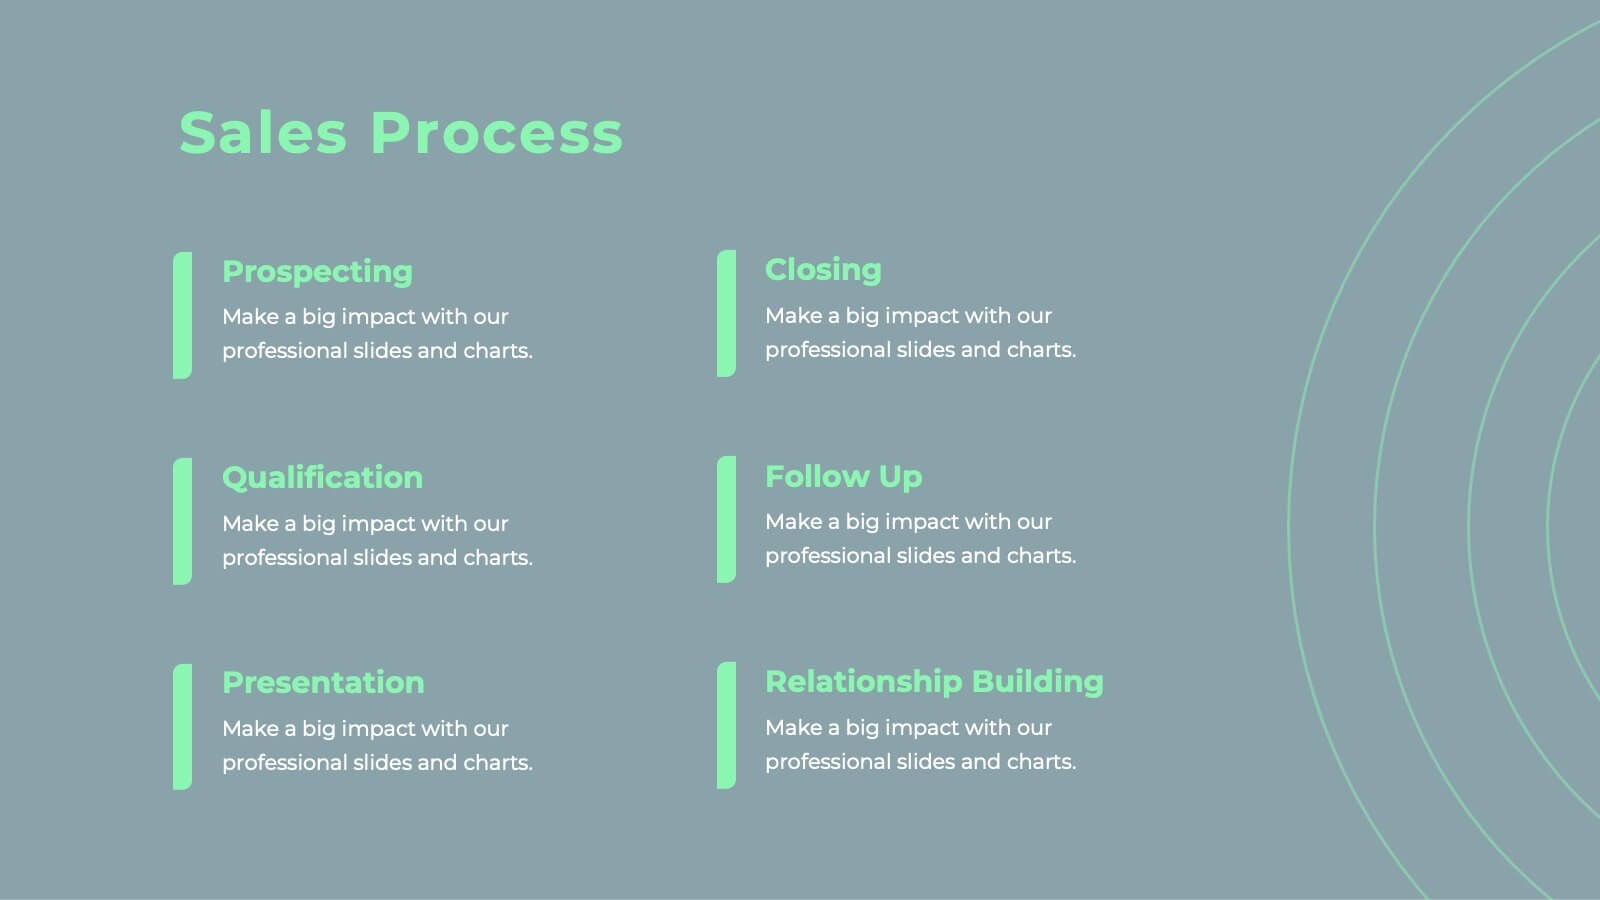
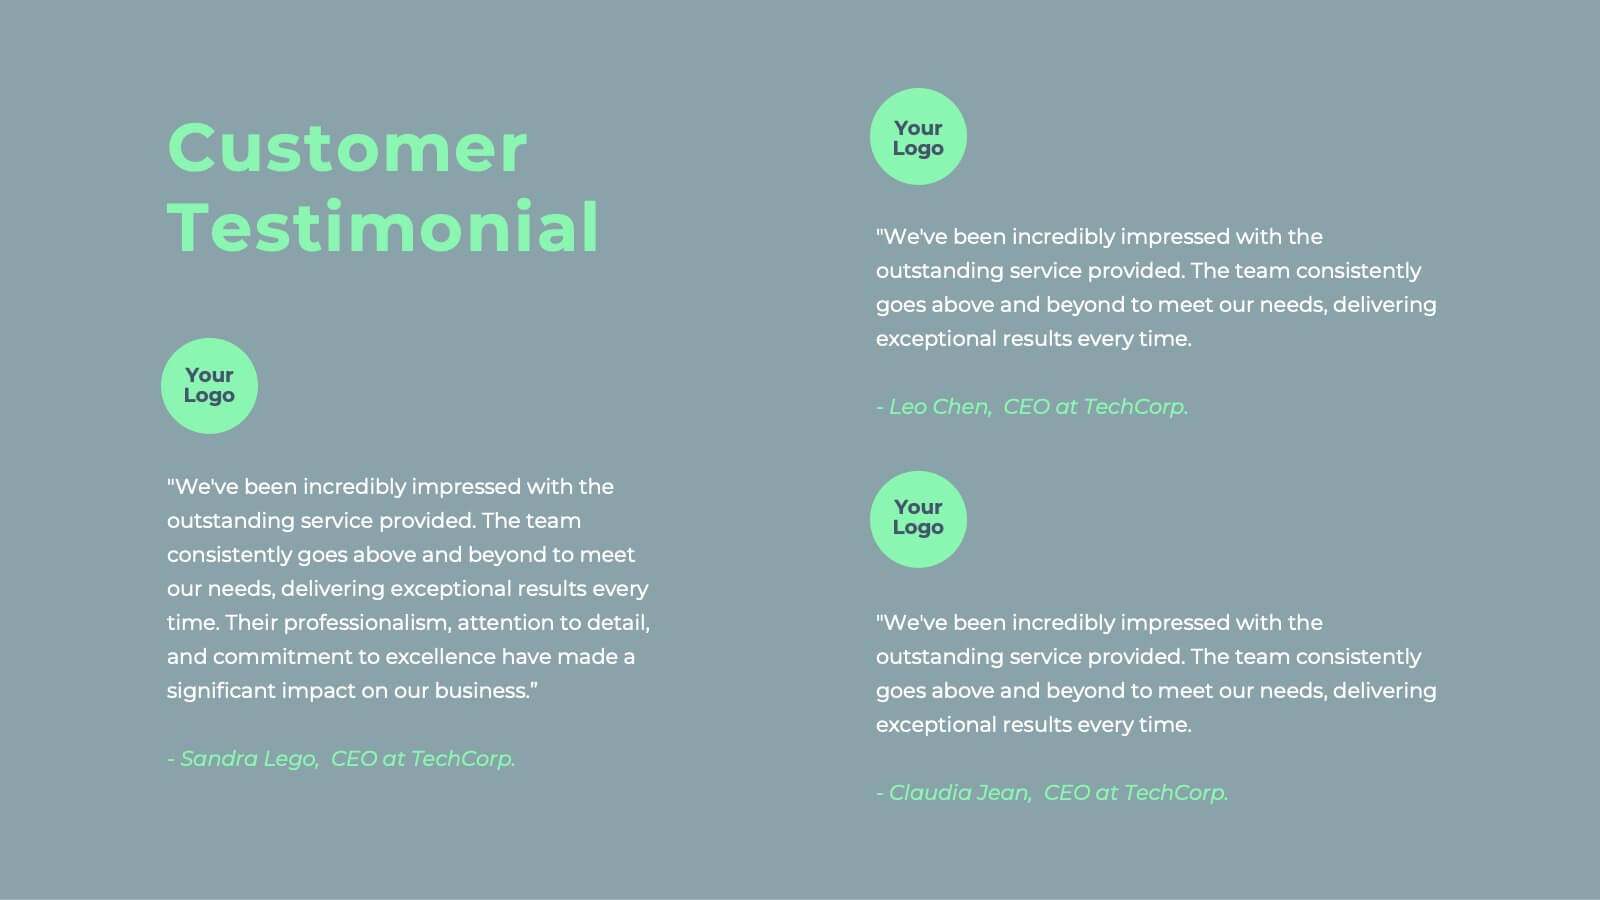
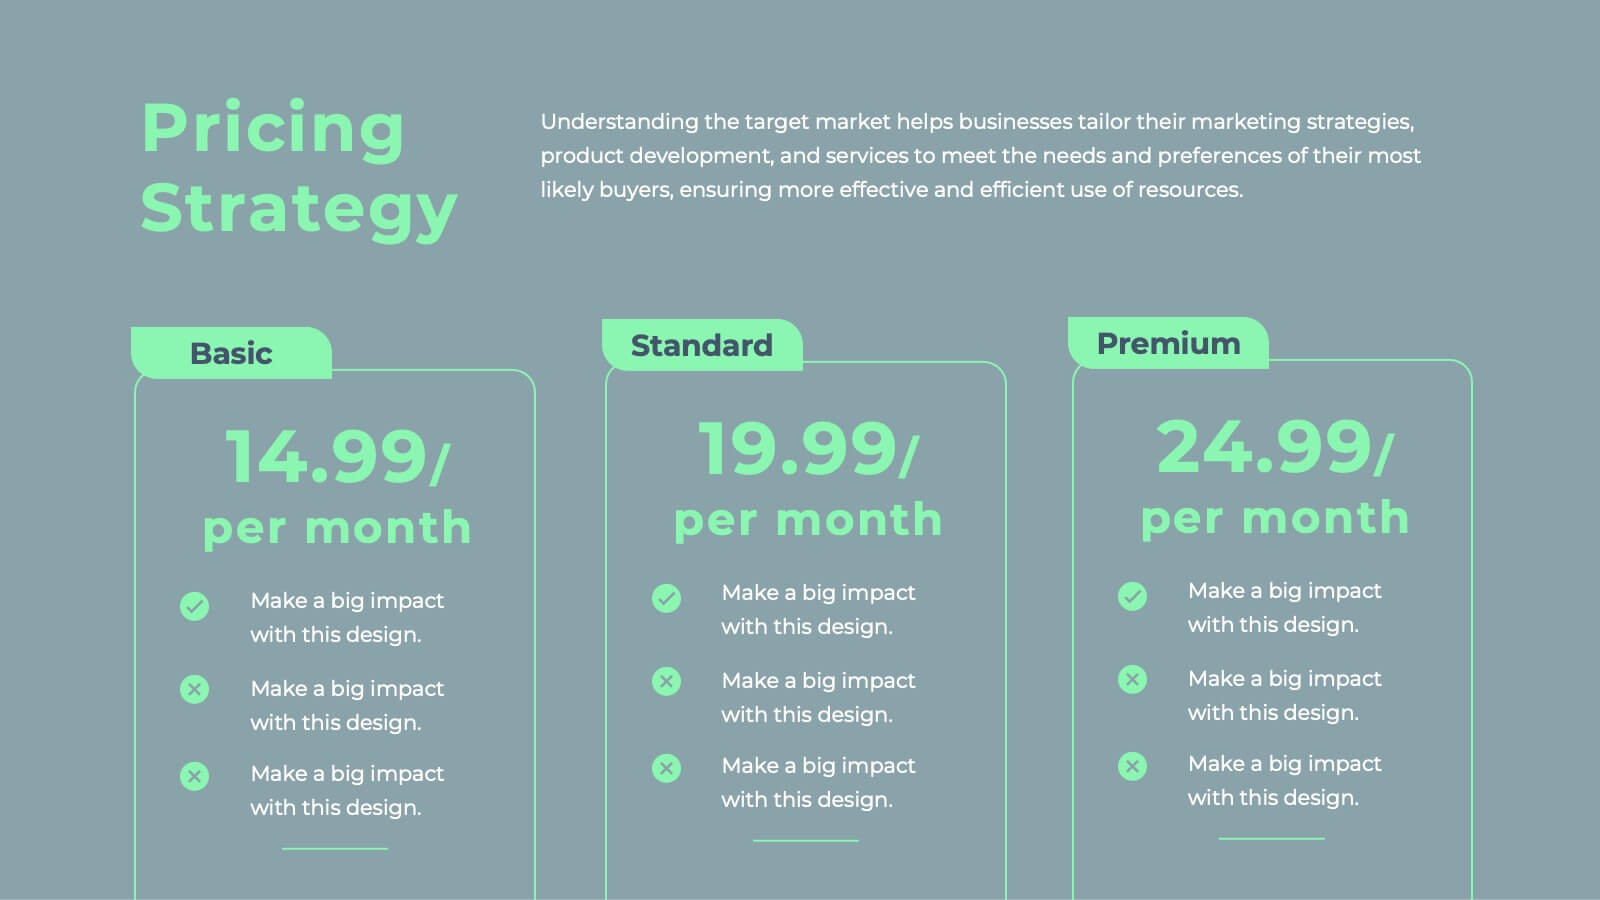
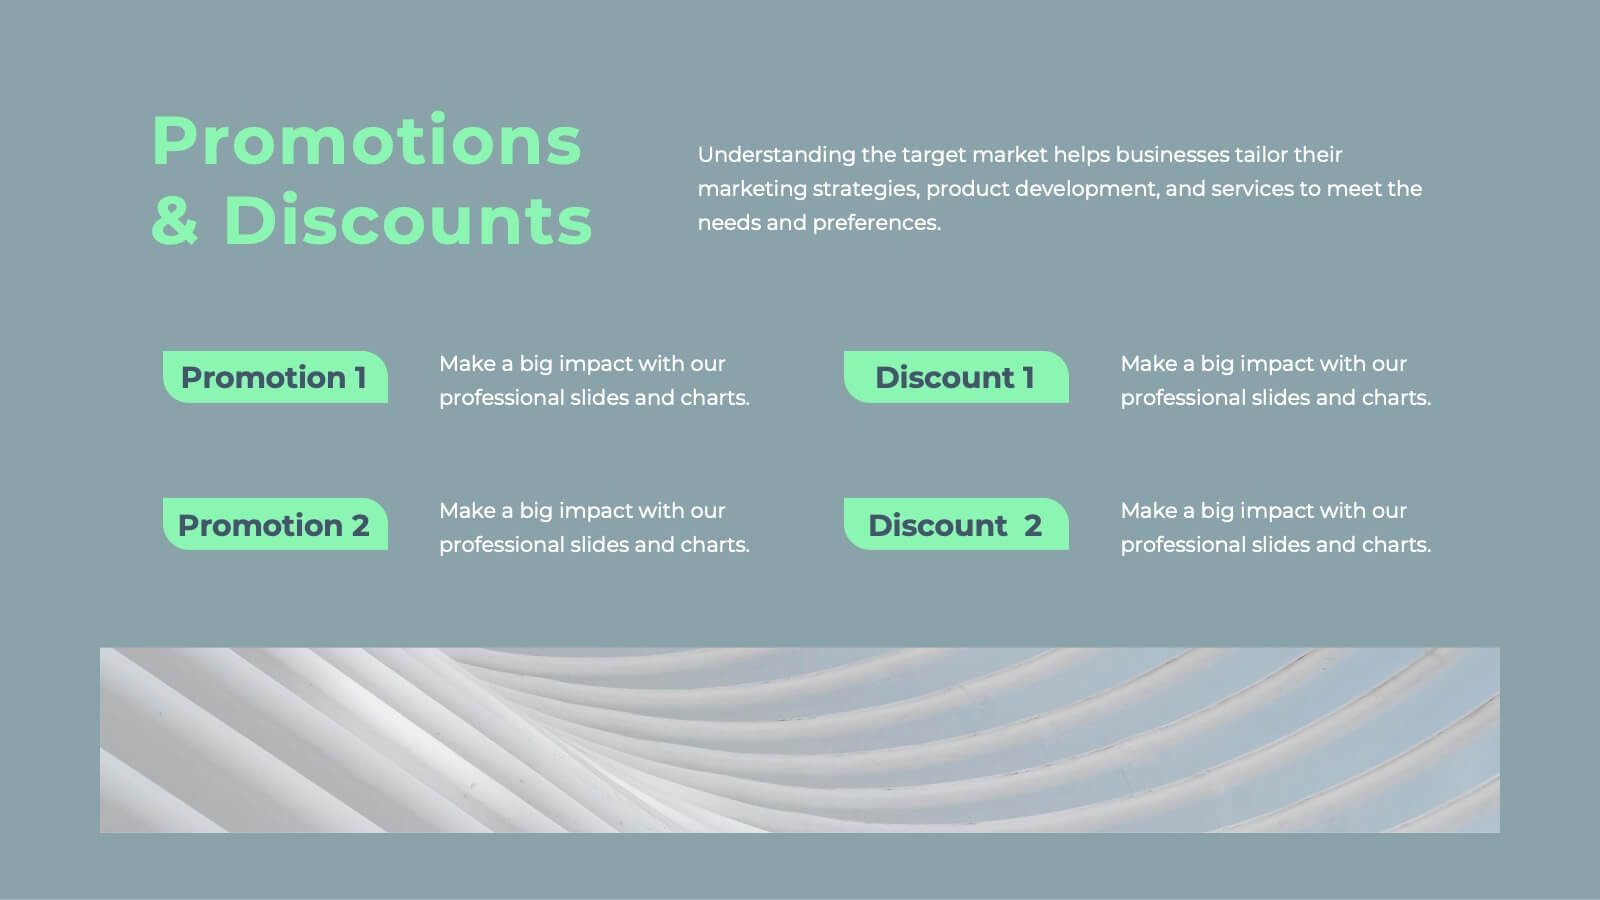
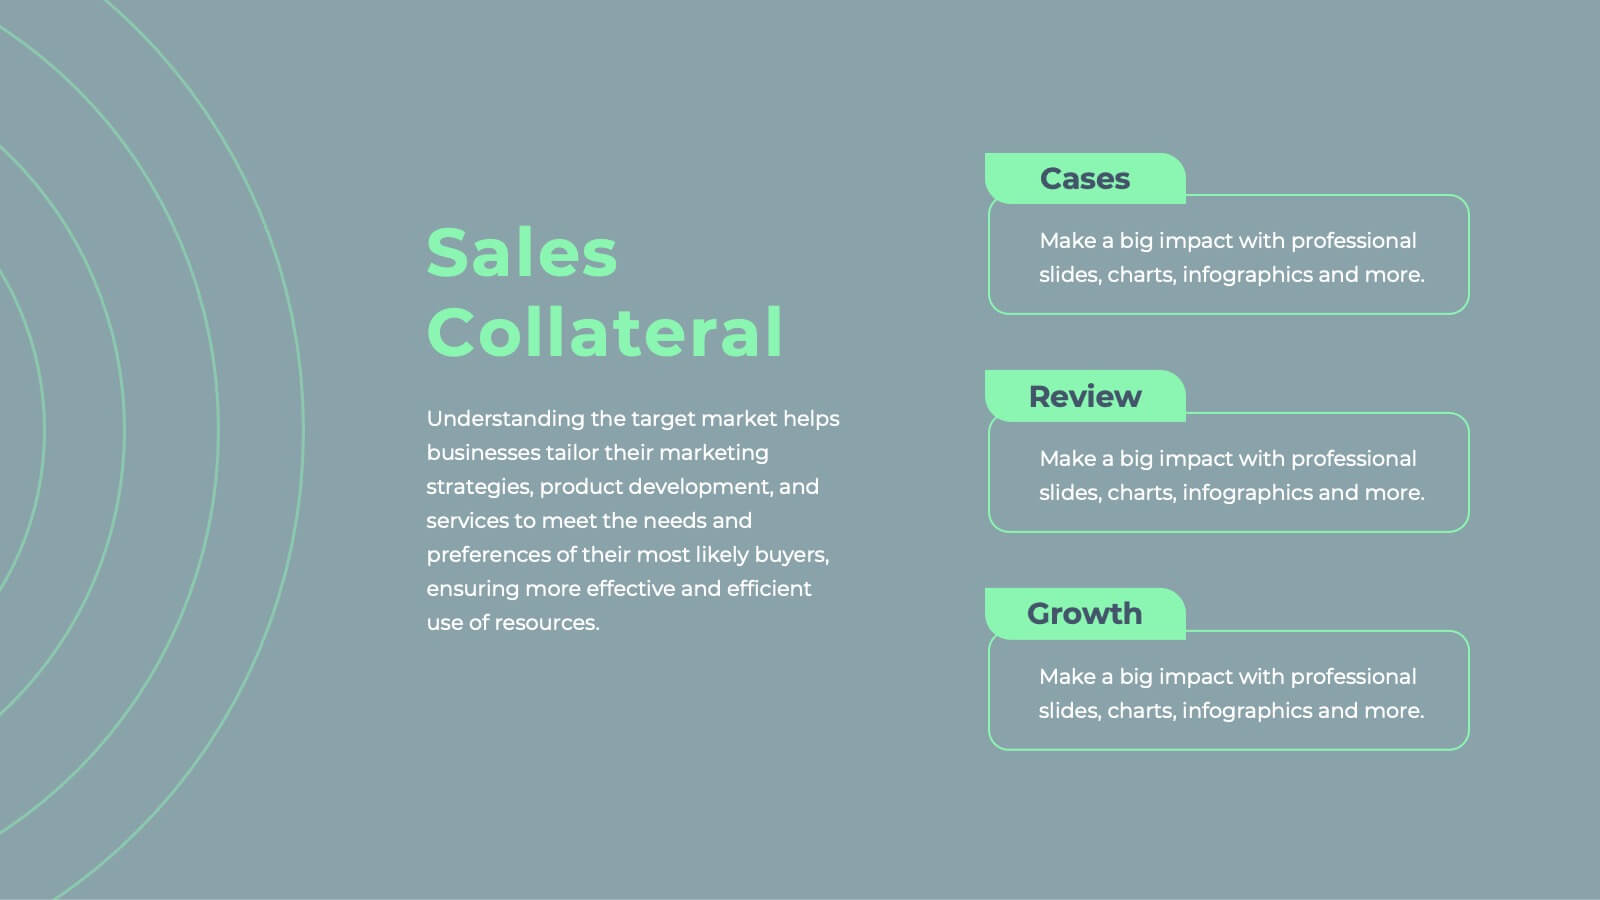
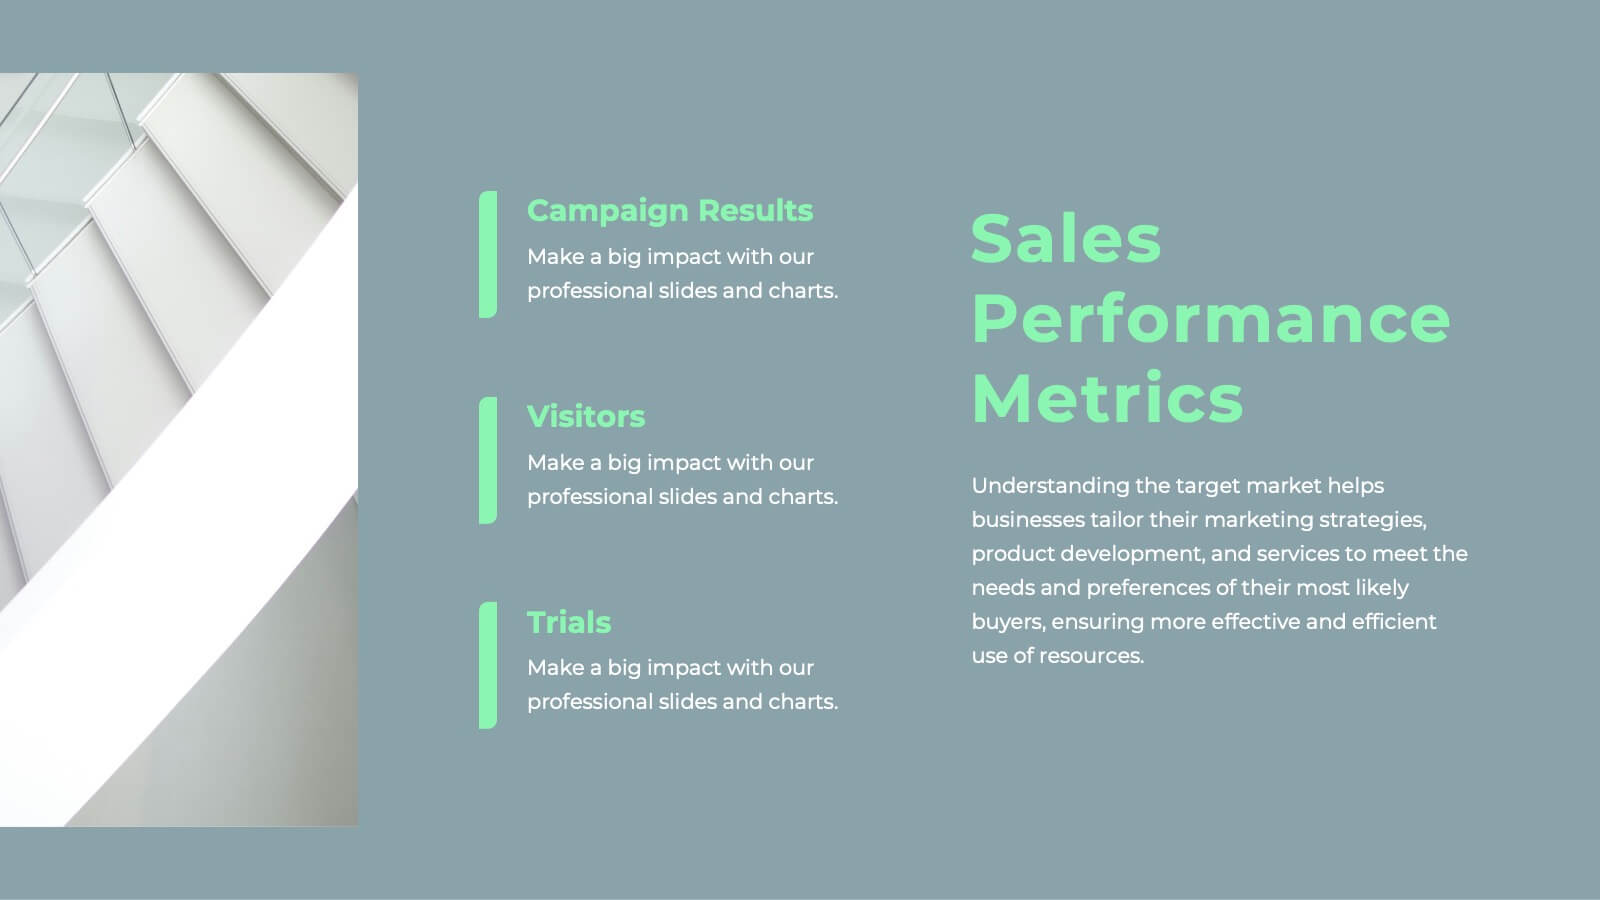
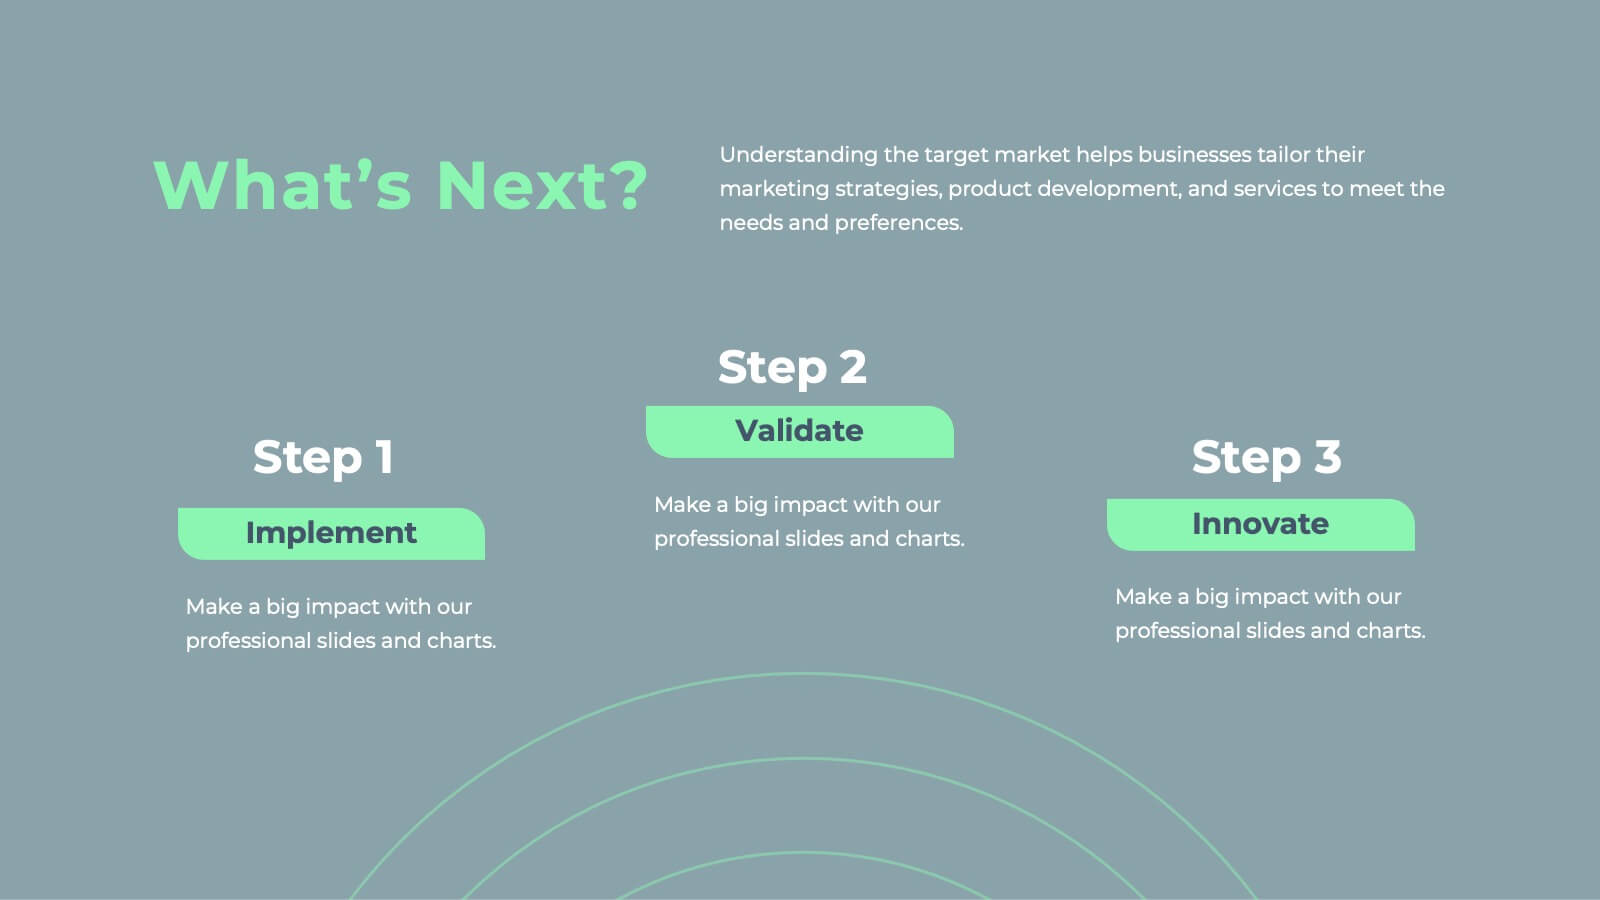
Javelin Sales Strategy Presentation
Boost your sales strategy with this sleek template! Perfect for outlining objectives, processes, performance metrics, and future opportunities. Tailored for impactful presentations to clients and teams. Fully customizable and compatible with PowerPoint, Keynote, and Google Slides.