


Características


¿Tienes alguna pregunta?
Recomendar


6 diapositivas
Lean Six Sigma Framework Slide Presentation
Bring your audience in with a bold, energetic layout that makes each stage feel clear and engaging. This presentation explains the DMAIC framework in a streamlined way, helping users outline process improvement steps with confidence and clarity. Fully customizable and compatible with PowerPoint, Keynote, and Google Slides.


4 diapositivas
Environmental Sustainability Best Practices Presentation
Promote eco-friendly initiatives with the Environmental Sustainability Best Practices Presentation template. This clean and modern slide deck is designed to highlight sustainable business strategies, green initiatives, and environmental impact assessments. Featuring an intuitive layout with clearly defined sections, this fully editable design is ideal for corporate sustainability leaders, educators, and environmental advocates. Compatible with PowerPoint, Keynote, and Google Slides for seamless customization and presentation.


5 diapositivas
Climate Change Effects Infographics
Climate Change refers to long-term shifts in weather patterns and average temperatures on Earth. These infographic templates aim to raise awareness about the urgent need for climate action and illustrate the consequences of environmental changes. These can serve as impactful tools for discussing the consequences of climate change. Whether used in educational settings, environmental campaigns, or climate conferences, this template effectively communicates the urgency of the situation and encourages individuals and communities to take action to mitigate the impacts of climate change. Compatible with Powerpoint, Keynote, and Google Slides.


5 diapositivas
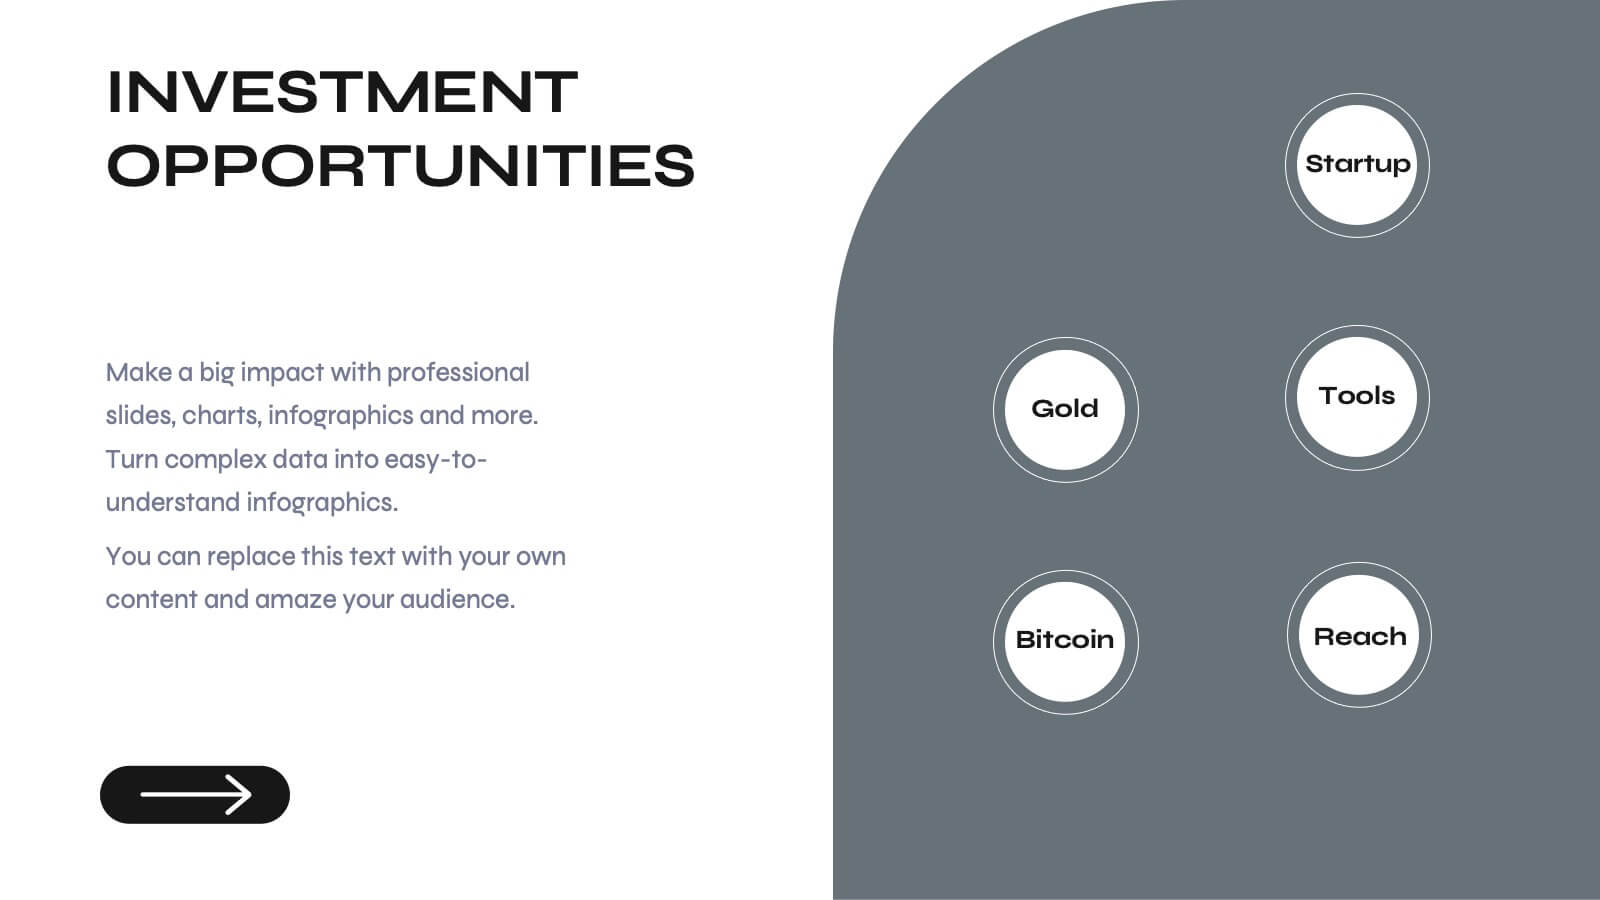
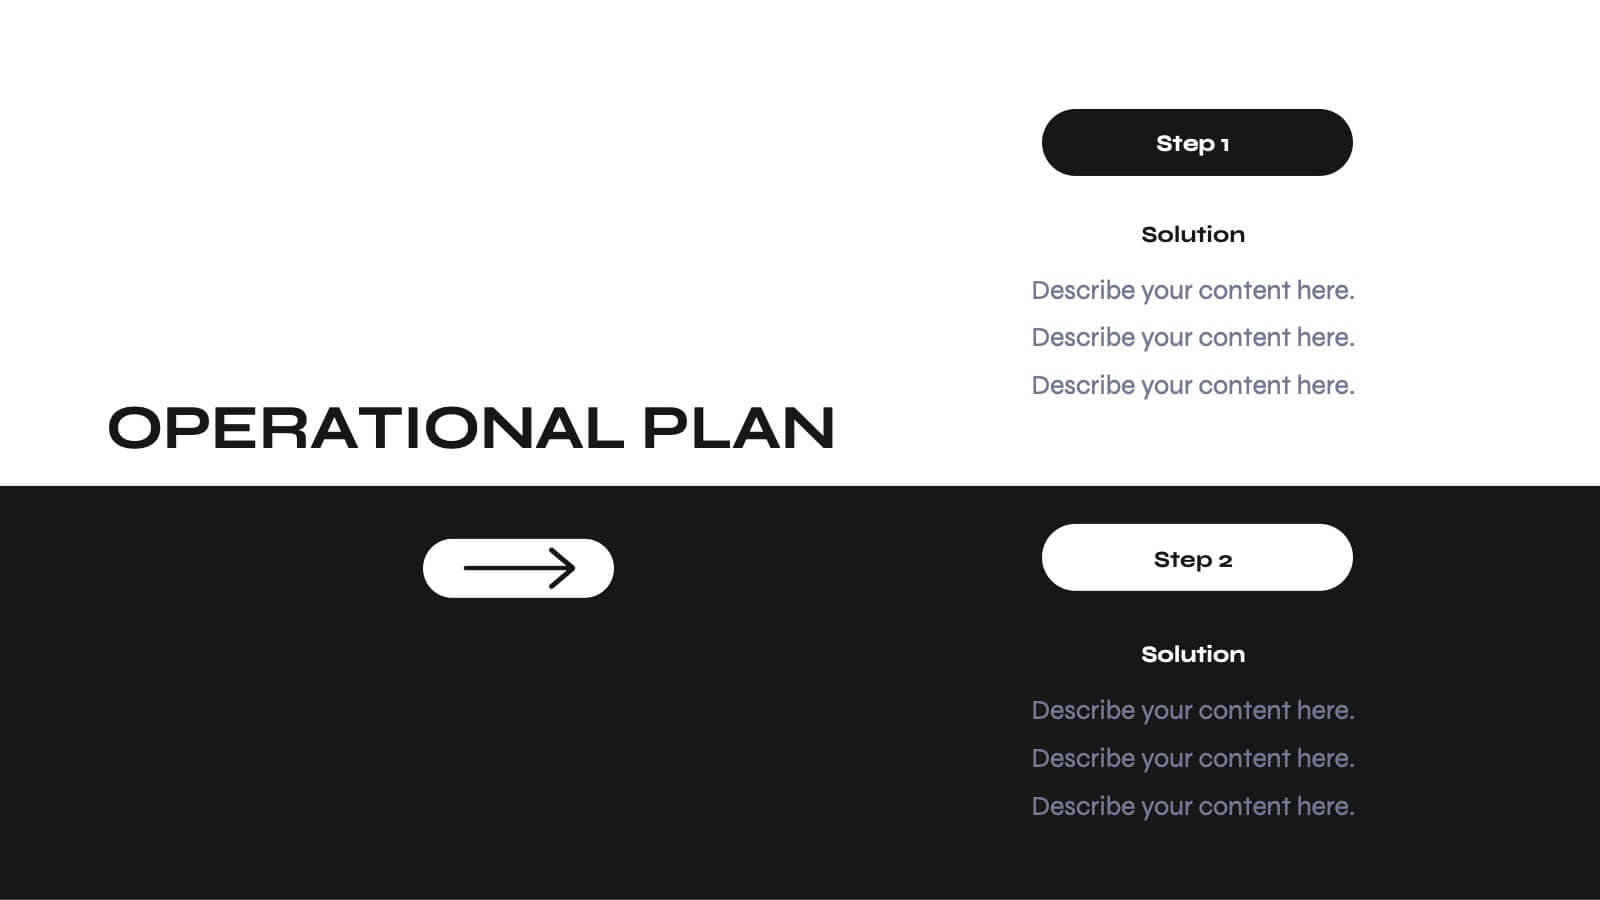
Operational Process Logic Map
Visualize how every function interconnects with the Operational Process Logic Map Presentation. This template uses a radial node structure to break down workflows, responsibilities, or systems into logical clusters, showing how different units or steps interact within an operational framework. Each node is color-coded and icon-marked for clarity, ideal for explaining process flows, department roles, or system dependencies. Fully editable in PowerPoint, Keynote, and Google Slides.


23 diapositivas
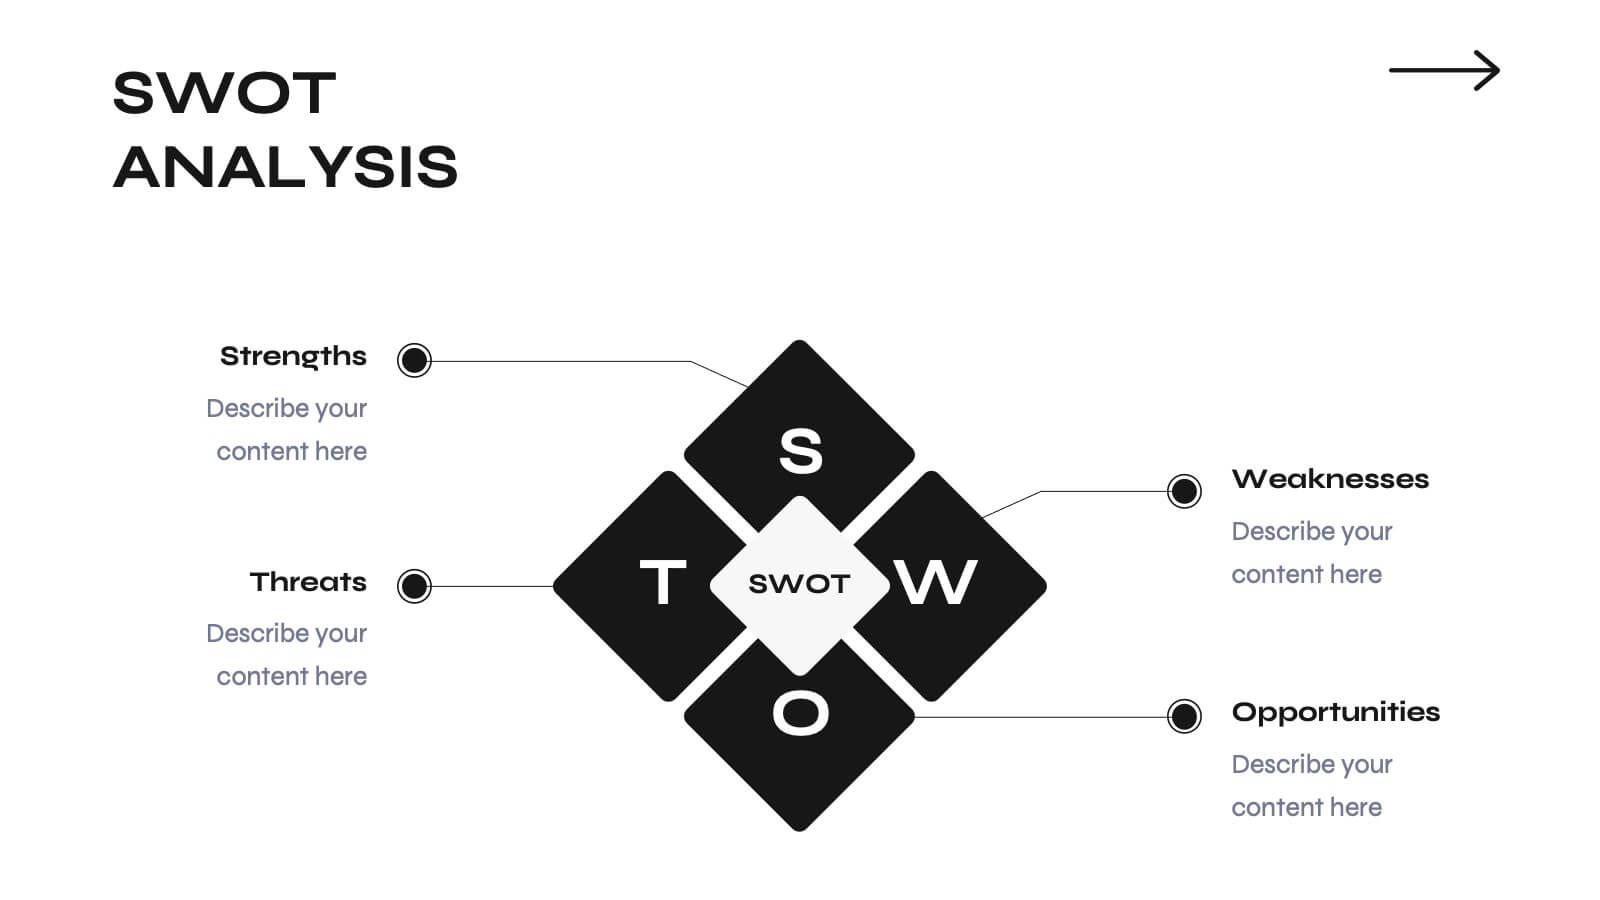
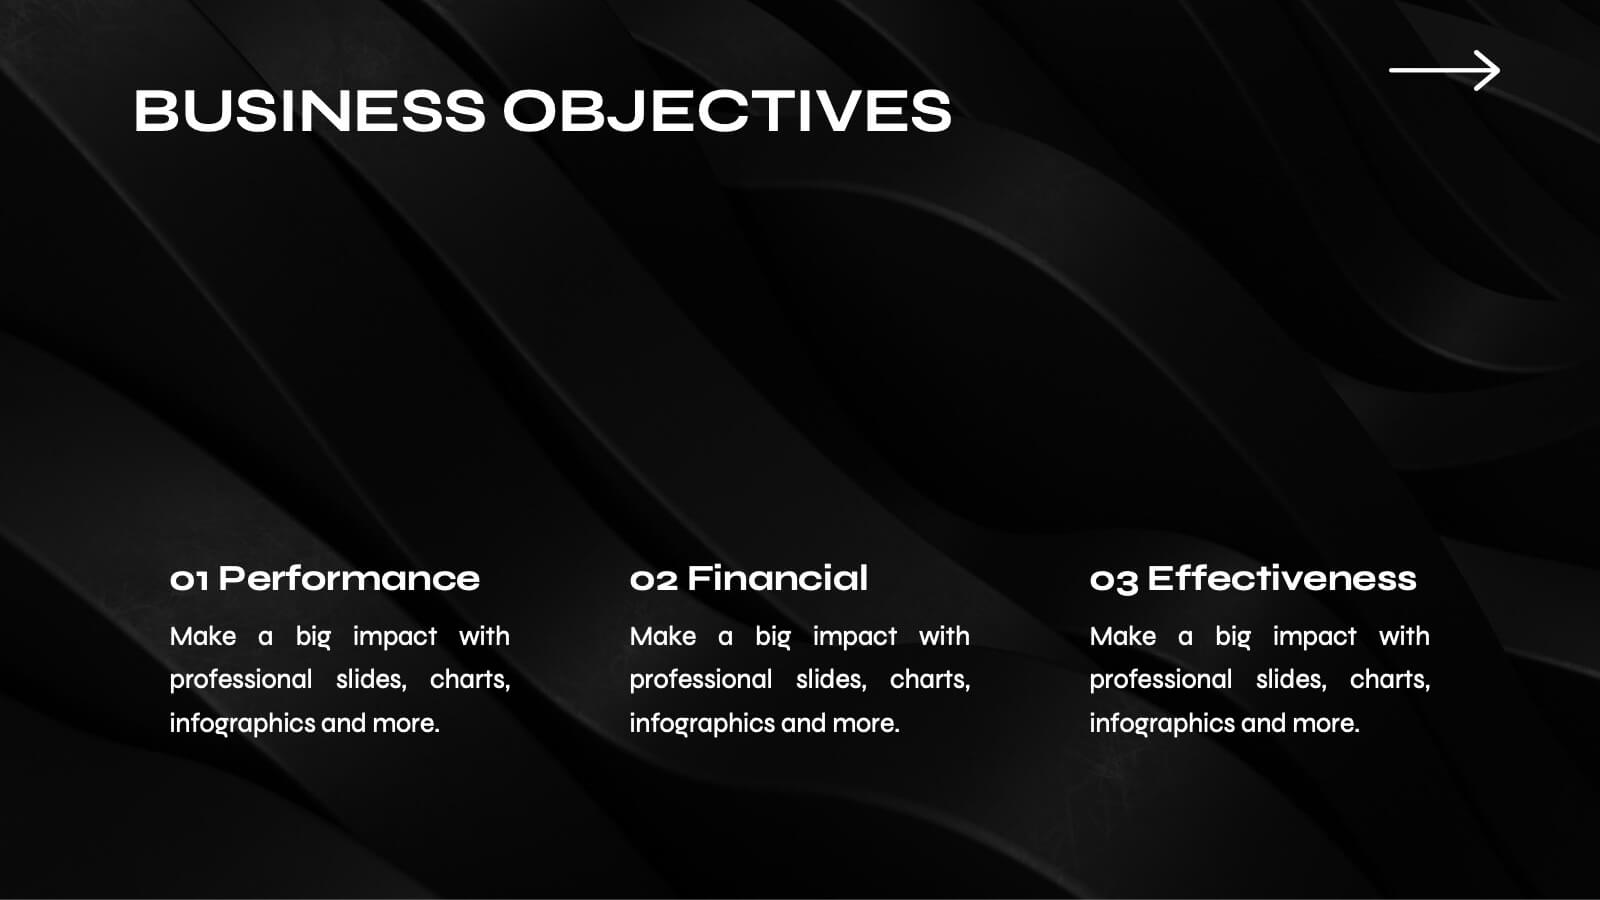
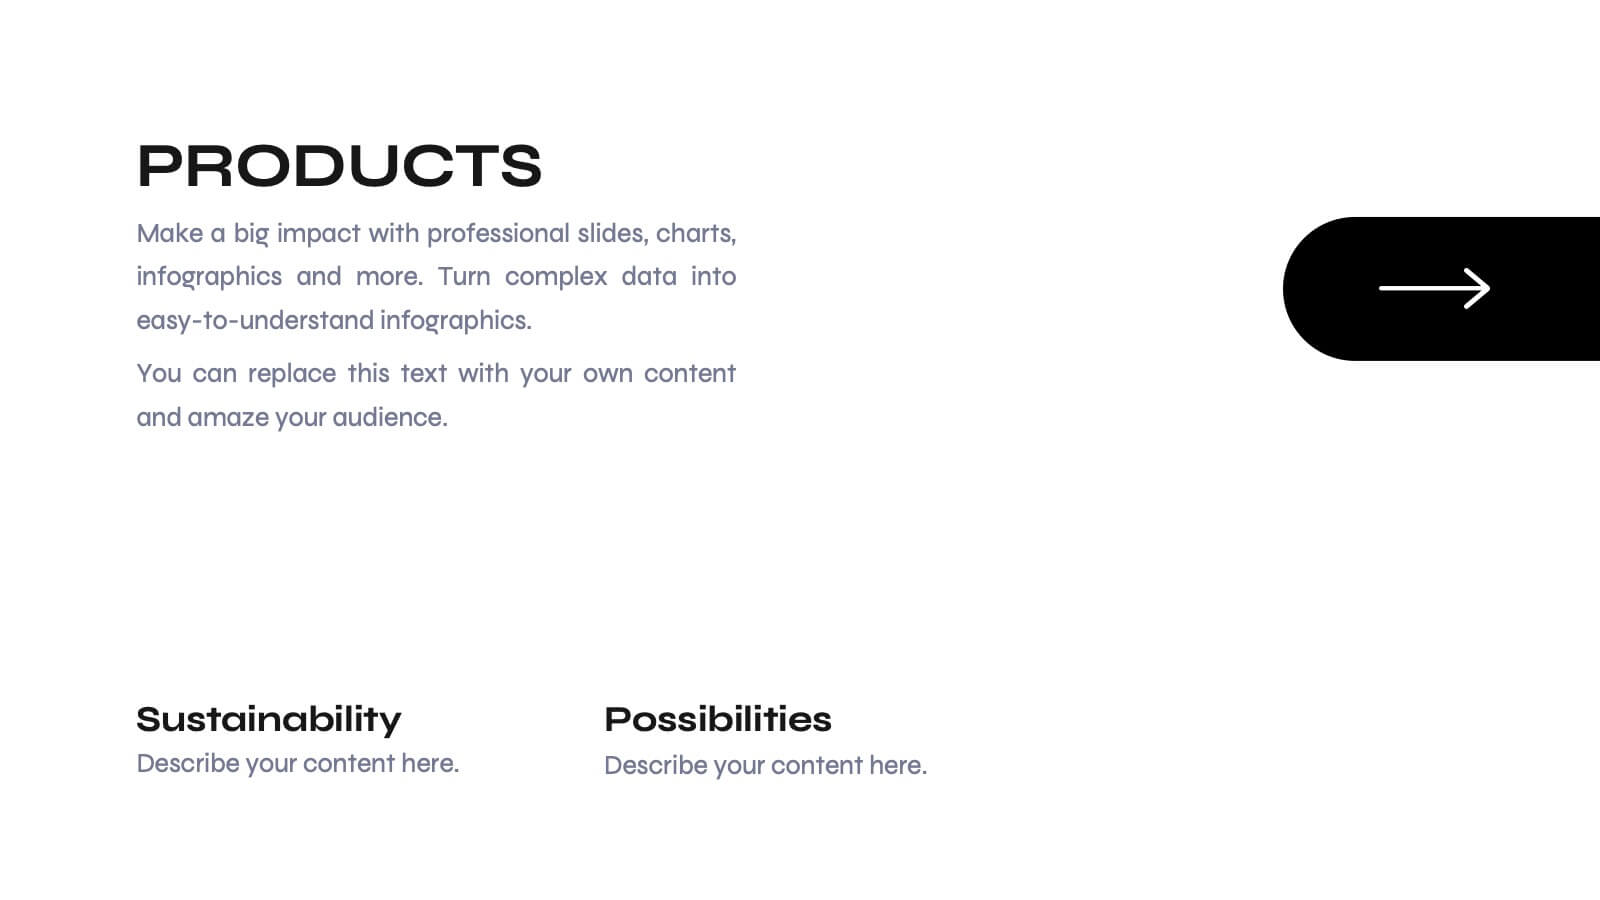
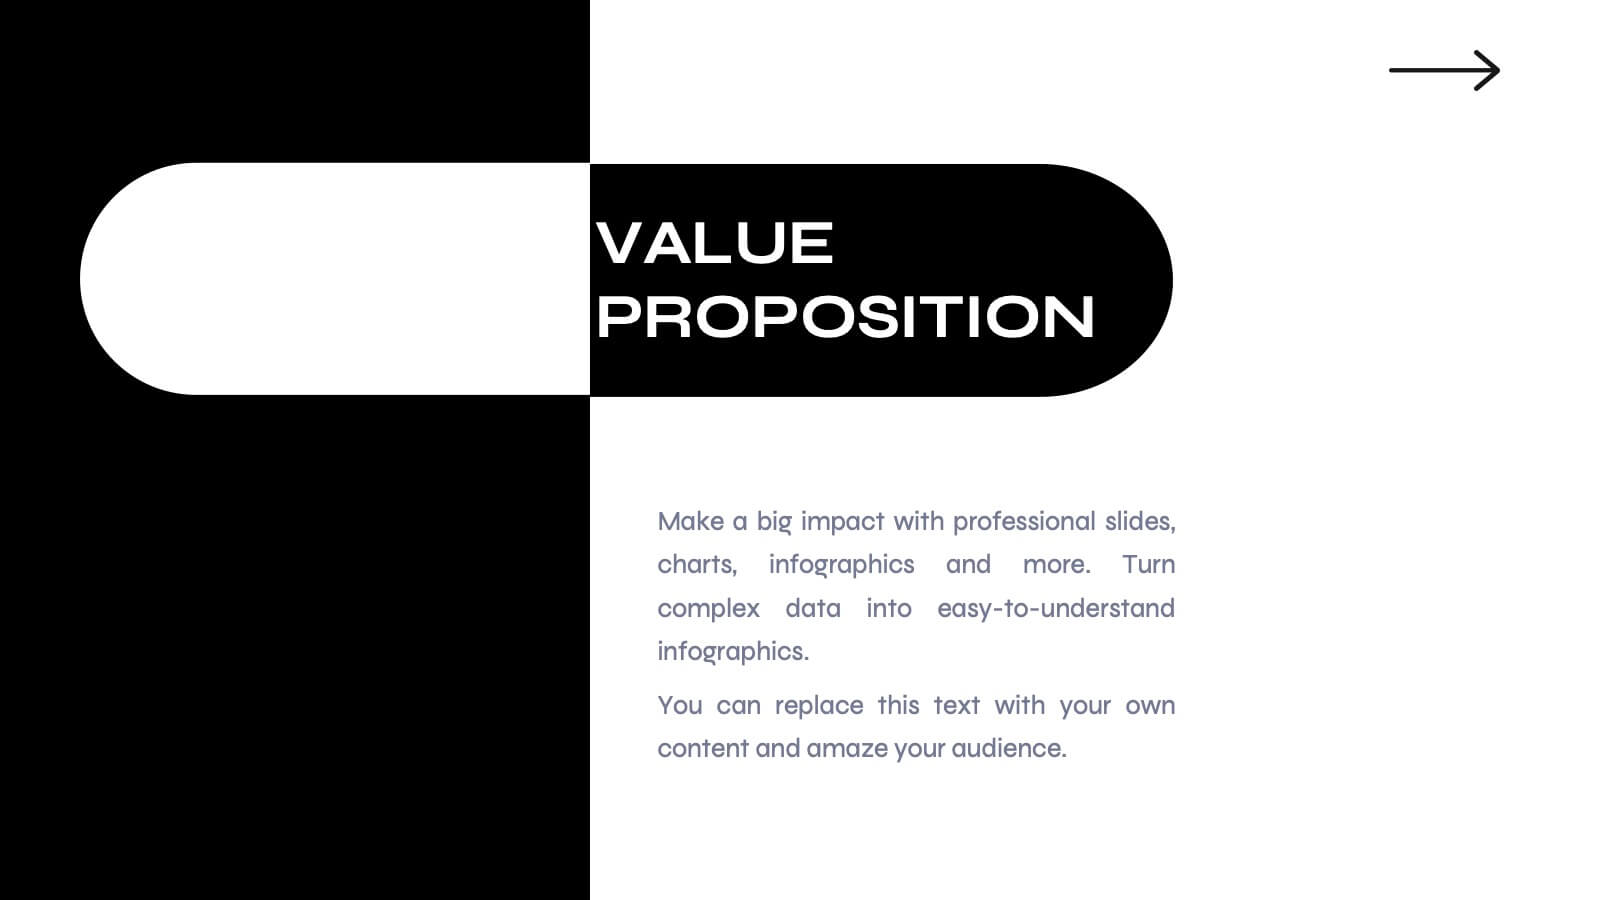
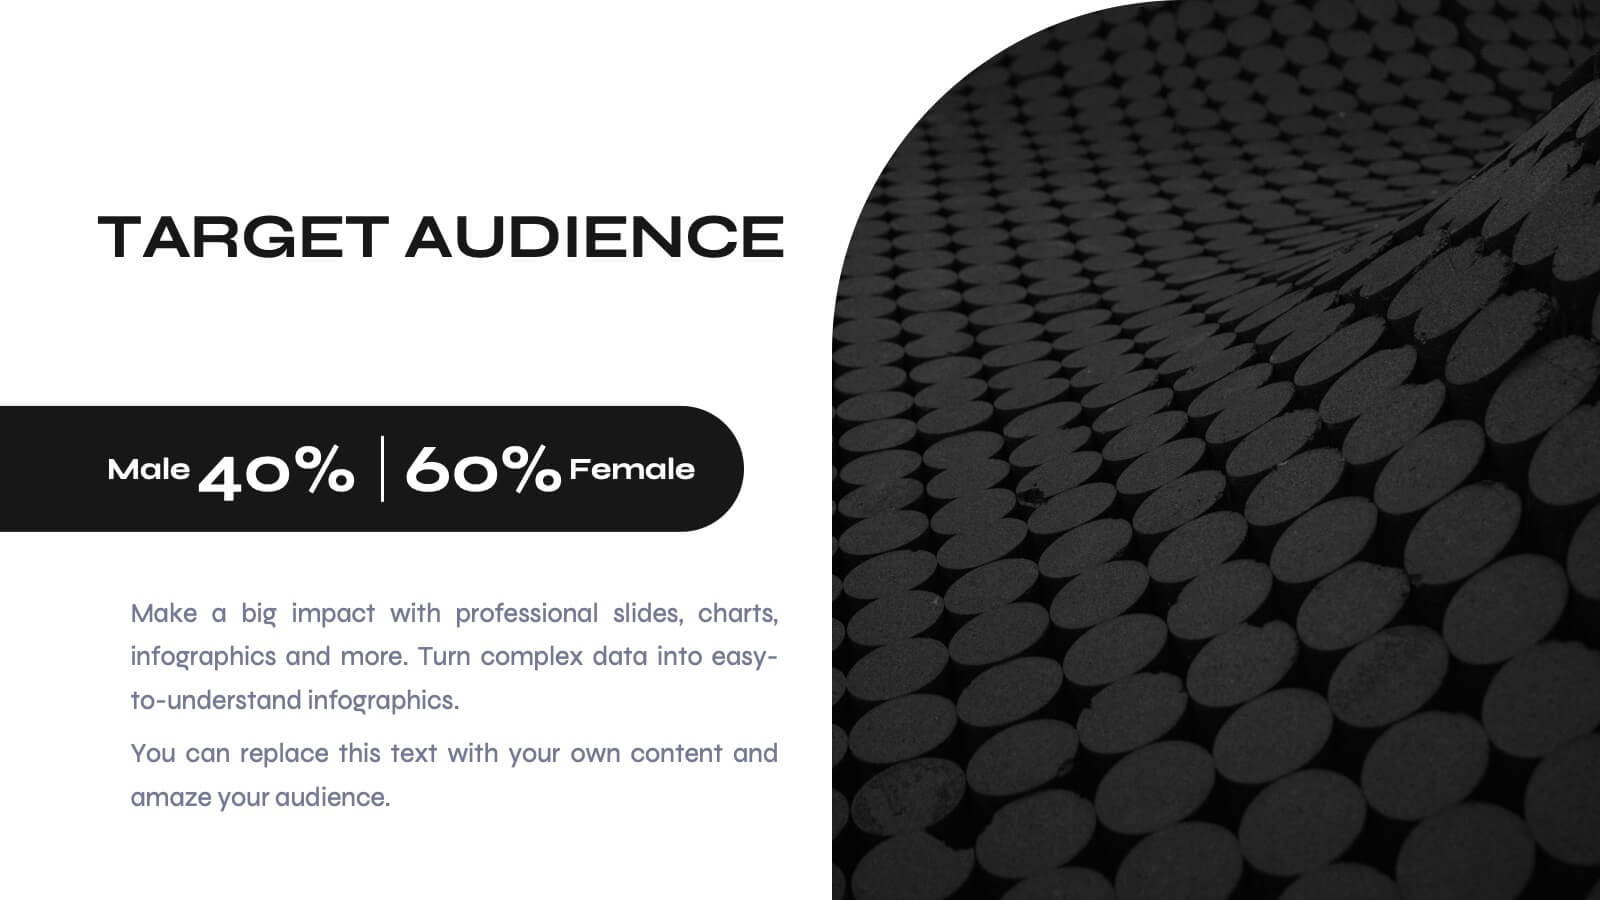
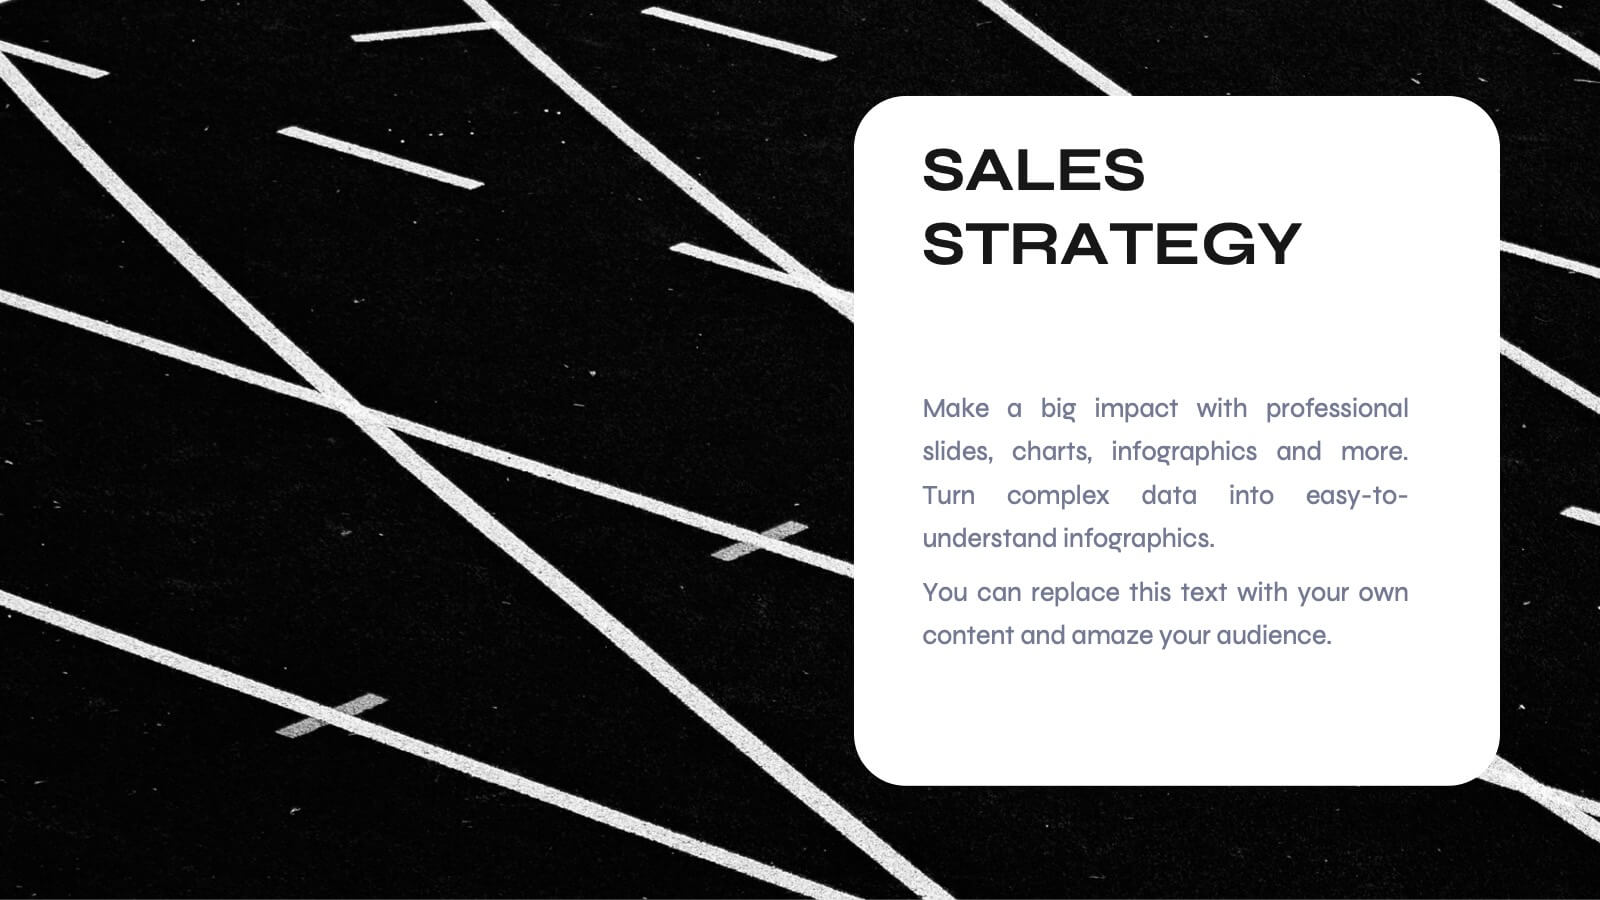
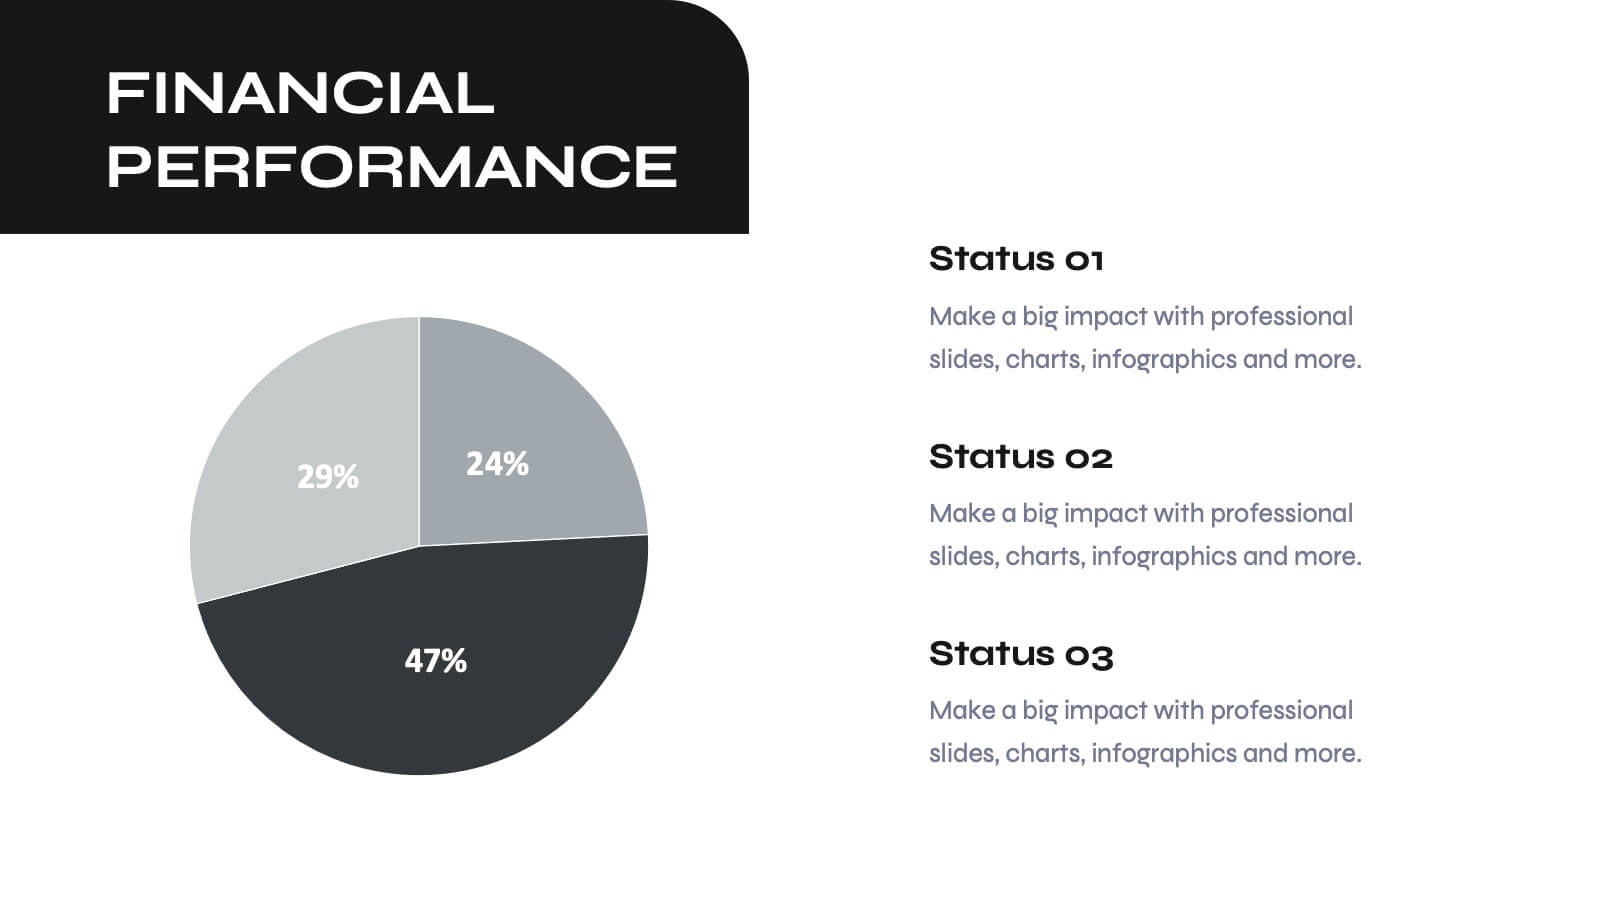
Odyssey Small Business Pitch Deck Presentation
Elevate your business pitch with this sleek, monochrome presentation template. Perfect for presenting company backgrounds, market opportunities, and financial performance, it features a minimalist design that enhances clarity and impact. Highlight your value proposition and strategic plans to captivate investors. Compatible with PowerPoint, Keynote, and Google Slides, it ensures seamless presentations on any platform.


5 diapositivas
Performance Scaling Overview Presentation
Illustrate performance development with this sleek layered pyramid chart. Designed to visualize growth stages, team levels, or scaling strategies, each tier includes editable text and icons for clarity. Ideal for business reviews, capability mapping, or operational planning. Fully customizable in PowerPoint, Keynote, and Google Slides for effortless updates.


5 diapositivas
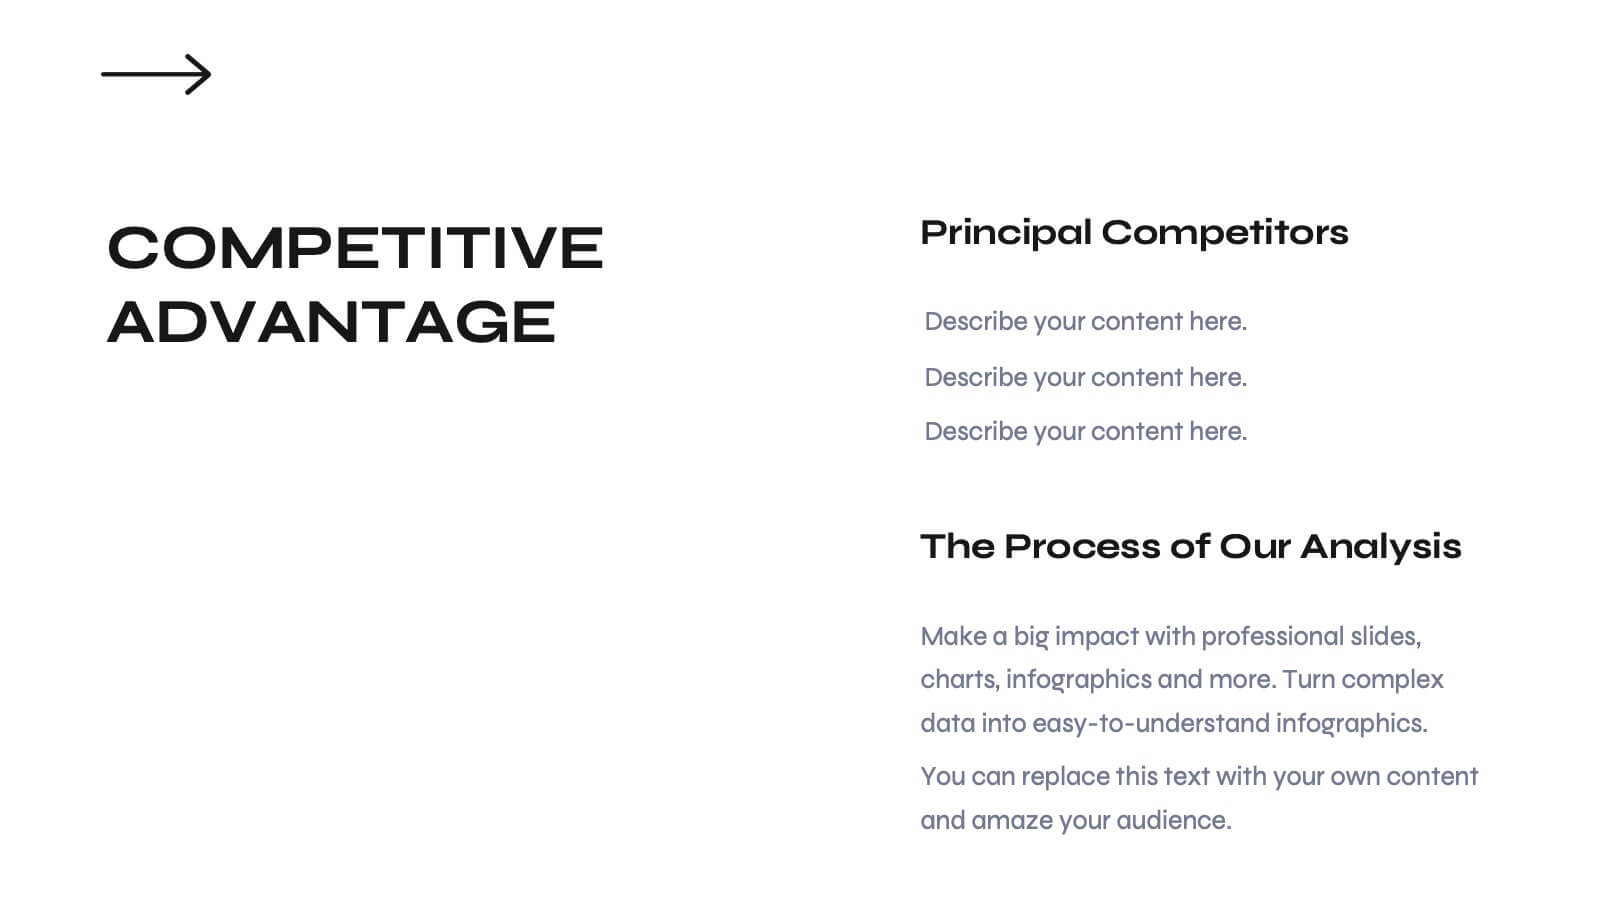
Business Gap Identification Presentation
Identify key performance gaps from point A to B with this step-based visualization. Each arch-shaped column represents a stage in the improvement process. Use it to highlight capability gaps, missed opportunities, or strategy breakdowns. Fully editable and compatible with PowerPoint, Keynote, and Google Slides—ideal for consulting, planning, and reporting.


6 diapositivas
Strategic Task and To-Do List Slide Presentation
Keep your team aligned and on track with the Strategic Task and To-Do List Slide Presentation. This layout is ideal for showcasing action items, project priorities, and status updates using a visual notepad style. Color-coded sections and checkmark indicators make it easy to communicate task progress. Fully customizable in PowerPoint, Keynote, and Google Slides.


2 diapositivas
Creative Gratitude Slide Presentation
Express gratitude in style with this creative thank-you slide template! Featuring bold typography and modern geometric elements, this design adds a unique touch to your presentations. Ideal for business pitches, creative projects, and professional meetings. Fully customizable and compatible with PowerPoint, Keynote, and Google Slides for effortless personalization.


20 diapositivas
Elementra Marketing Proposal Presentation
Elevate your marketing initiatives with this professional and well-structured proposal template. Covering essential sections such as objectives, goals, budget breakdown, timeline, and pricing structure, this presentation helps you effectively communicate your strategy to stakeholders and clients. Its clean, modern design ensures clarity and engagement, making it ideal for pitching ideas and securing approvals. Fully customizable and compatible with PowerPoint, Keynote, and Google Slides.


5 diapositivas
Real Estate Investing Infographics
Real estate investing refers to the purchase, ownership, management, rental, or sale of real estate properties with the objective of generating income and/or capital appreciation. These infographic templates can be used to provide key information and insights about real estate investing. These are designed to educate individuals about the basics of real estate investing, its benefits, and important considerations to help them make informed investment decisions. These infographics are great for anyone seeking to understand the basics of real estate. Compatible with Powerpoint, Keynote, and Google Slides.


5 diapositivas
Multi-Layer Concentric Diagram Presentation
Make a splash with your ideas using this layered ripple-style layout! Perfect for visualizing cascading strategies, phased impacts, or multi-tiered processes, this multi-layer concentric diagram turns complex data into clean, memorable visuals. Fully compatible with PowerPoint, Keynote, and Google Slides, it’s ready to elevate your next presentation.


5 diapositivas
Signs of Diabetes Infographics
There are several common signs and symptoms of diabetes that may indicate the presence of the condition. It's important to note that the symptoms can vary depending on the type of diabetes (Type 1 or Type 2) and individual differences. These infographic templates are informative tools made to help educate individuals about the signs and symptoms of diabetes. These are designed to raise awareness about diabetes, its early warning signs, and the importance of early detection and management. These infographic templates can be effective tools for health professionals, educators, and individuals seeking to understand the signs and symptoms of diabetes.


5 diapositivas
Building Strong Business Relationships
Create lasting partnerships with this structured business relationship infographic. Ideal for outlining trust-building strategies, collaboration frameworks, and stakeholder engagement plans. Fully editable in PowerPoint, Keynote, and Google Slides, making it simple to align the design with your company’s branding and professional goals.


4 diapositivas
AIDA Marketing Model Presentation
Optimize your marketing strategy with this AIDA Marketing Model Presentation template. Featuring a visually appealing funnel diagram, this template clearly outlines the Attention, Interest, Desire, and Action stages of customer engagement. Ideal for marketers, sales professionals, and business analysts. Fully customizable and compatible with PowerPoint, Keynote, and Google Slides.


6 diapositivas
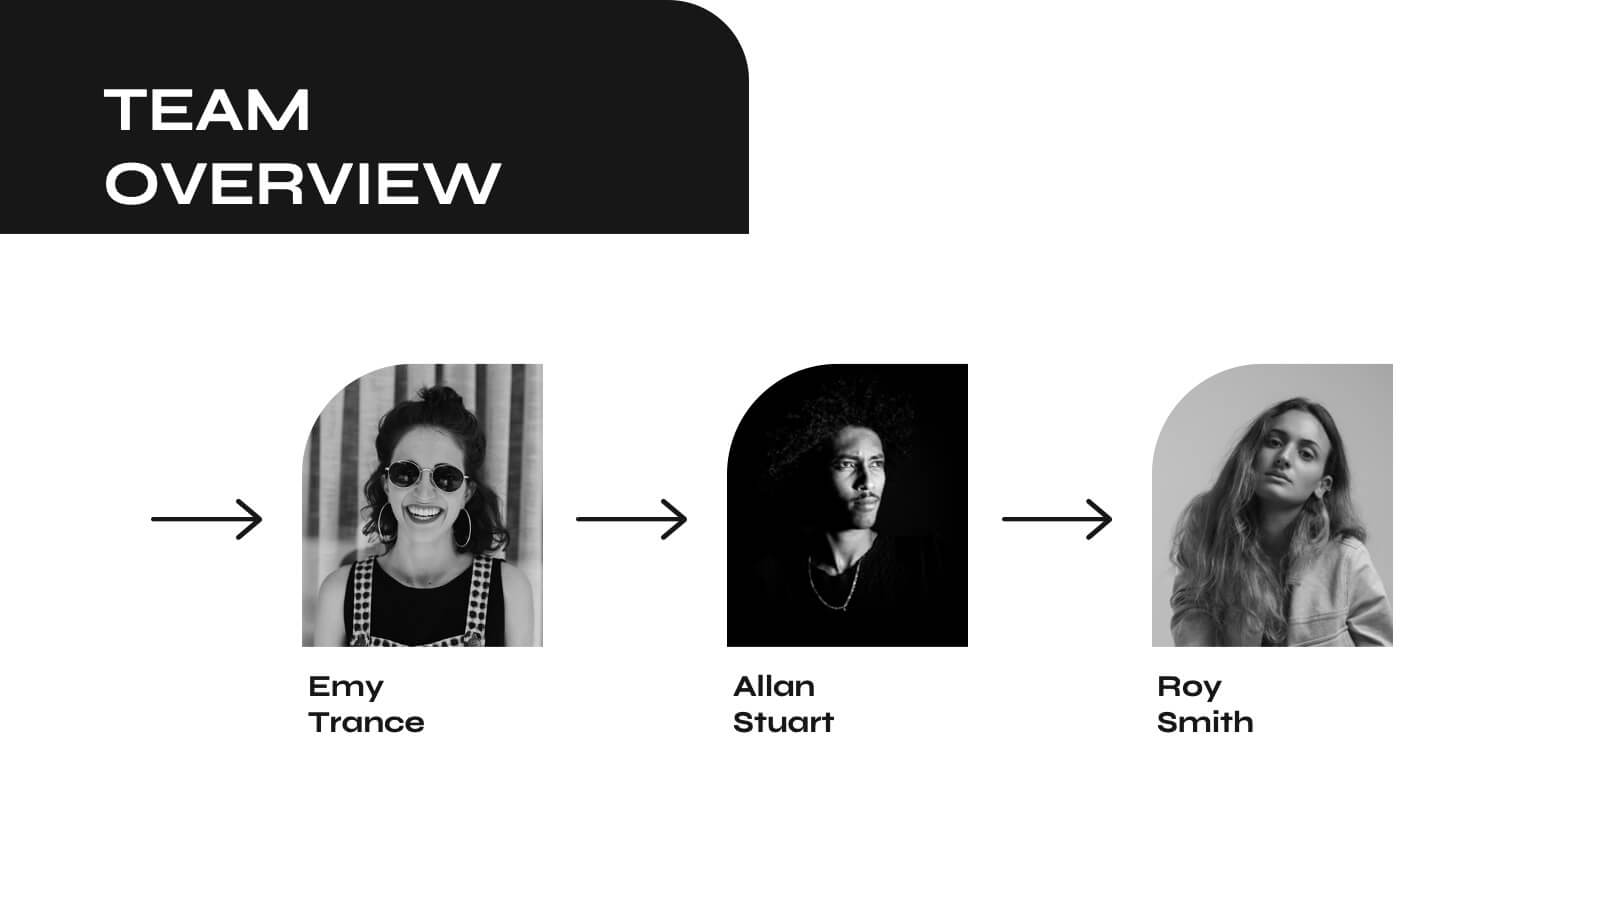
Leadership and Business Teamwork Presentation
Drive results through synergy with this dynamic Leadership and Business Teamwork presentation slide. Designed with a six-part segmented pie chart, this layout helps visualize collaborative frameworks, team roles, or leadership models in an engaging way. Ideal for team workshops, leadership development, or strategic planning meetings. Easy to personalize in PowerPoint, Keynote, or Google Slides.


4 diapositivas
Lead Funnel and Engagement Model Presentation
Visualize your marketing journey from awareness to action with the Lead Funnel and Engagement Model Presentation. This clean and modern funnel layout uses bold, color-coded segments to represent each stage—perfect for illustrating how leads progress from discovery to conversion. Ideal for marketing strategists, sales teams, or campaign reporting, the template offers editable titles, icons, and text boxes to match your process. Compatible with PowerPoint, Keynote, and Google Slides, it’s designed for easy customization and polished delivery.