


Características


¿Tienes alguna pregunta?
Recomendar


4 diapositivas
Data Breach Prevention Planning Deck Presentation
Stop breaches before they start with this clean, visual data protection slide. Designed to help teams outline risks, access controls, and mitigation steps, this template makes complex security workflows easy to present. A great fit for compliance reviews or cybersecurity briefings. Compatible with PowerPoint, Keynote, and Google Slides.


5 diapositivas
Topic Organization with Bubble Mapping Presentation
Easily structure complex information with the Topic Organization with Bubble Mapping Presentation. This visually engaging layout uses a central idea with grouped supporting elements, making it perfect for brainstorming, mind mapping, or topic clustering. Fully editable in PowerPoint, Keynote, or Google Slides—ideal for educators, strategists, and project teams.


6 diapositivas
Market Sizing with TAM SAM SOM Strategy Presentation
Clearly define your market opportunity using the Market Sizing with TAM SAM SOM Strategy Presentation. This template breaks down Total Addressable Market, Serviceable Available Market, and Serviceable Obtainable Market with a visual bullseye format that’s intuitive and persuasive. Easily editable in PowerPoint, Keynote, and Google Slides.


23 diapositivas
Stormrider Business Plan Presentation
This Business Presentation Template is designed to help you deliver structured and professional content for conferences, meetings, and corporate events. Featuring key sections such as objectives, speaker introductions, panel discussions, and networking breaks, it ensures a smooth and engaging experience. Fully customizable and compatible with PowerPoint, Keynote, and Google Slides.


4 diapositivas
Legal Overview and Policy Summary Presentation
Present legal insights with clarity using the Legal Overview and Policy Summary Presentation. This scale-themed design is ideal for outlining compliance, governance, or internal policies. Each section is visually balanced to reflect fairness and structure. Fully editable for use in PowerPoint, Keynote, and Google Slides.


5 diapositivas
Brain Chemistry Infographics
Brain chemistry refers to the complex interplay of chemicals, also known as neurotransmitters, that are responsible for transmitting signals within the brain. These infographic templates are designed to illustrate the intricate workings of brain chemistry. They aim to explain complex concepts in a clear and engaging way, making it suitable for educational settings, psychology courses, neuroscience presentations, or any context where understanding brain chemistry is essential. These templates set the foundation for exploring various aspects of brain chemistry. Colorful illustrations and icons help visualize the neurotransmitters and their impact.


22 diapositivas
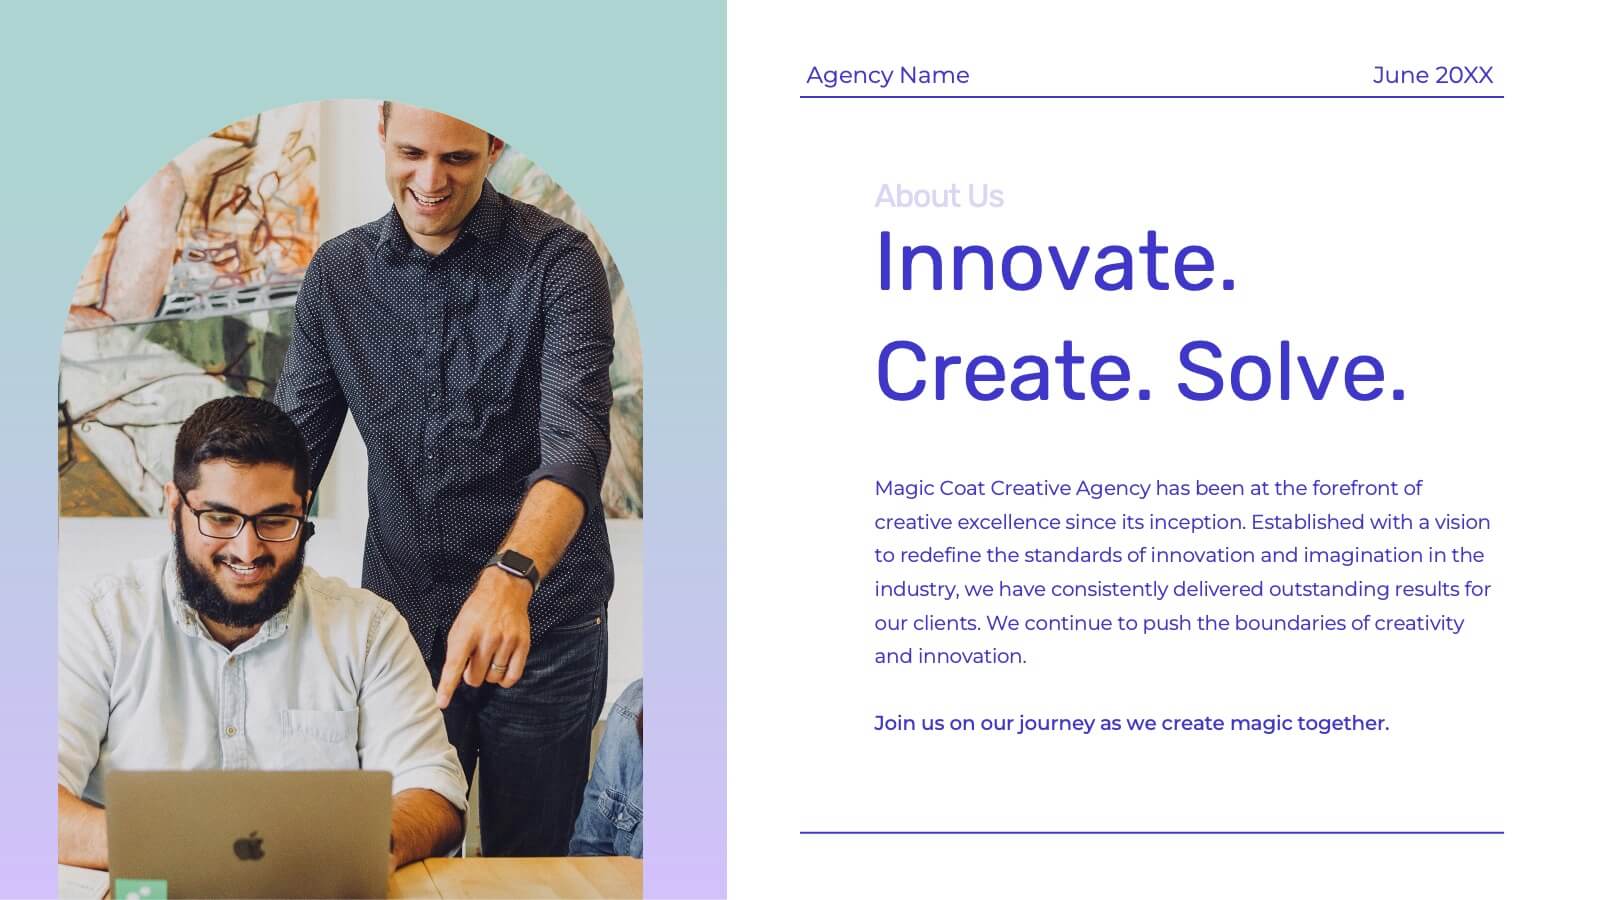
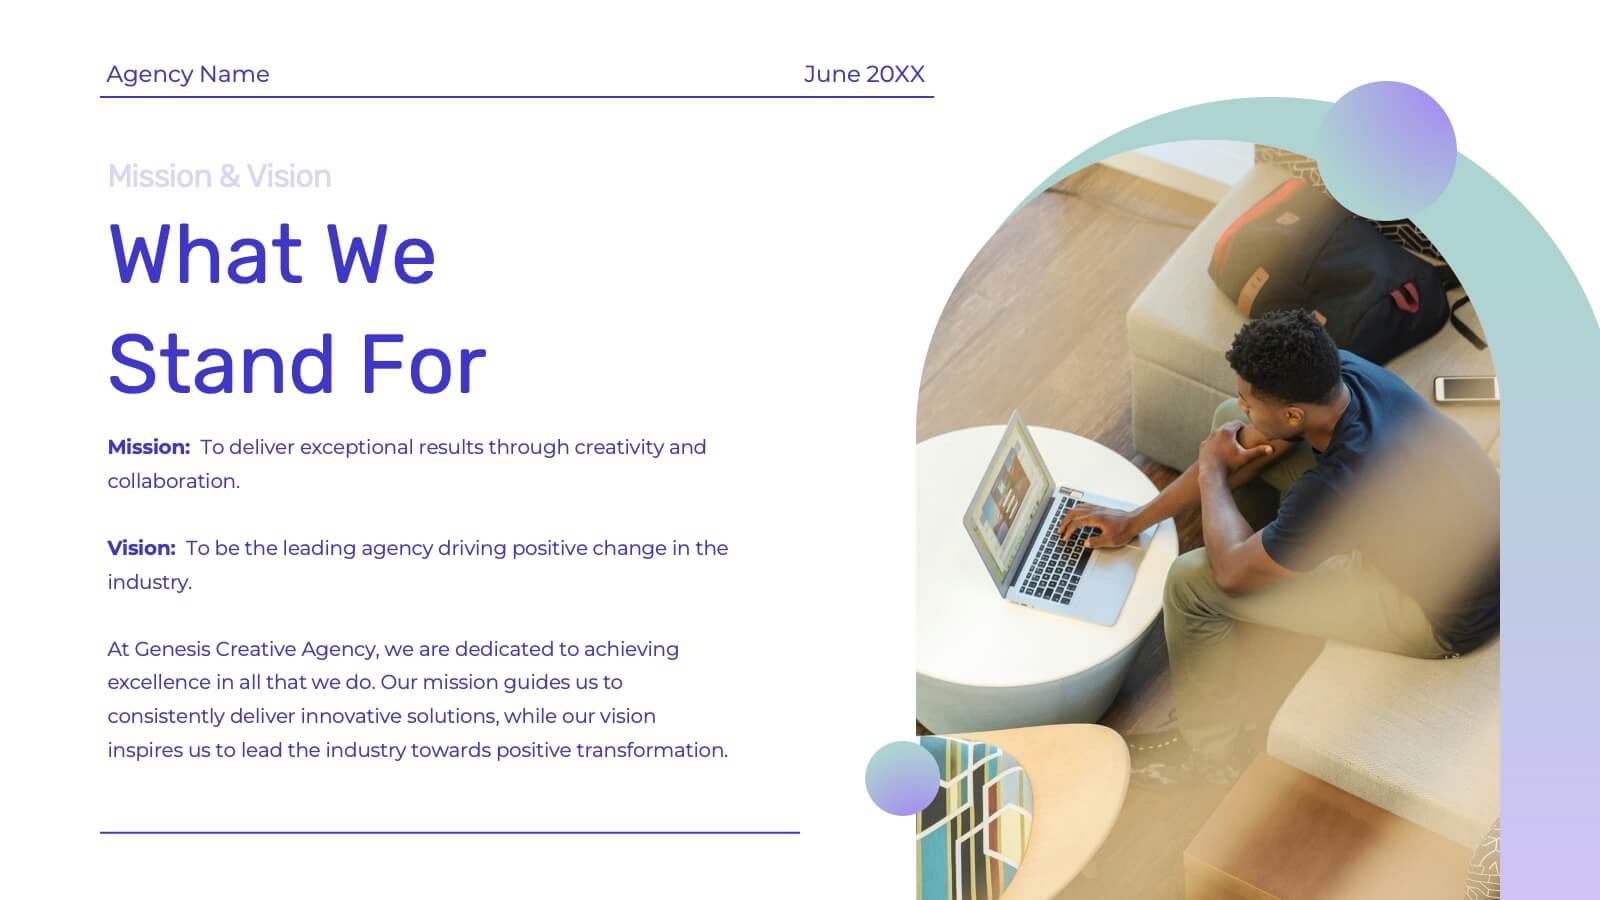
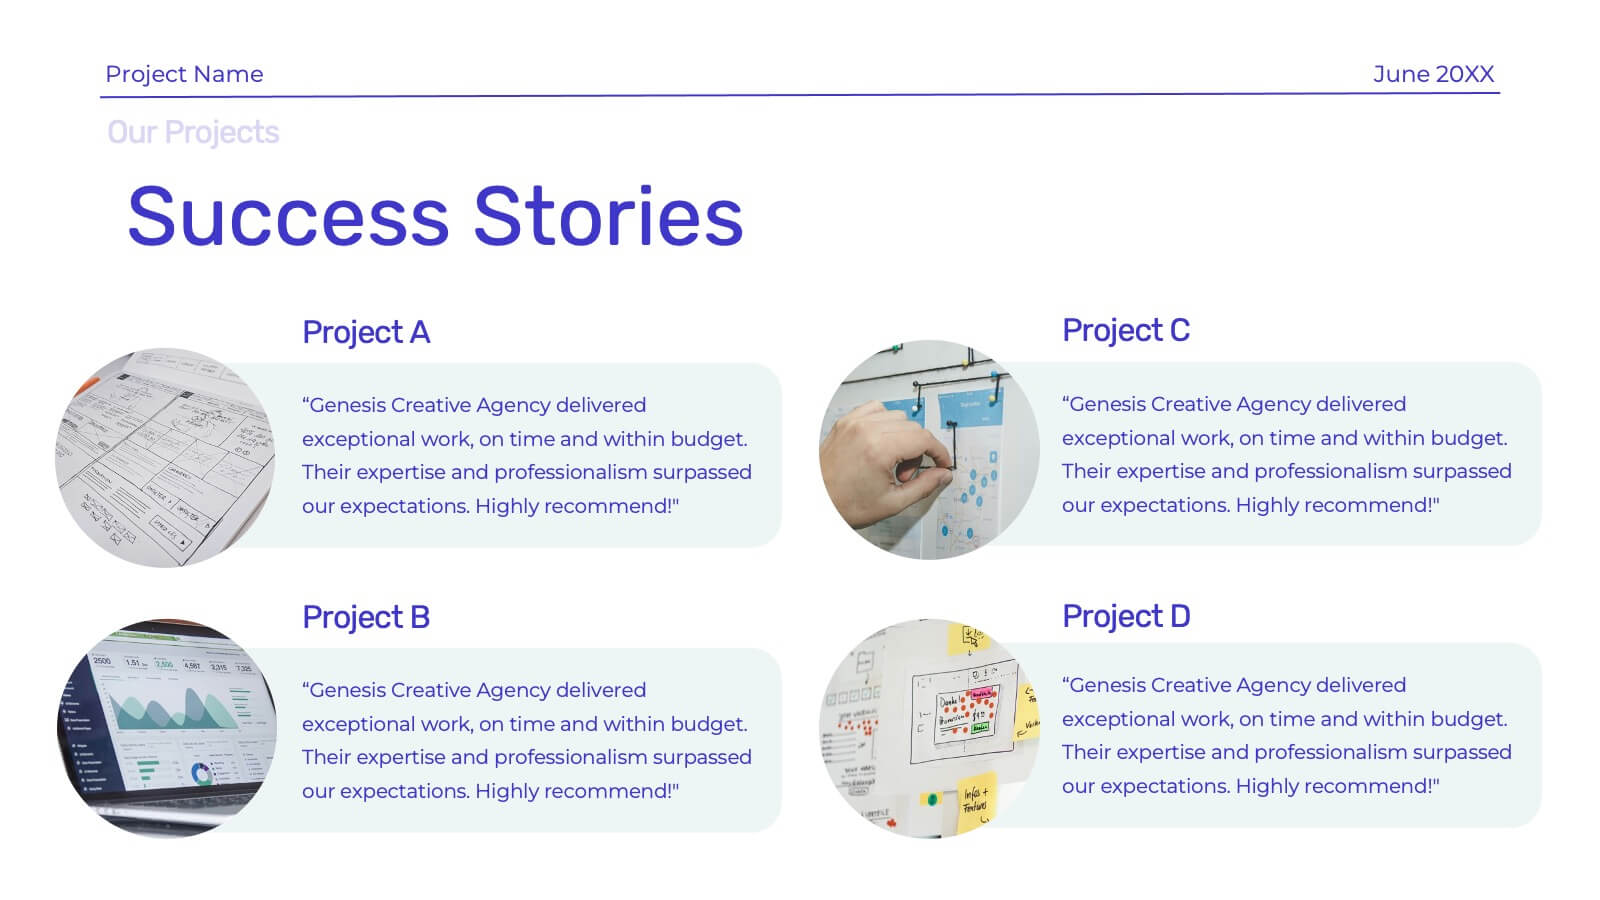
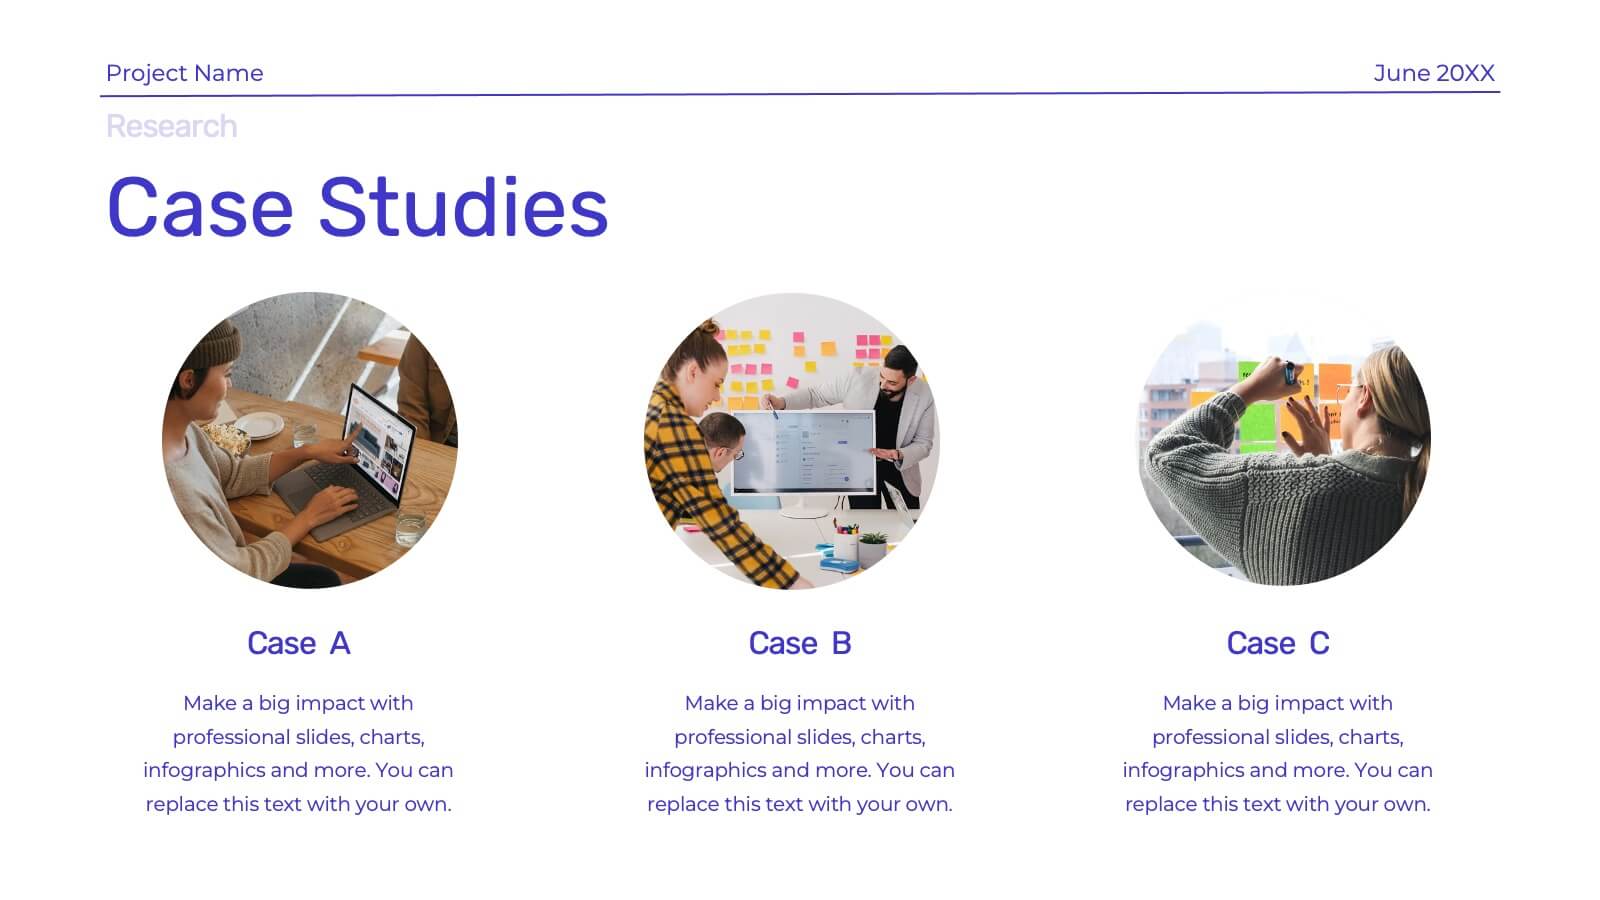
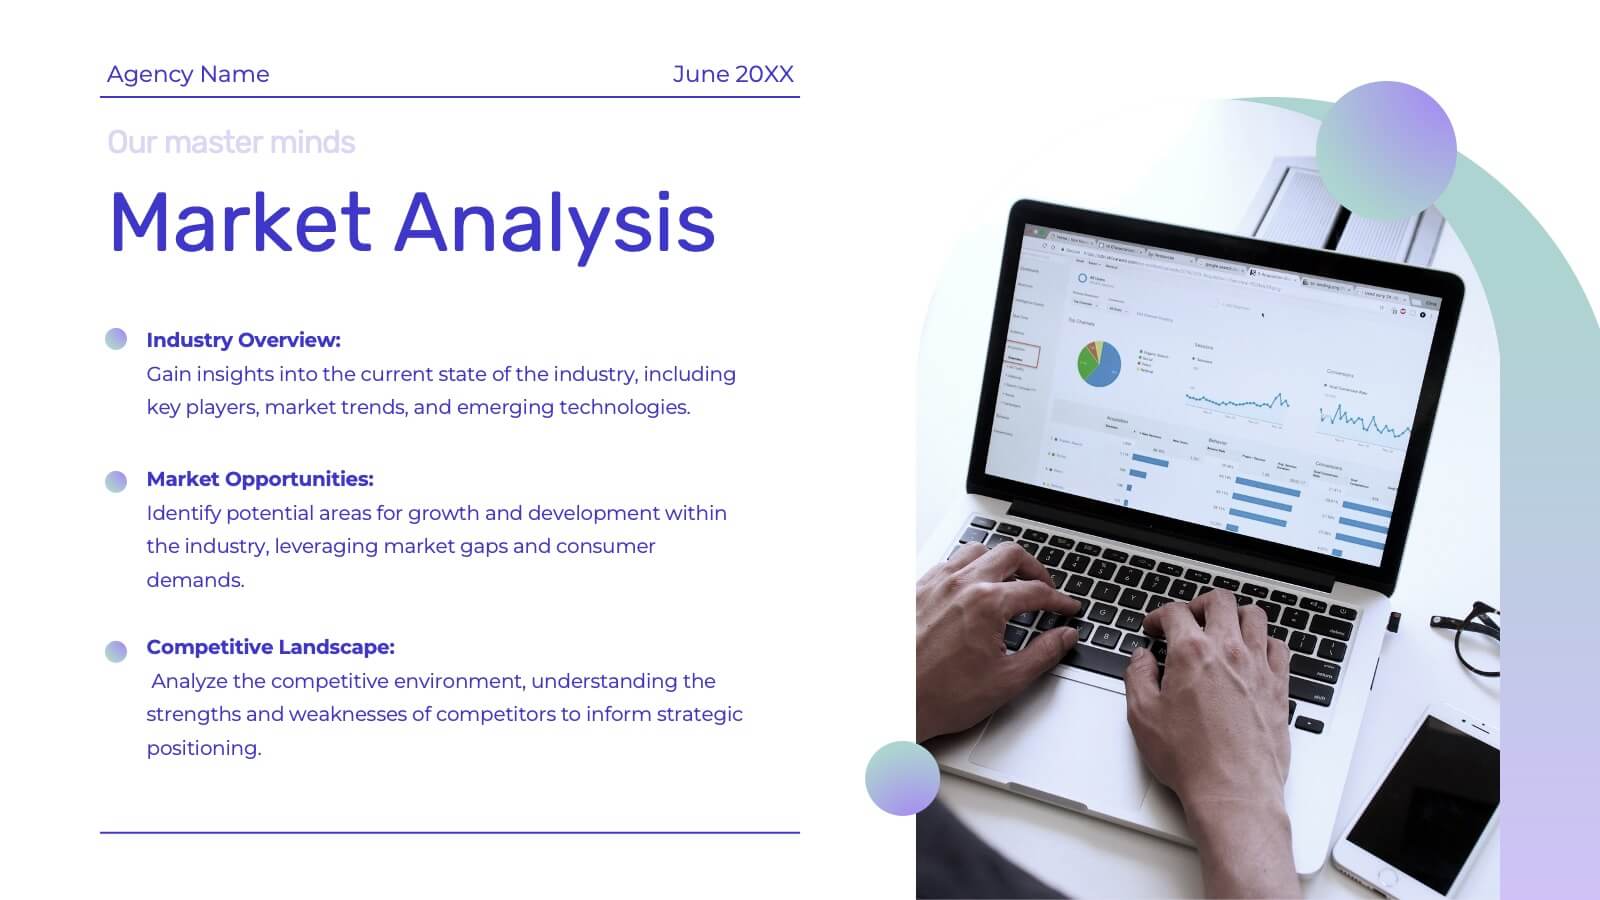
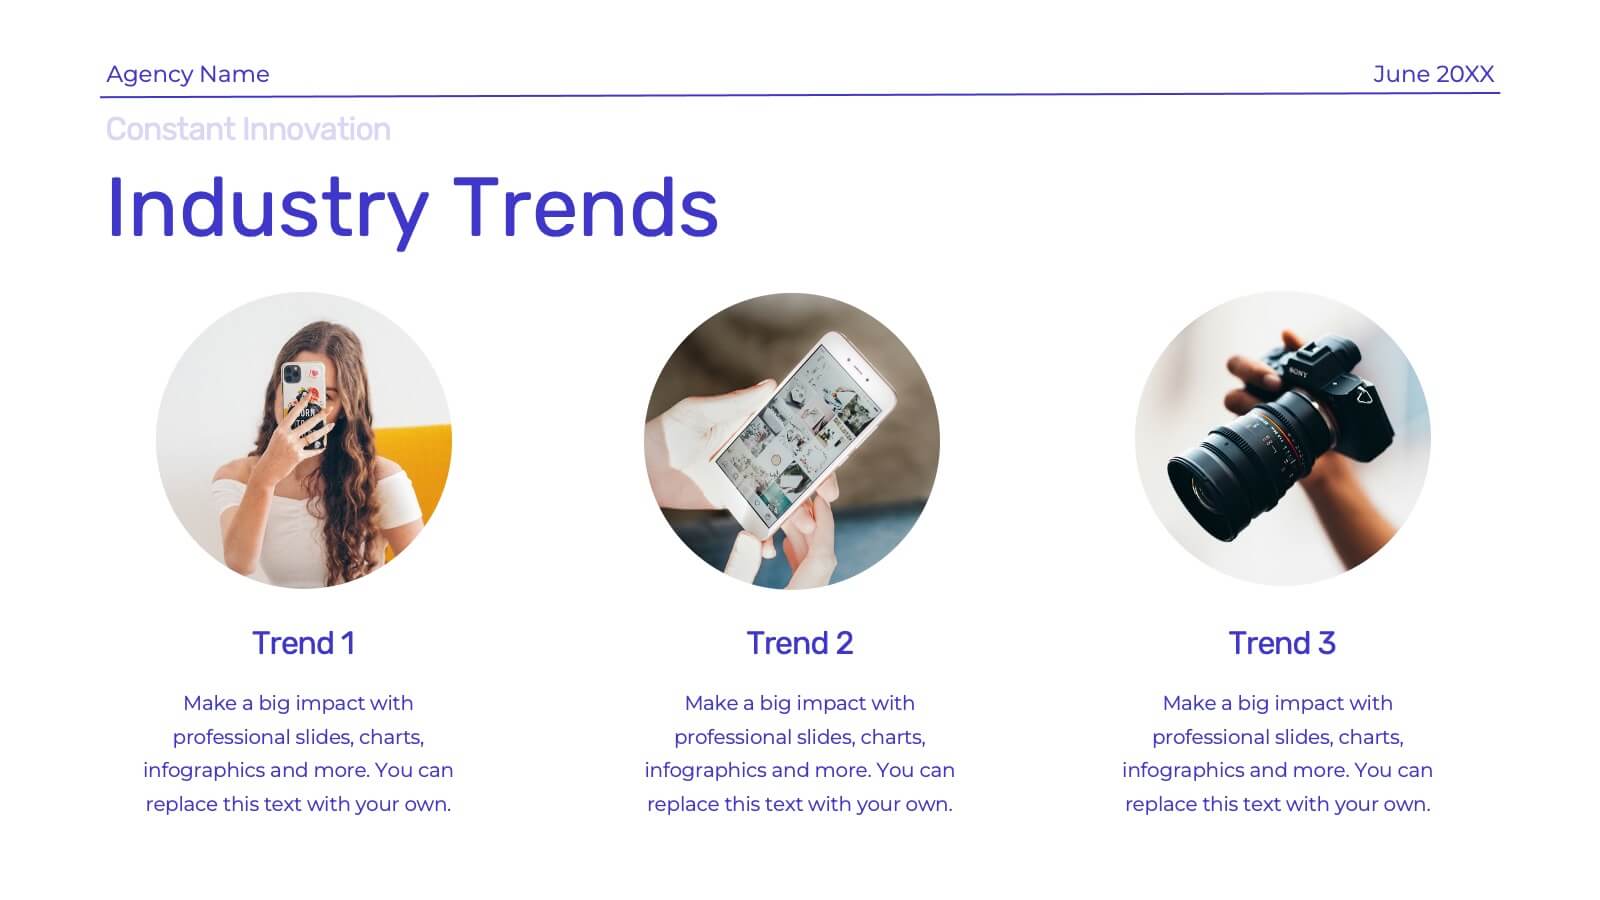
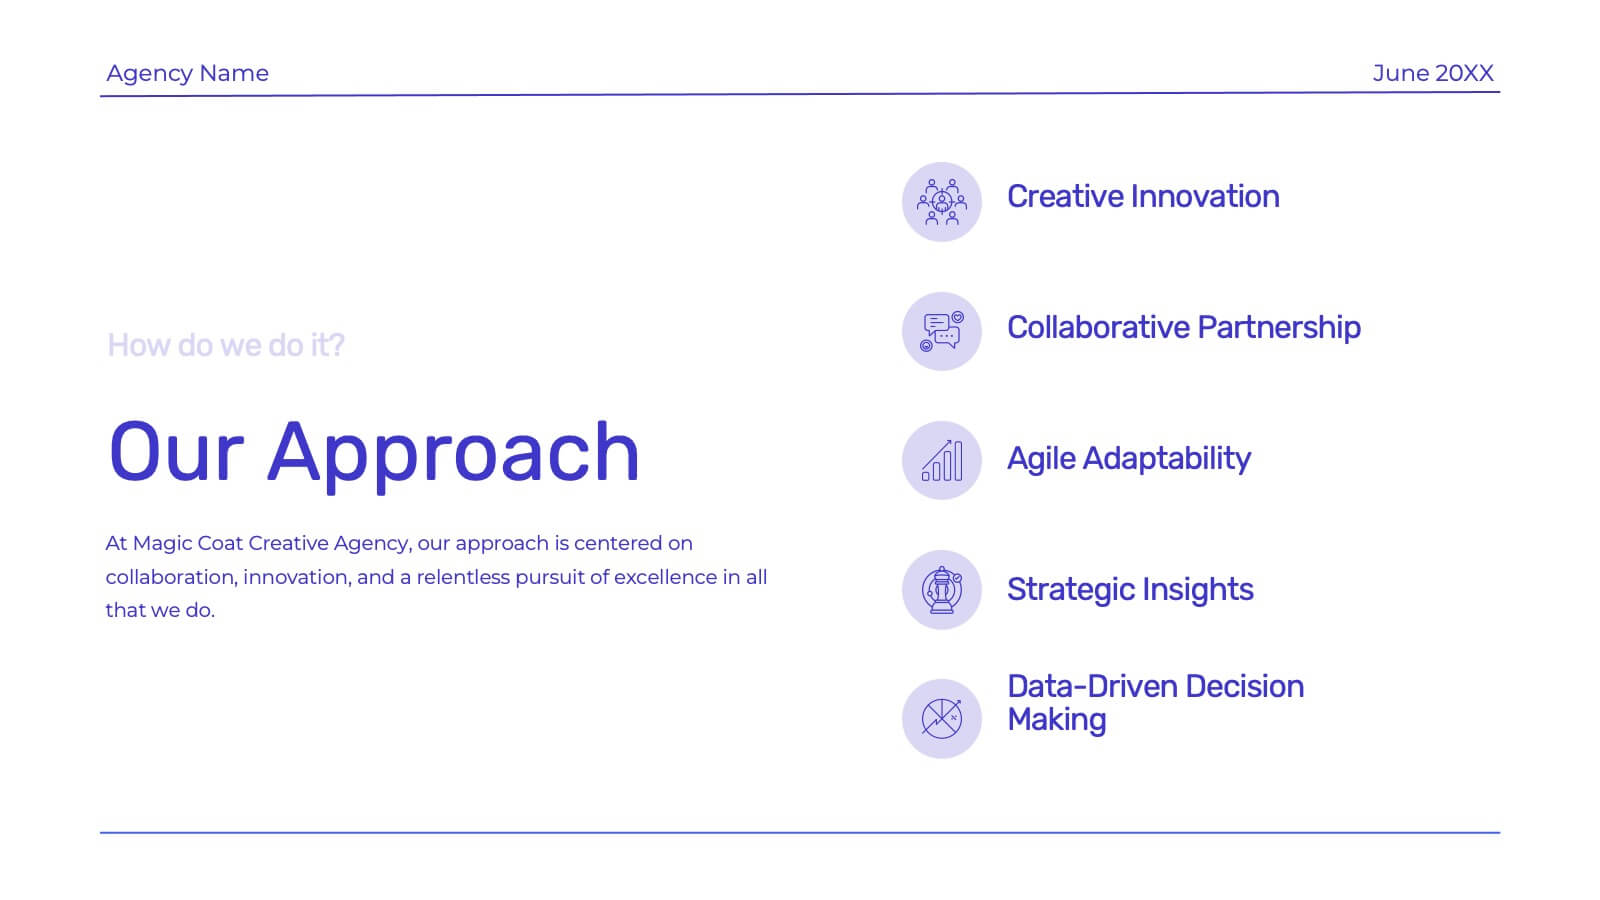
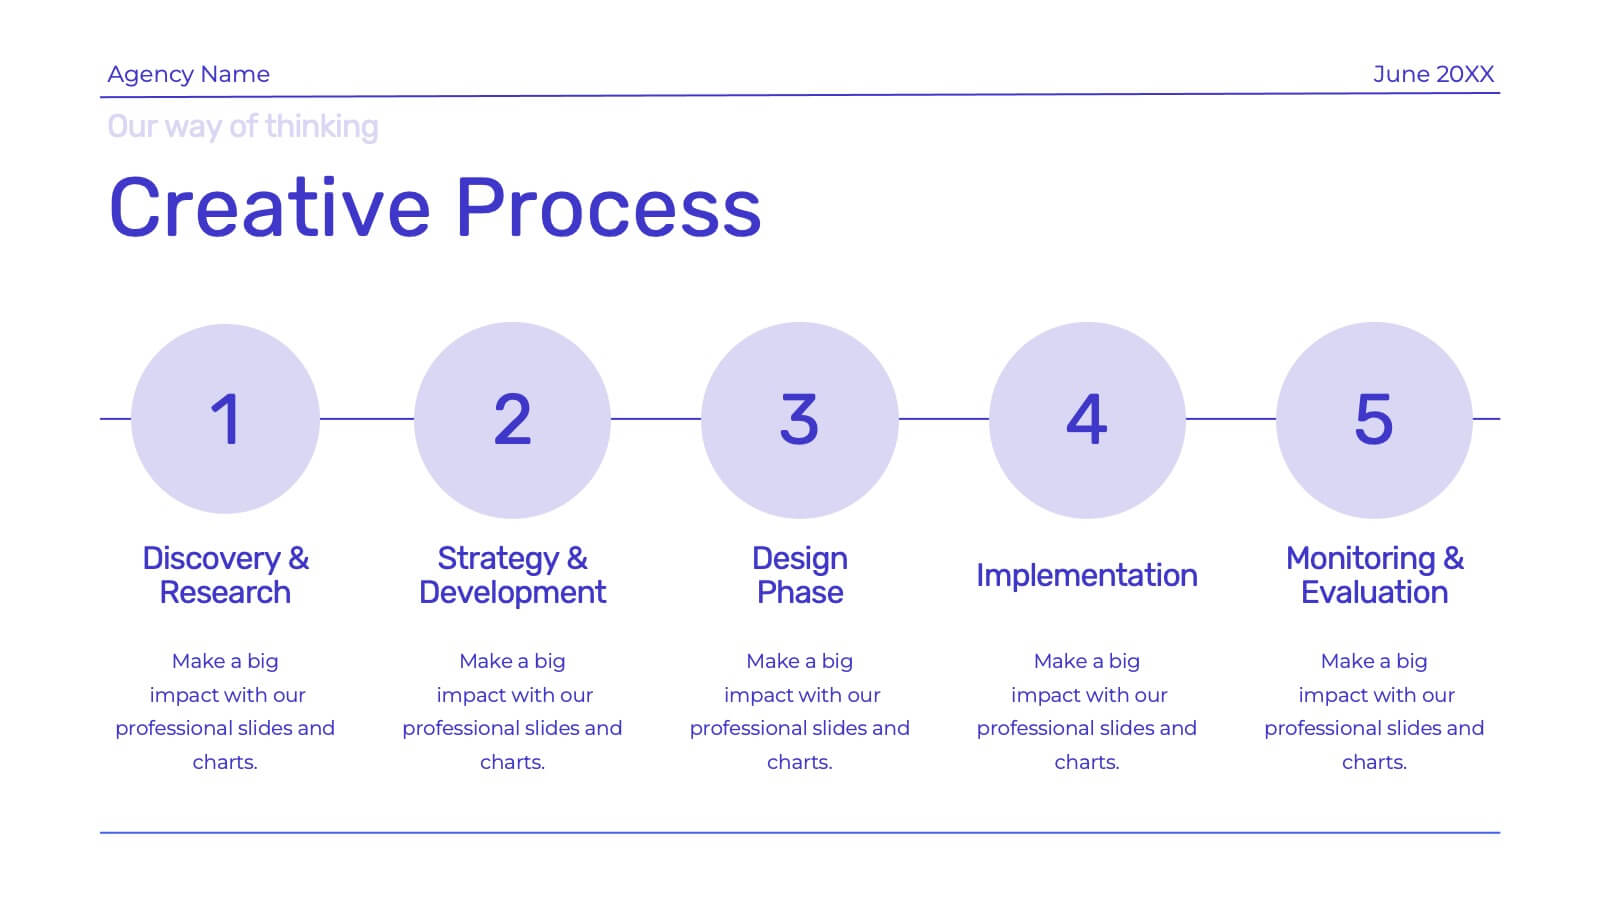
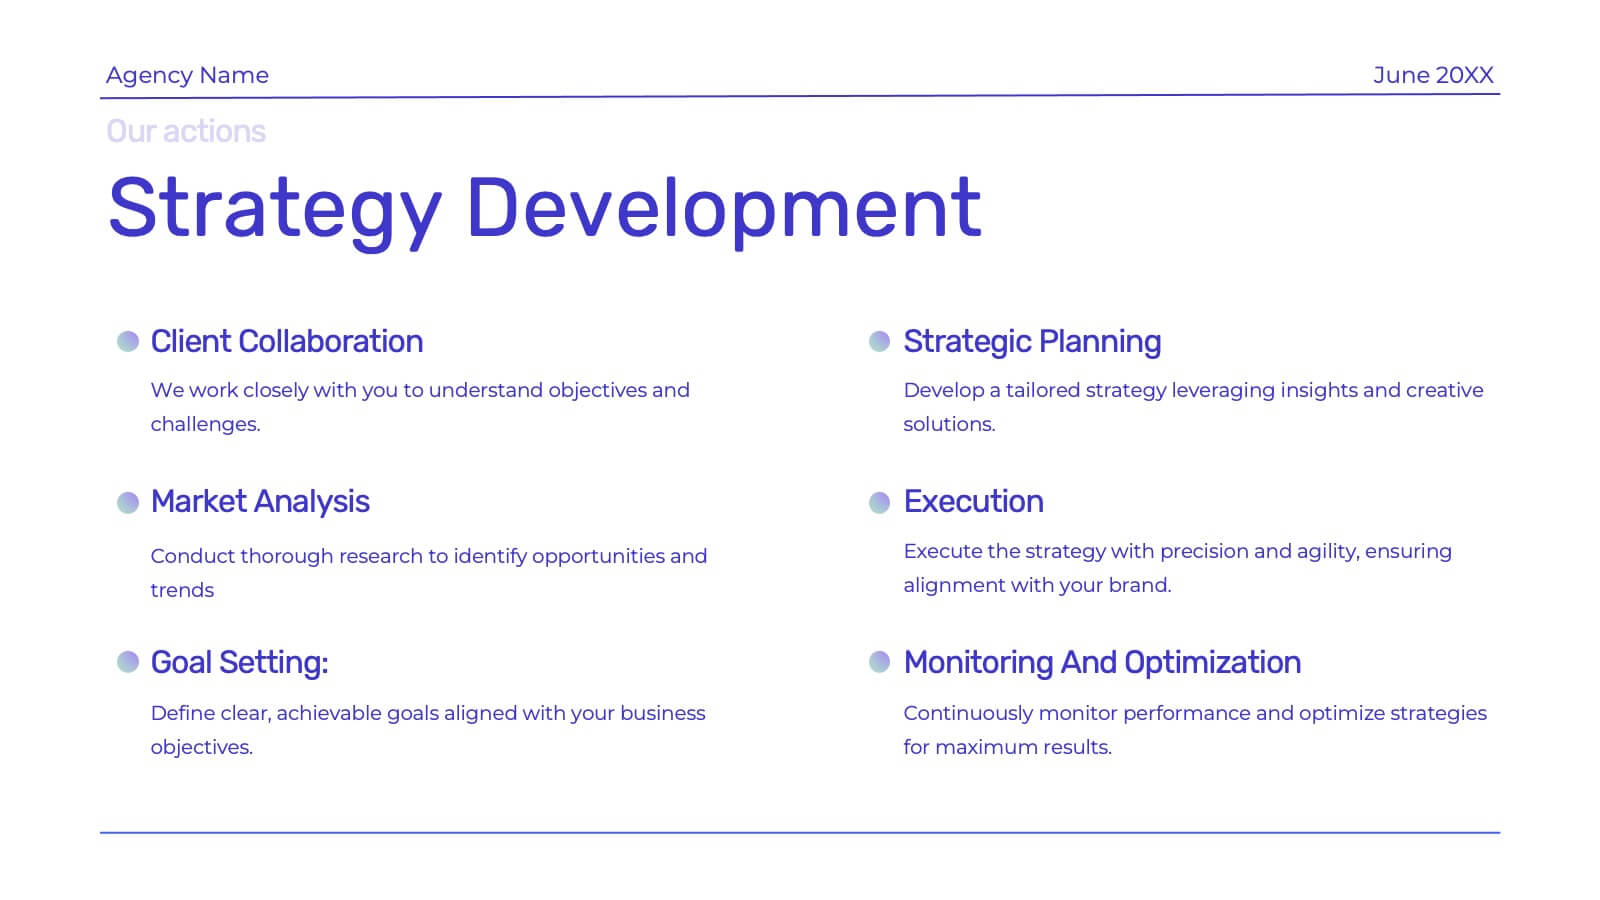
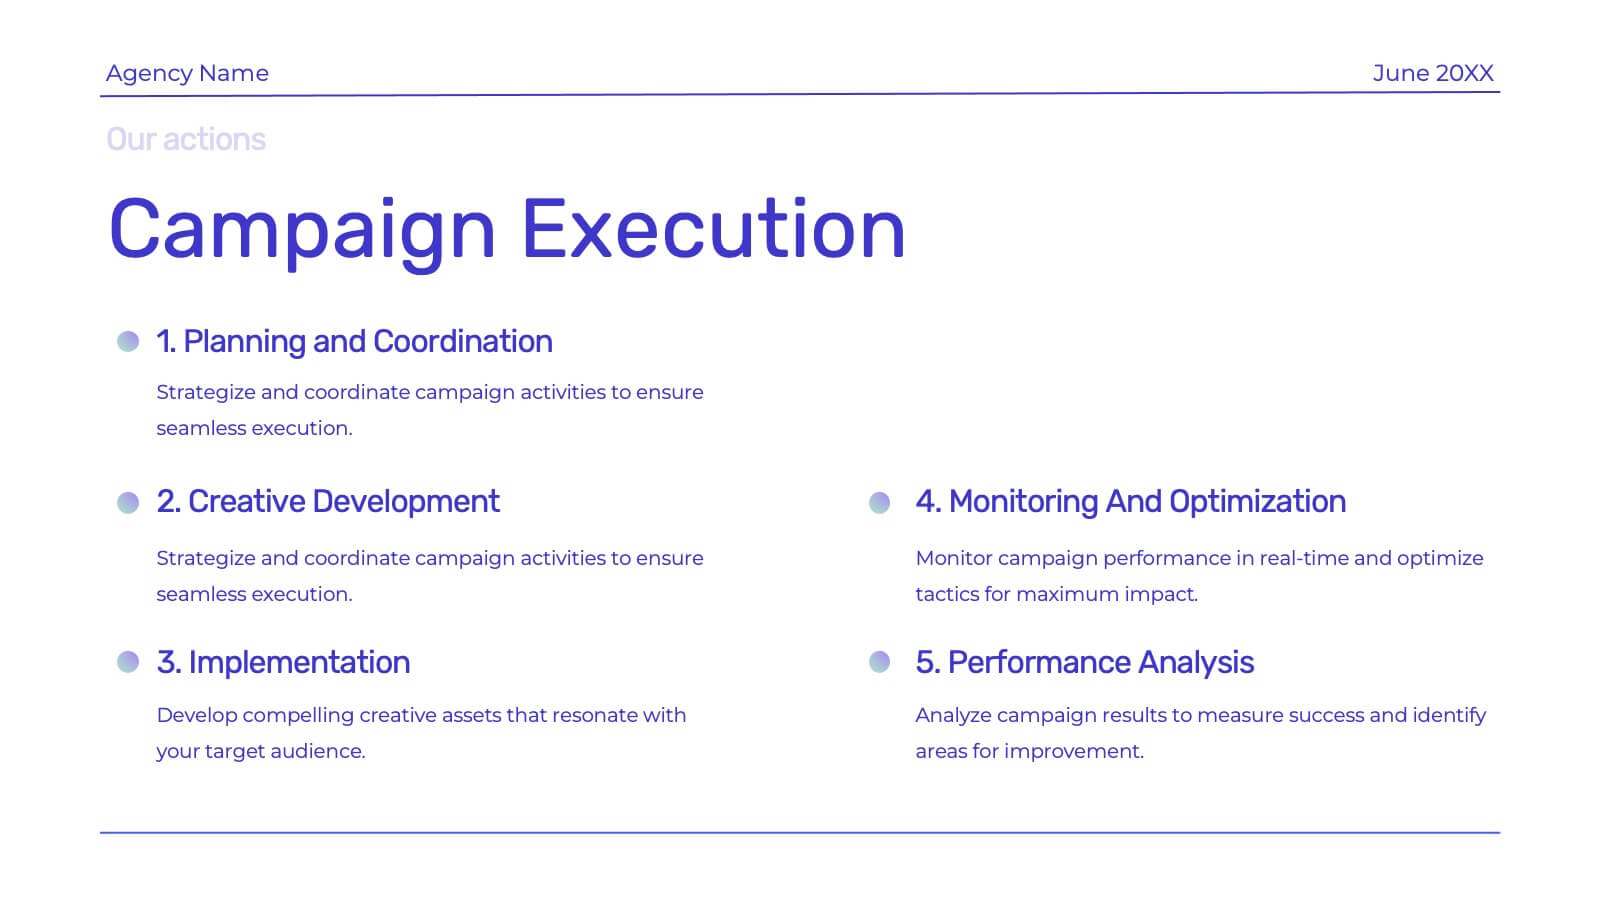
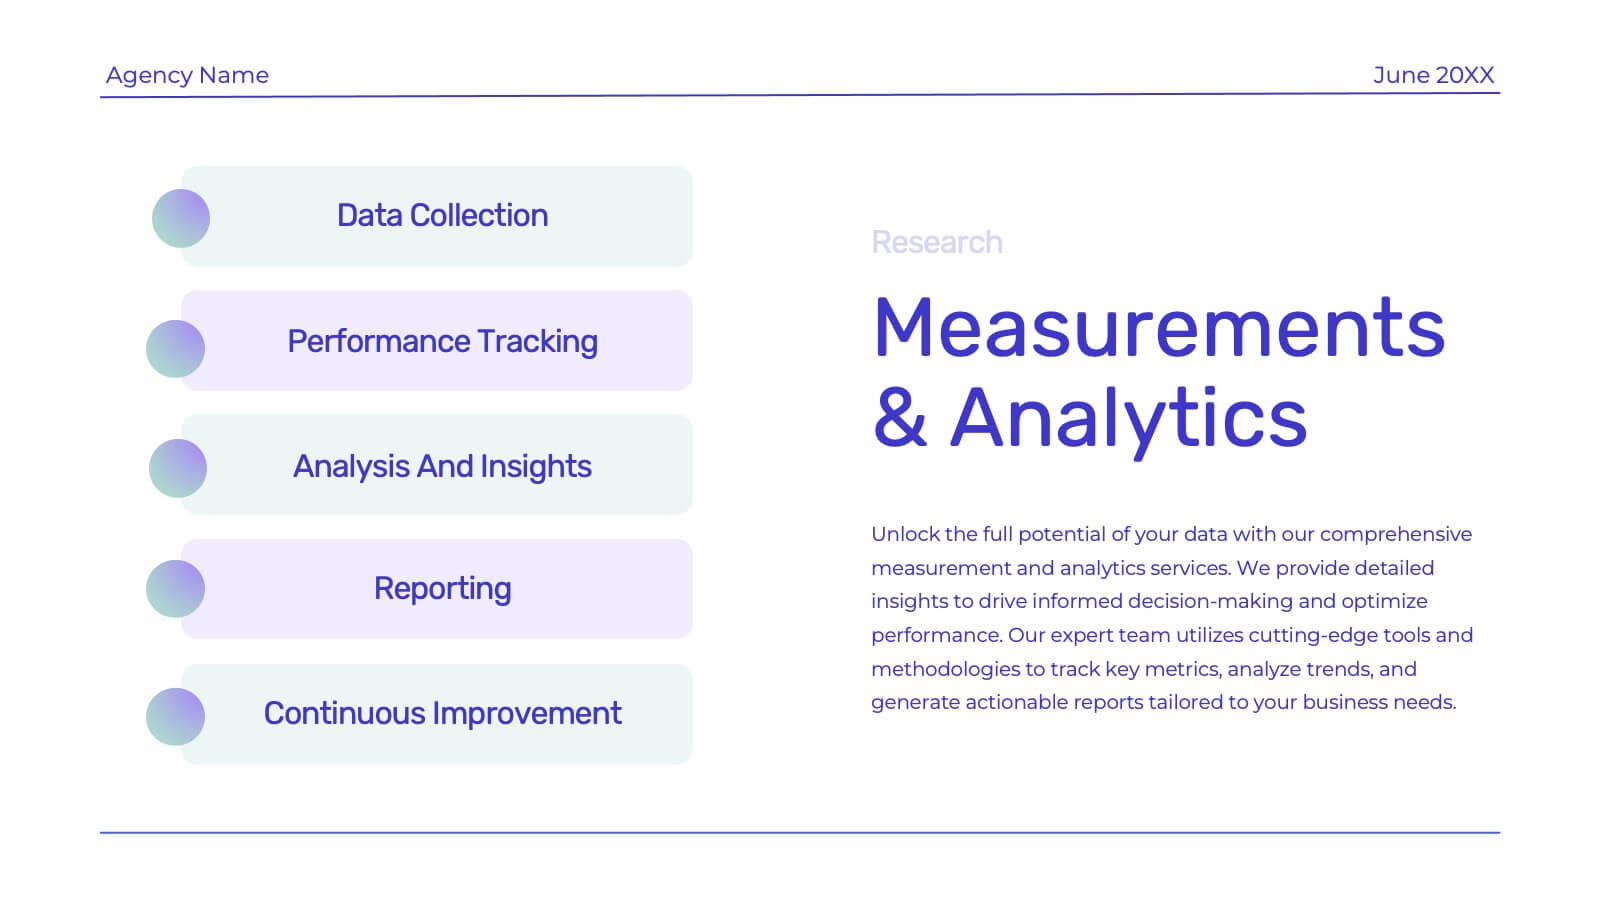
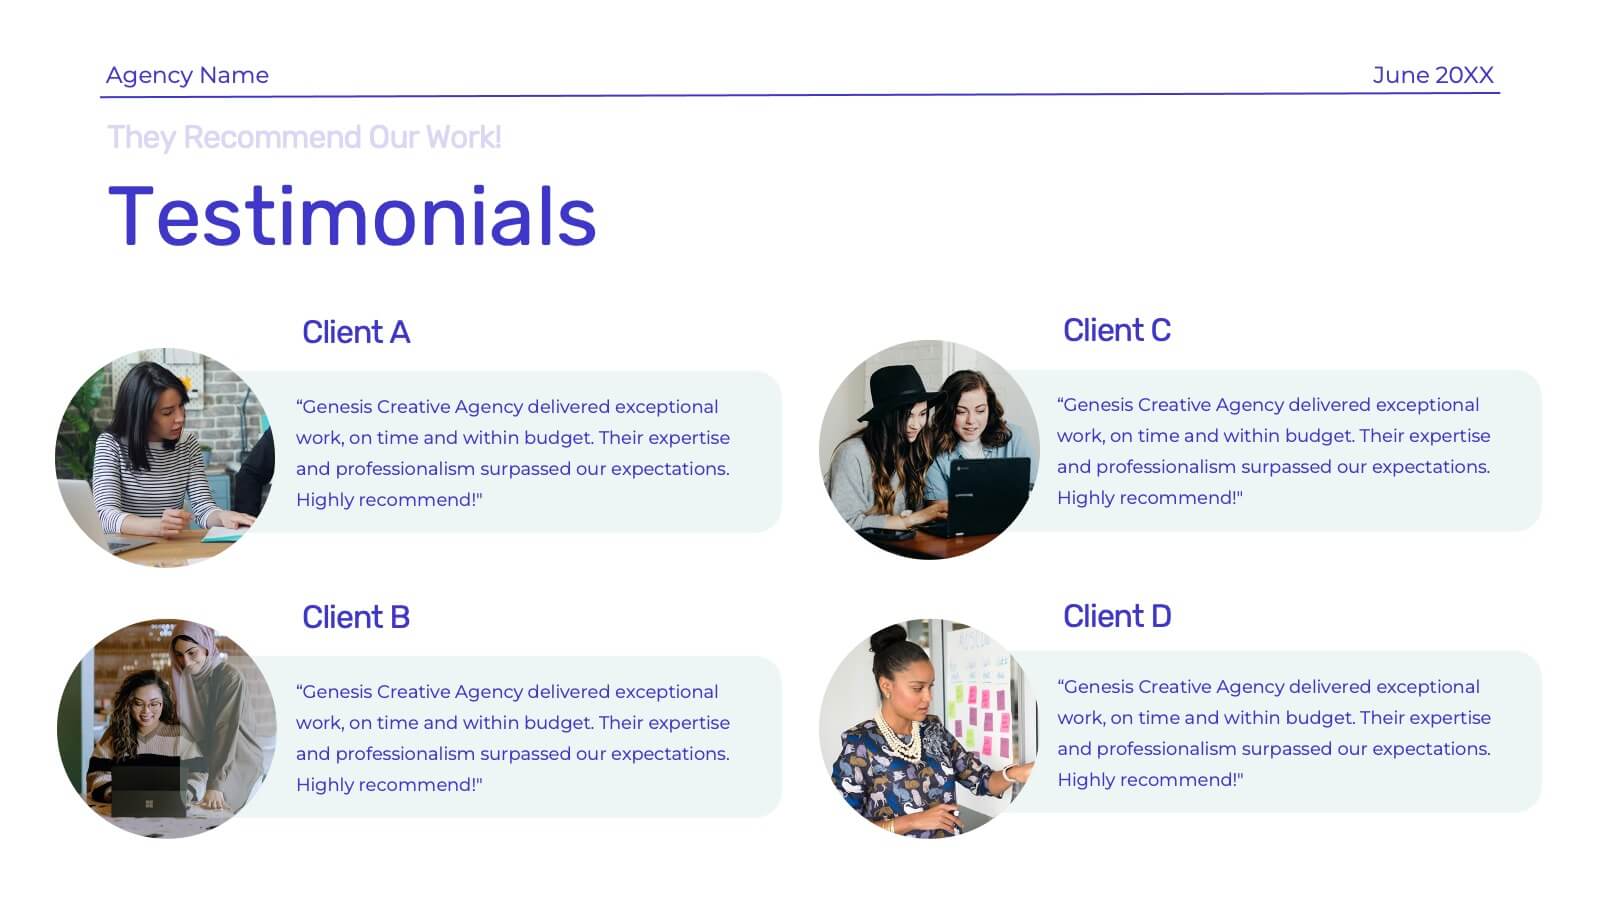
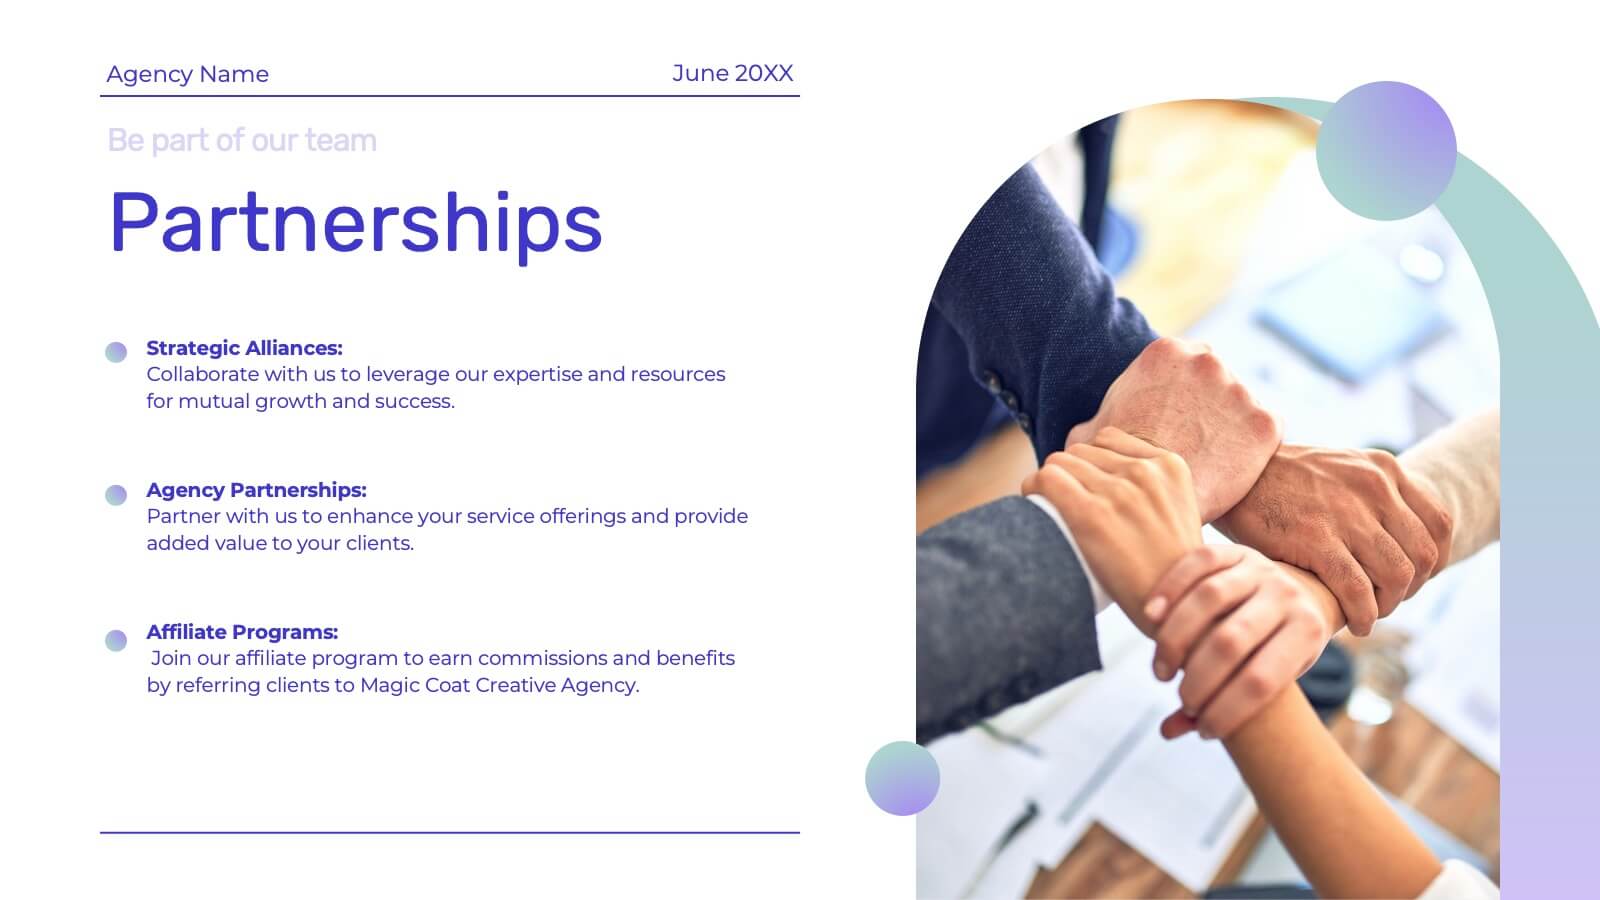
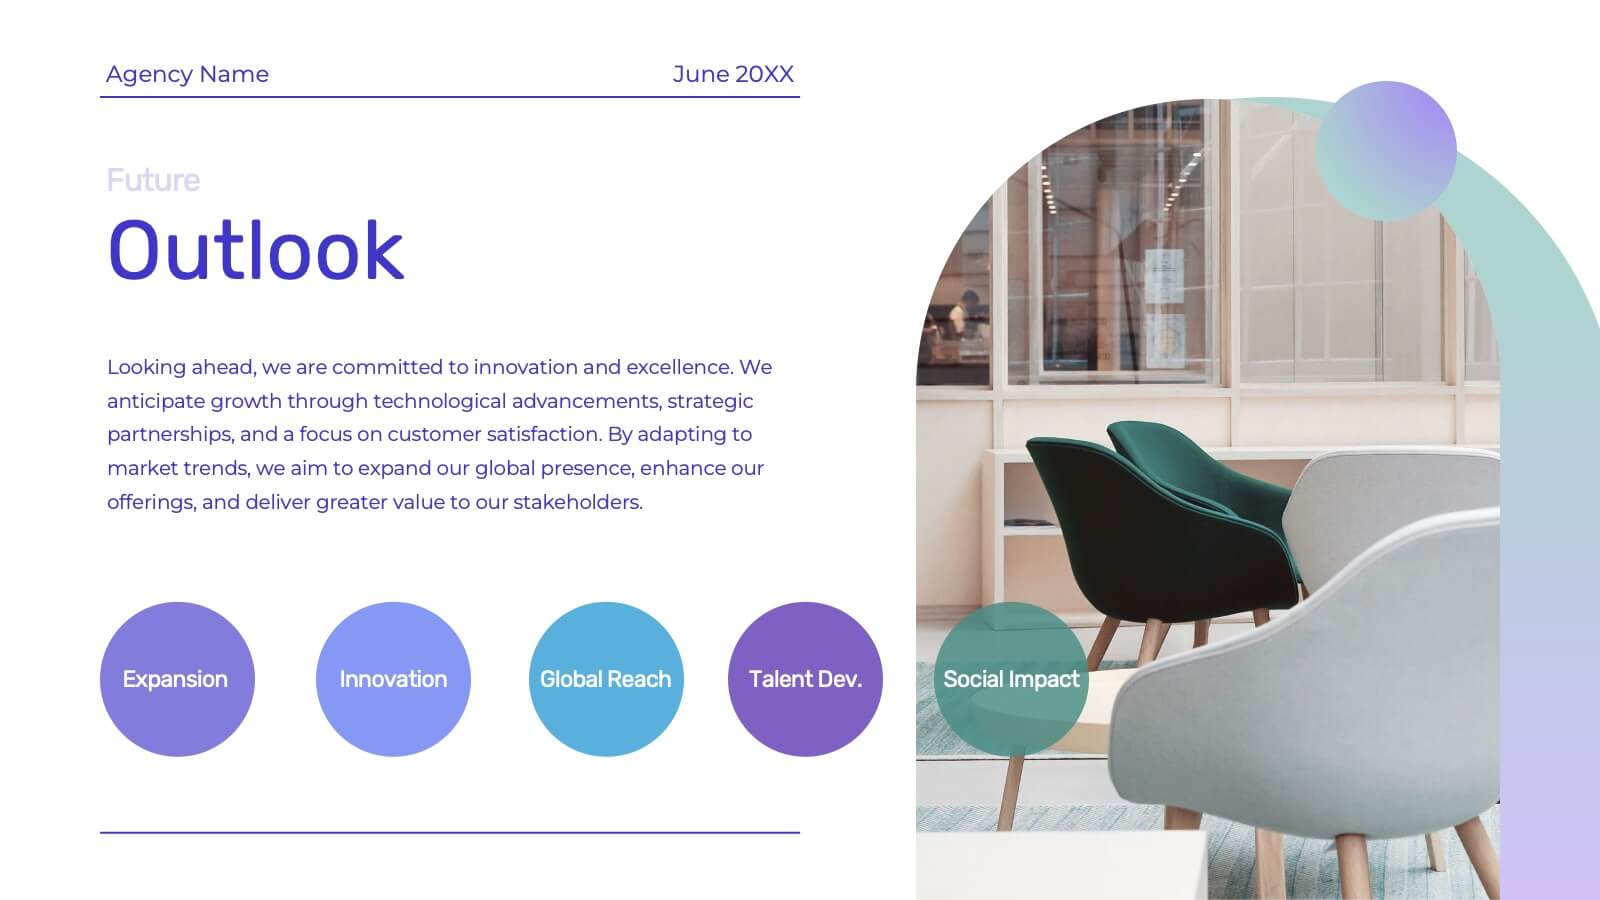
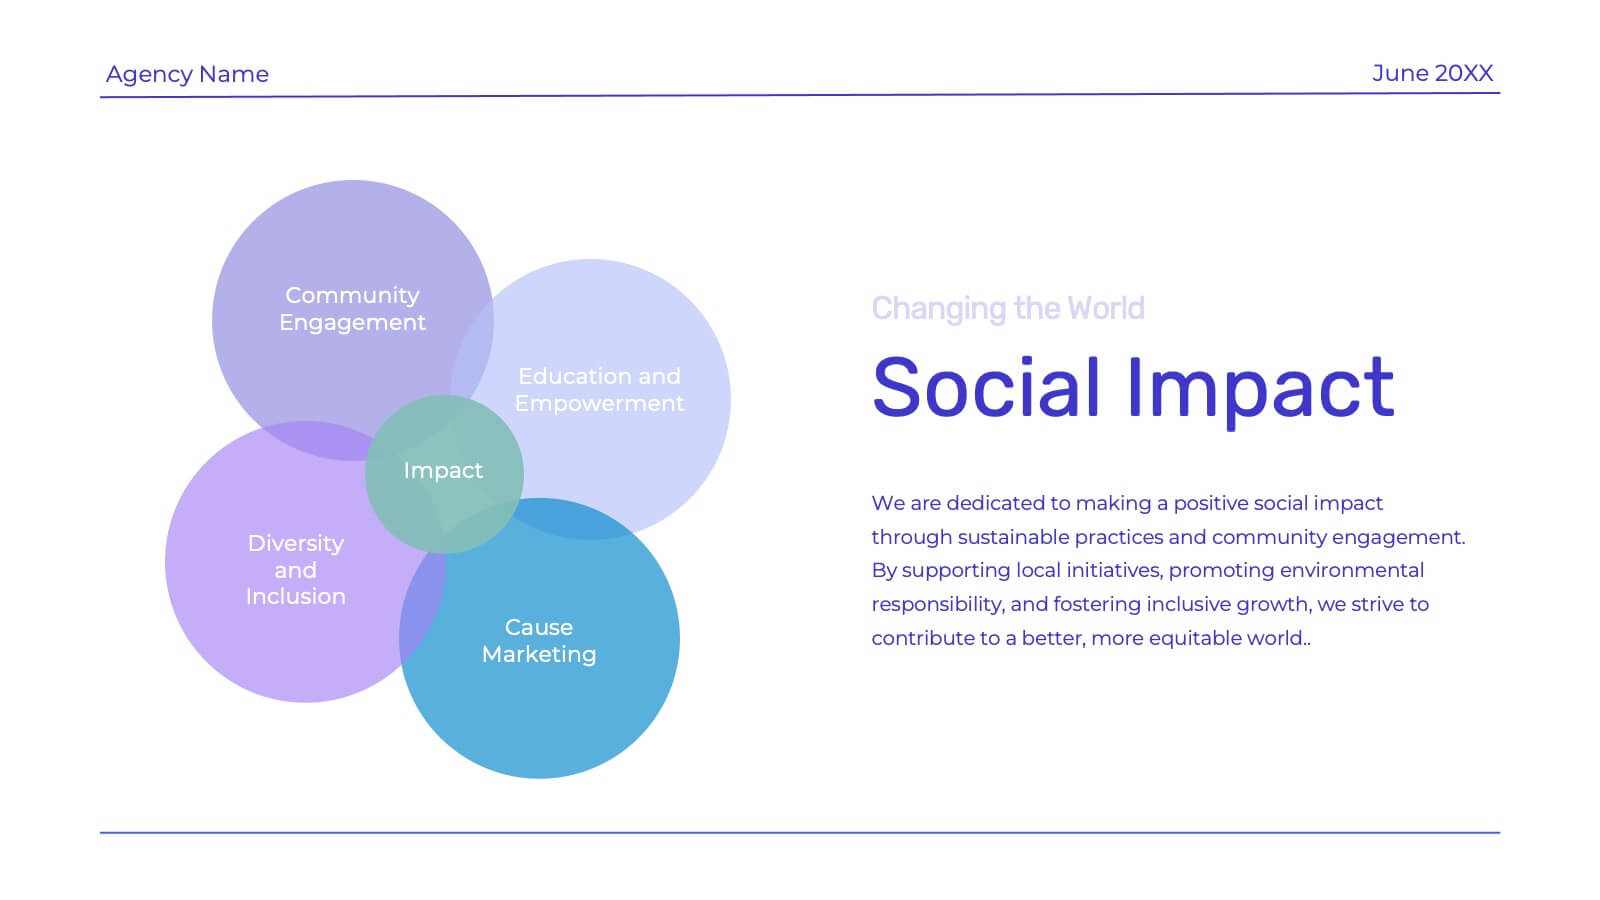
Genesis Creative Agency Pitch Deck Presentation
Showcase your creative agency’s strengths with this vibrant template. Highlight your team, services, success stories, and unique approach. Ideal for case studies, market analysis, and campaign execution. Fully compatible with PowerPoint, Keynote, and Google Slides.


4 diapositivas
Regional Economic Evolution in Asia Map Presentation
Track economic progress across Asia with this regional growth map. Each country is paired with a progress bar for visual comparison of growth indicators. Ideal for data-driven insights, economic reviews, or development updates. Editable in PowerPoint, Keynote, and Google Slides for seamless customization and professional, geography-based presentations.


4 diapositivas
User Experience Flow Presentation
Bring clarity and color to every stage of your user experience process with this clean, structured presentation. It helps you outline steps, explain interactions, and highlight key insights in a visually intuitive flow. Easy to customize and fully compatible with PowerPoint, Keynote, and Google Slides.


3 diapositivas
Company Mission and Core Values Presentation
Present your brand’s purpose with clarity using this streamlined infographic slide. Divided into three distinct sections—Mission, Vision, and Values—each with icon support and editable text, this layout offers a clean and professional structure for showcasing your company’s guiding principles. Ideal for pitch decks, onboarding, and strategic planning presentations. Fully compatible with PowerPoint, Keynote, and Google Slides.


26 diapositivas
Soren Presentation Template
Soren is a cool, clean, simple easy to use template. This beautiful template is great for all types of businesses and creative projects. The colors are bold and simple to capture the audience needs. Soren is a multipurpose theme that can be used to capture the attention of your clients in a friendly, unique way. This template is a minimalistic design to attract your customers. The simple text, charts and tables make it easy to customize this template to match your brand. Whether you’re in need of a business presentation, newsletter or even social media posts – Soren is the perfect fit for you.


8 diapositivas
Economic Impact on Stock Market Presentation
Illuminate your financial presentation with the "Economic Impact on Stock Market" template, ideal for displaying the interconnected influences of economic variables on market performance. These slides feature clear, visual representations through pie charts and percentage indicators, allowing for an engaging analysis of trends and impacts. This template is fully compatible with PowerPoint, Keynote, and Google Slides, ensuring versatility across different presentation platforms.


3 diapositivas
Financial Cost Management Strategies
Break down your financial action plan with the Financial Cost Management Strategies Presentation. Featuring a dynamic 3-step arc design, this template is ideal for illustrating cost-saving initiatives, expense control methods, or phased budget implementation strategies. Each curved step includes space for icons, step numbers, titles, and concise descriptions, making it easy to communicate each stage clearly. Fully editable in PowerPoint, Keynote, and Google Slides, it’s perfect for finance teams, consultants, or operations leaders.


21 diapositivas
Thistledown Marketing Campaign Presentation
Elevate your marketing campaigns with this polished and professional presentation template. Perfectly tailored to showcase key components such as campaign objectives, target audience, and competitive landscape, it provides a cohesive structure for presenting your strategies effectively. The slides also include sections for financial highlights, unique selling proposition, and growth planning, ensuring your goals are communicated with clarity. Whether you're discussing market presence, service offerings, or team leadership, this template helps streamline your content. Fully editable in PowerPoint, Google Slides, and Keynote, it offers flexibility to align with your branding and deliver a compelling campaign presentation.


4 diapositivas
AIDA Marketing Model Breakdown Presentation
Visualize your marketing funnel with this sleek AIDA breakdown slide. Each stage—Attention, Interest, Desire, and Action—is clearly illustrated with bold arrow graphics and space for strategic insights. Ideal for marketing teams, business pitches, or campaign planning. Fully customizable in PowerPoint, Keynote, and Google Slides.


6 diapositivas
Business Project Proposal Template
Showcase your strategy with clarity and confidence using this sleek Business Project Proposal slide. Designed to highlight three core ideas or phases, it's perfect for pitching initiatives, presenting goals, or structuring deliverables. Compatible with PowerPoint, Google Slides, and Keynote for seamless editing and customization.


8 diapositivas
Product Showcase on Devices Presentation
Present your features in a sleek, mobile-first layout with the Product Showcase on Devices Presentation. This vertical slide design mimics a smartphone screen, making it ideal for displaying app features, service tiers, or digital tool highlights. Each section is clearly segmented, perfect for comparisons or step-by-step product walkthroughs. Fully editable in PowerPoint, Keynote, Canva, and Google Slides.