


Características


¿Tienes alguna pregunta?
Recomendar

23 diapositivas
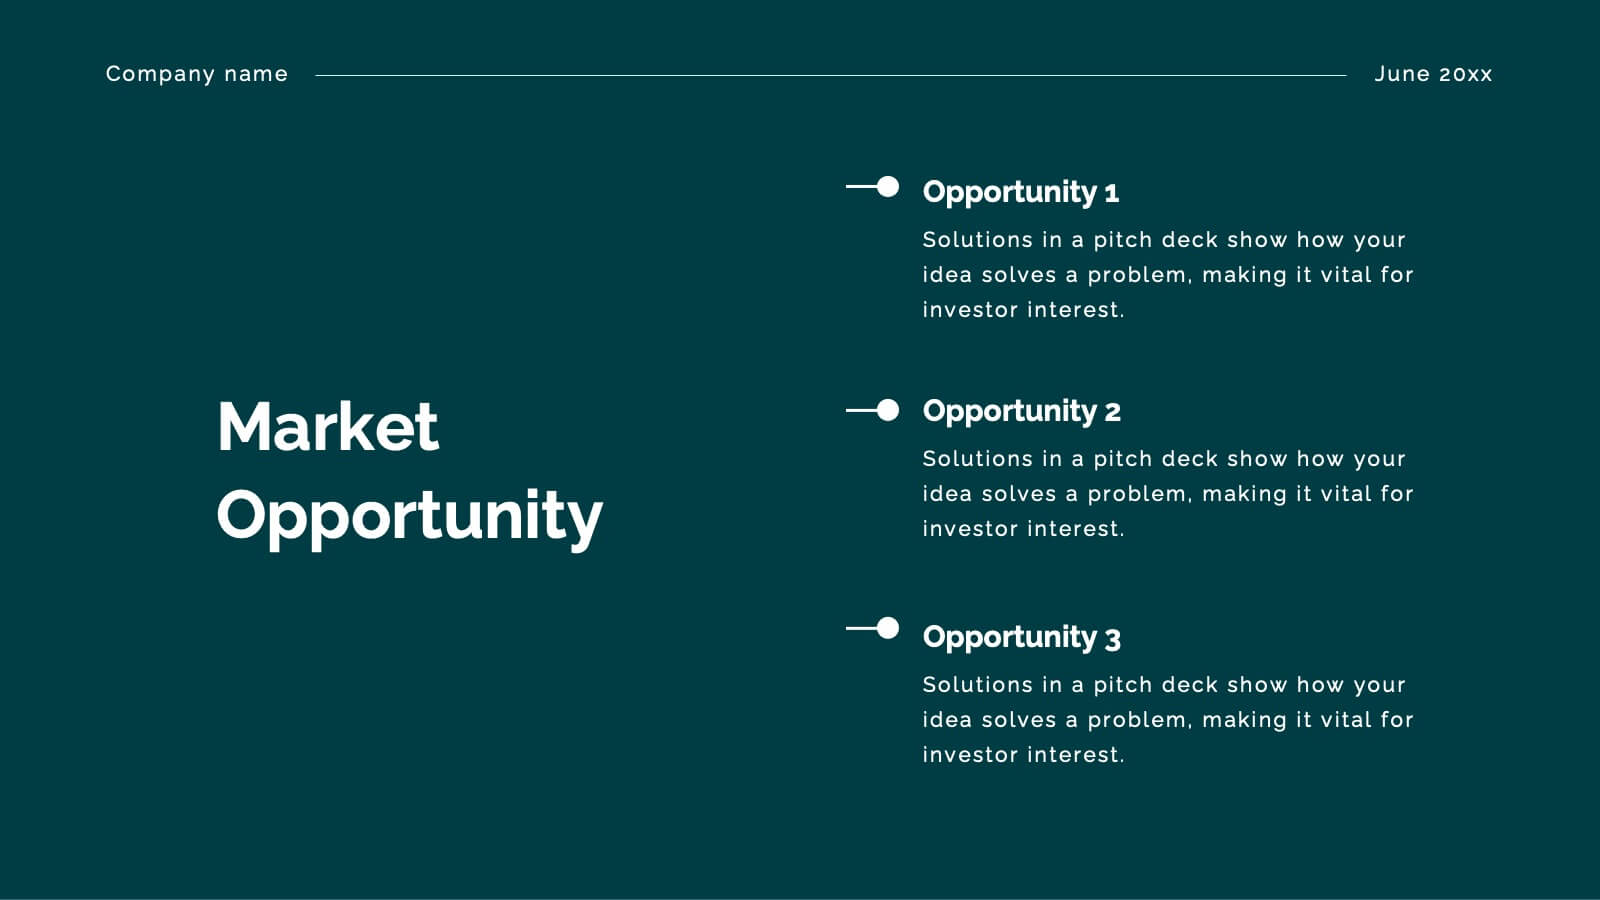
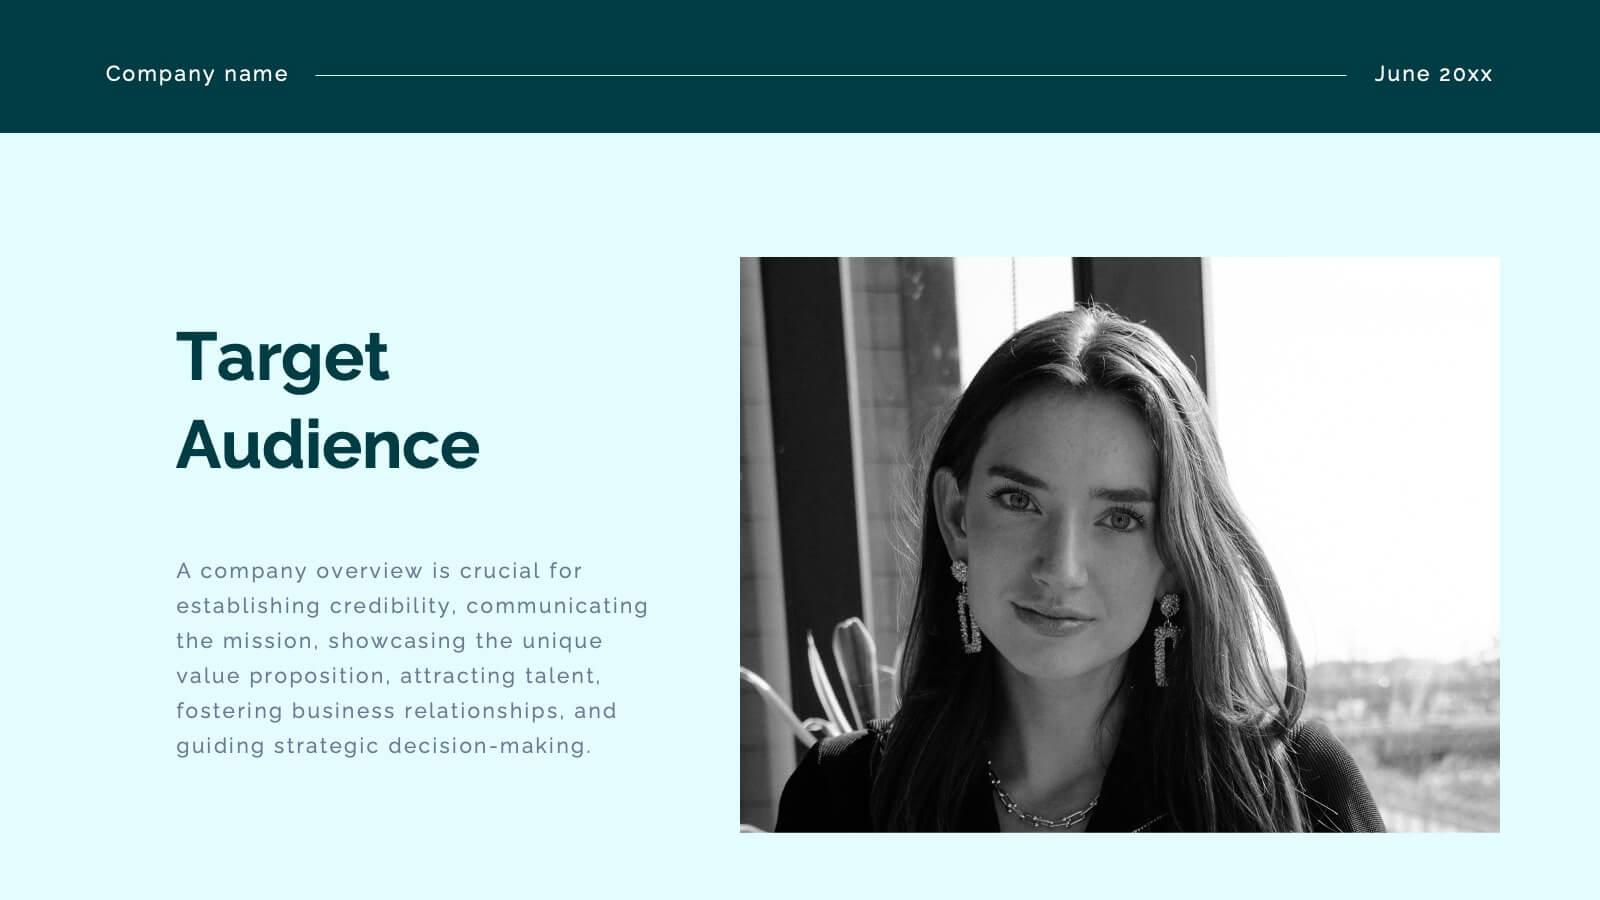
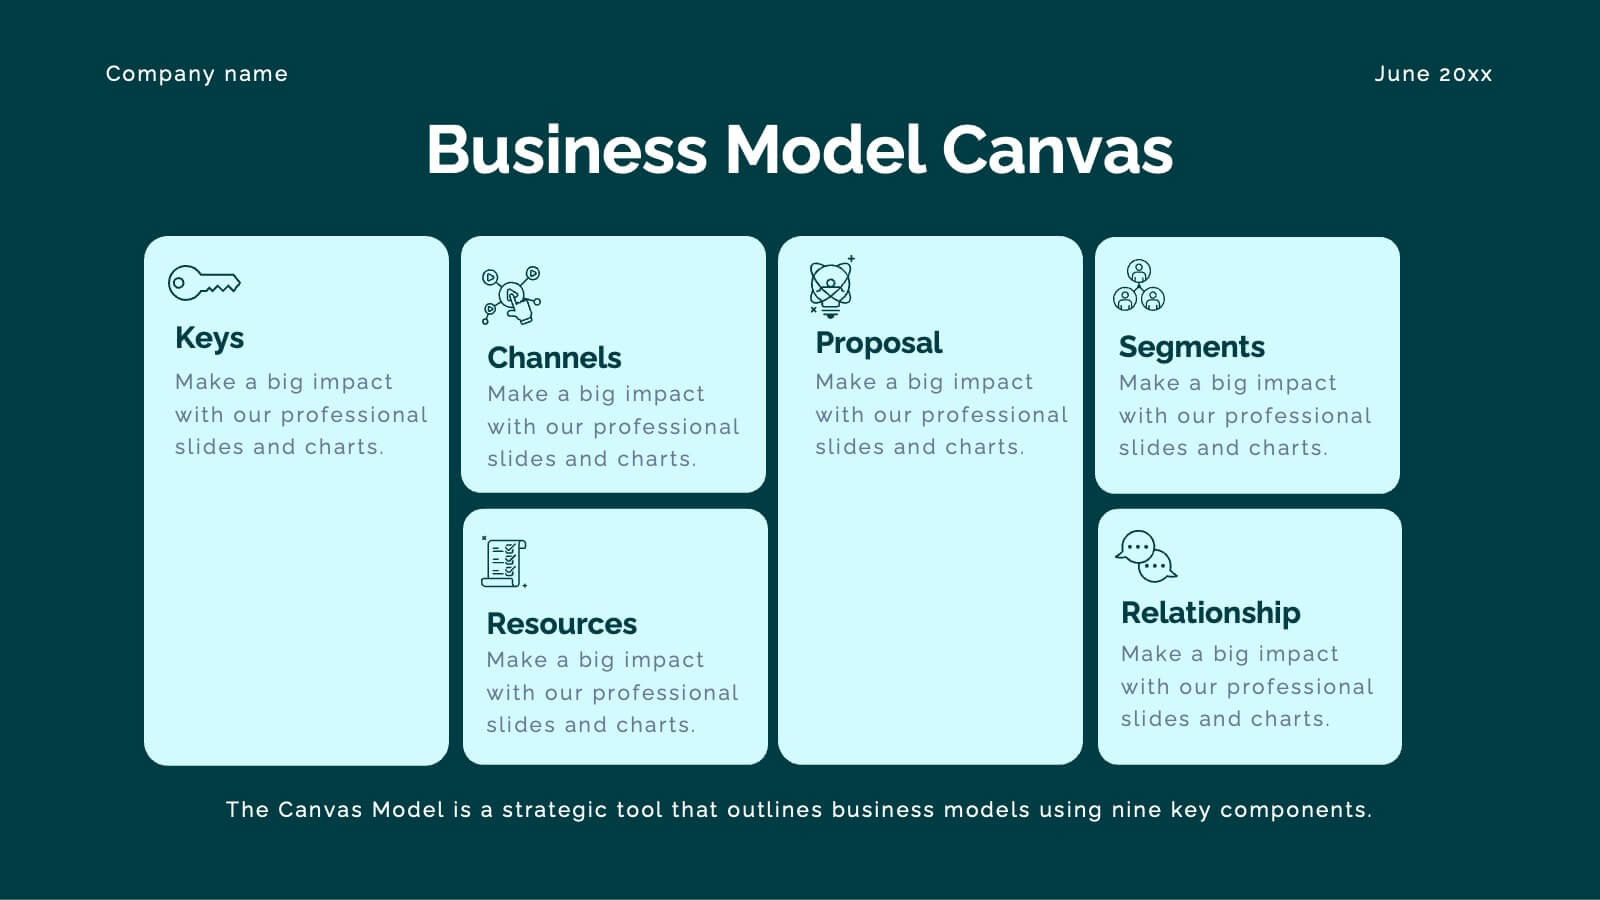
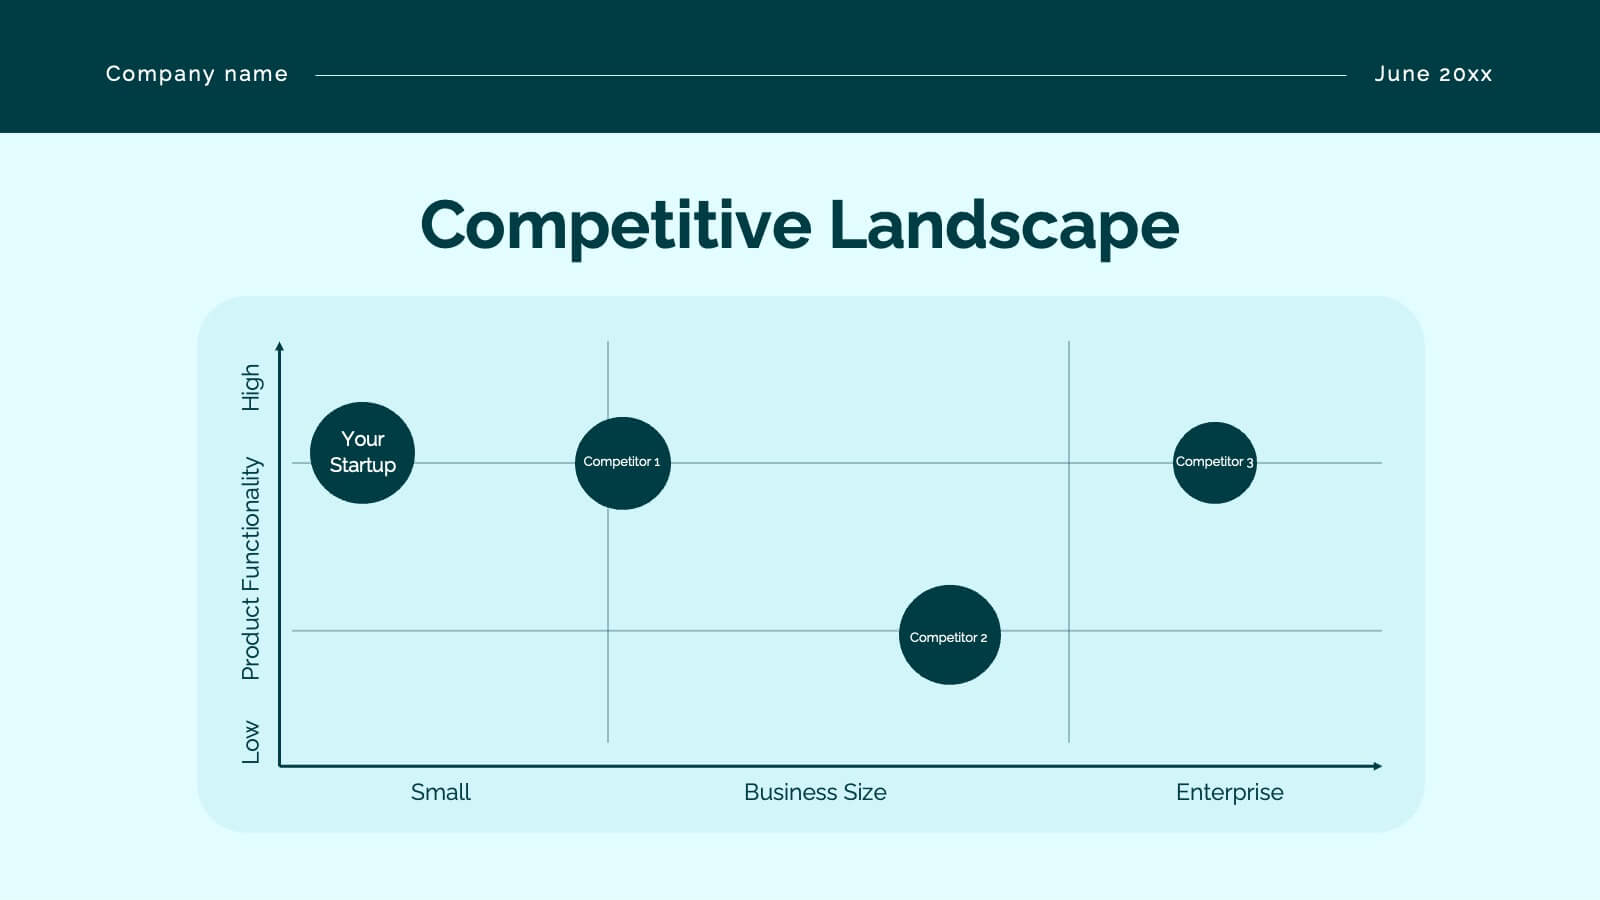
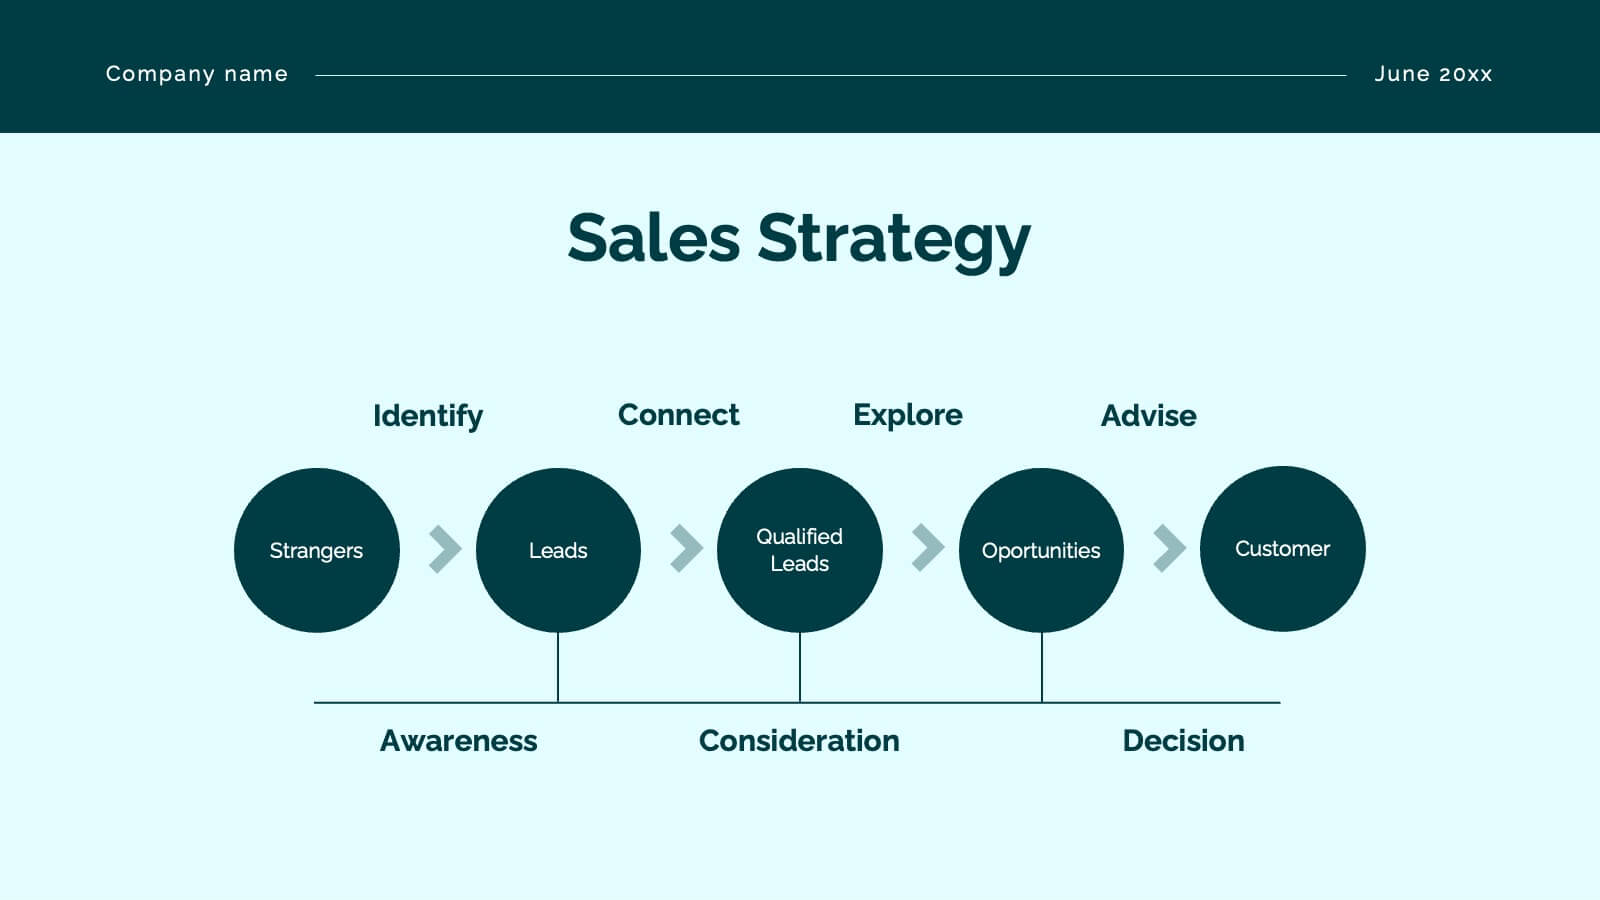
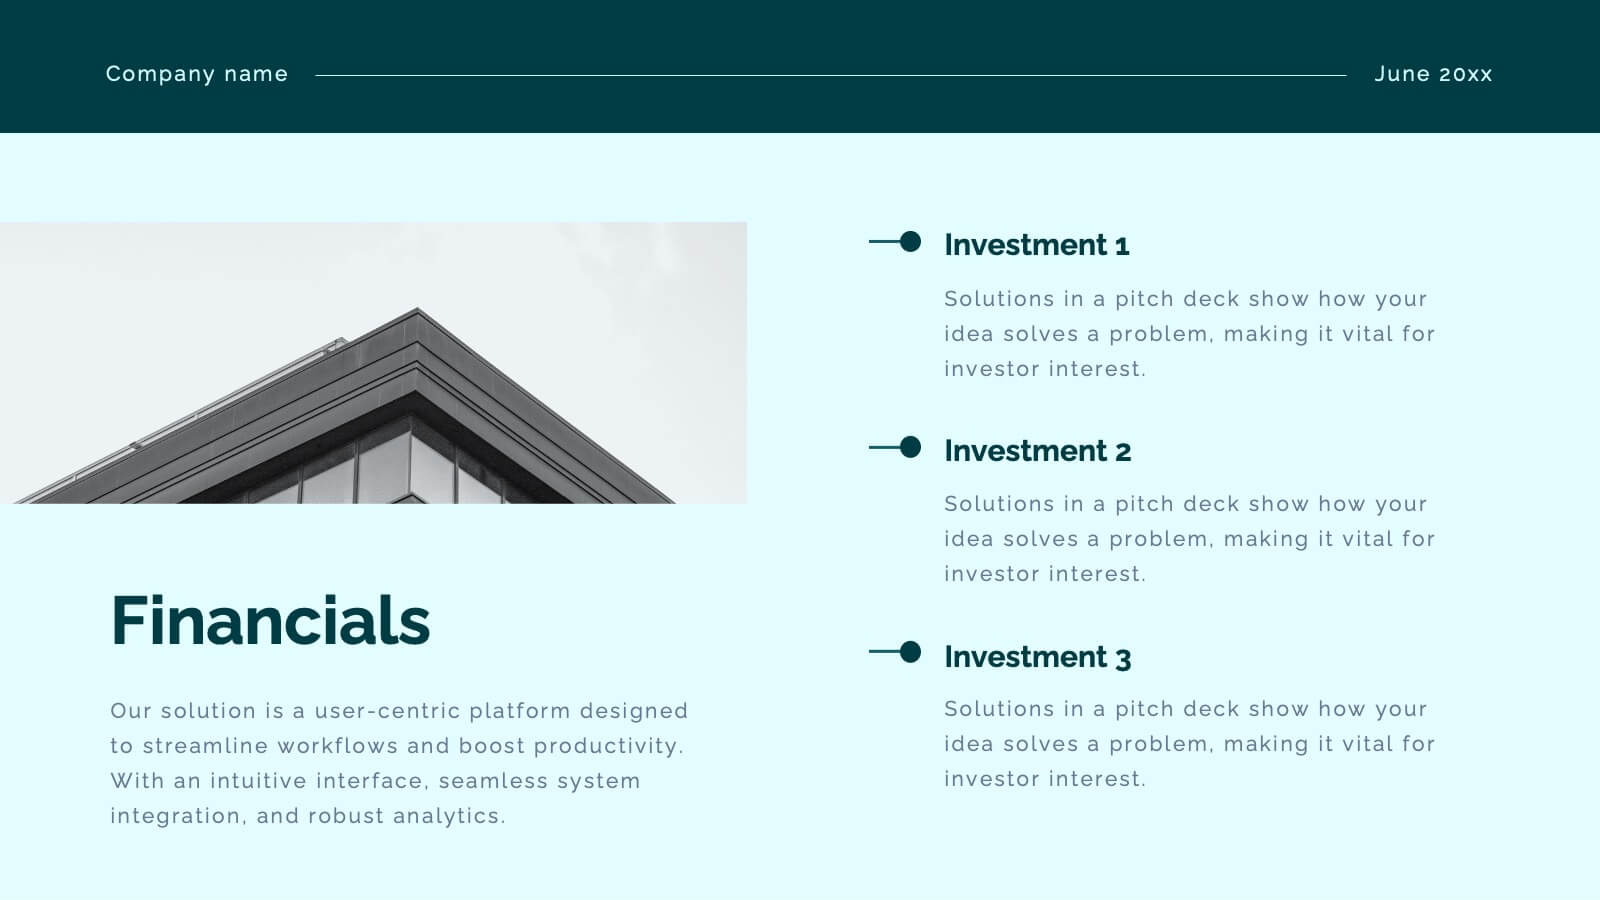
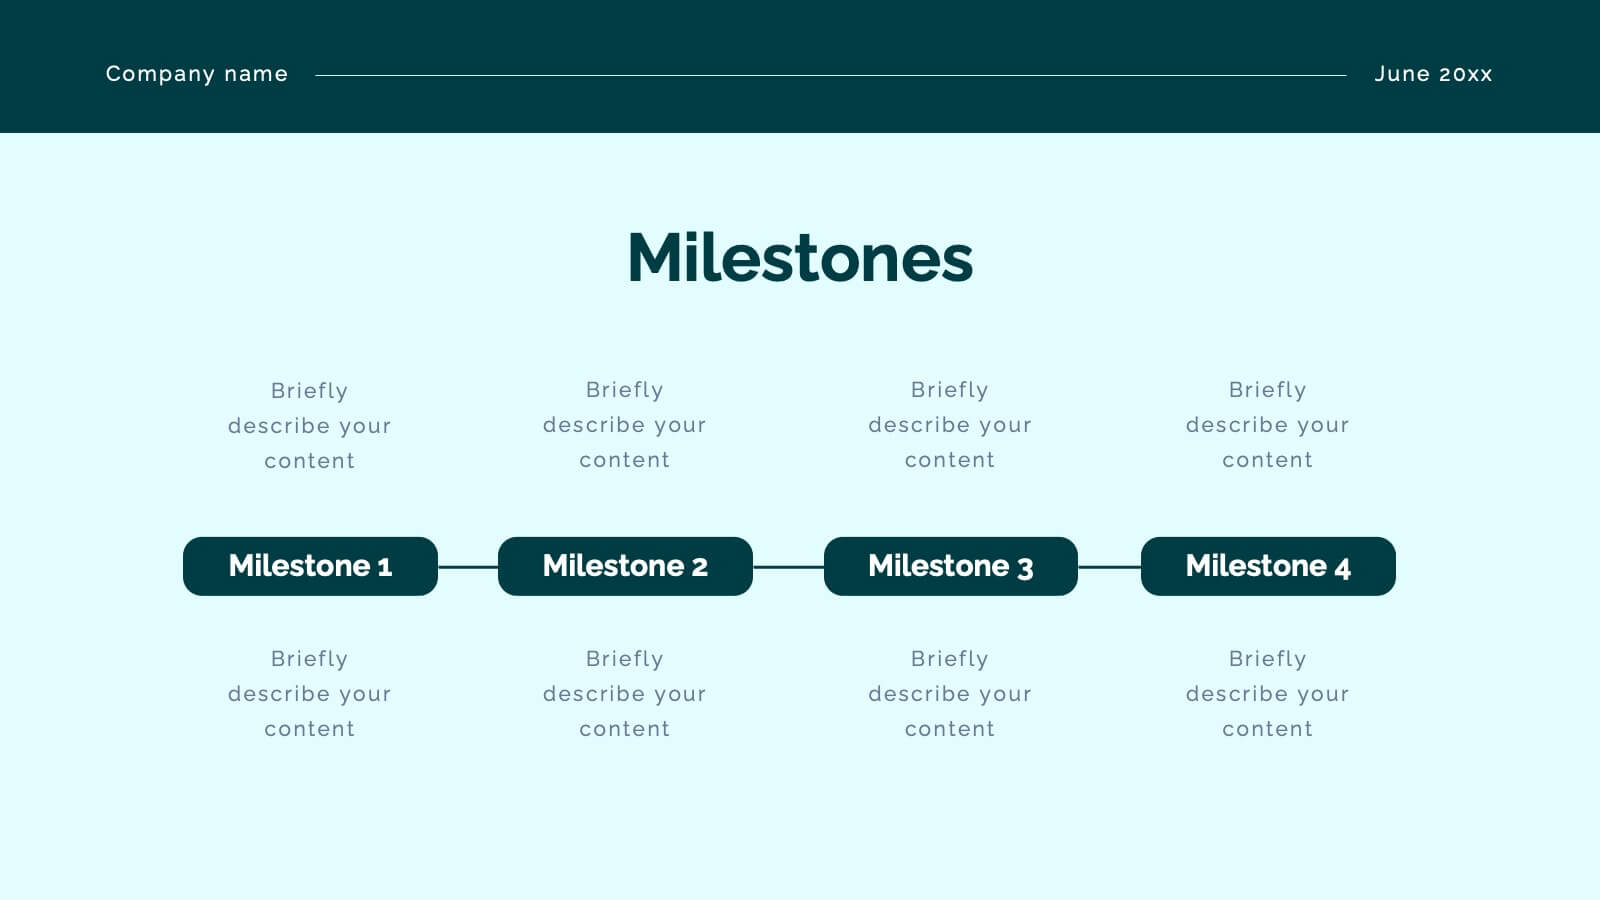
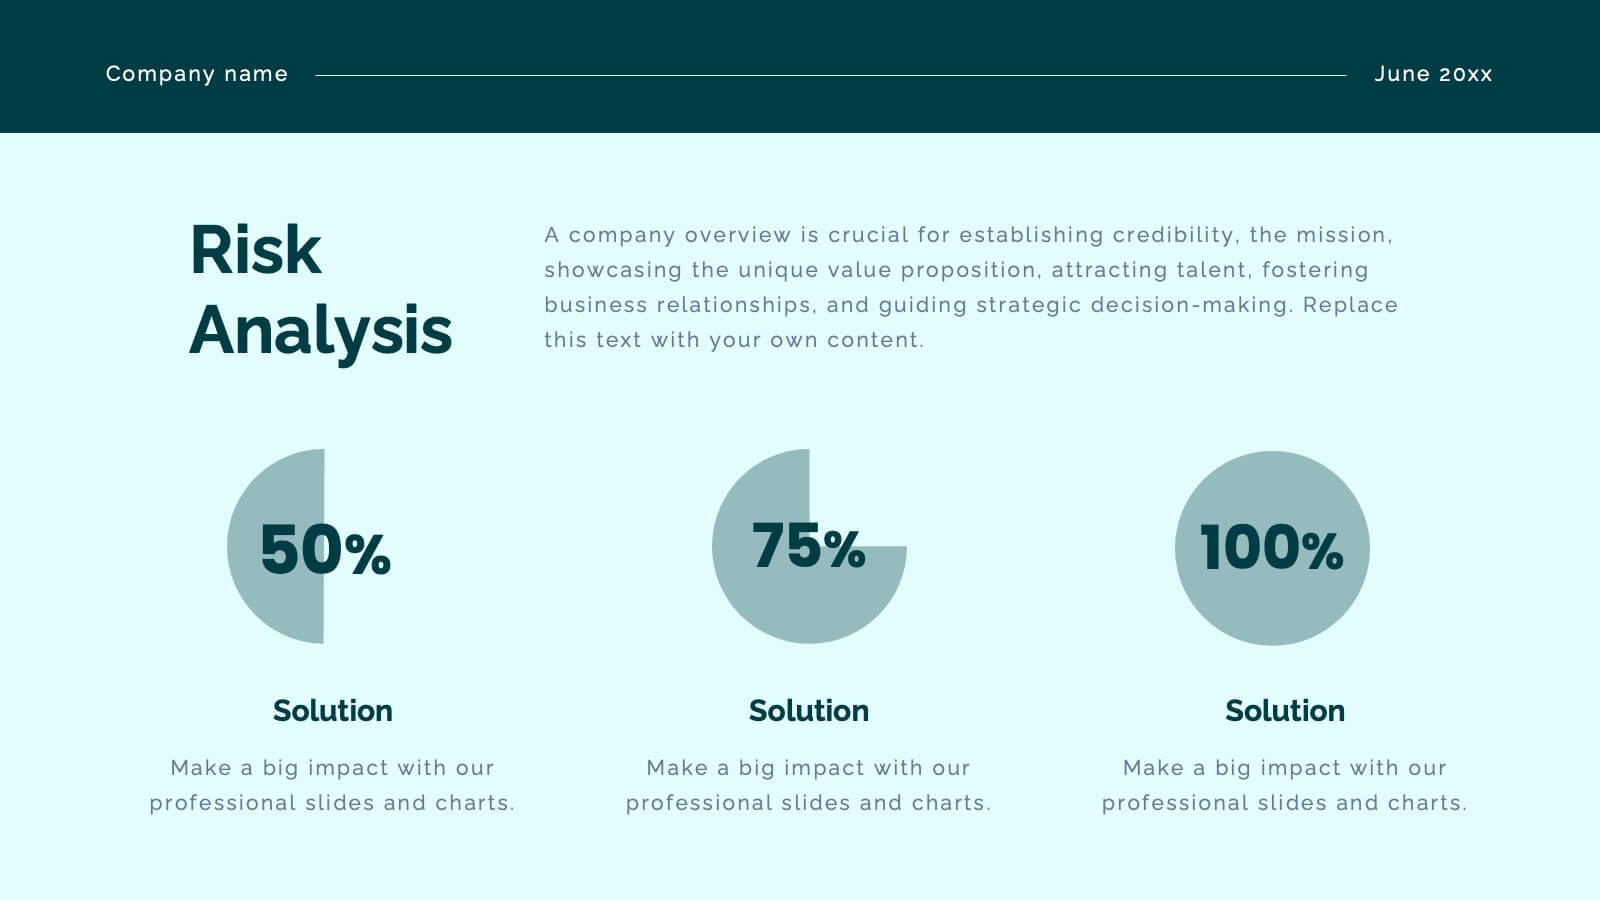
Crest Investor Pitch Presentation Presentation
Unleash your potential with this powerful pitch deck template! Tailored for presenting innovative business ideas, it features slides for company overview, market opportunity, competitive landscape, and financial projections. Clearly communicate your value proposition and impress investors with professional design and concise content. Compatible with PowerPoint, Keynote, and Google Slides for seamless presentations on any platform.


6 diapositivas
Project Table Infographic
A project table is a structured and organized representation of project-related information in a tabular format. This infographic template is designed to list and track various elements of a project, such as tasks, activities, resources, timelines, and statuses. This infographic showcases project-related data in a concise and organized manner. It is an essential tool for project managers and teams to present project progress, timelines, tasks, and key milestones in a clear and easy-to-understand format. The sections provide additional information about the task's purpose, deliverables, and any specific requirements.


5 diapositivas
Corporate Strategic Planning Presentation
Create a winning strategy with this corporate strategic planning template. Designed for business leaders, it helps structure goals, initiatives, and key performance areas in a clear, visual format. Ideal for strategic decision-making and long-term planning. Fully customizable and compatible with PowerPoint, Keynote, and Google Slides for seamless editing and presentation.


21 diapositivas
Illusia Artist Portfolio Template Presentation
Make your creative work shine with this vibrant and versatile portfolio presentation template. Designed for artists, designers, and creative professionals, this template enables you to showcase your projects, philosophy, and achievements in a visually captivating way. Present your journey with slides that cover an introduction, portfolio overview, creative process, and collaborations. Highlight your unique style and philosophy while featuring key projects with dynamic layouts. Share your accolades, services offered, pricing details, and client testimonials to build trust and credibility. Fully customizable and compatible with PowerPoint, Google Slides, and Keynote, this template offers effortless editing to align with your branding and personal style. Perfect for portfolio reviews, client meetings, or showcasing your work online, this template is designed to make a bold, professional impression.


6 diapositivas
Corporate Framework Planning Presentation
Organize and present your strategic plans with this clean corporate framework layout. Ideal for showcasing six key areas of focus, this slide helps communicate business insights, goals, and execution pillars clearly. Fully editable in Canva, PowerPoint, and Google Slides—perfect for business plans, executive meetings, or internal project reviews.


4 diapositivas
Audience Demographic Profile Overview
Present audience composition with clarity using the Audience Demographic Profile Overview Presentation. This slide is designed to showcase gender-based or group-specific data through visual figures, percentage markers, and supporting bar charts. Ideal for marketers, analysts, and researchers who need to communicate user distribution and behavior insights. Fully editable in PowerPoint, Keynote, and Google Slides.


4 diapositivas
Project Planning in Four Steps Presentation
Streamline your workflow with the Project Planning in Four Steps presentation. This structured slide layout simplifies task organization, milestone tracking, and goal-setting into a clear, four-step process. Perfect for business strategies, project management, and team collaboration. Fully customizable and compatible with PowerPoint, Keynote, and Google Slides for effortless integration.


6 diapositivas
Demographic Information Infographic
Demographic information refers to data that describes the characteristics of a population or specific groups within a population. This infographic template is essential for understanding the composition and dynamics of a population, as well as for making informed decisions in various fields, such as market research, healthcare, and education. This infographic is designed to provide an overview of key demographic indicators and trends, offering insights into the characteristics of the target audience. This infographic includes key insights about the demographic data presented, providing context and interpretation for the audience.


5 diapositivas
Financial Investment Portfolio Presentation
Visualize portfolio distribution like never before. This presentation features glass dome-protected coin stacks to represent diverse asset categories, risk levels, or growth stages. Ideal for financial advisors, investors, or business analysts presenting asset management plans. Fully editable in PowerPoint, Keynote, and Google Slides.


7 diapositivas
Lifecycle Stages in Customer Experience Presentation
Showcase the full customer journey with this Lifecycle Stages in Customer Experience presentation. Featuring a sleek infinity loop layout, this slide is ideal for visualizing cyclical engagement stages—like acquisition, onboarding, retention, and advocacy. Clean design and labeled touchpoints help convey insights clearly. Fully compatible with PowerPoint, Canva, and Google Slides.


6 diapositivas
Editable Gantt Timelines Presentation
Bring your project plans to life with a clean, colorful timeline that makes progress easy to track and goals simple to communicate. This presentation helps teams visualize schedules across quarters, highlight tasks, and manage deadlines with clarity. Fully compatible with PowerPoint, Keynote, and Google Slides.


7 diapositivas
Project Proposal Structure Infographic
Optimize your project planning and presentation with this professional set of project proposal structure templates. Each slide is designed to systematically display project details, from the introduction and objectives to the detailed work plan and budget. These templates are essential tools for project managers, strategists, and business analysts aiming to convey comprehensive project proposals. Structured to support clear communication, the templates feature a logical flow that guides viewers through each critical component of the proposal. The use of a consistent blue color palette and clean typography helps maintain focus on the content, while graphical elements like charts and timelines visually break down complex information, making it easily digestible for stakeholders. Fully customizable, these templates allow for easy adaptations to specific project needs, enabling precise tailoring of text, color, and design elements. Whether for internal project approval or external client pitches, these slides will help you present a clear, structured, and persuasive project proposal.


4 diapositivas
3-Level Tree Chart Presentation
Grow your ideas from concept to execution with this beautifully designed visual layout. Perfect for showcasing layered strategies, hierarchical processes, or business development stages, it balances clarity and creativity through a clean, tree-inspired design. Fully editable and compatible with PowerPoint, Keynote, and Google Slides for seamless professional use.


22 diapositivas
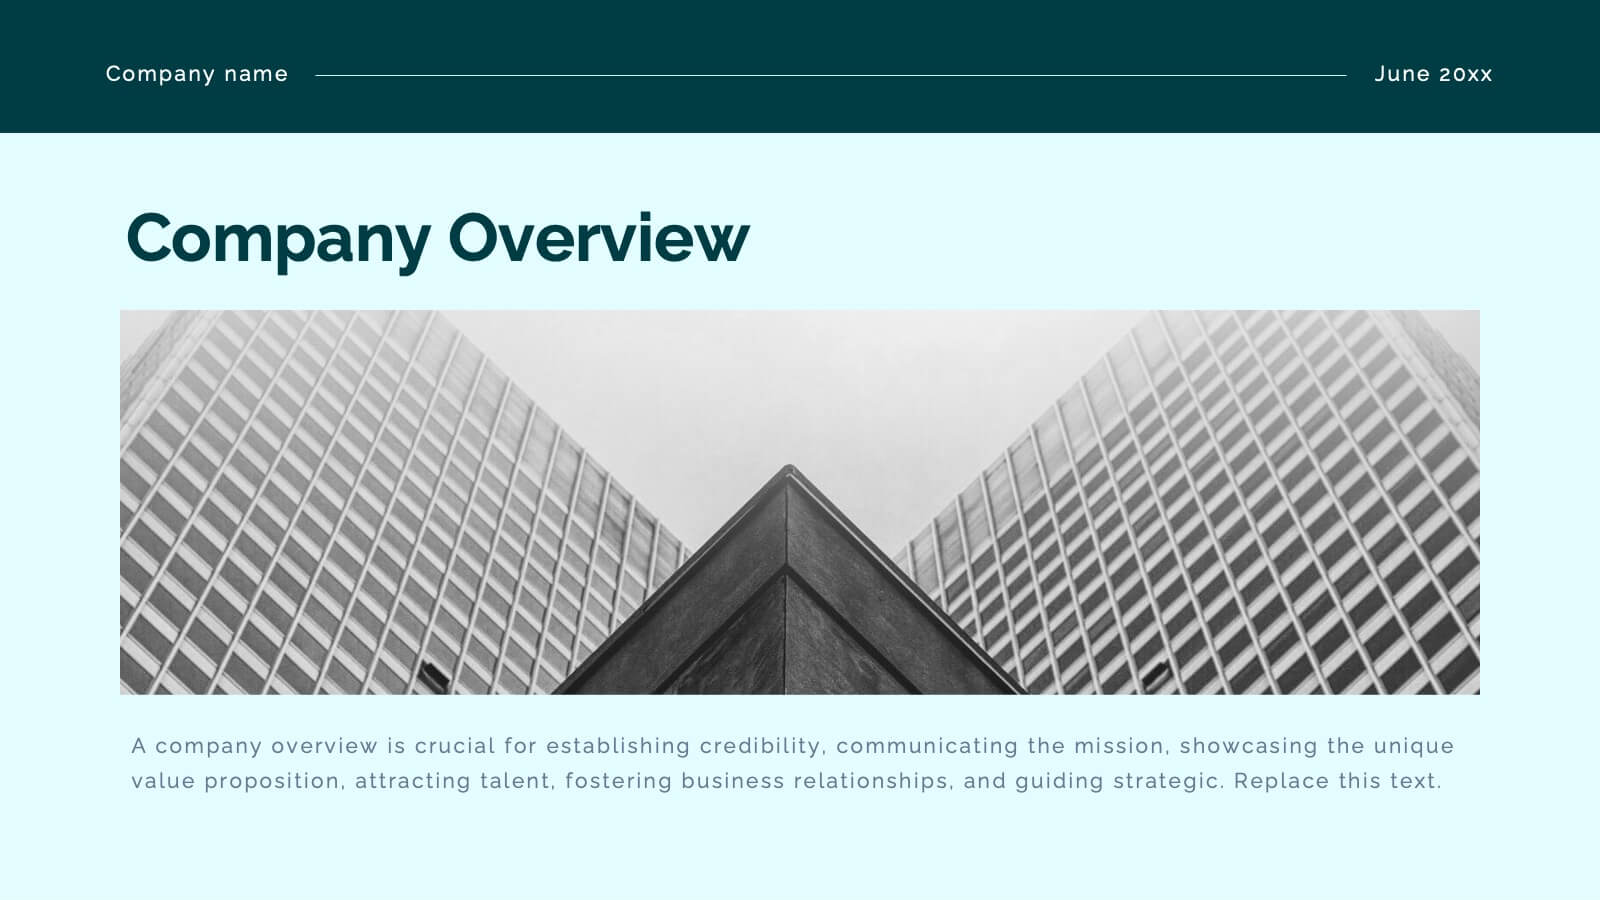
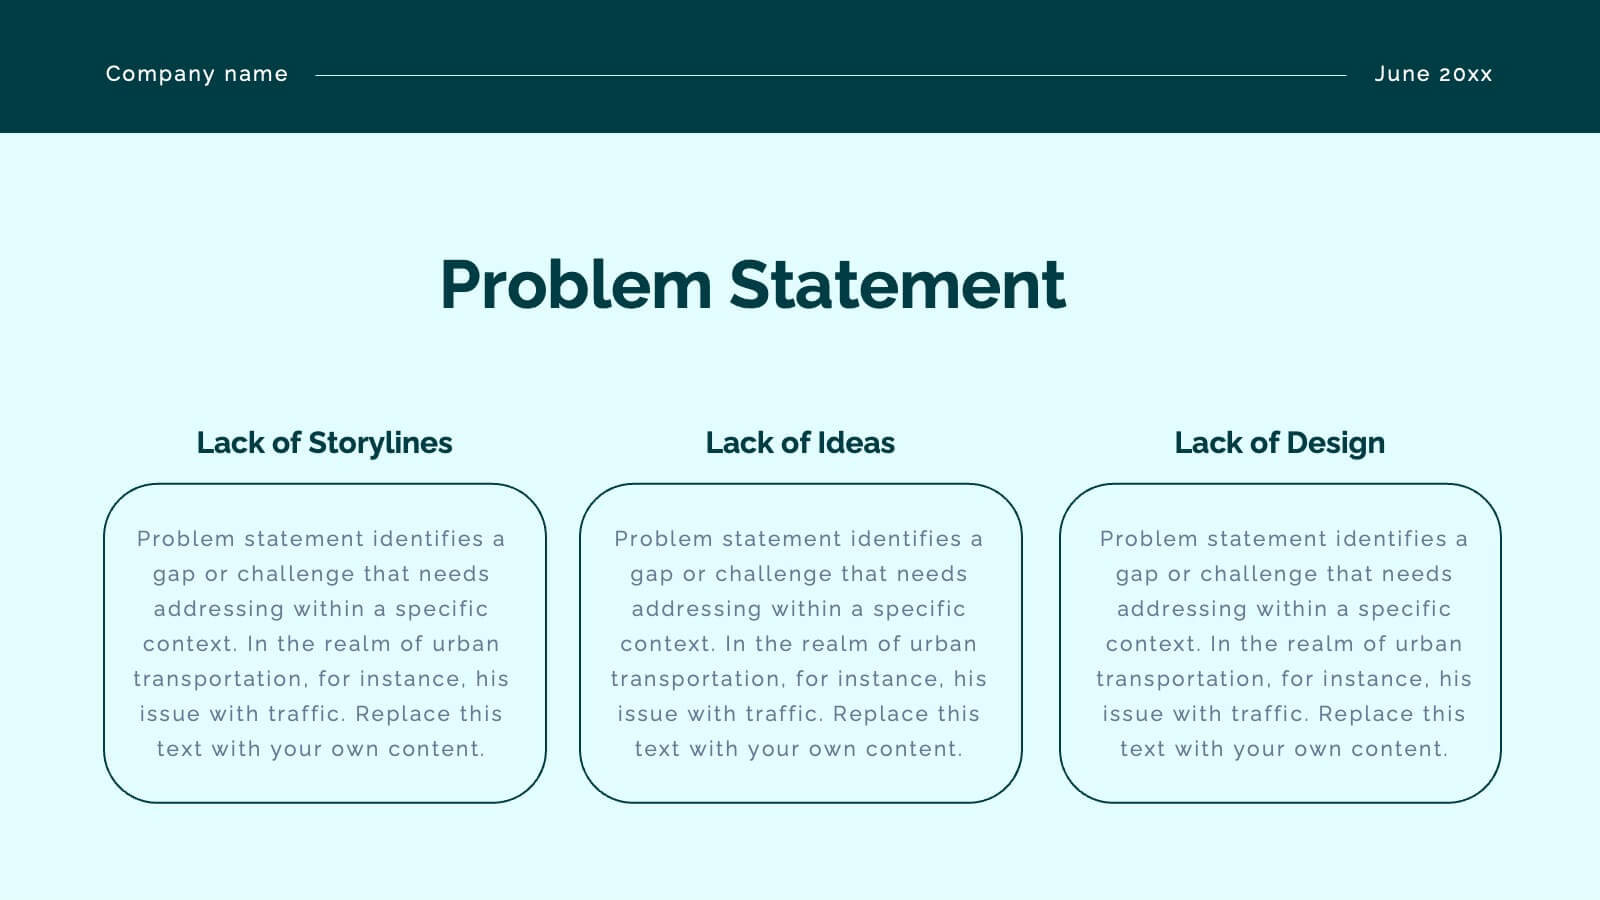
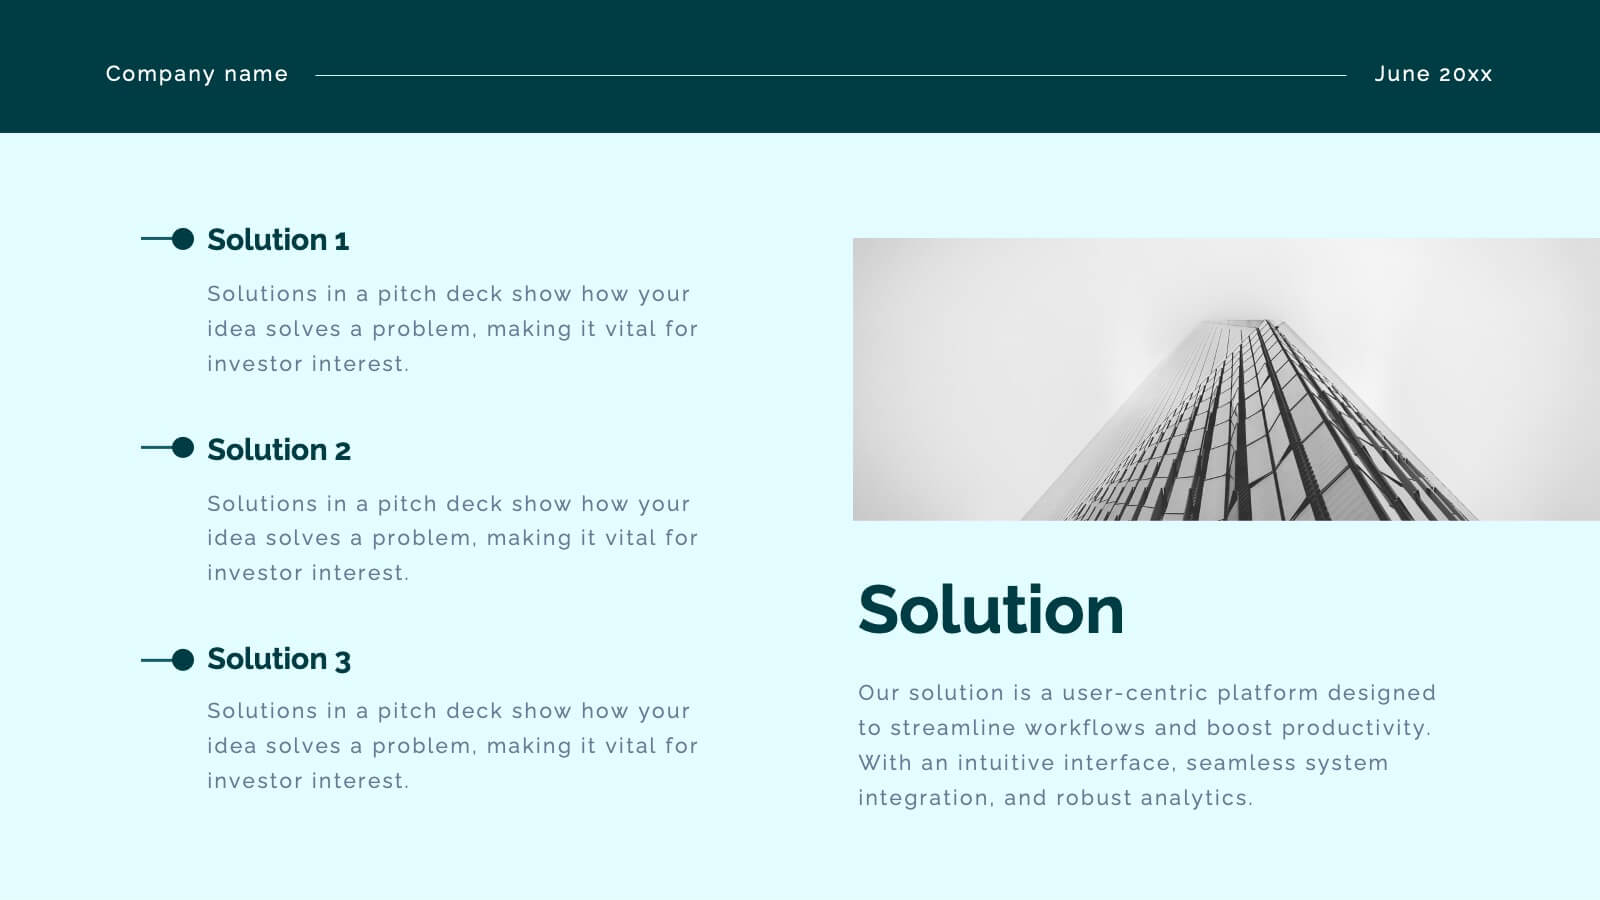
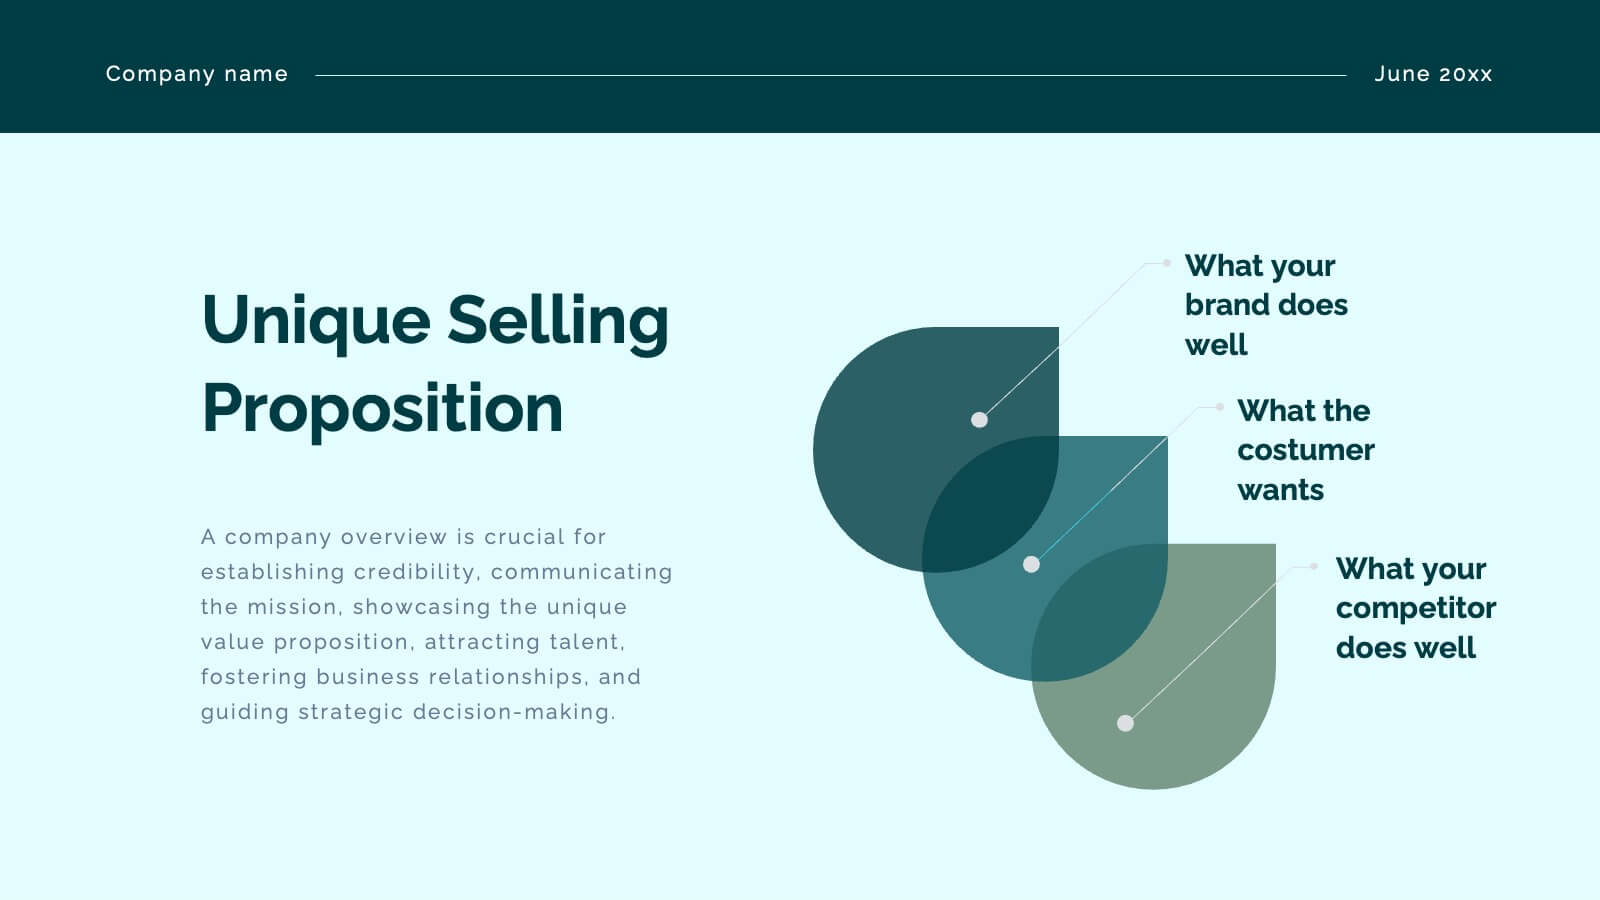
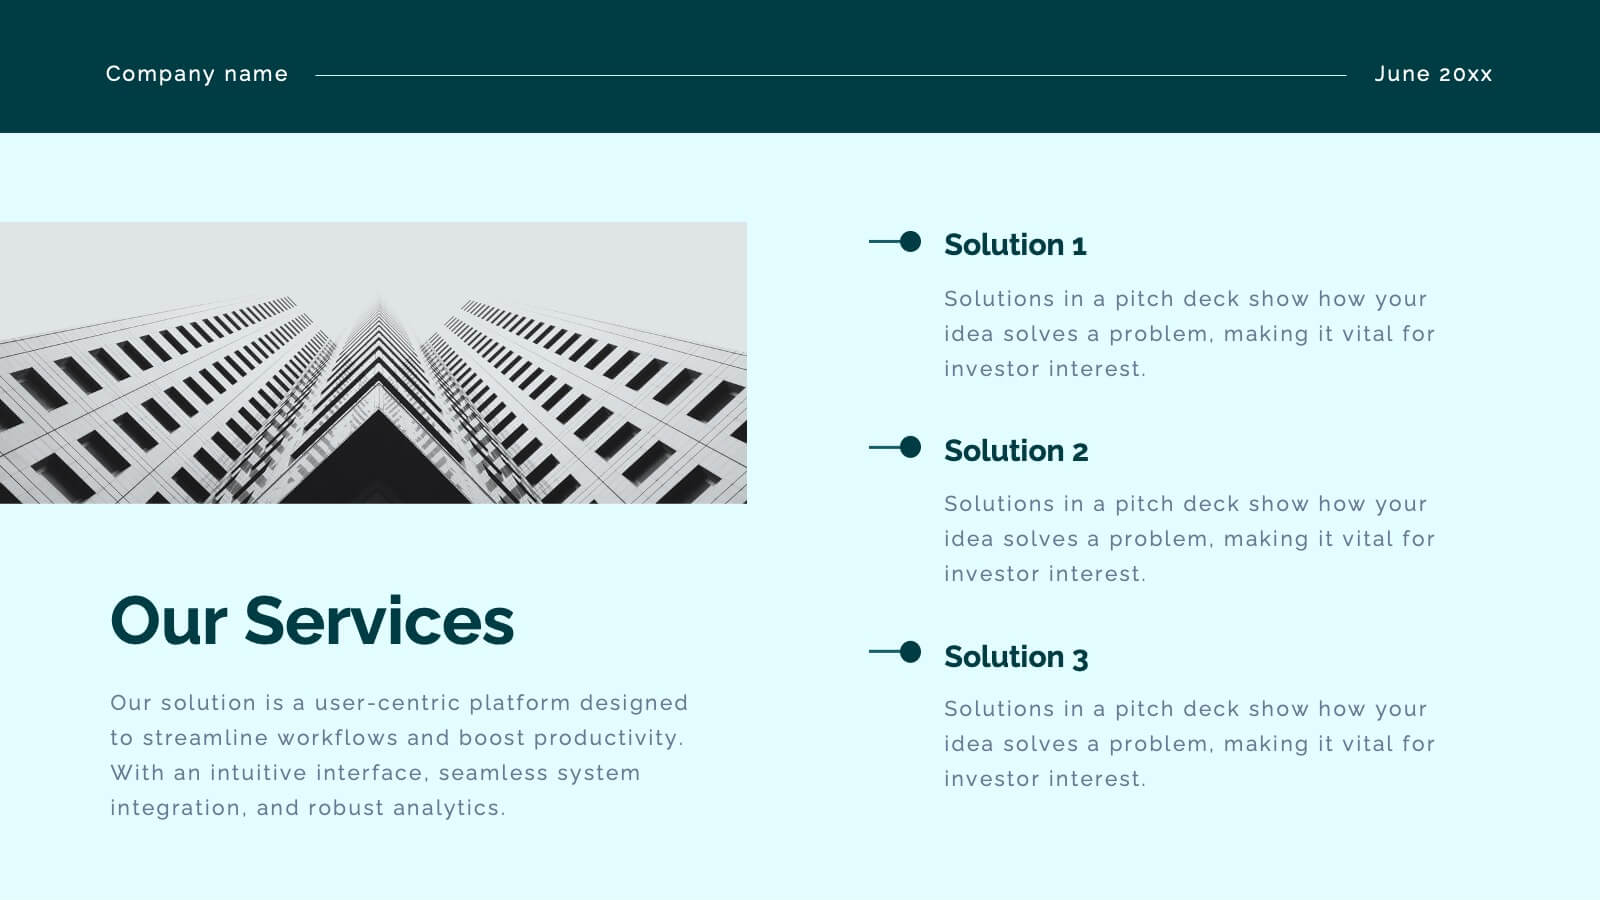
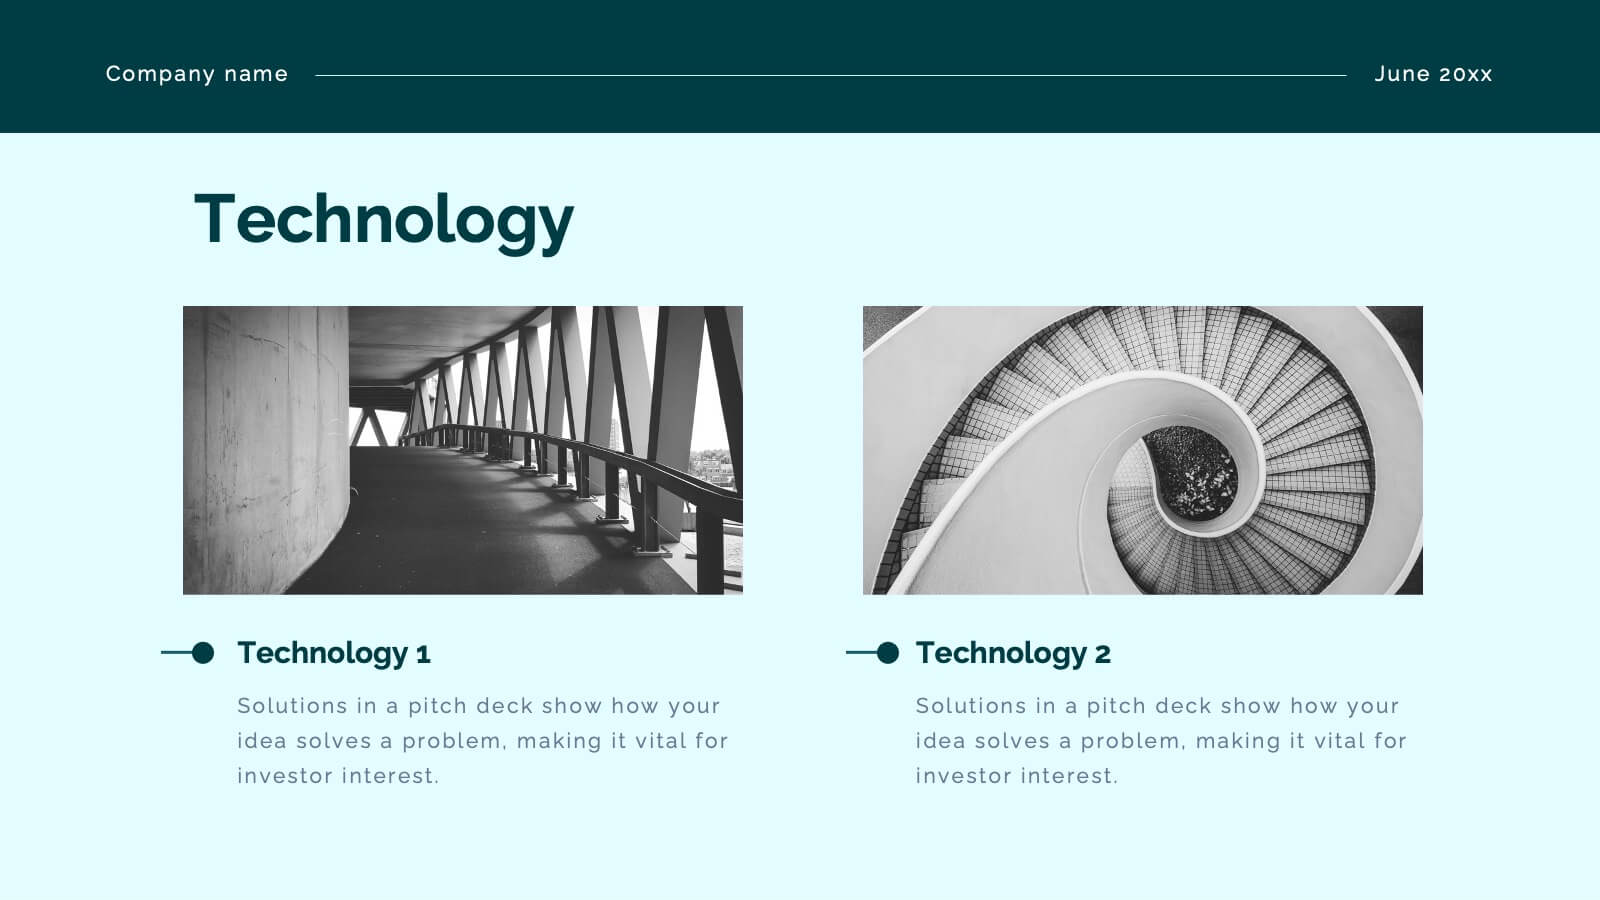
Simple Pitch Deck Presentation
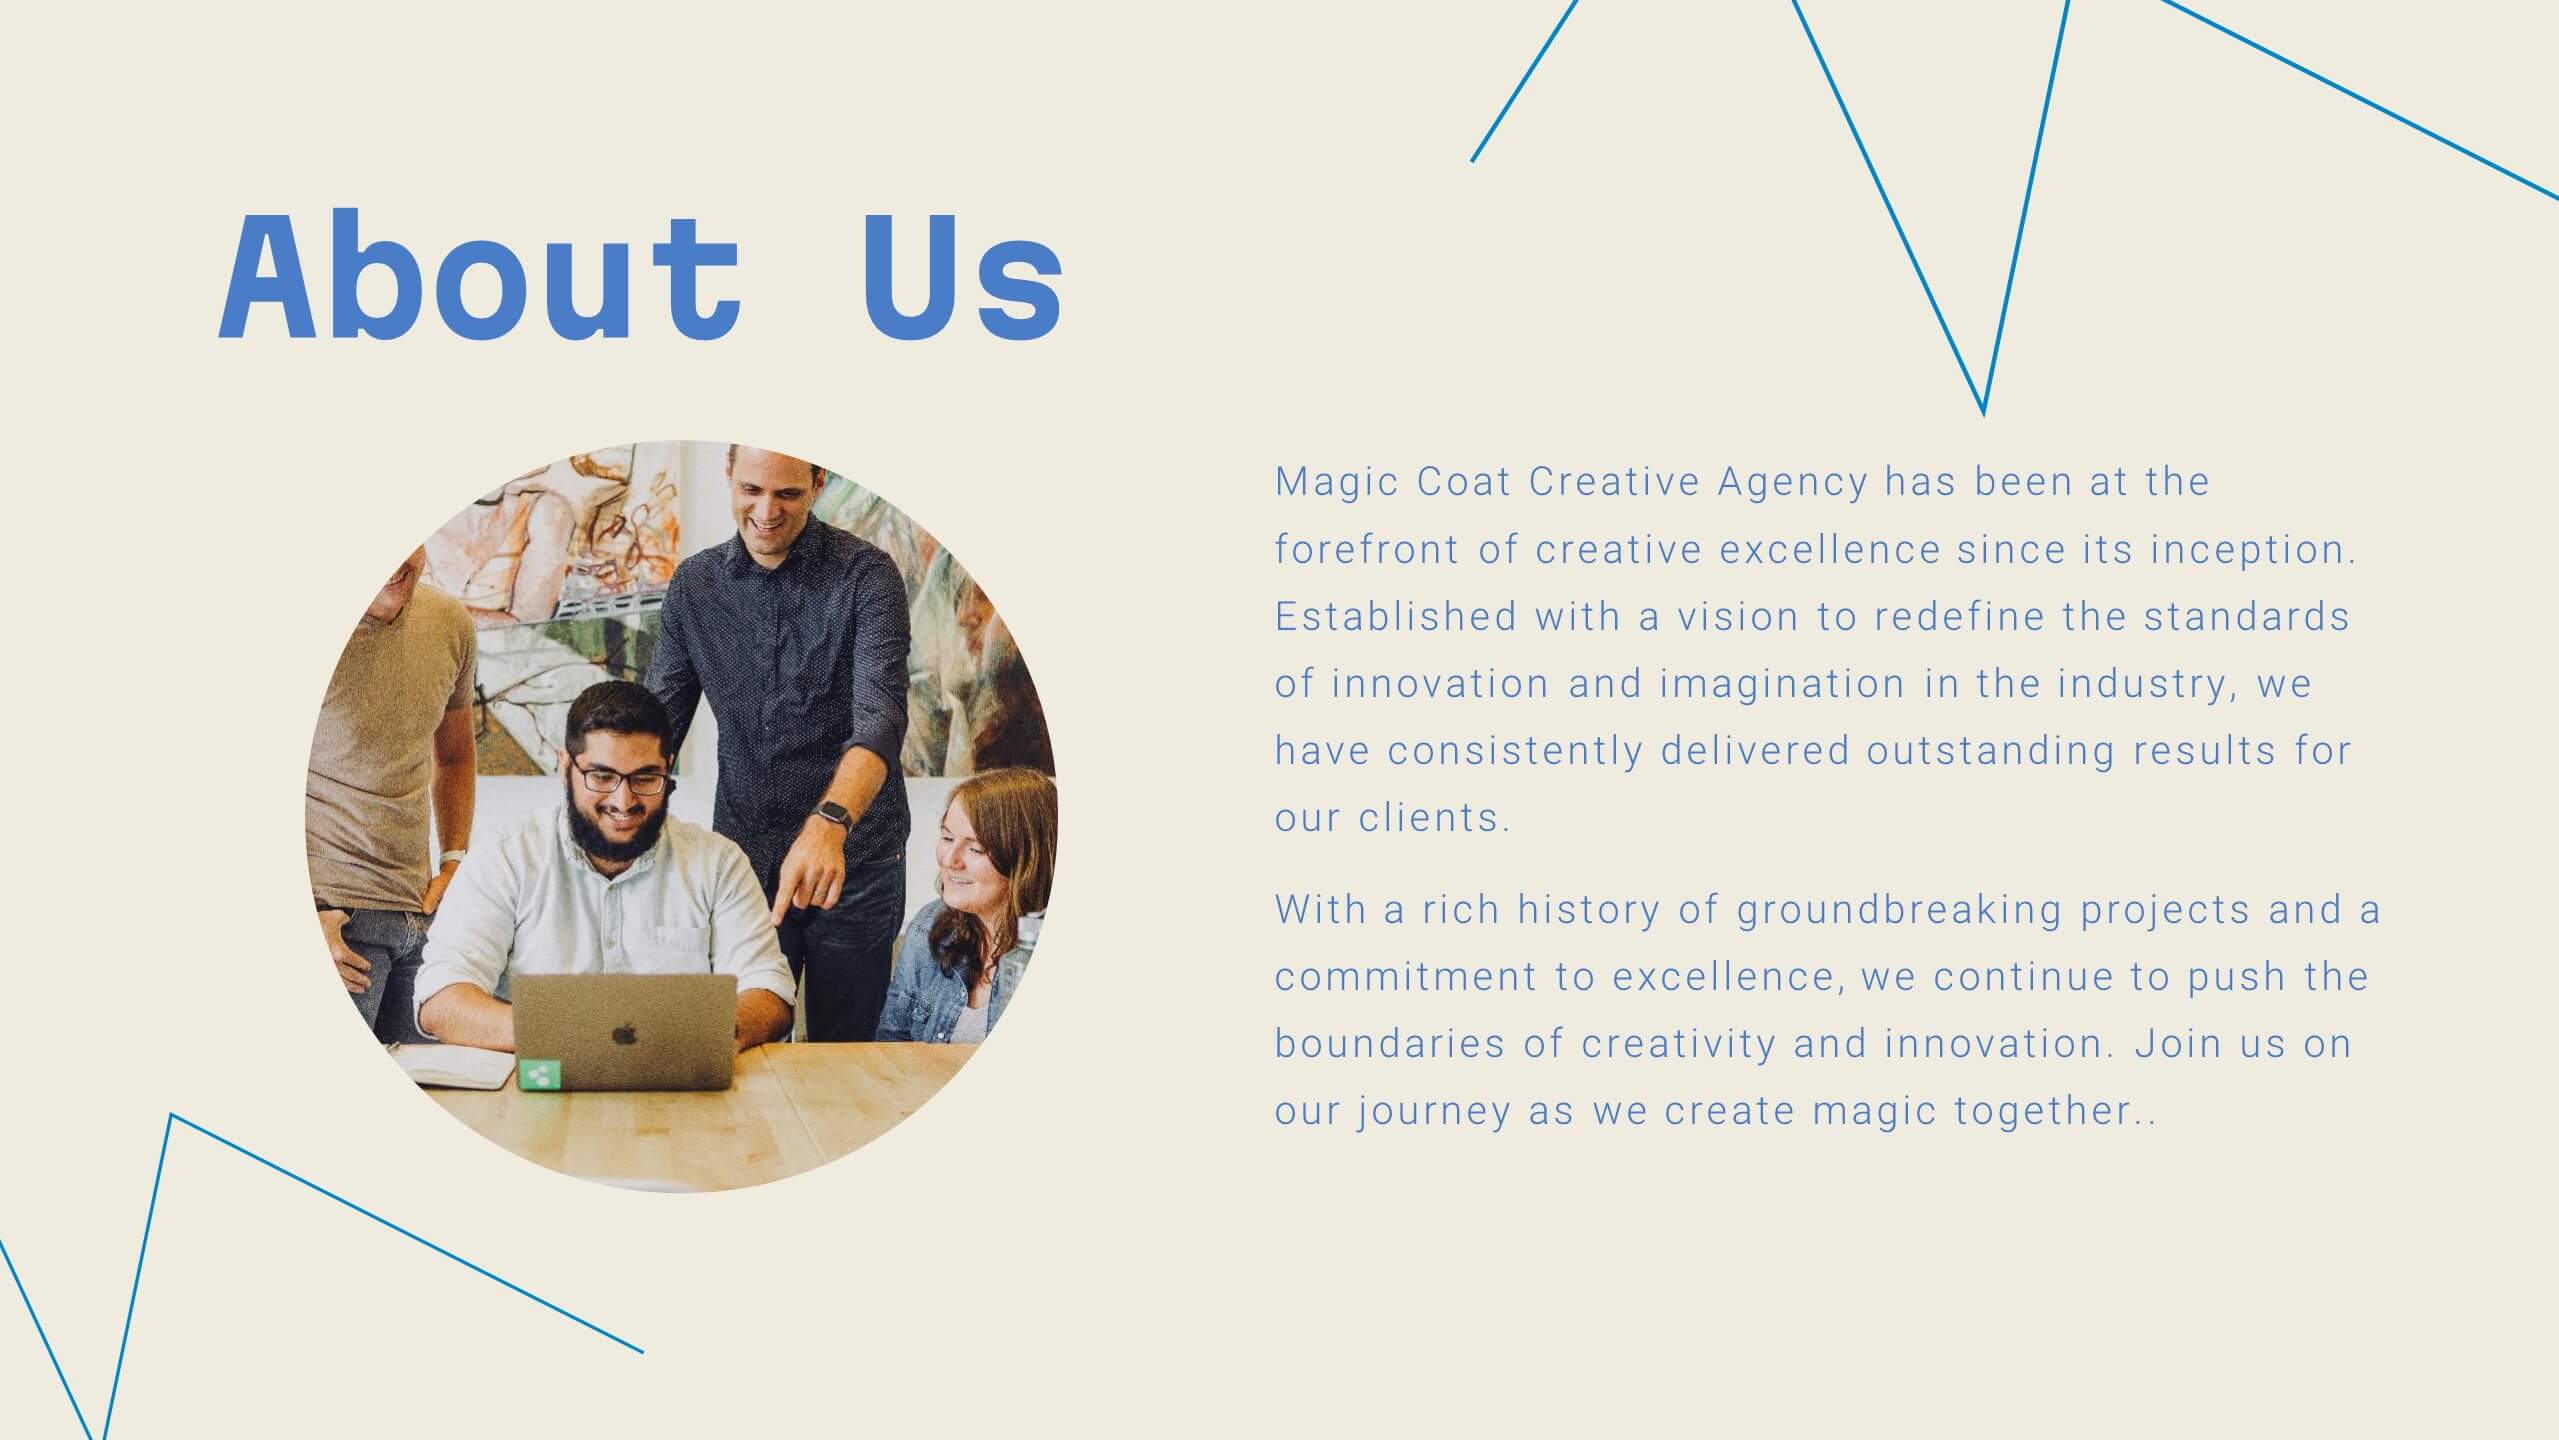
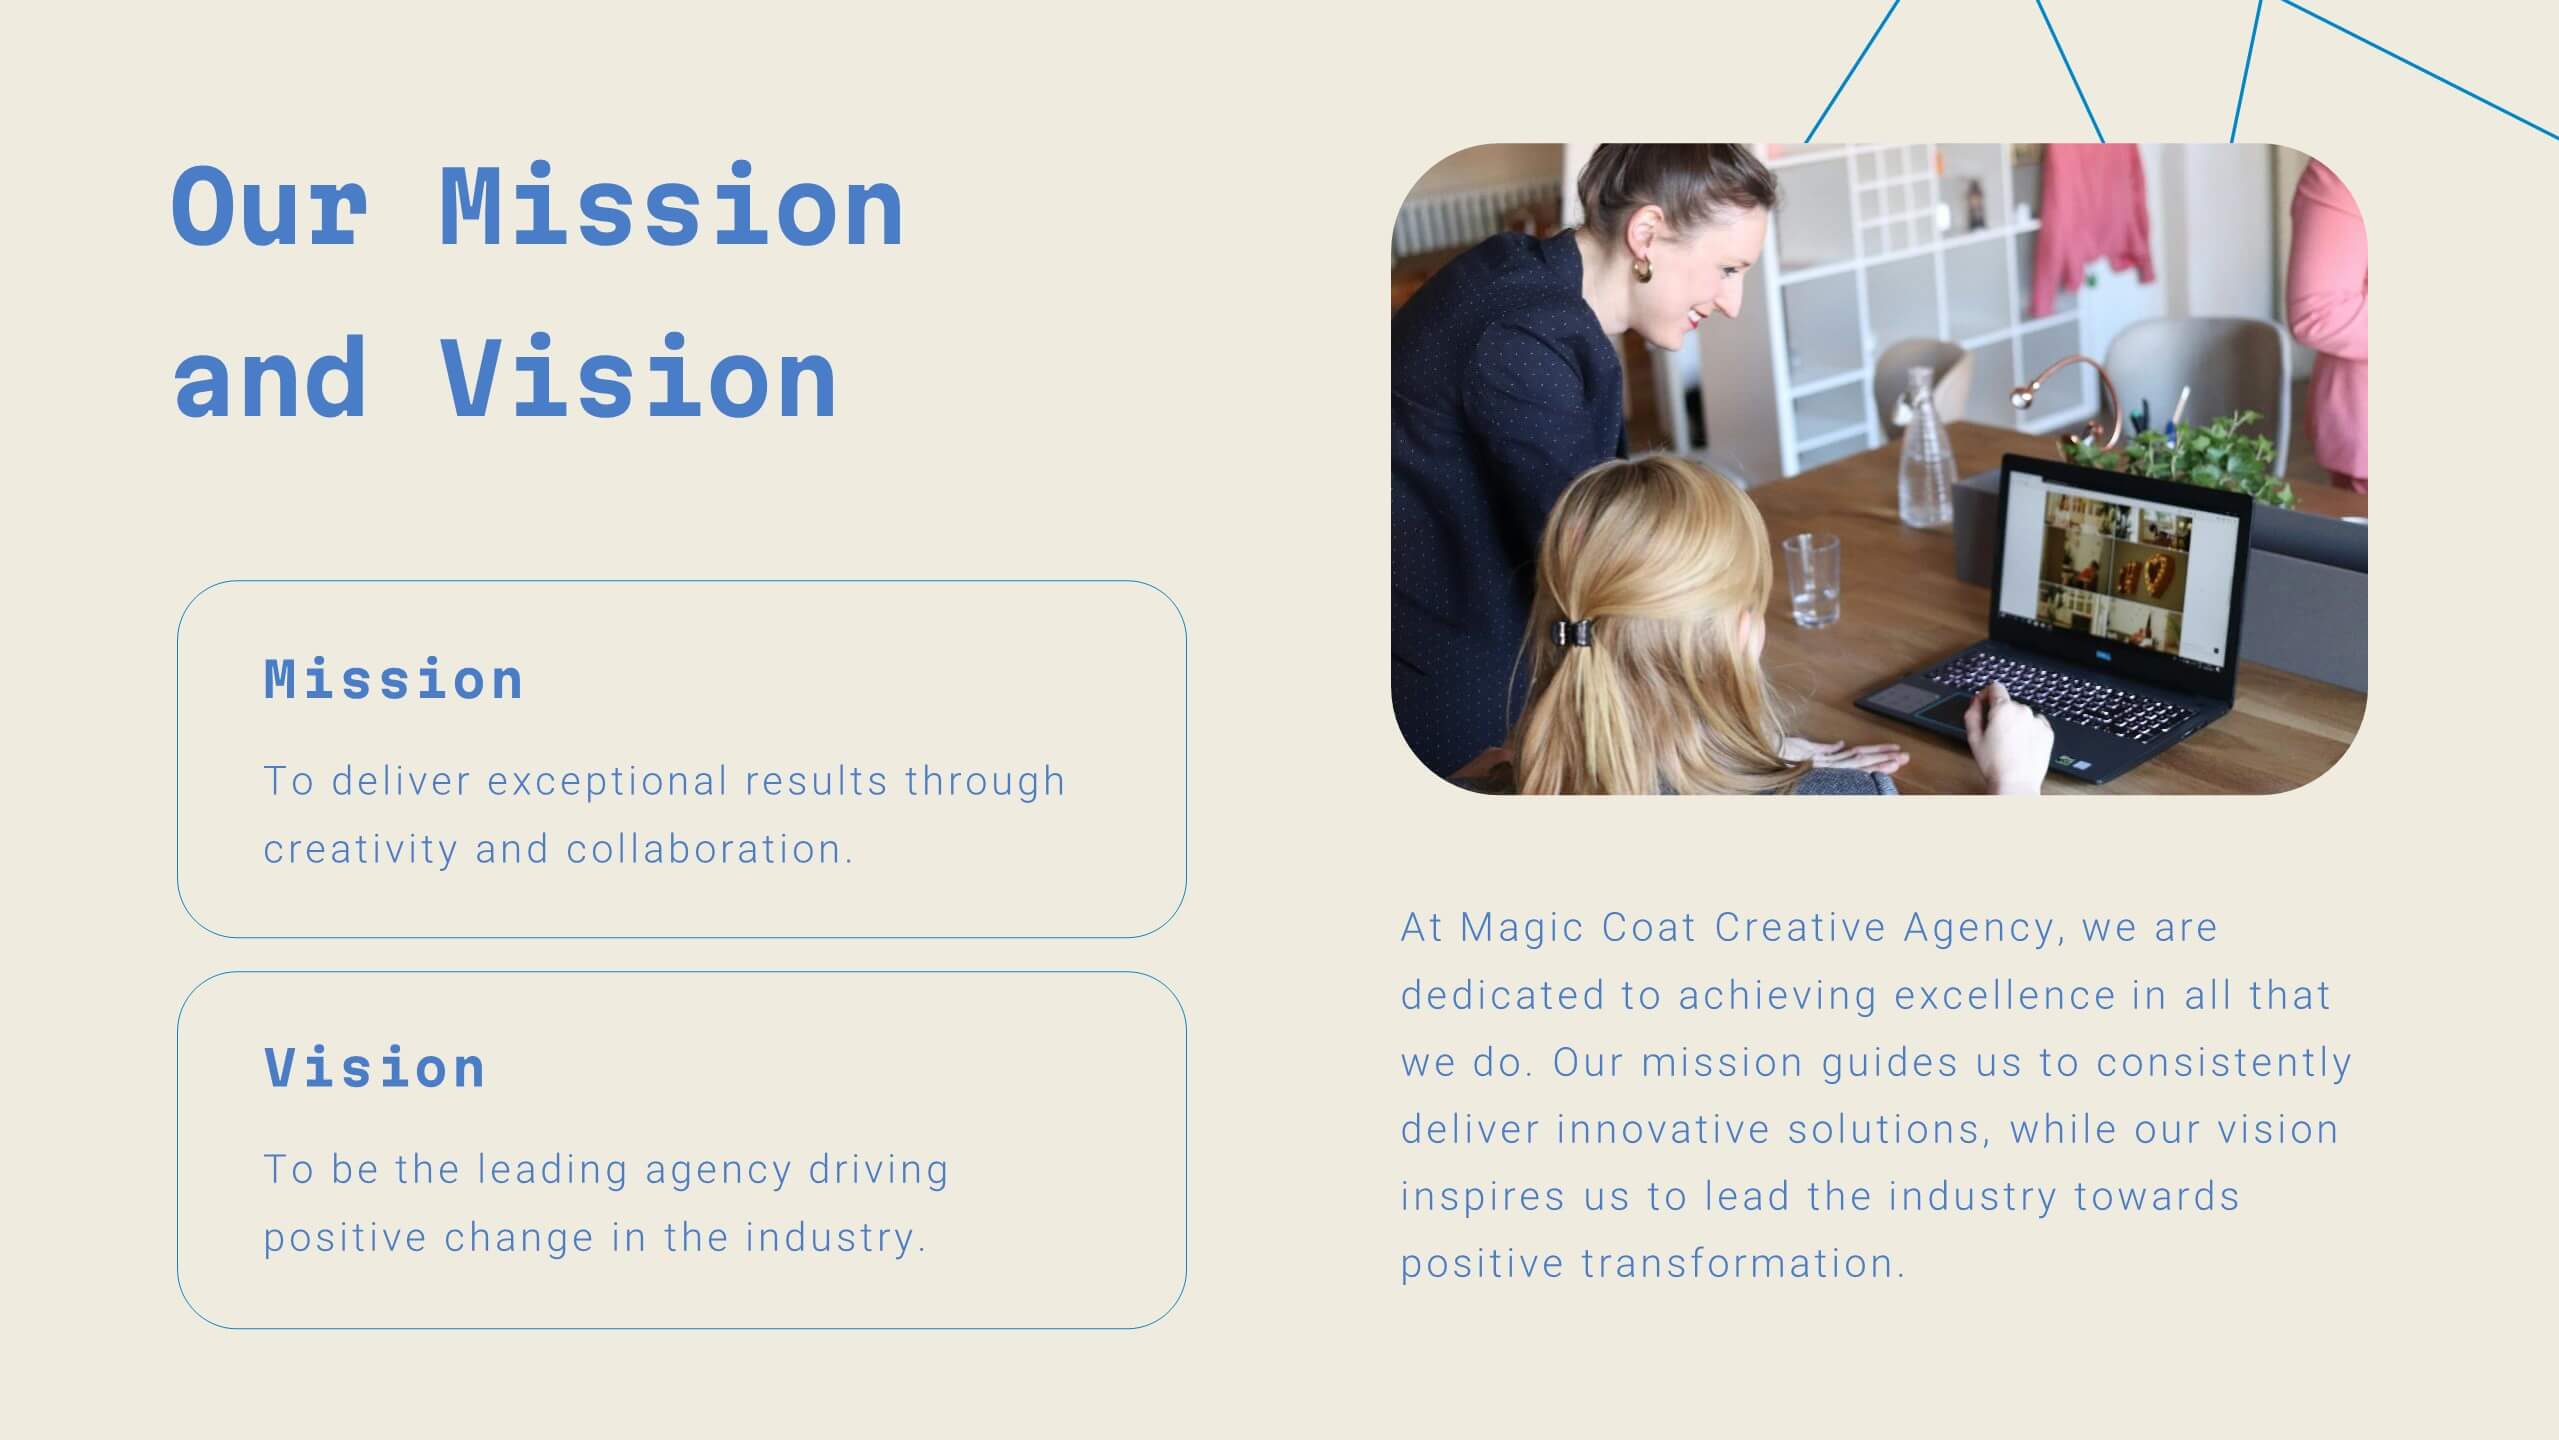
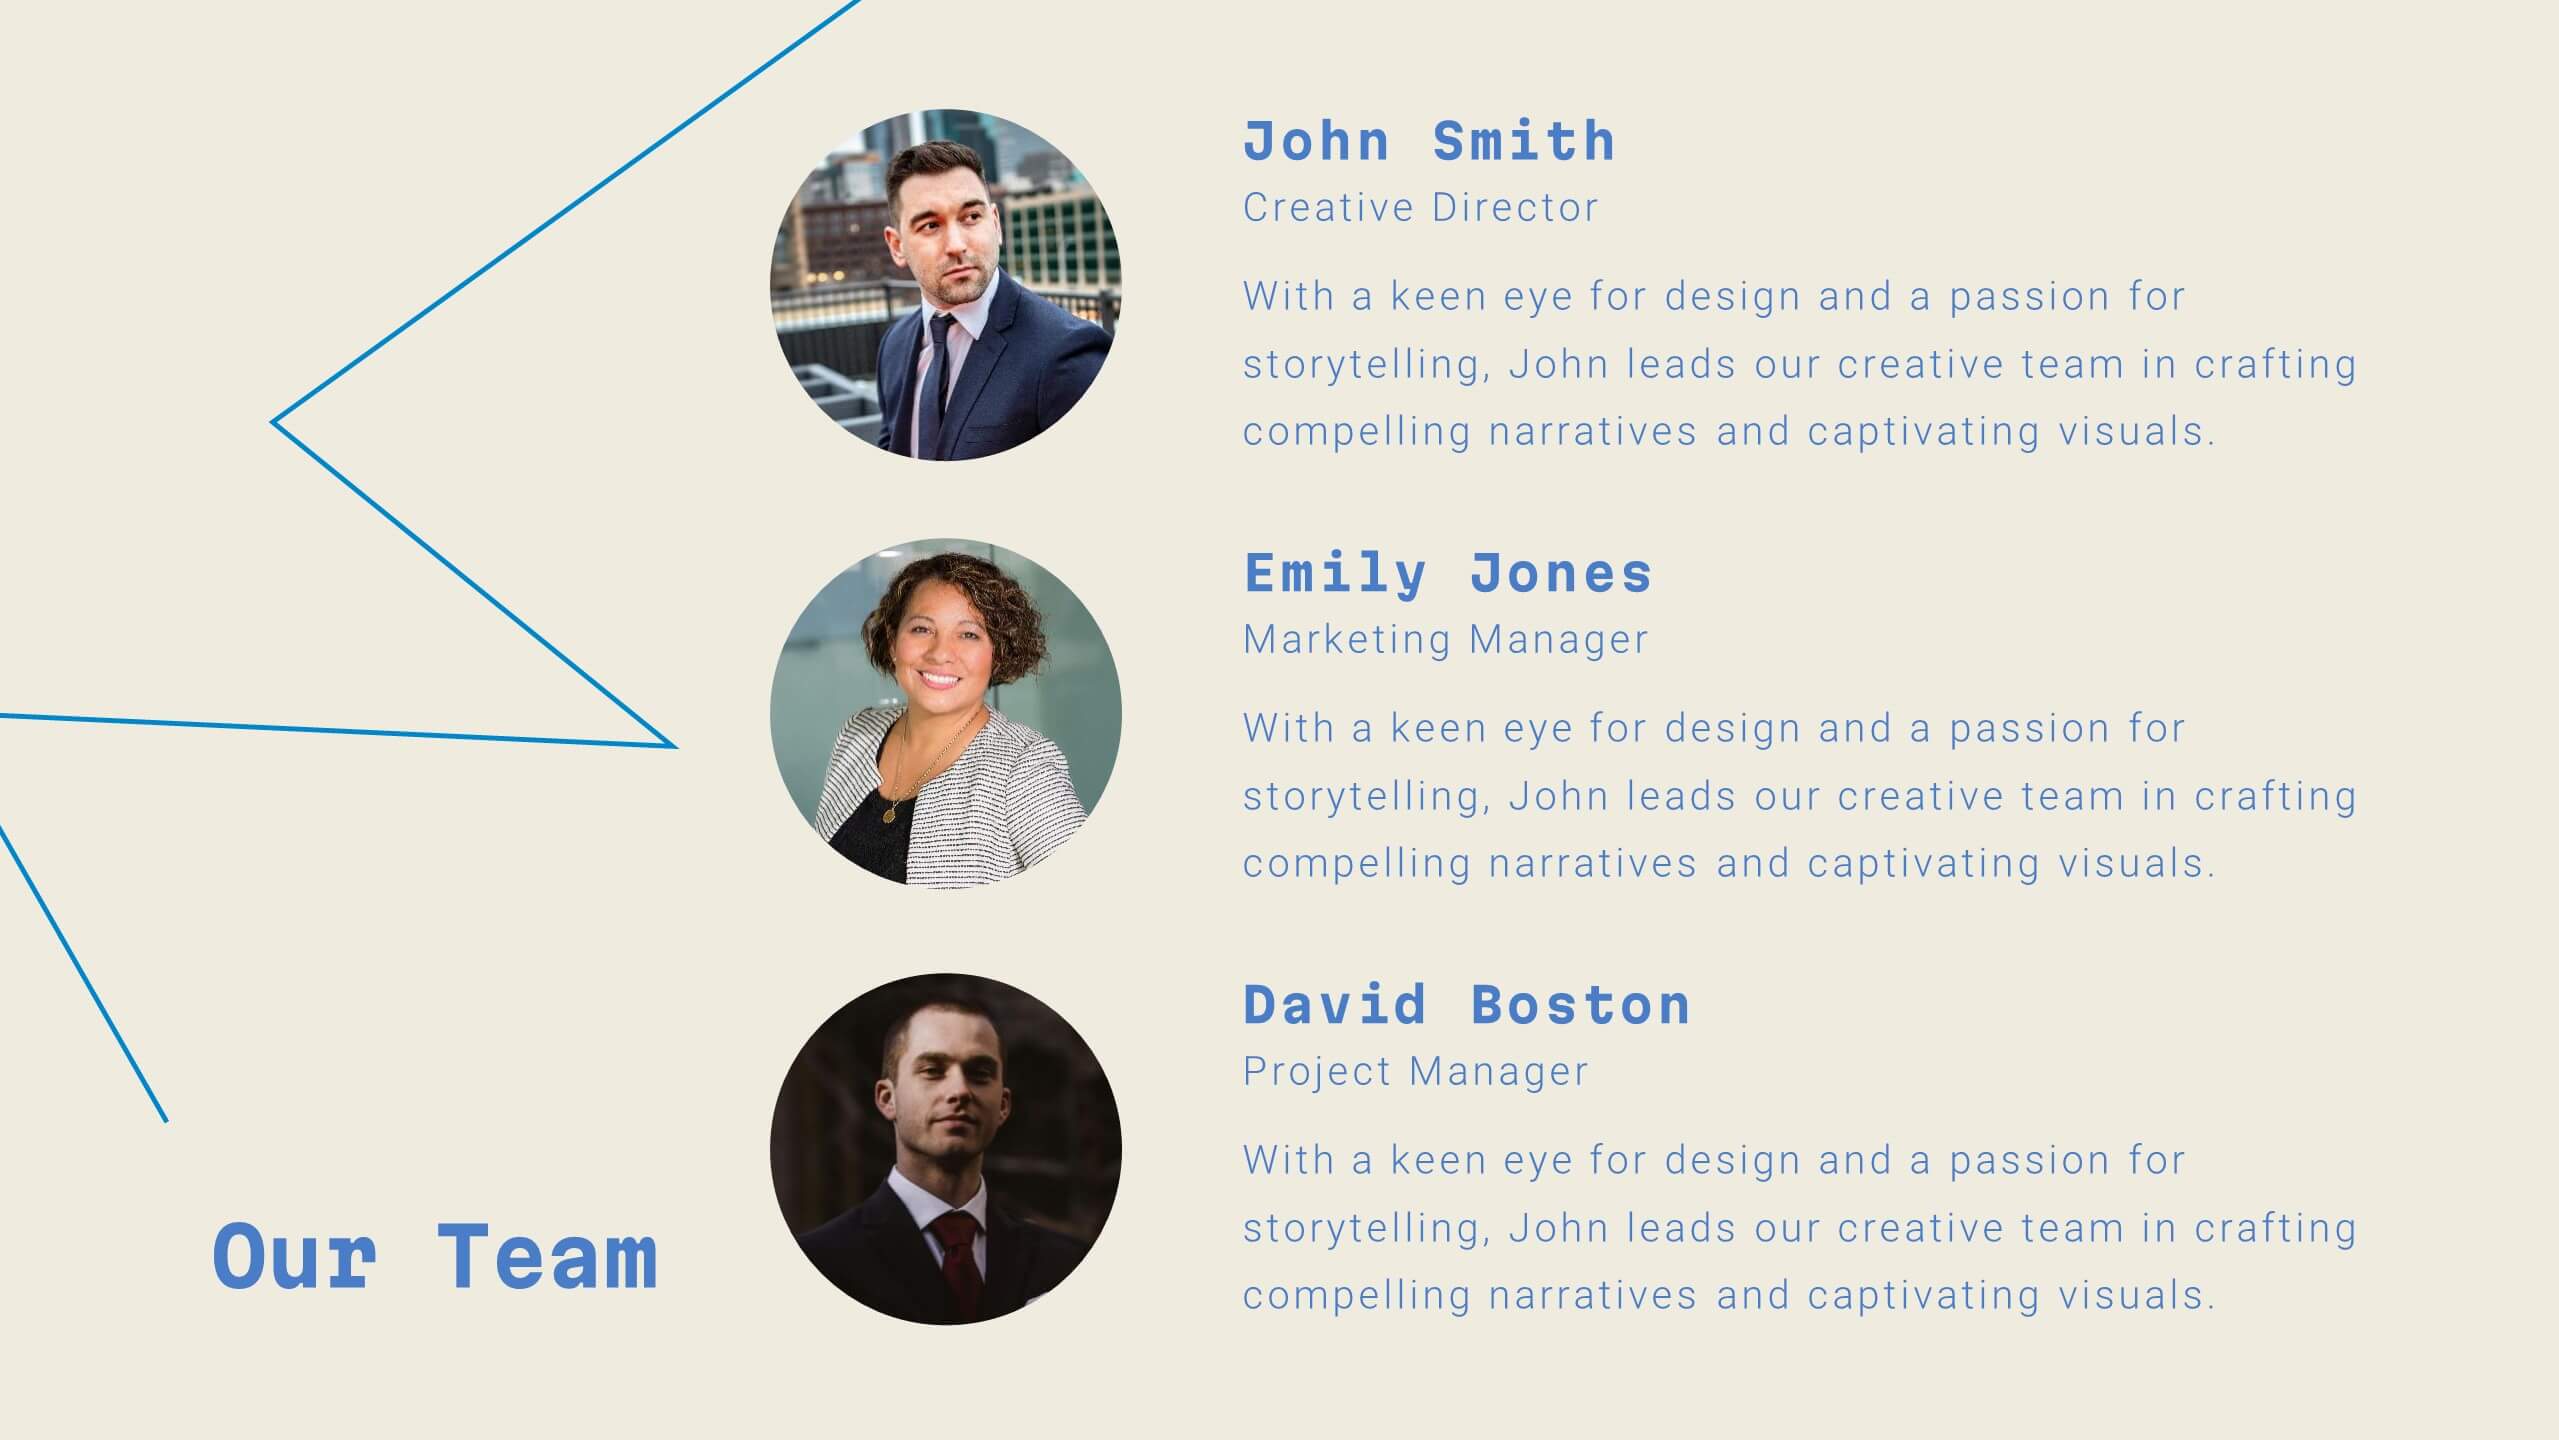
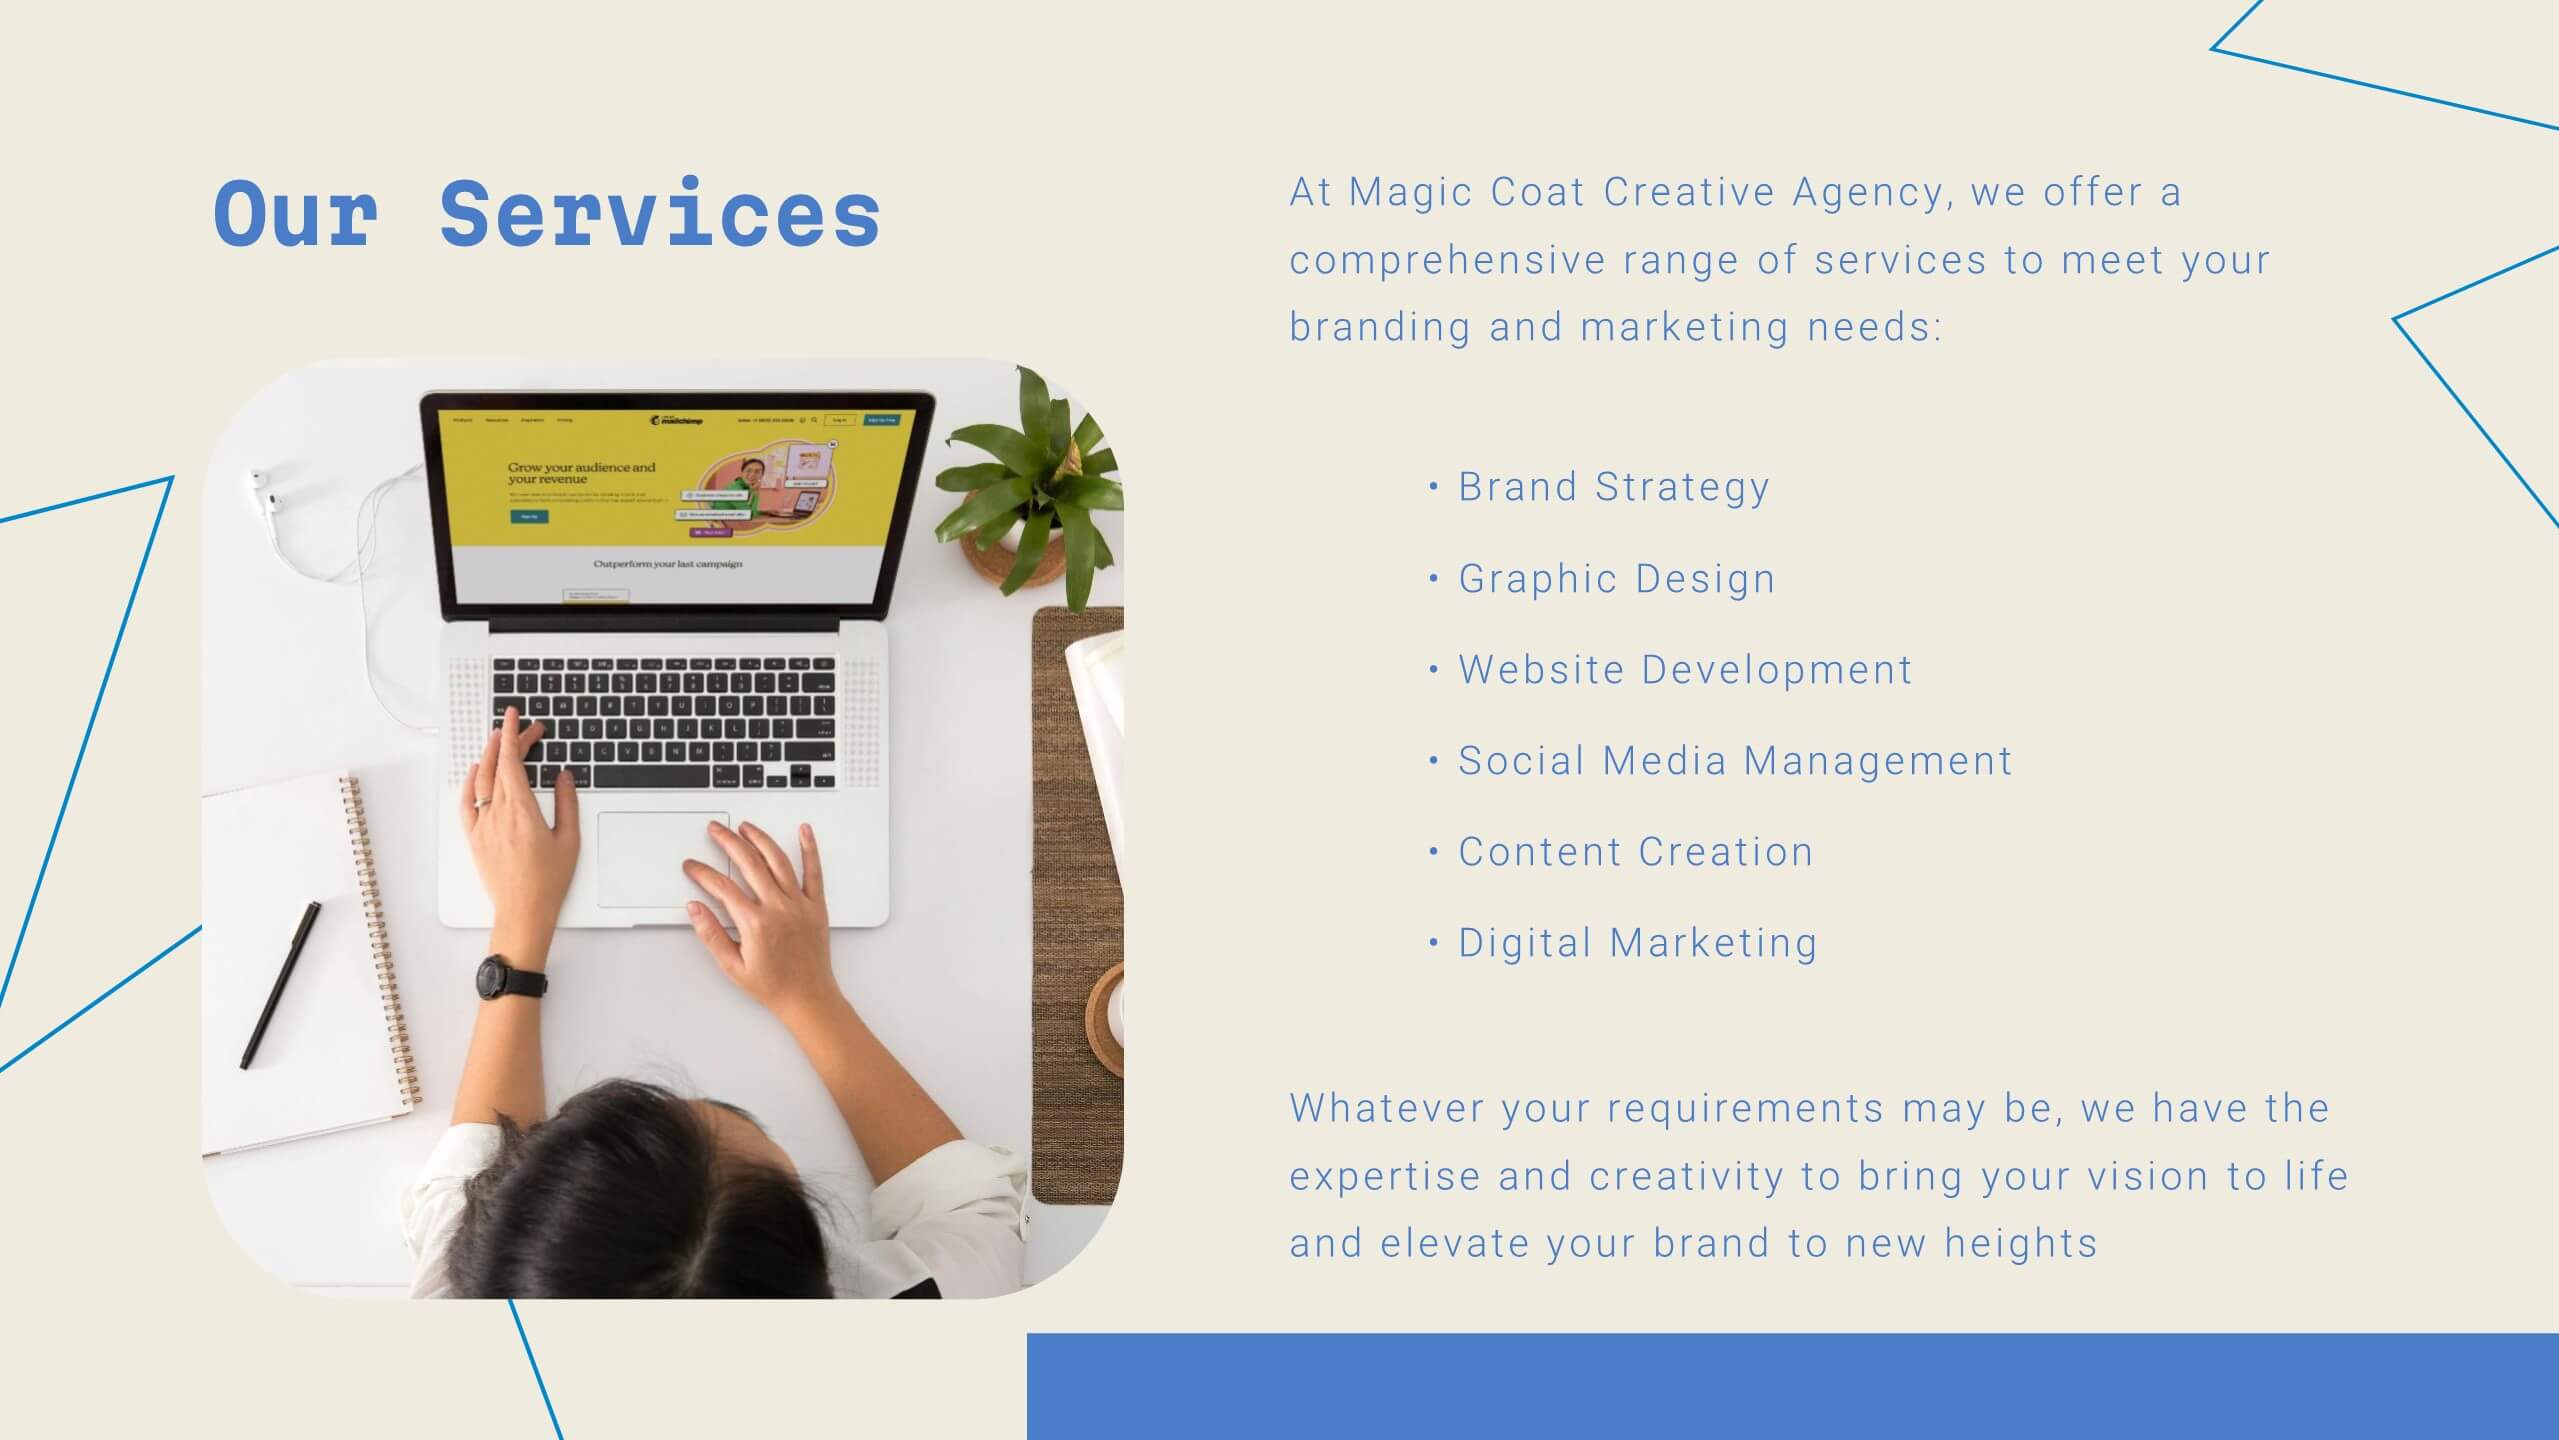
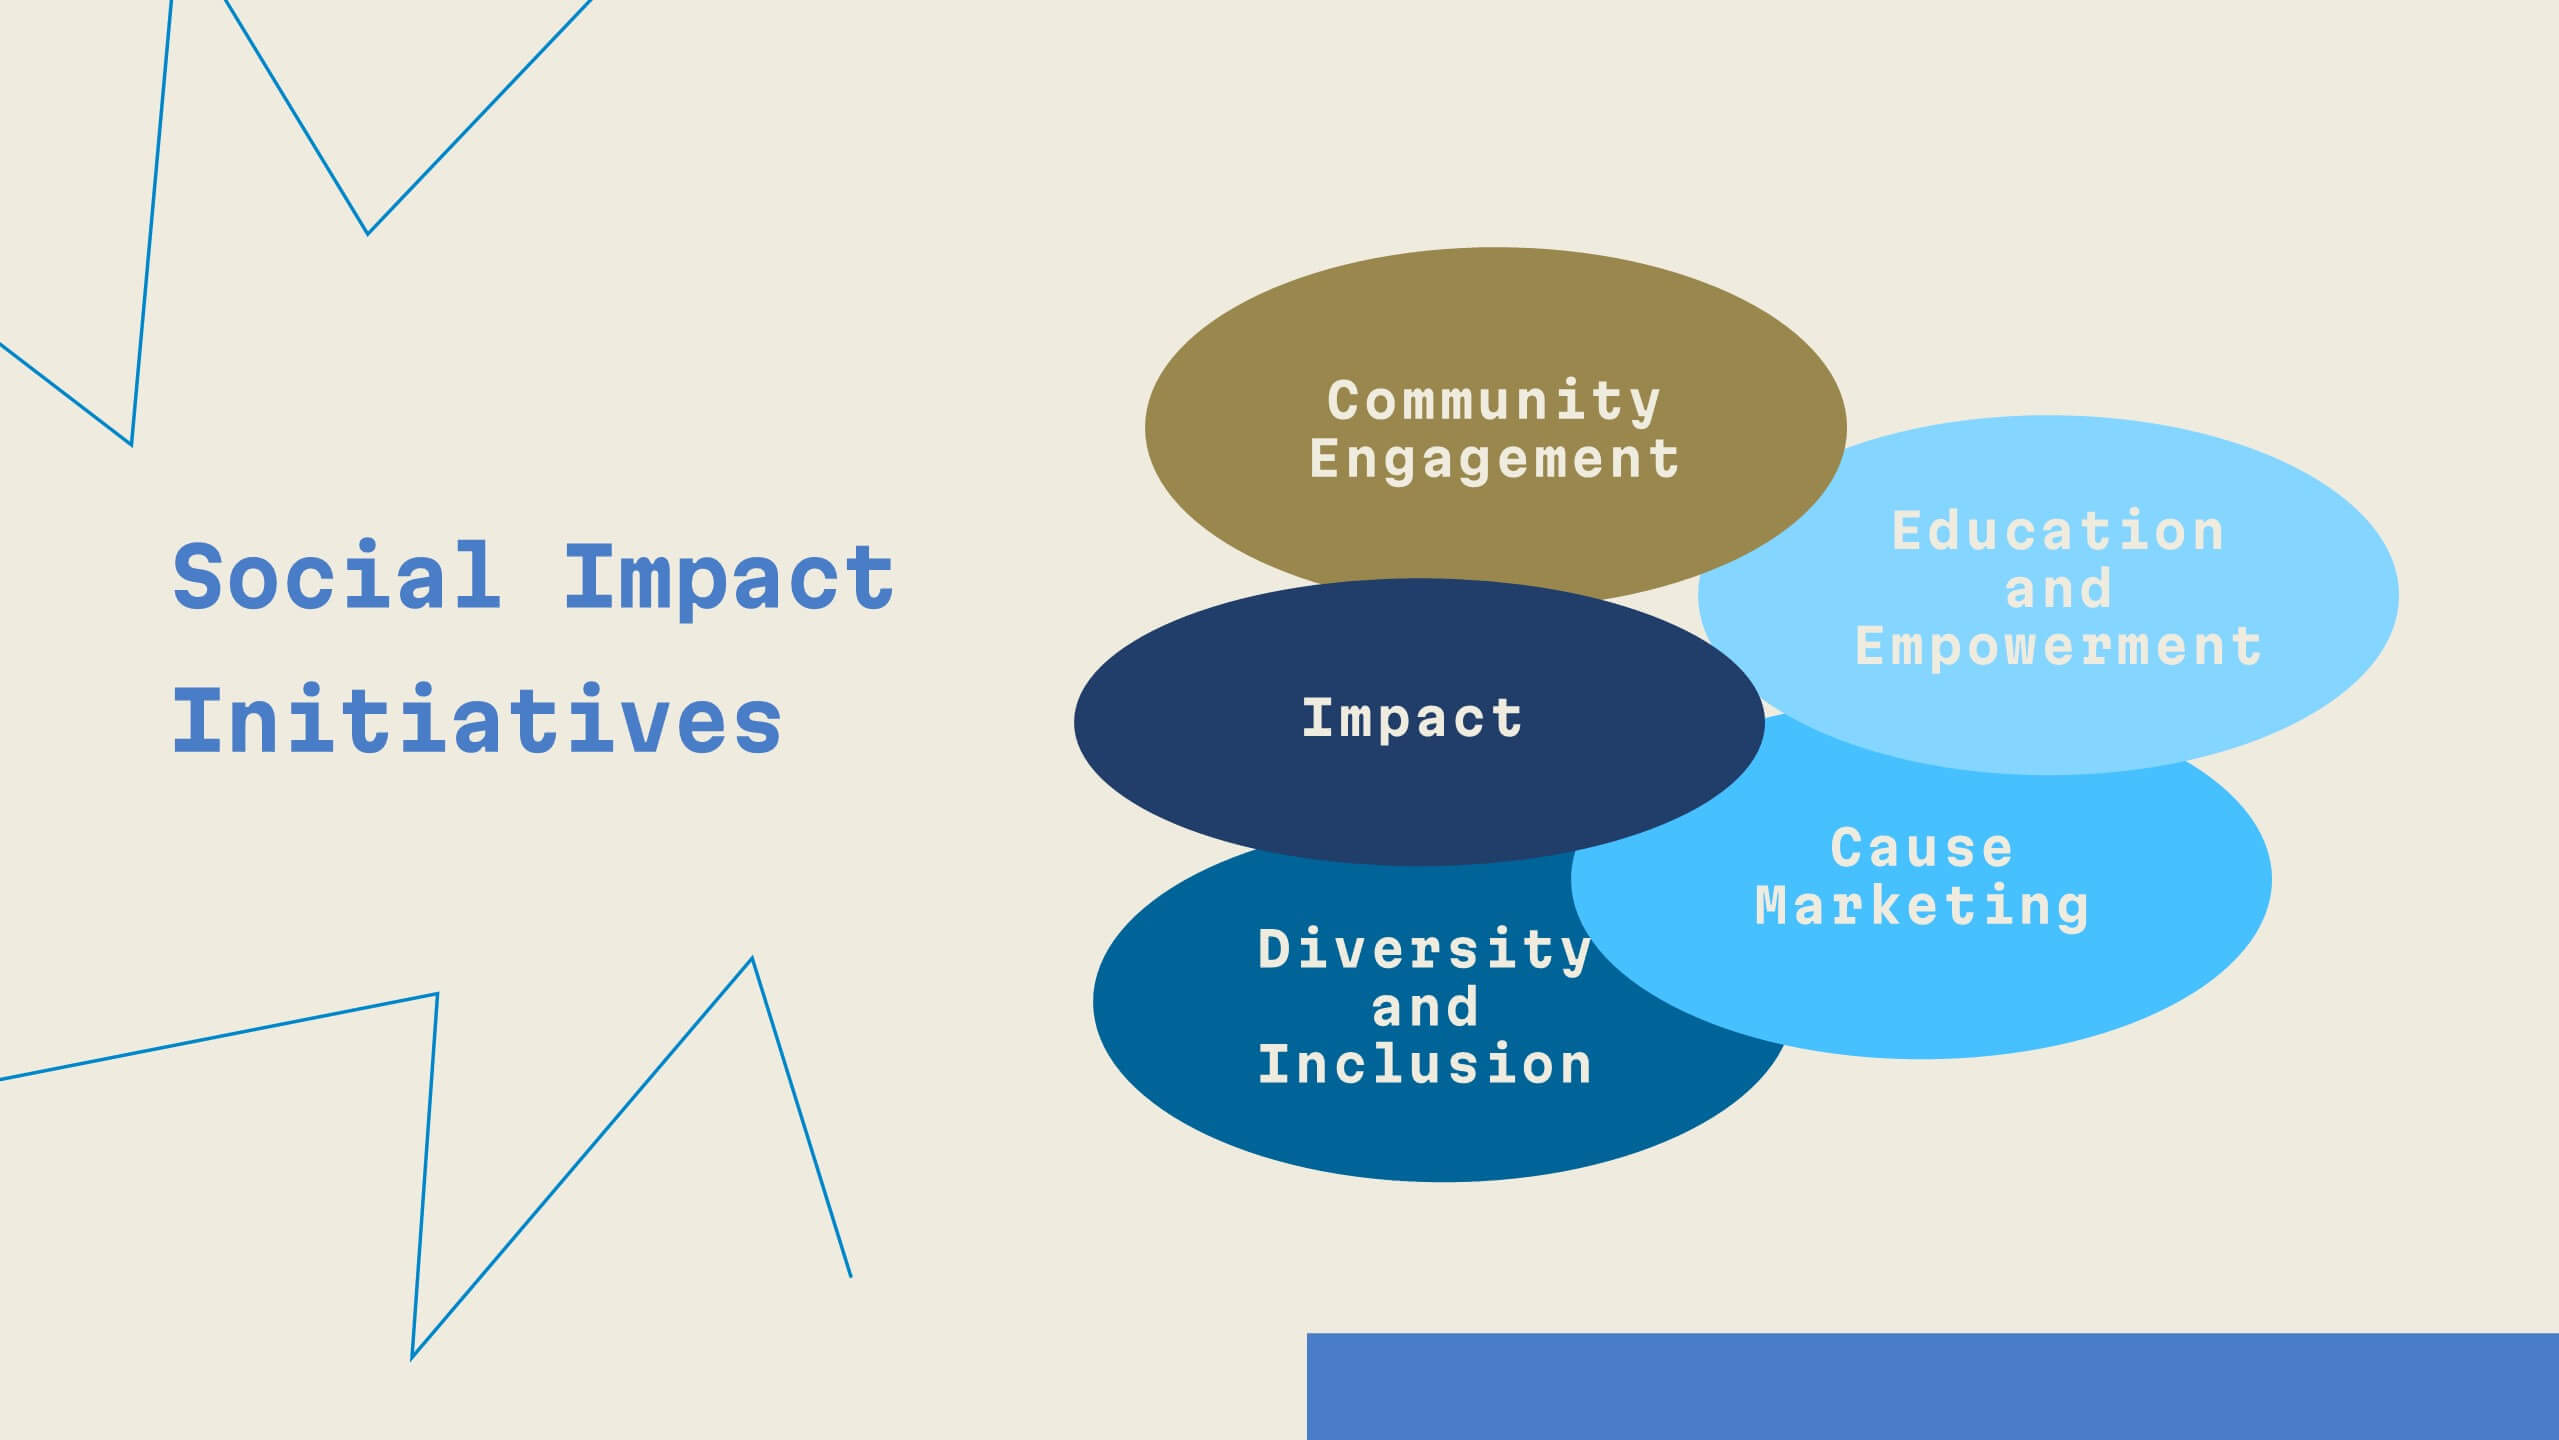
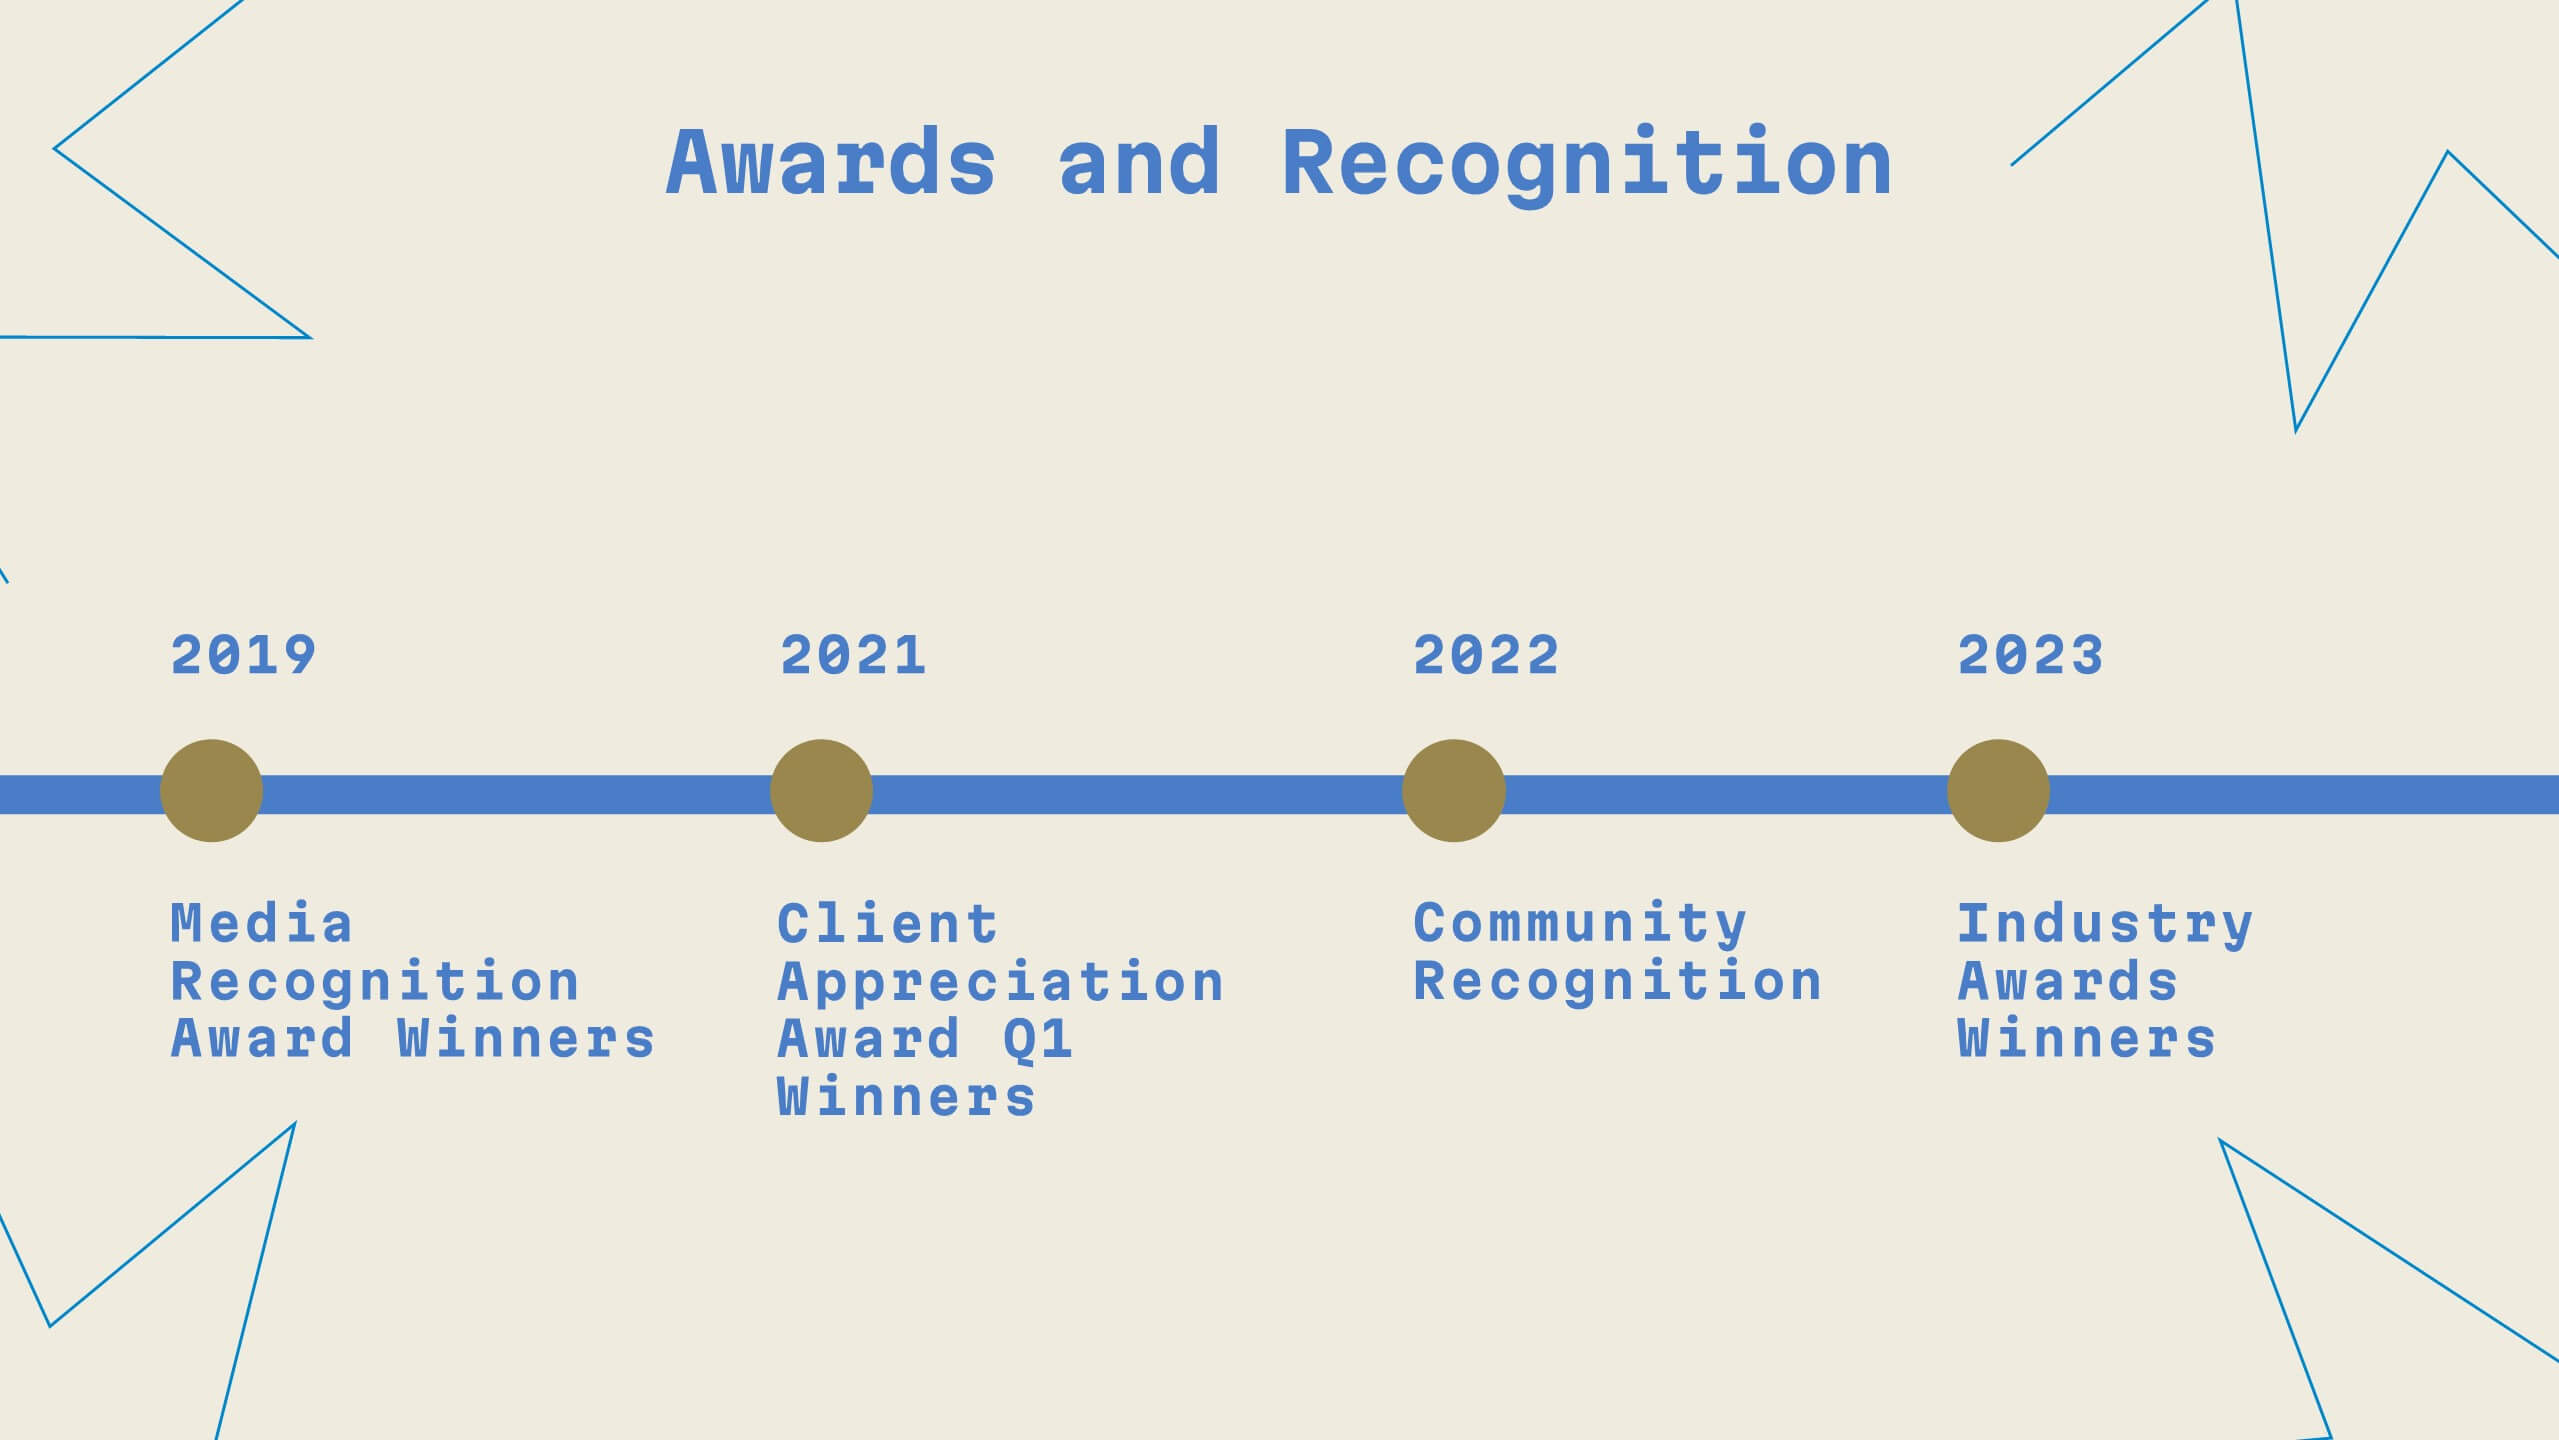
Streamline your pitch process with this no-frills Pitch Deck template, designed for clear communication and powerful impact. From the get-go, the cover slide clearly announces your purpose, inviting audiences into your business narrative. The template smoothly transitions from one slide to the next, each one a stepping stone in building your case — from problem to solution. It includes a neatly organized table of contents, thought-provoking mission and vision statements, and data-rich slides for a deep dive into your business metrics. Each section, marked with bold, numbered headers, keeps your presentation on track and your audience engaged. A final 'Thank You' slide adds a touch of professionalism, and the credits section ensures that your sources are transparently acknowledged. This pitch deck is ideal for startups and businesses looking to capture attention and convey their story succinctly.
22 diapositivas
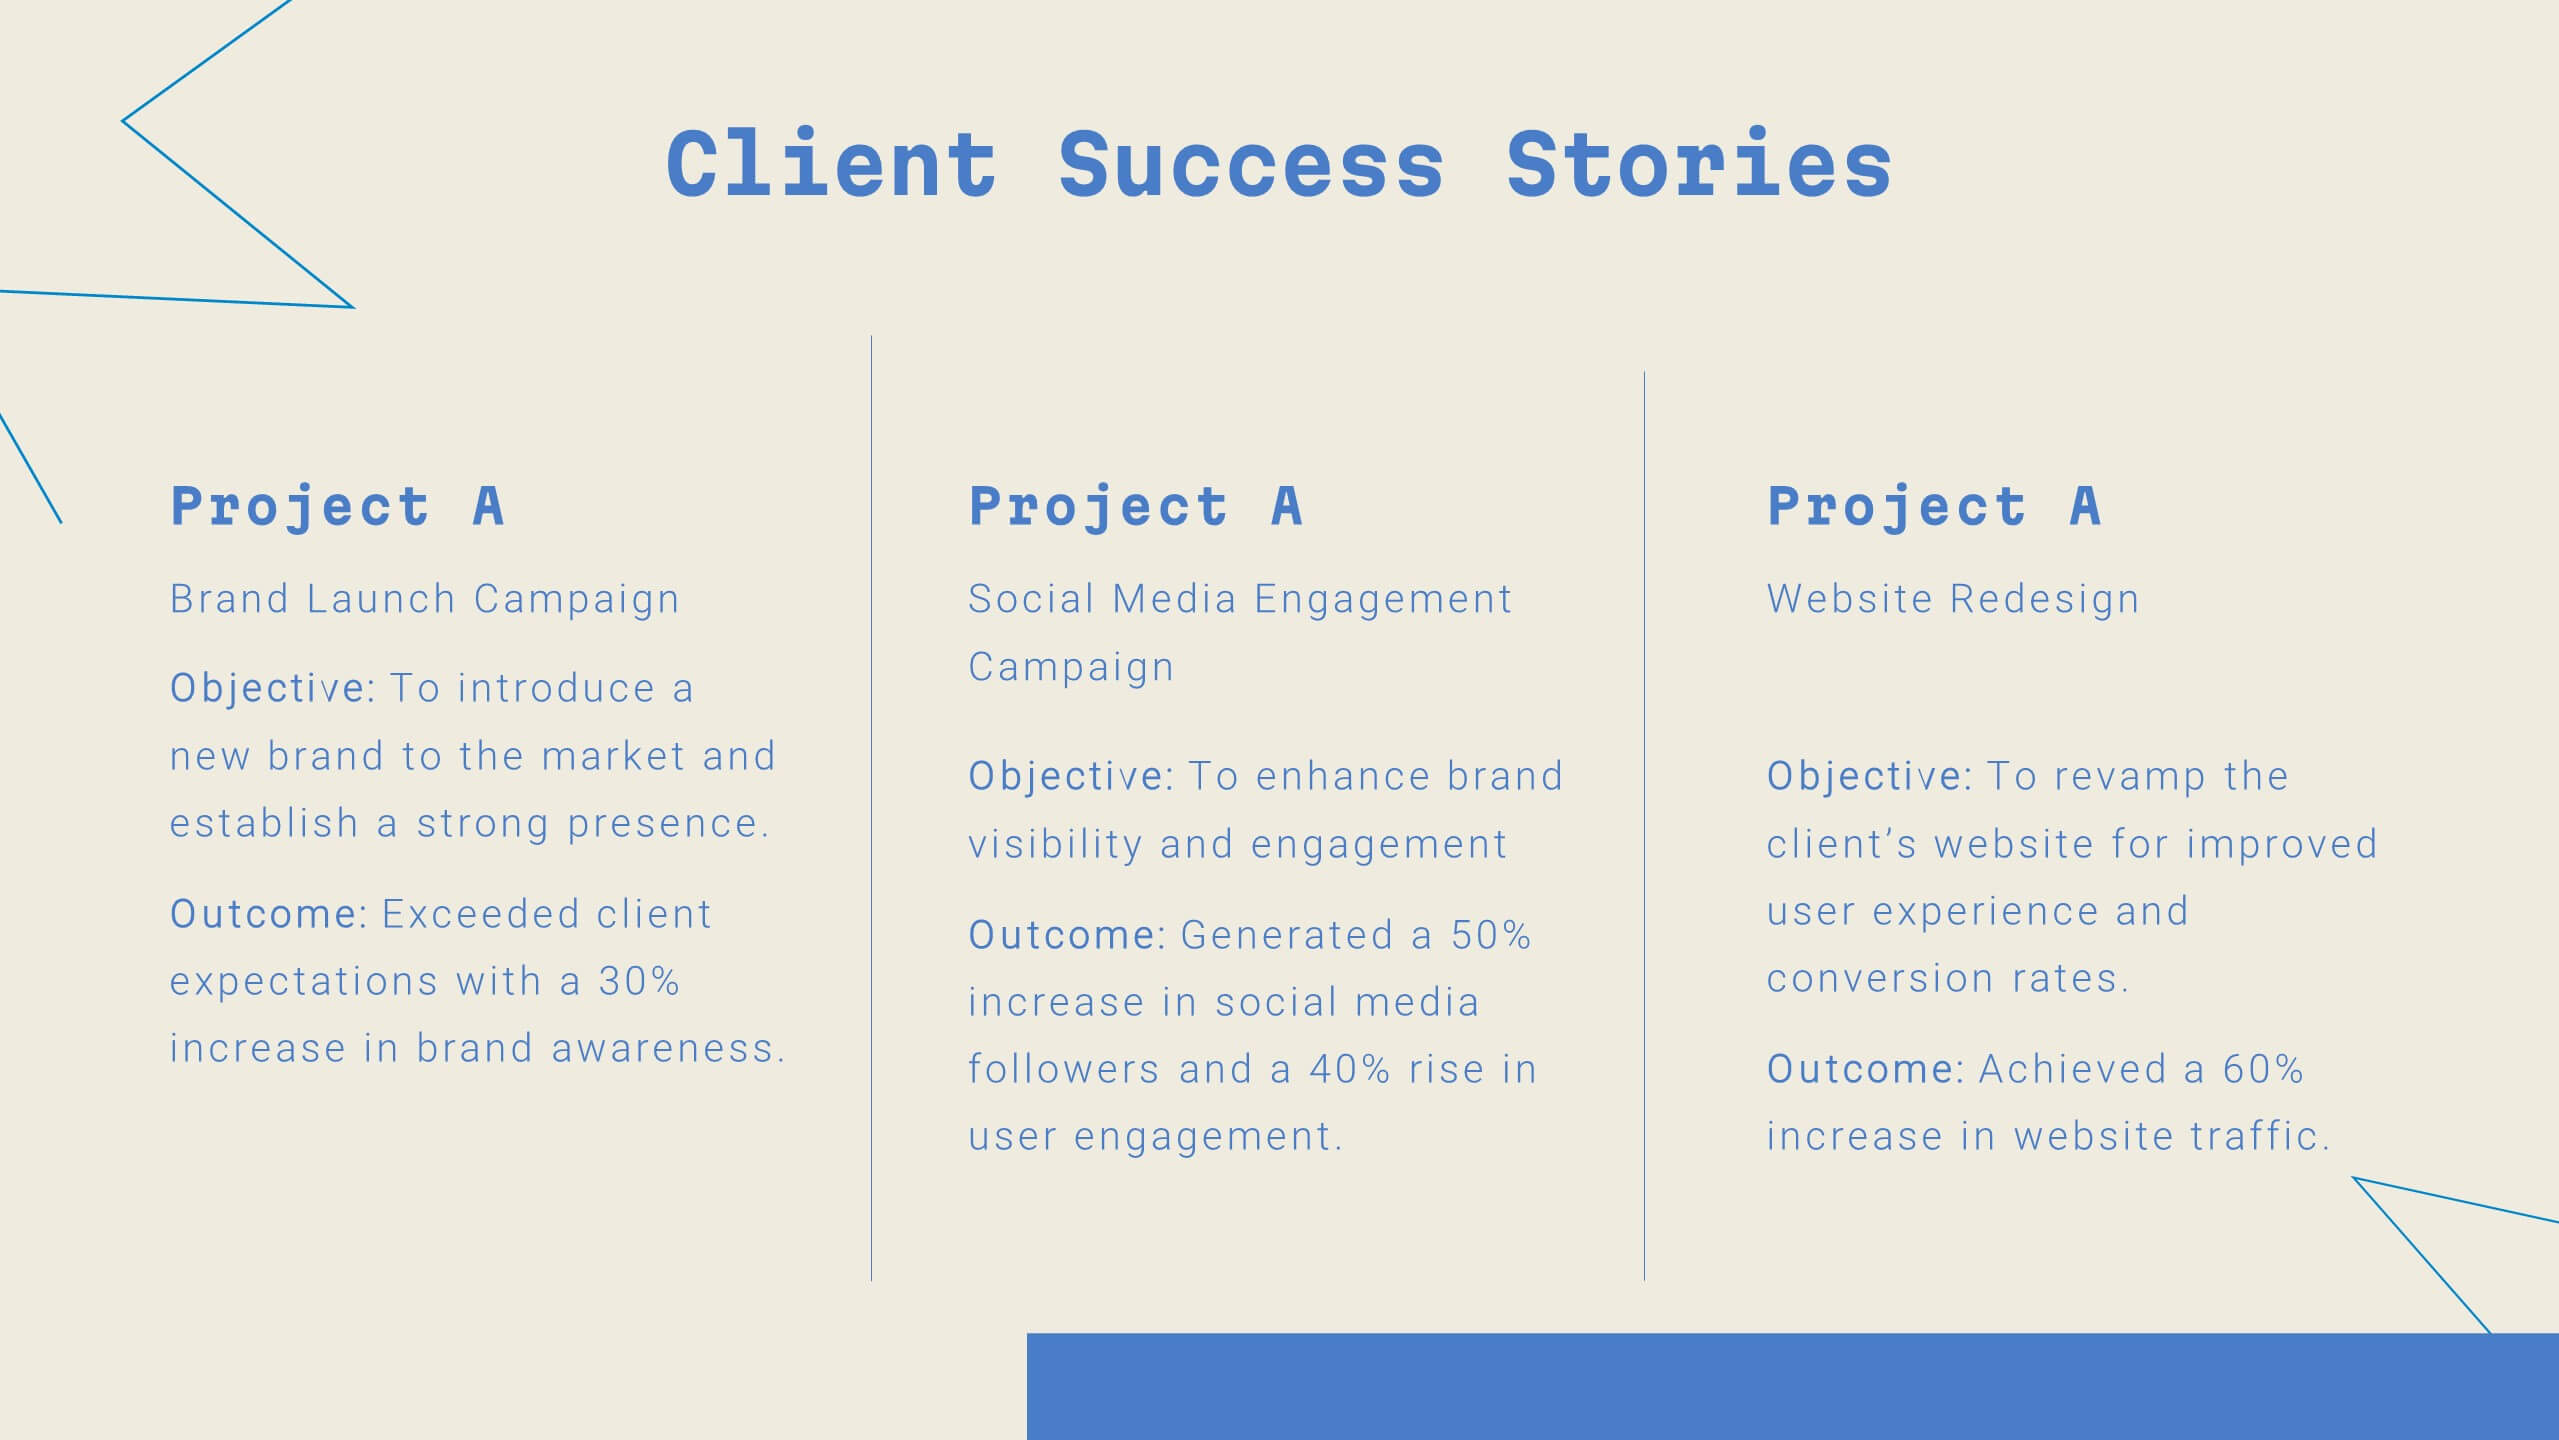
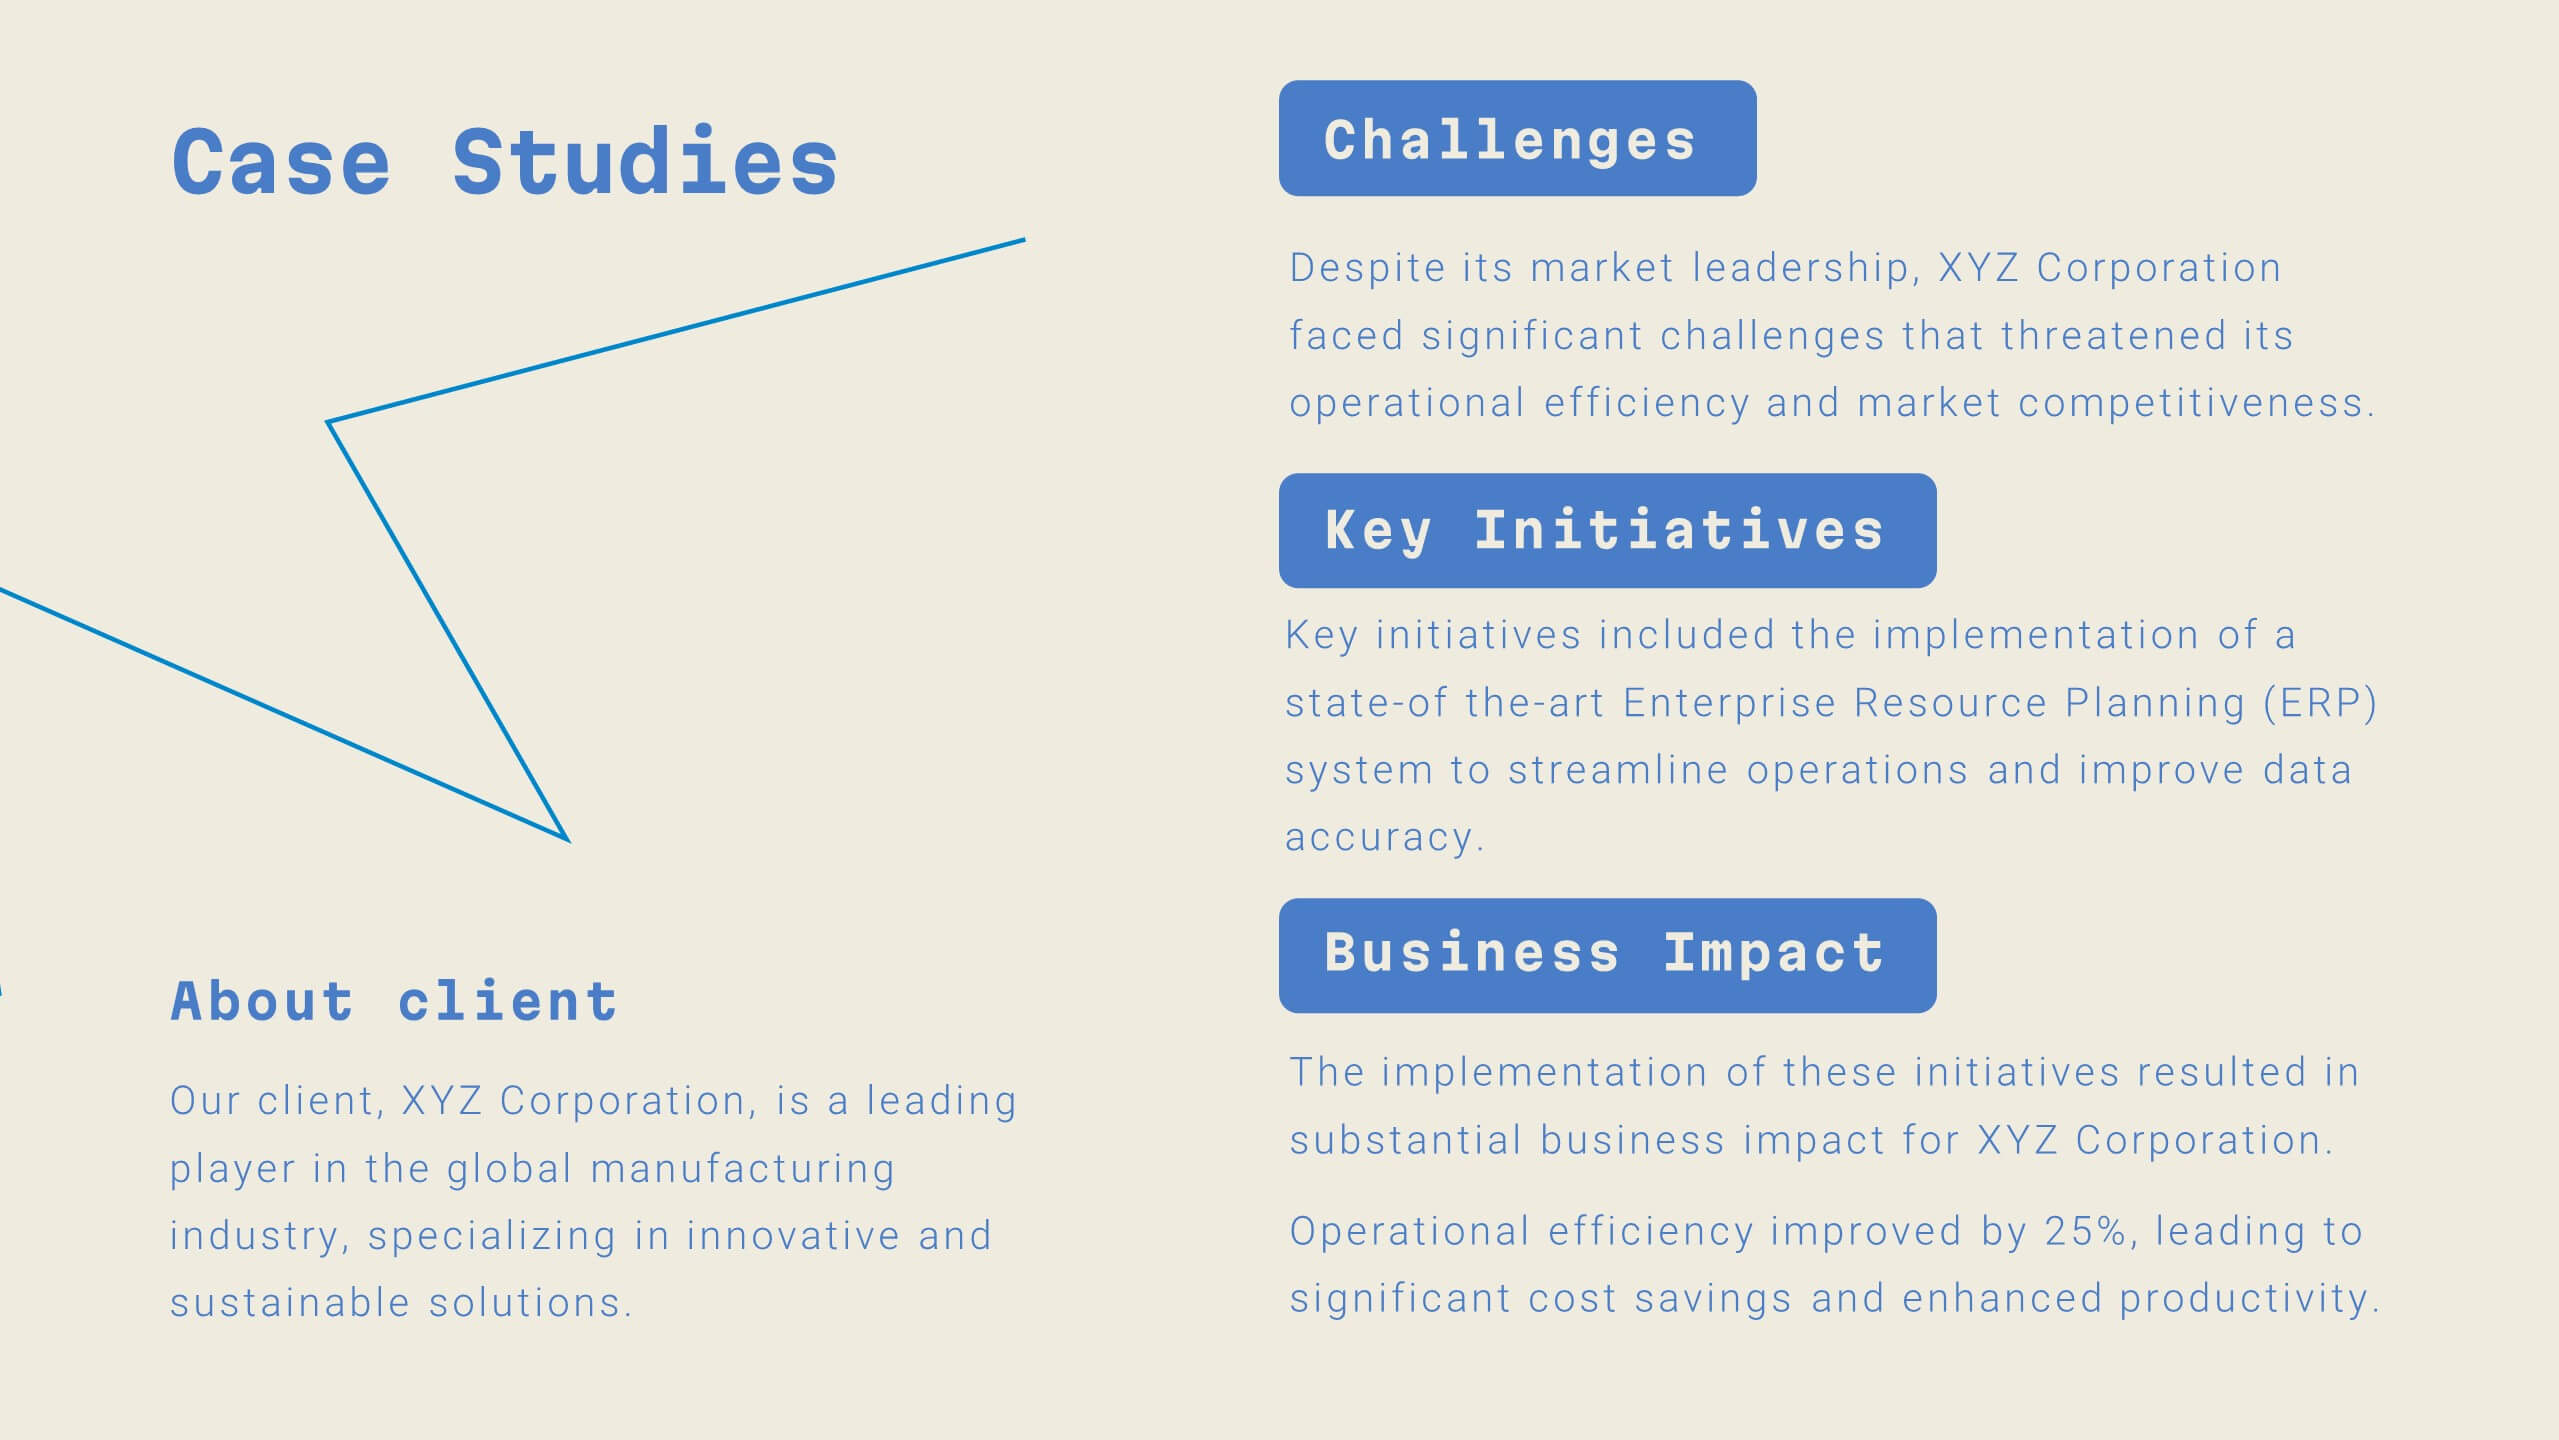
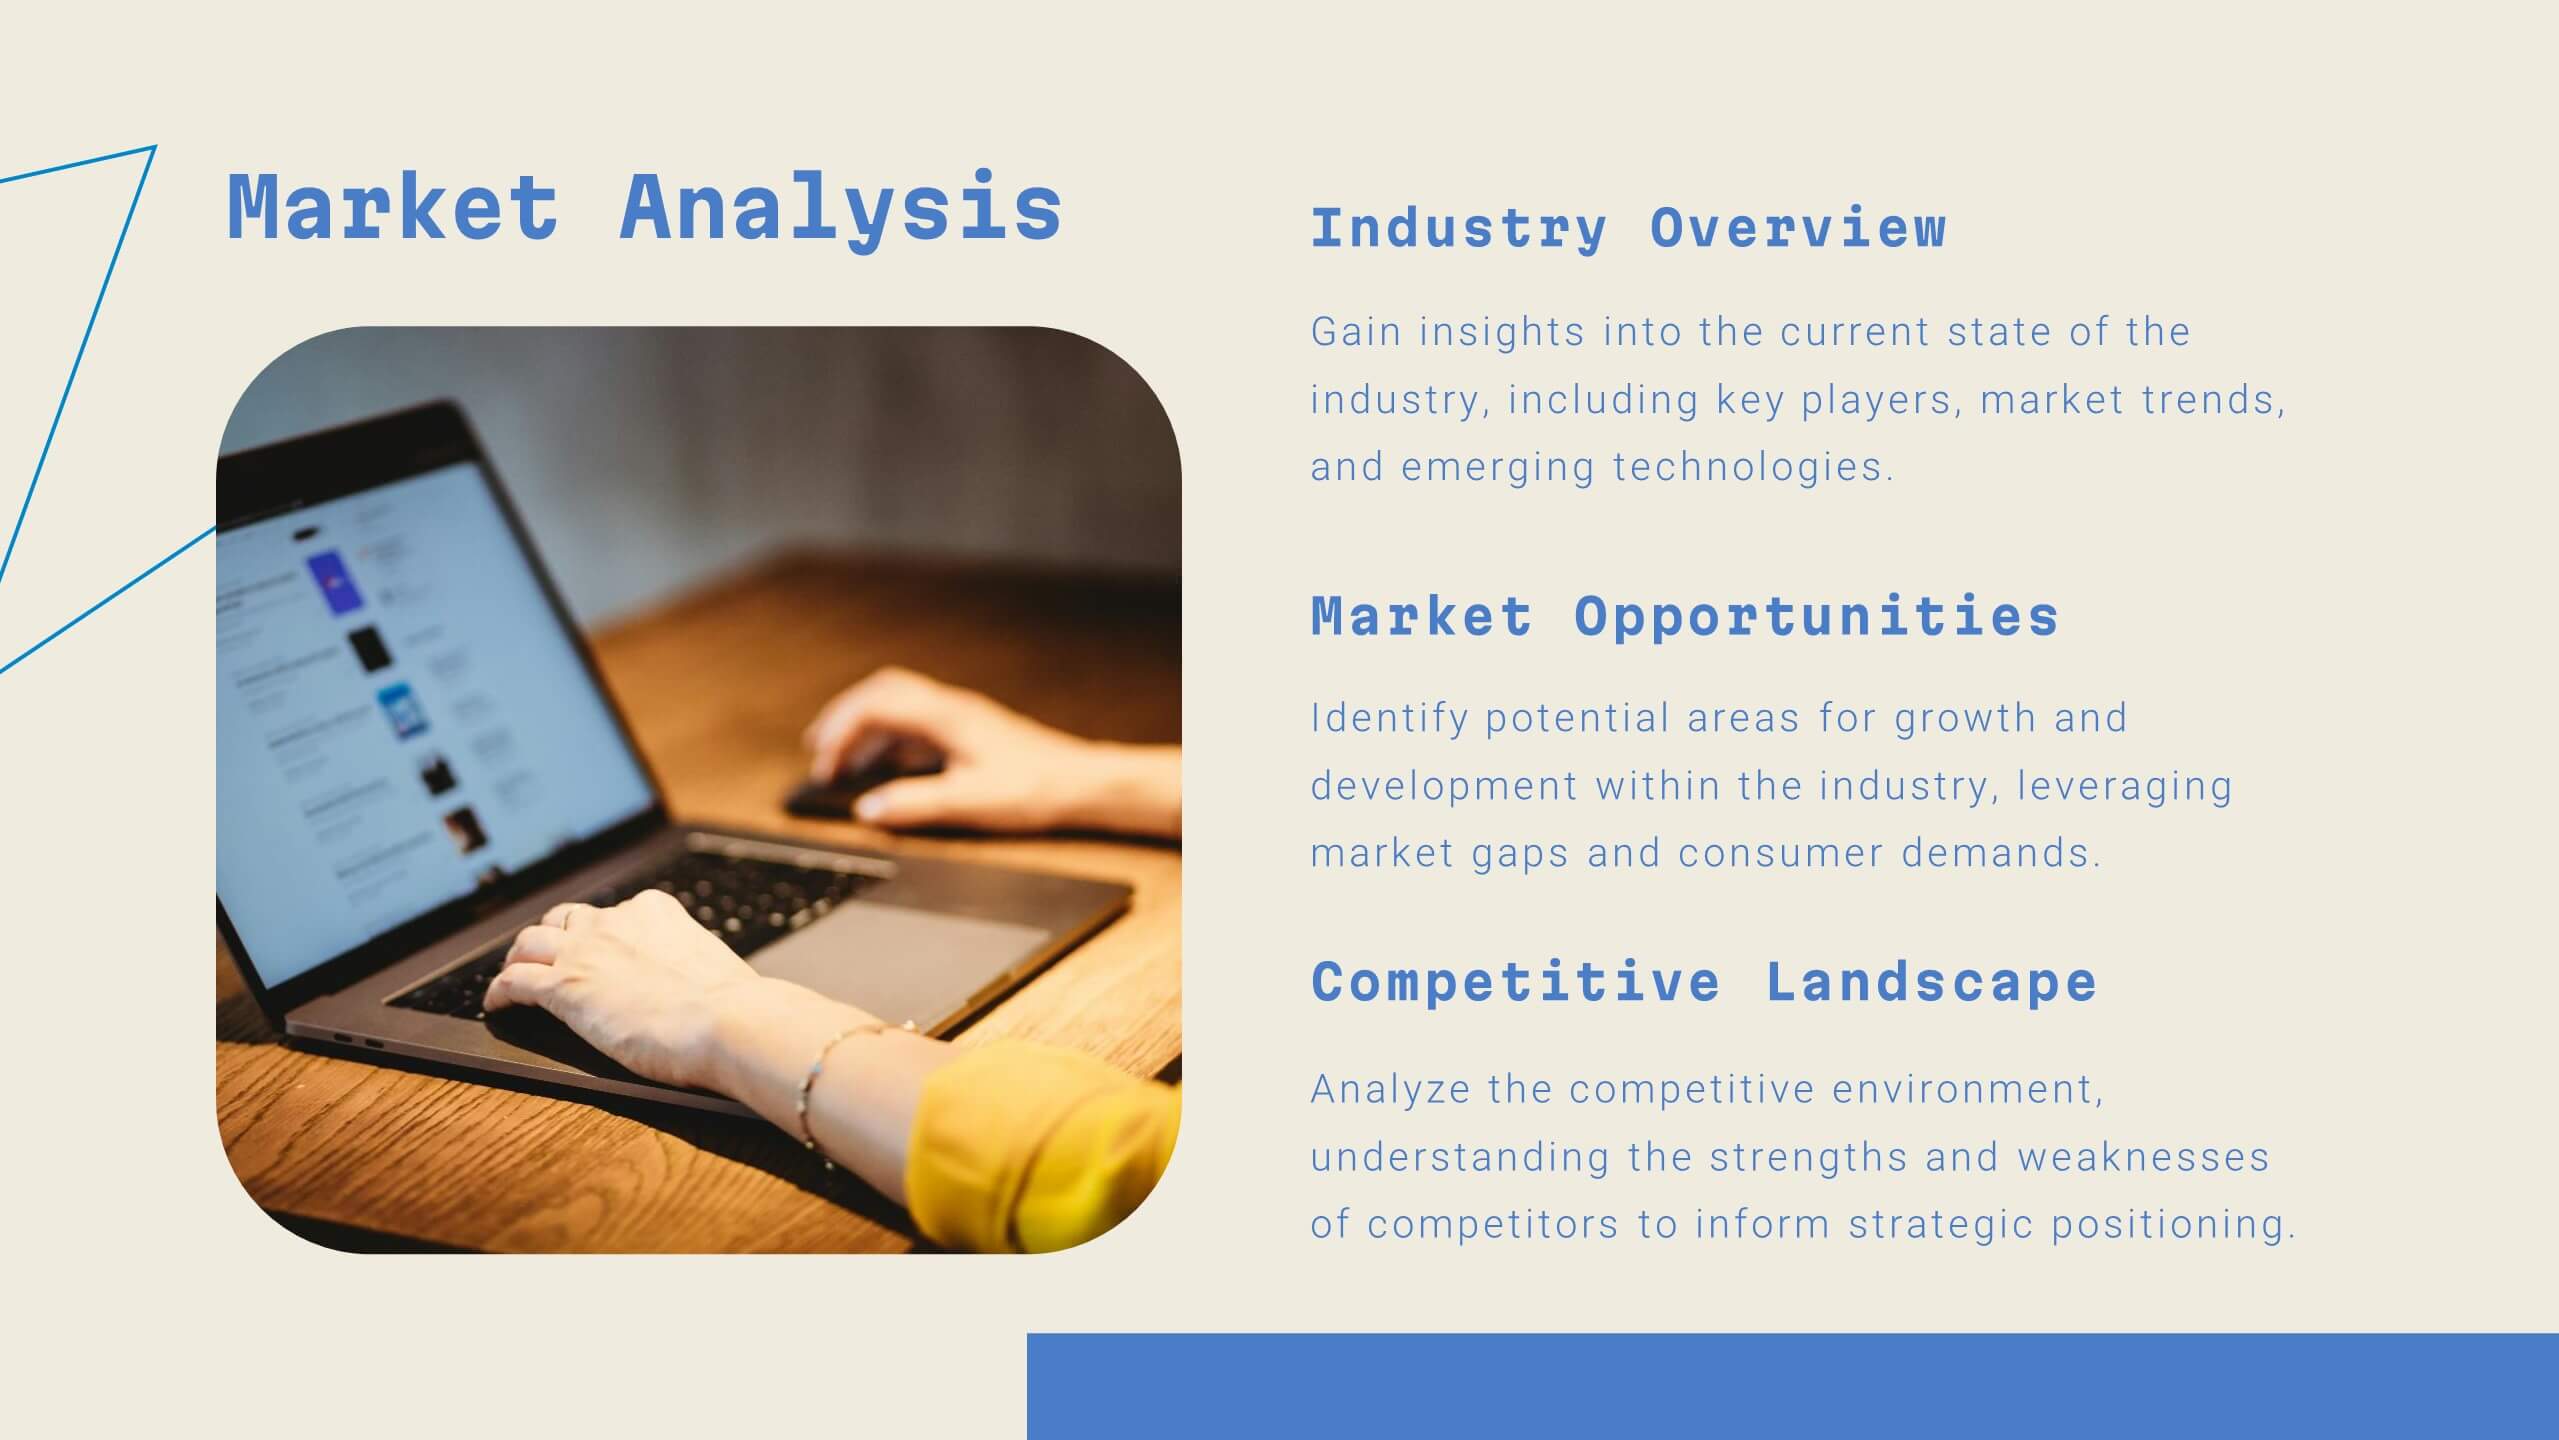
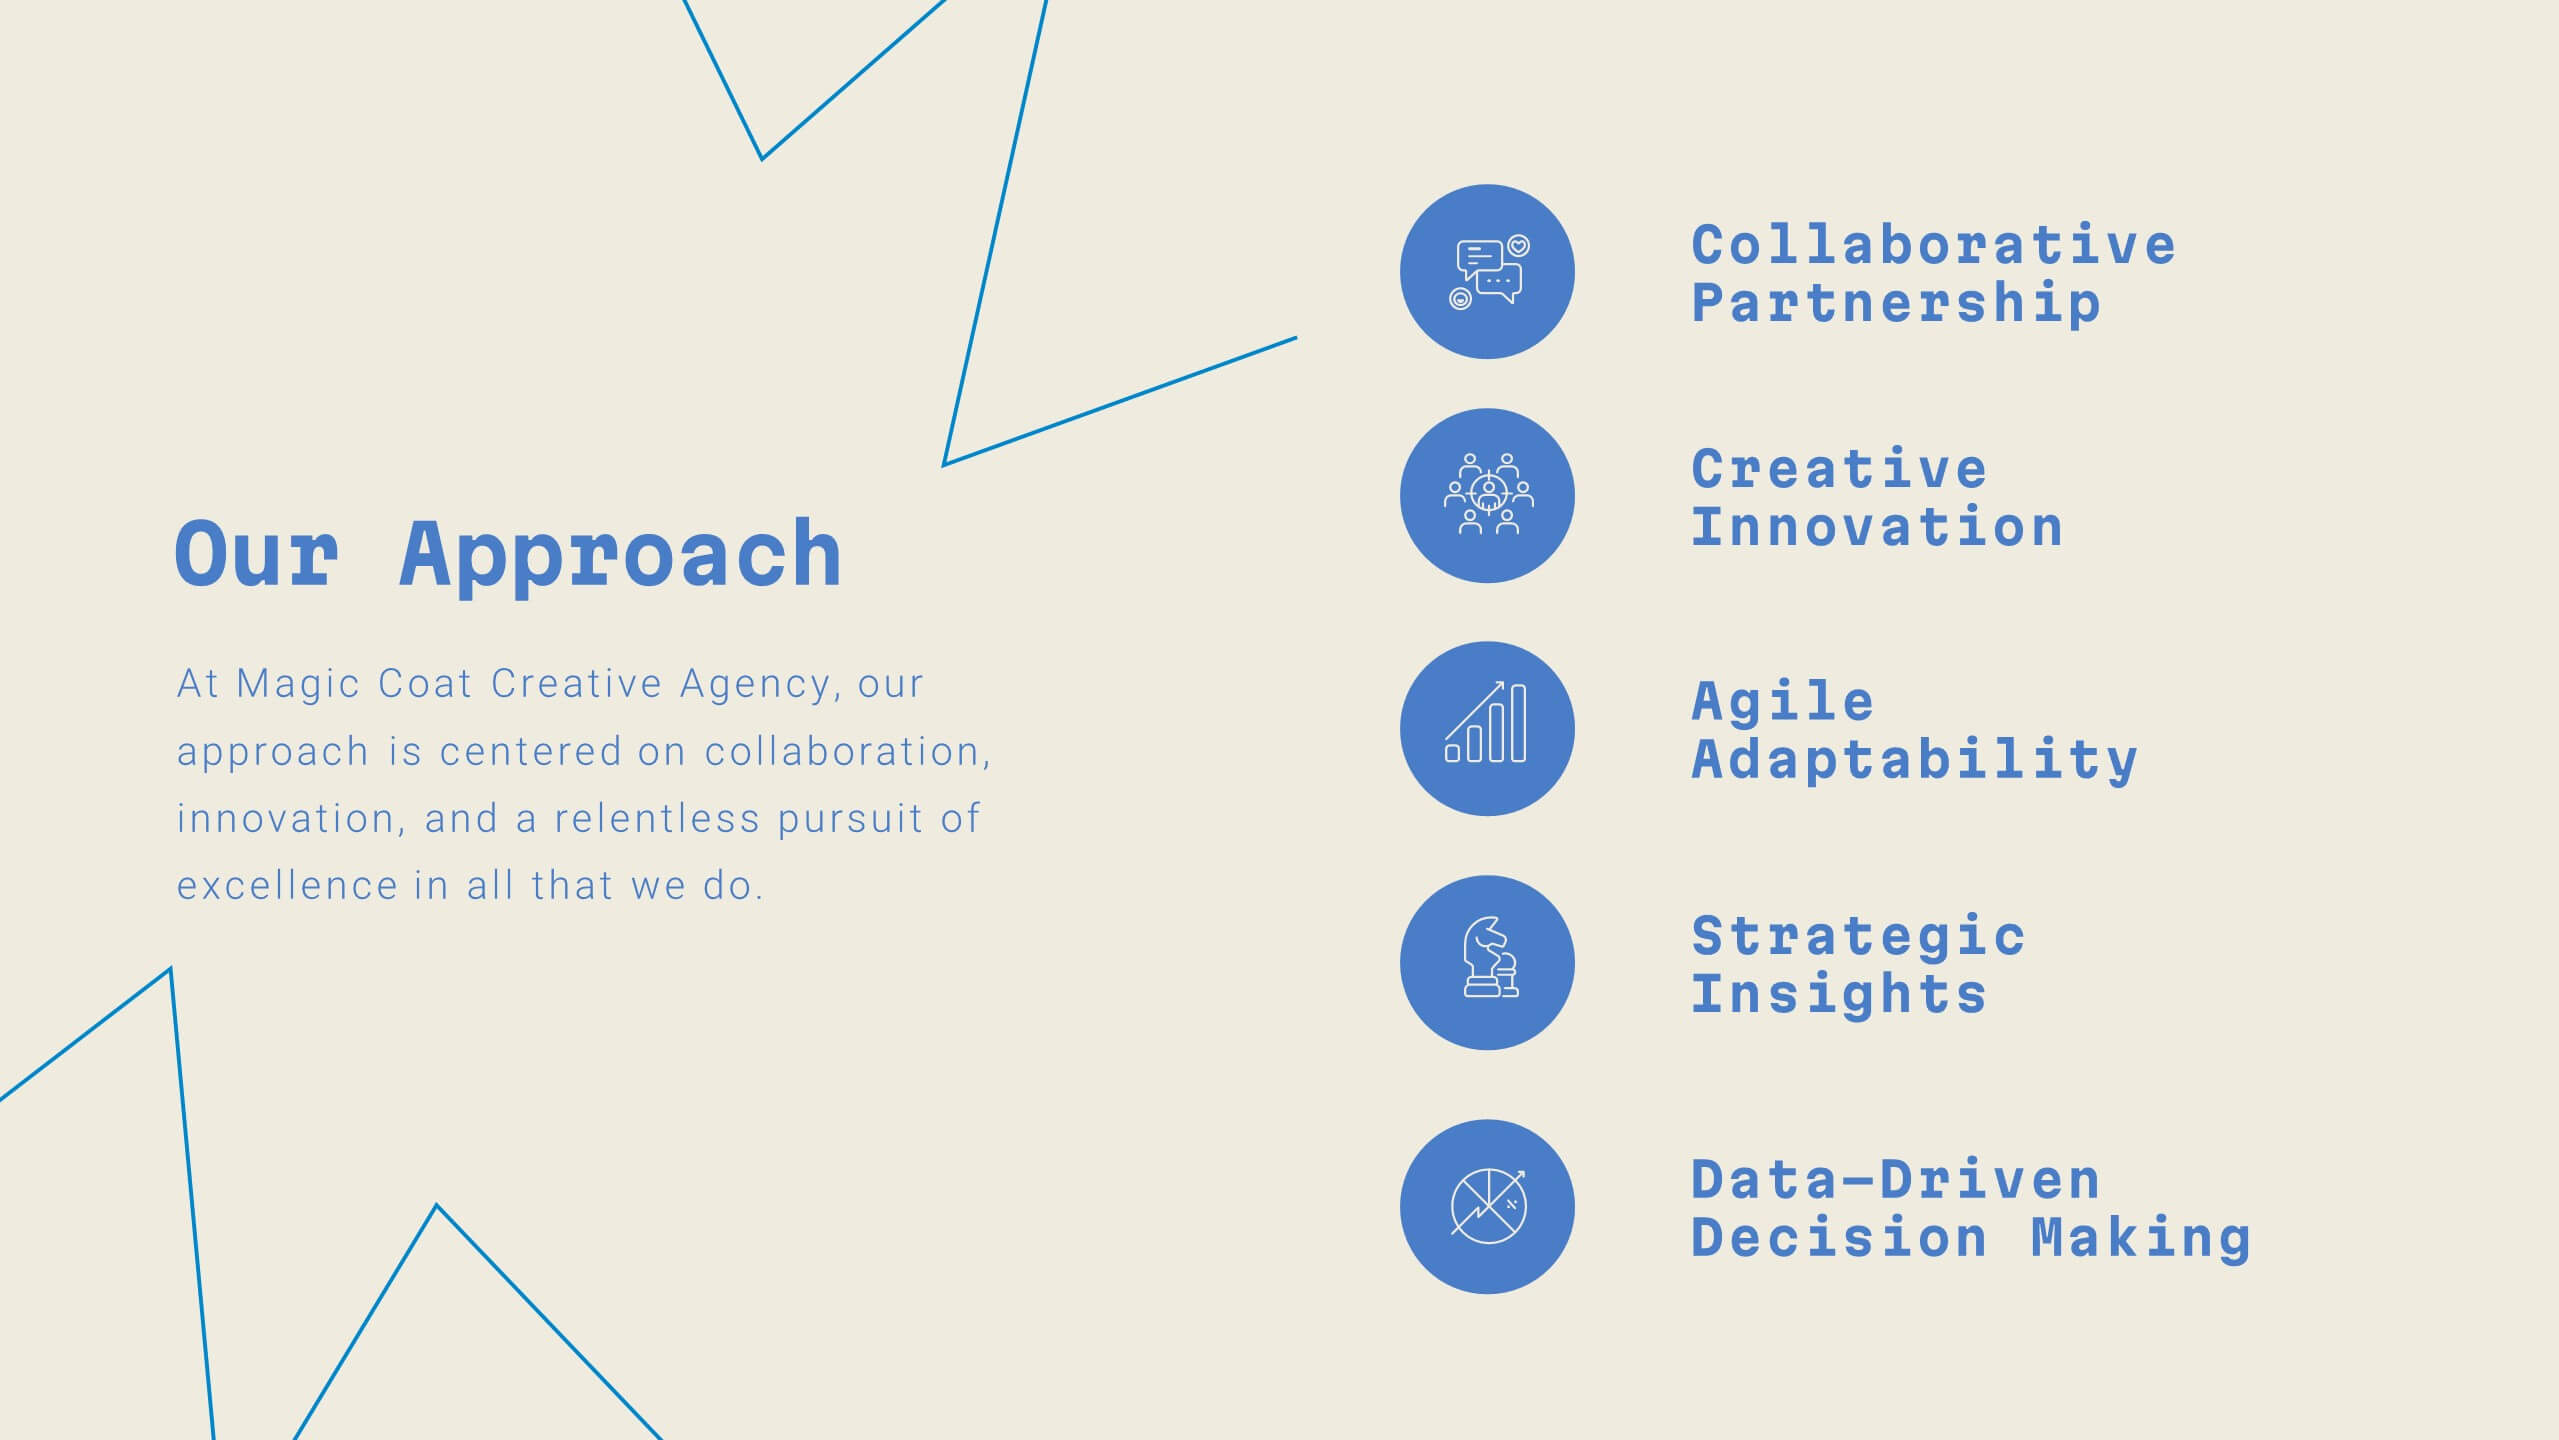
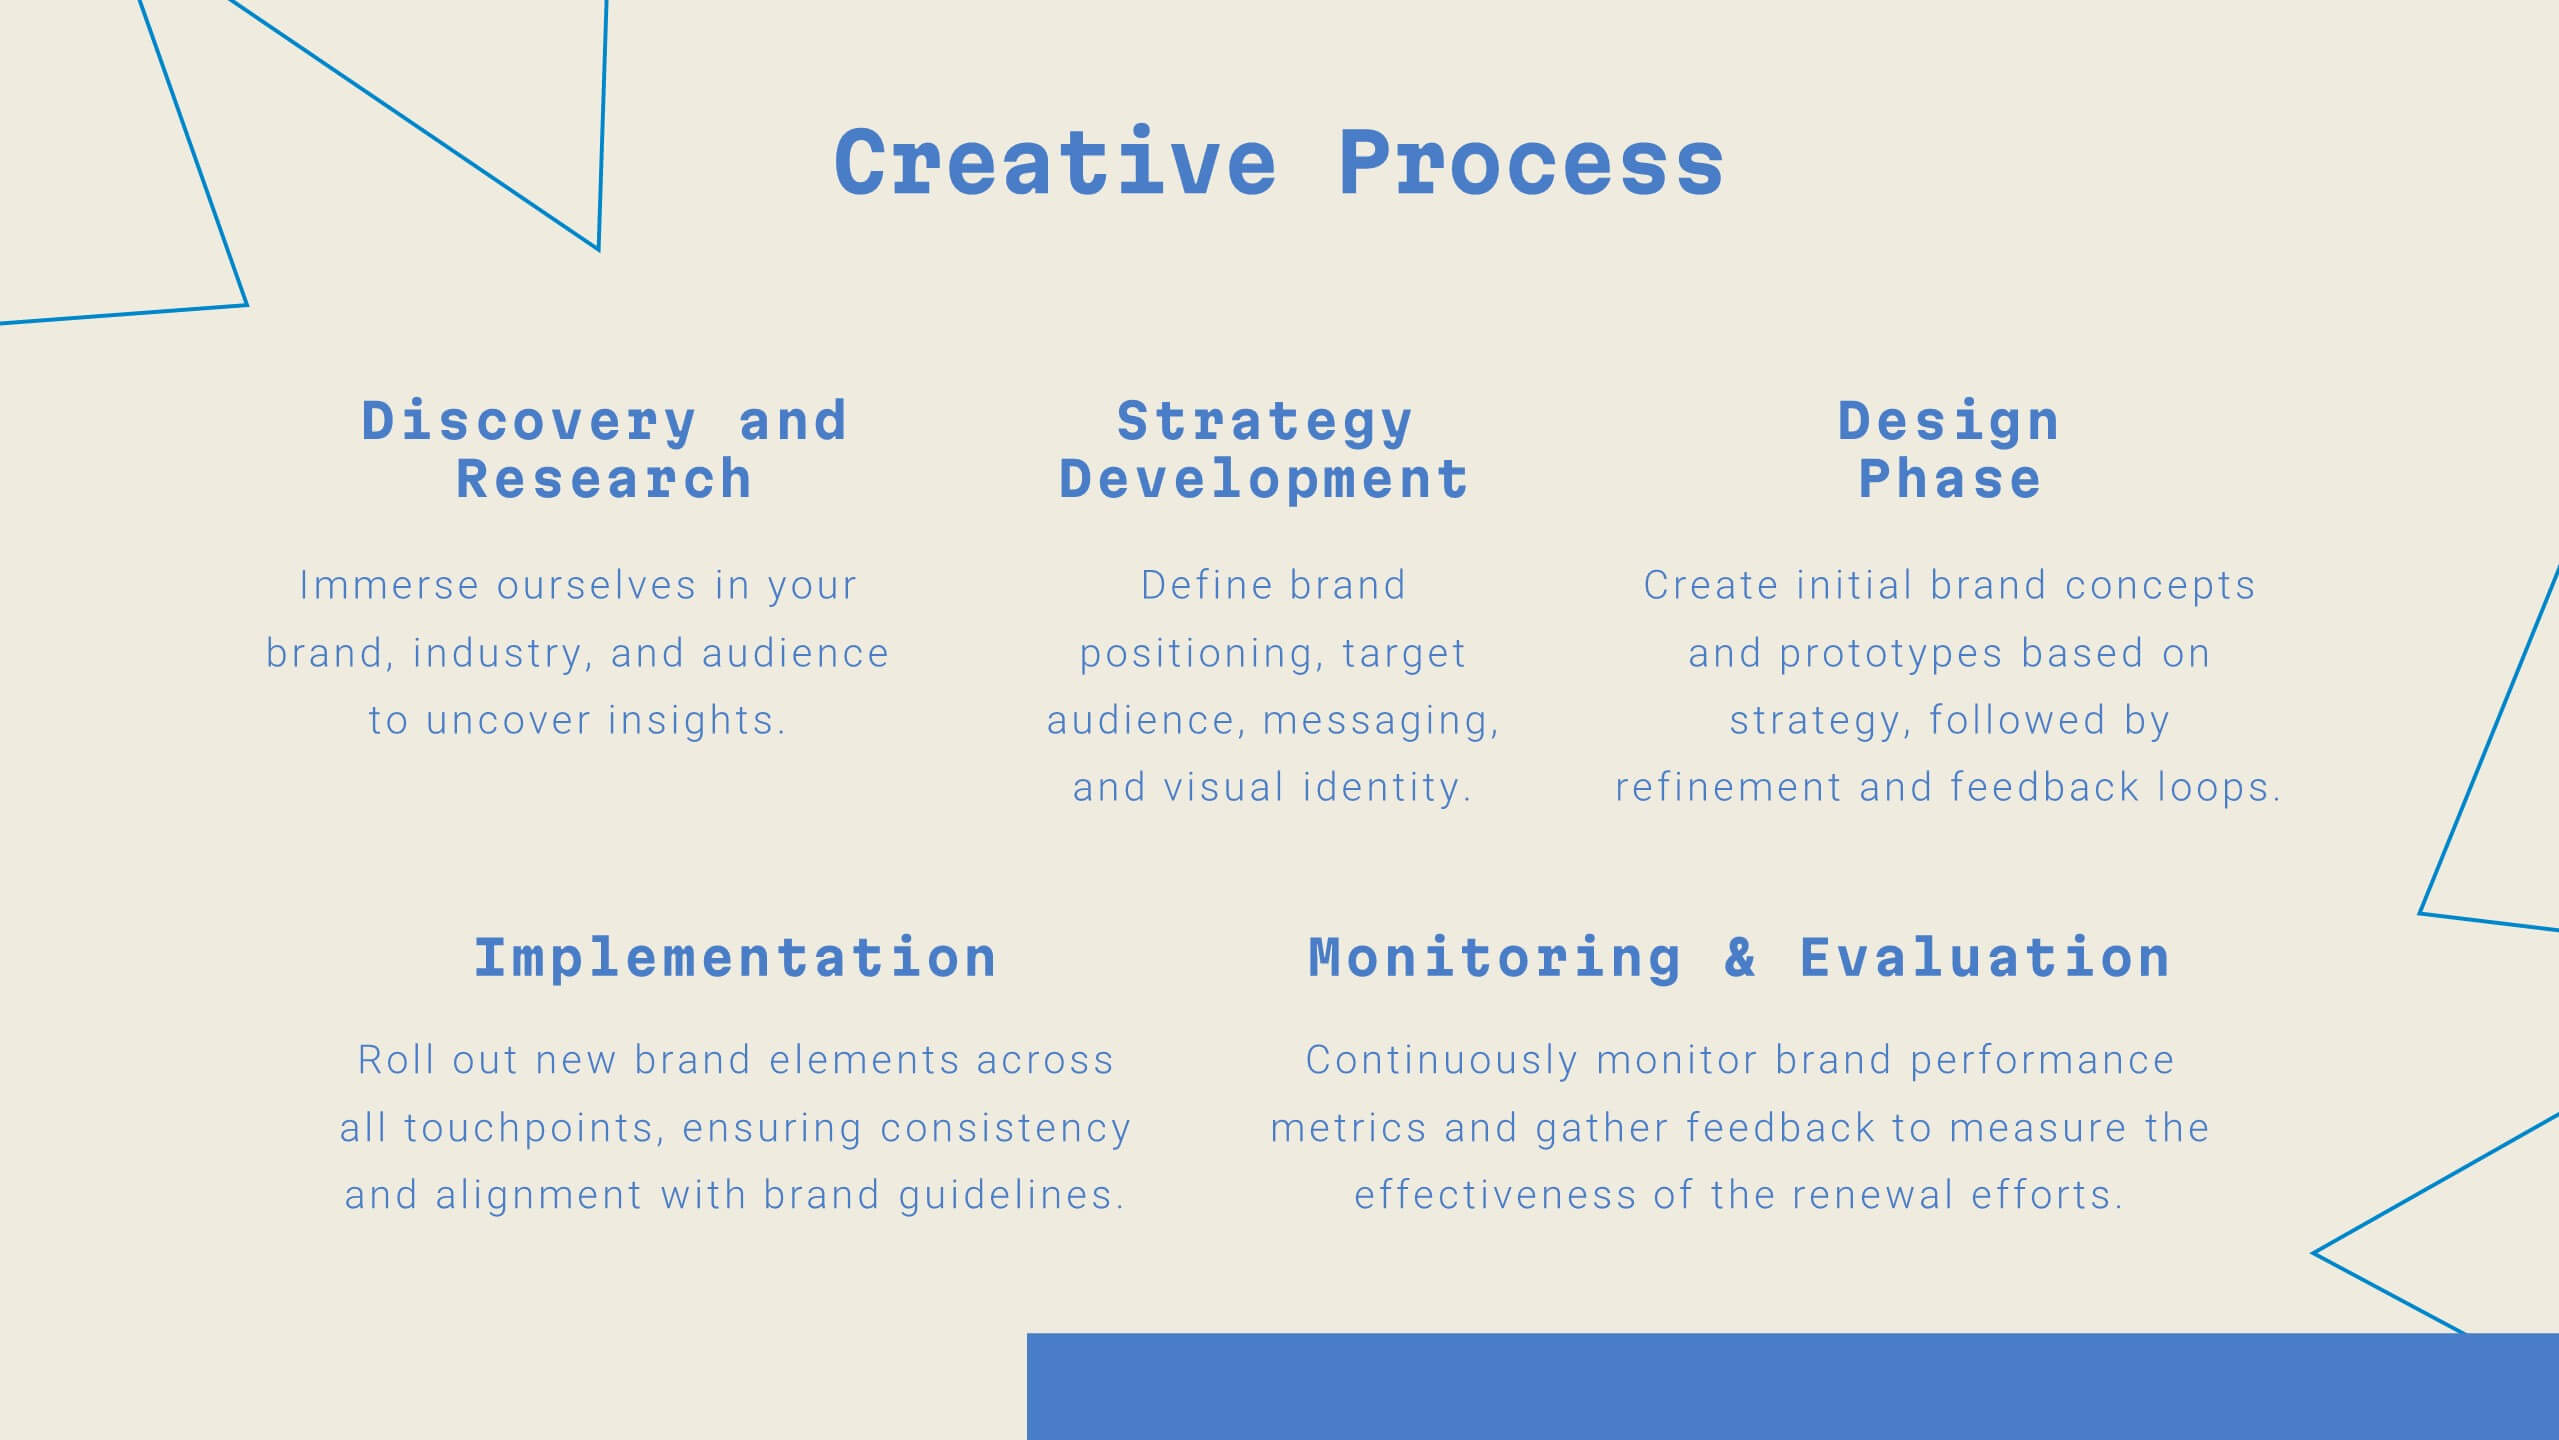
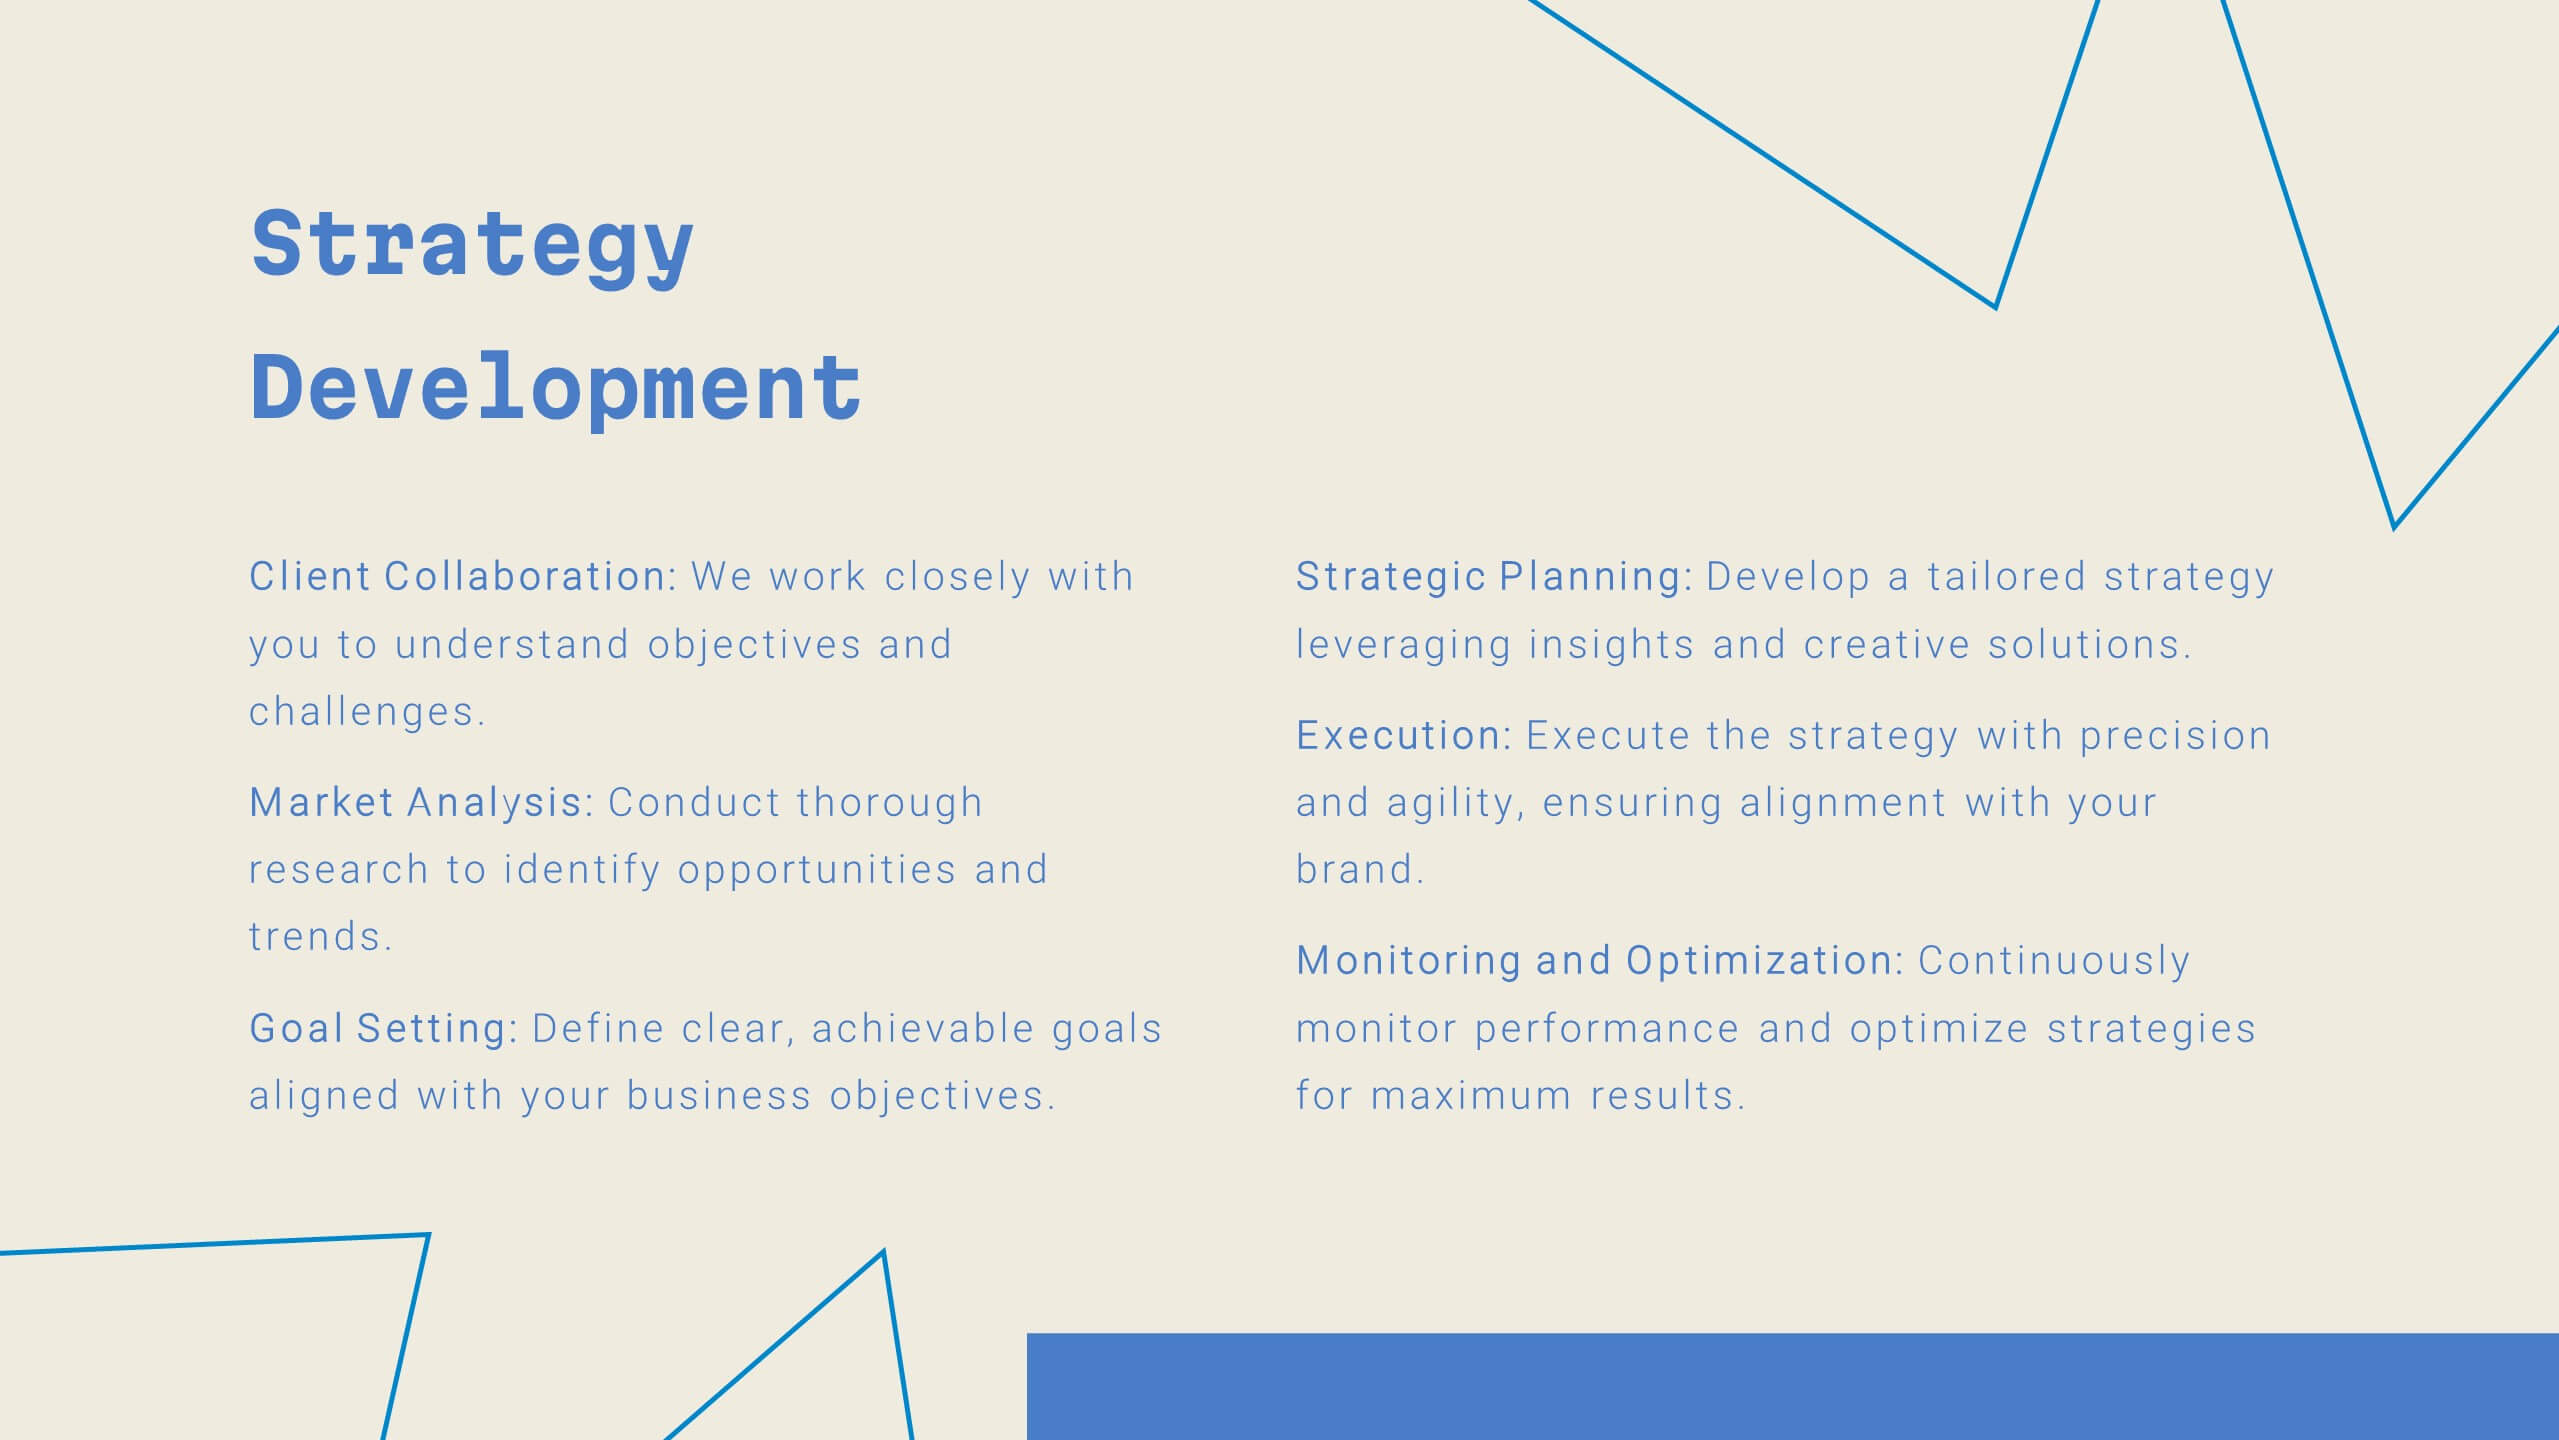
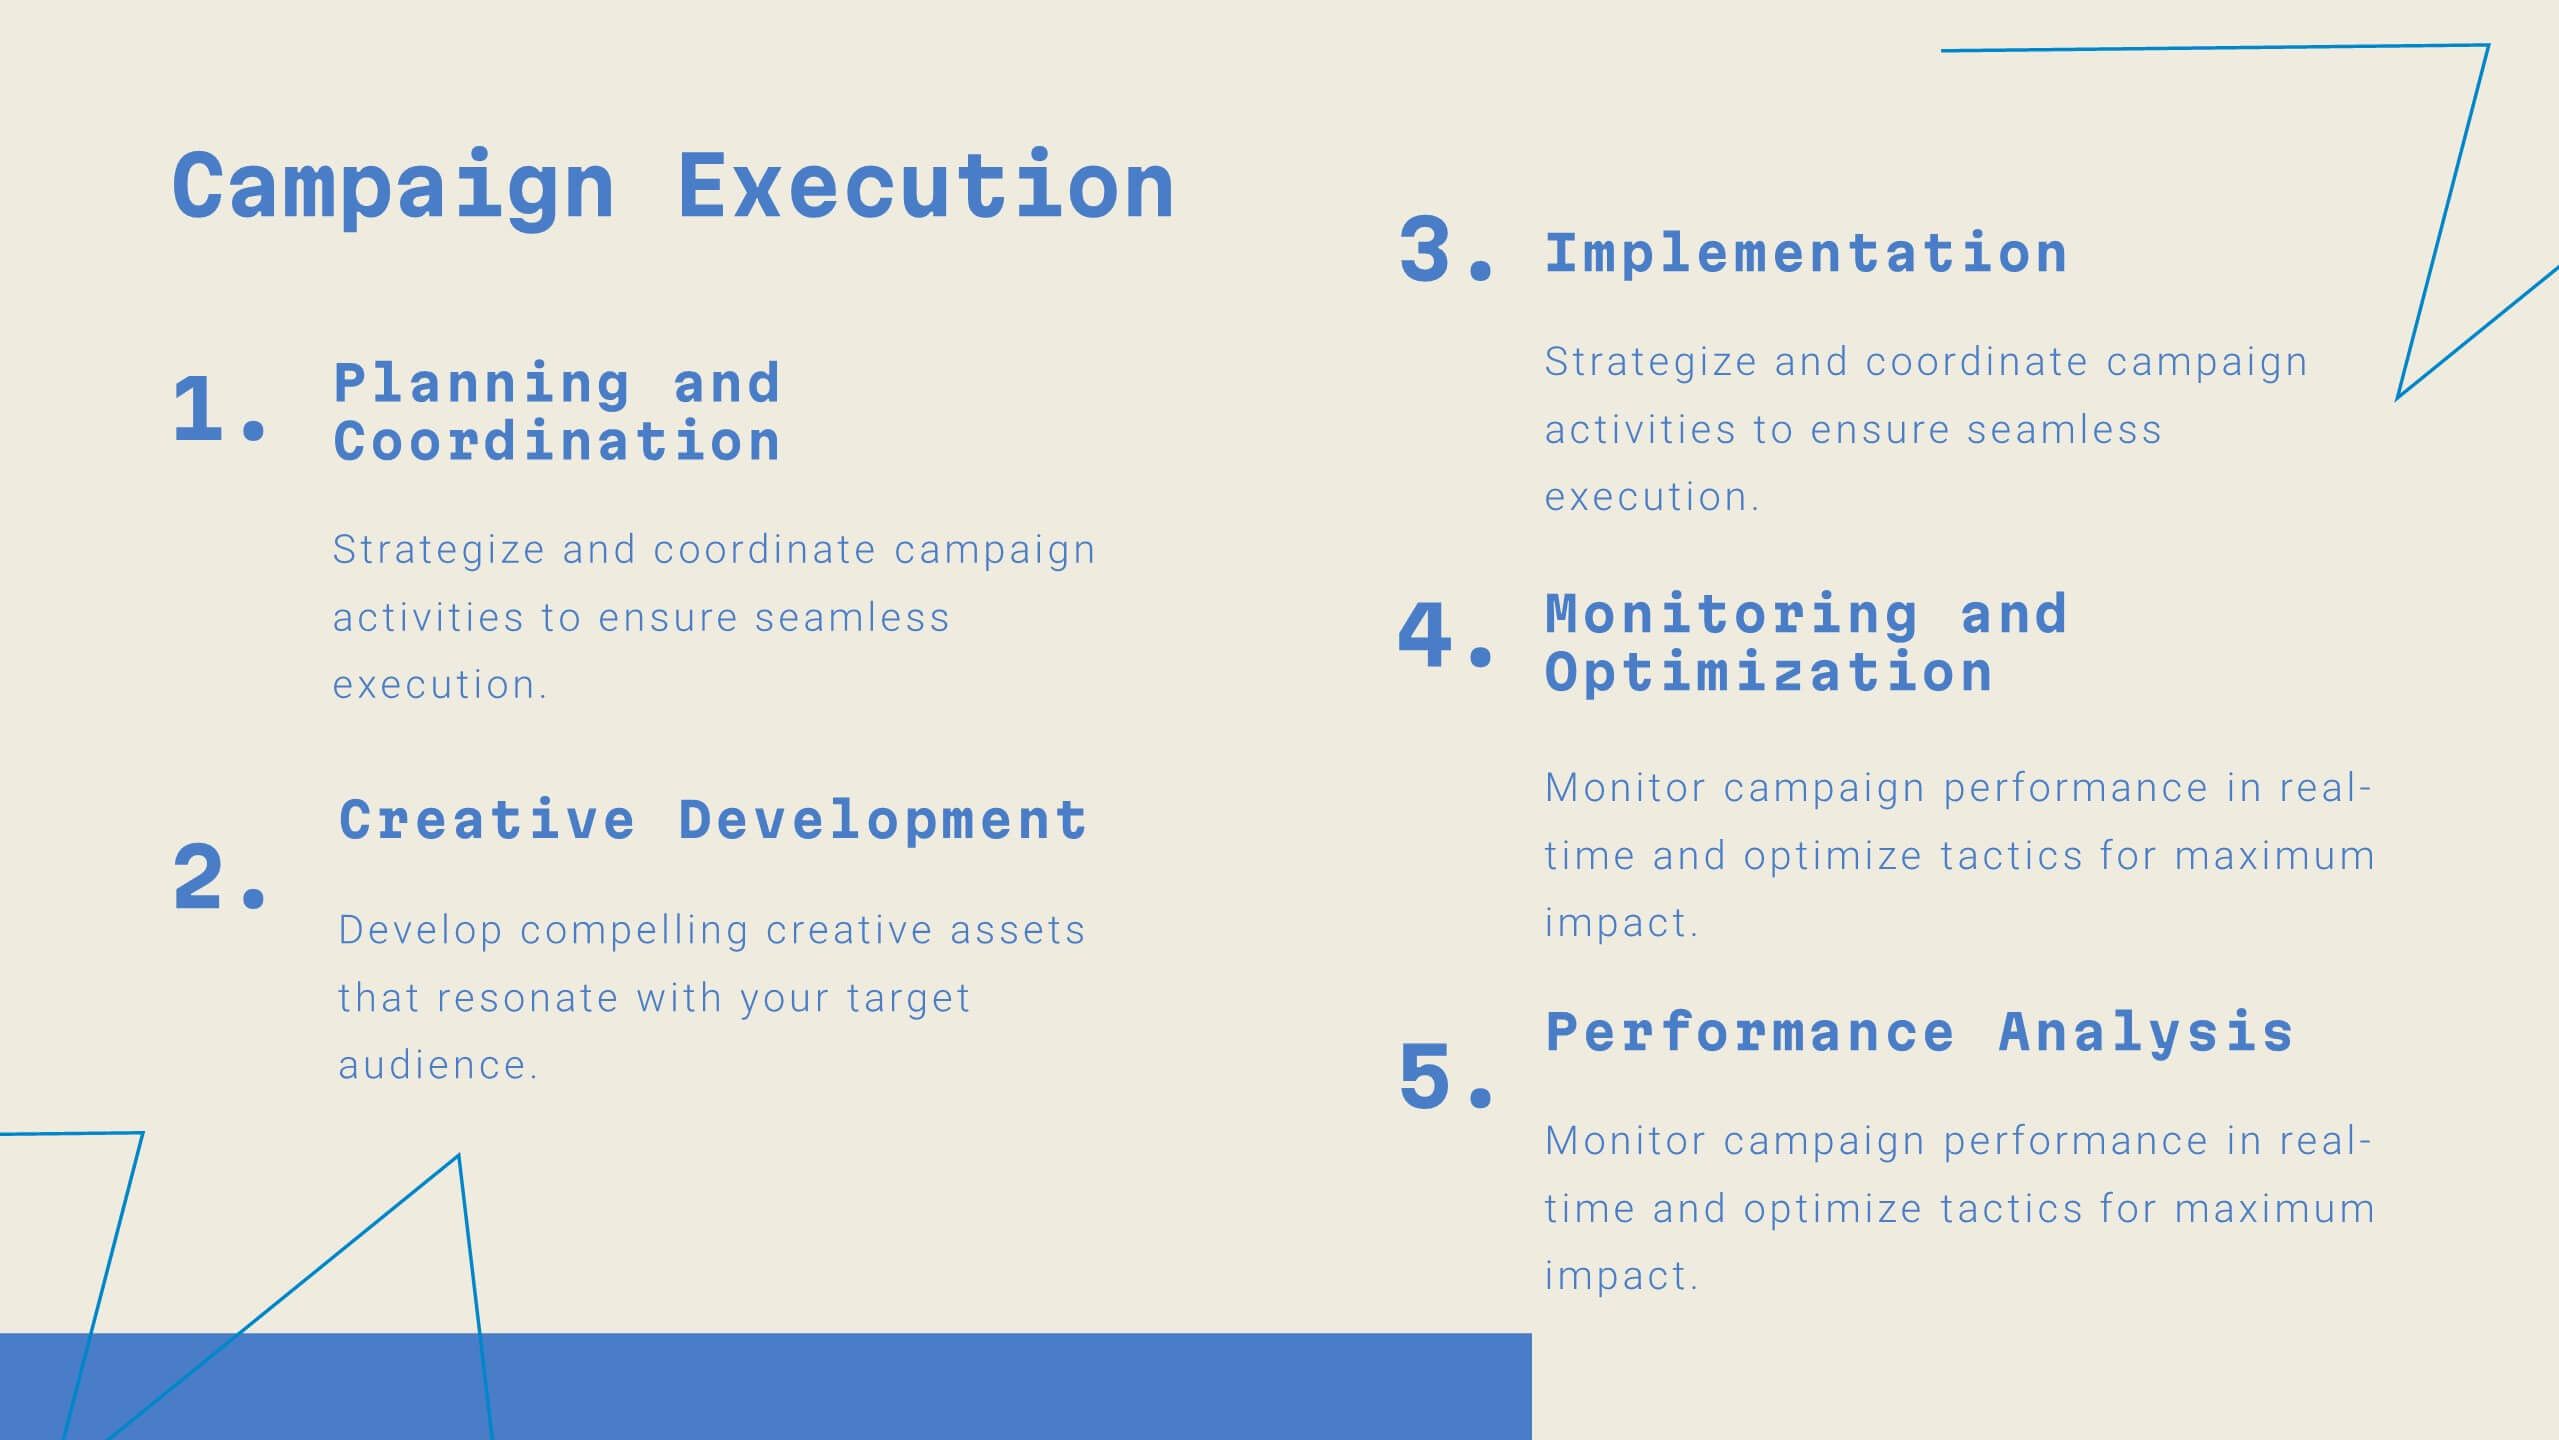
Unity Digital Agency Strategy Plan Presentation
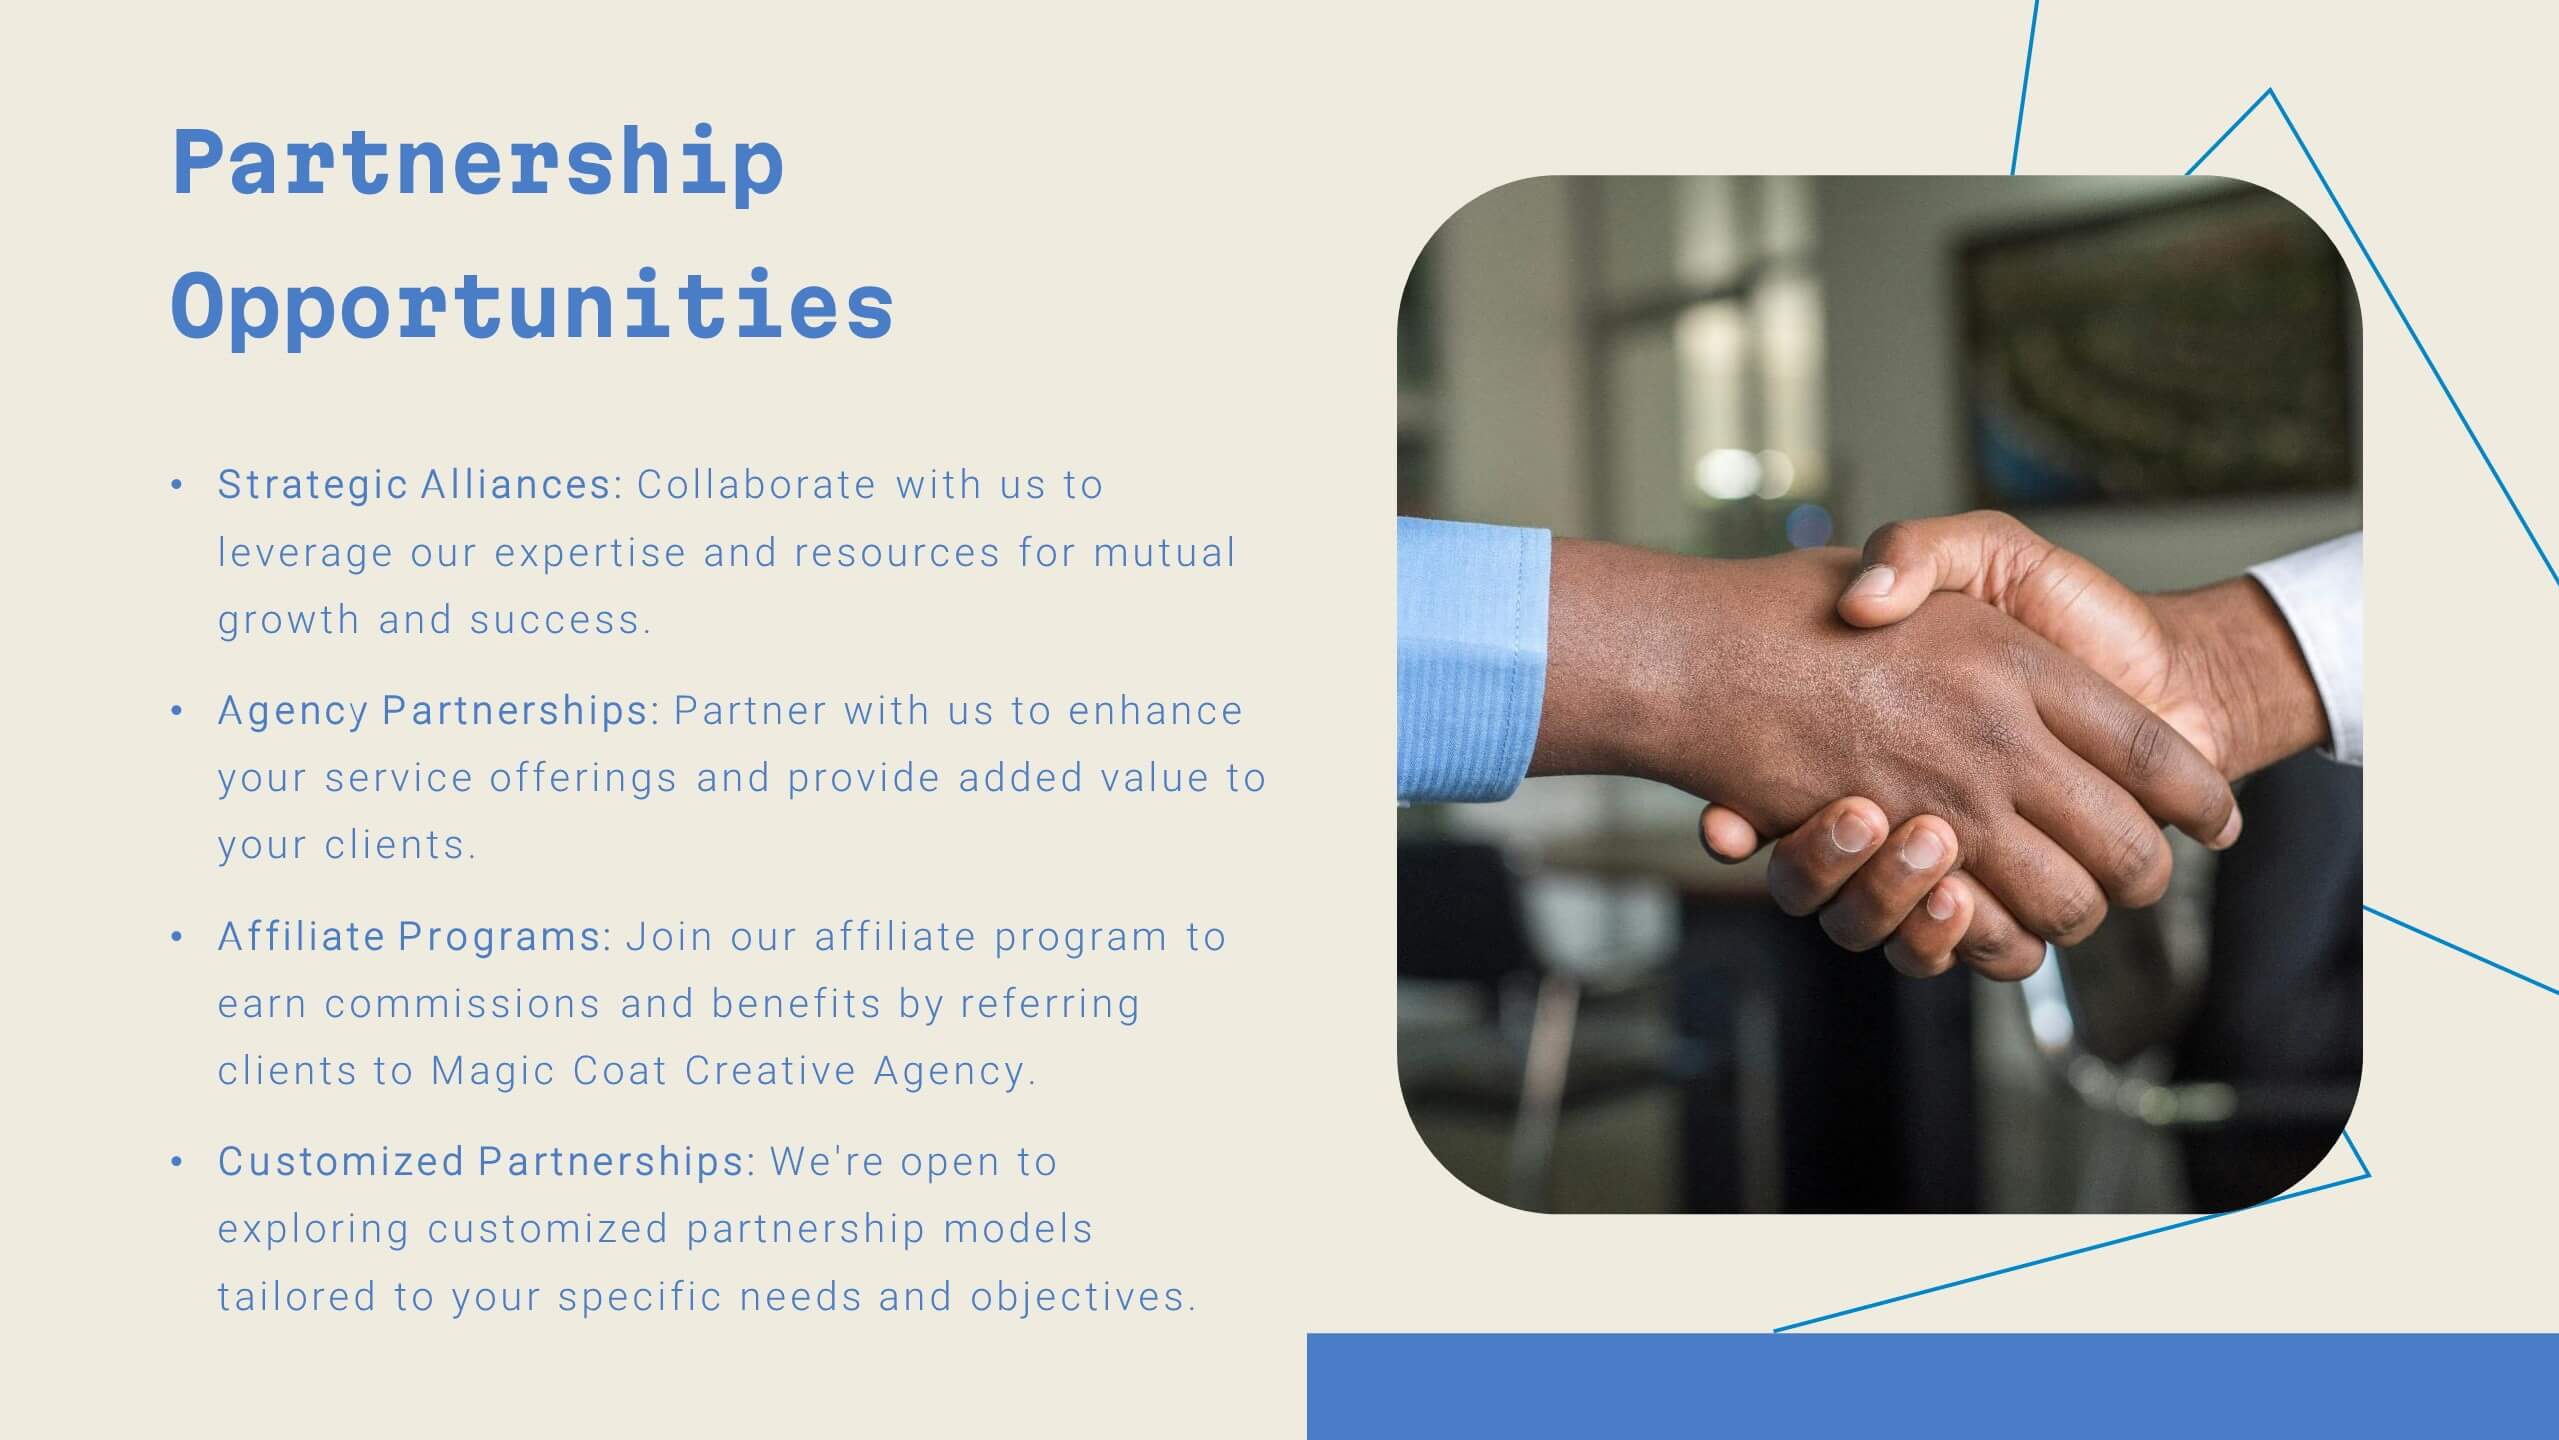
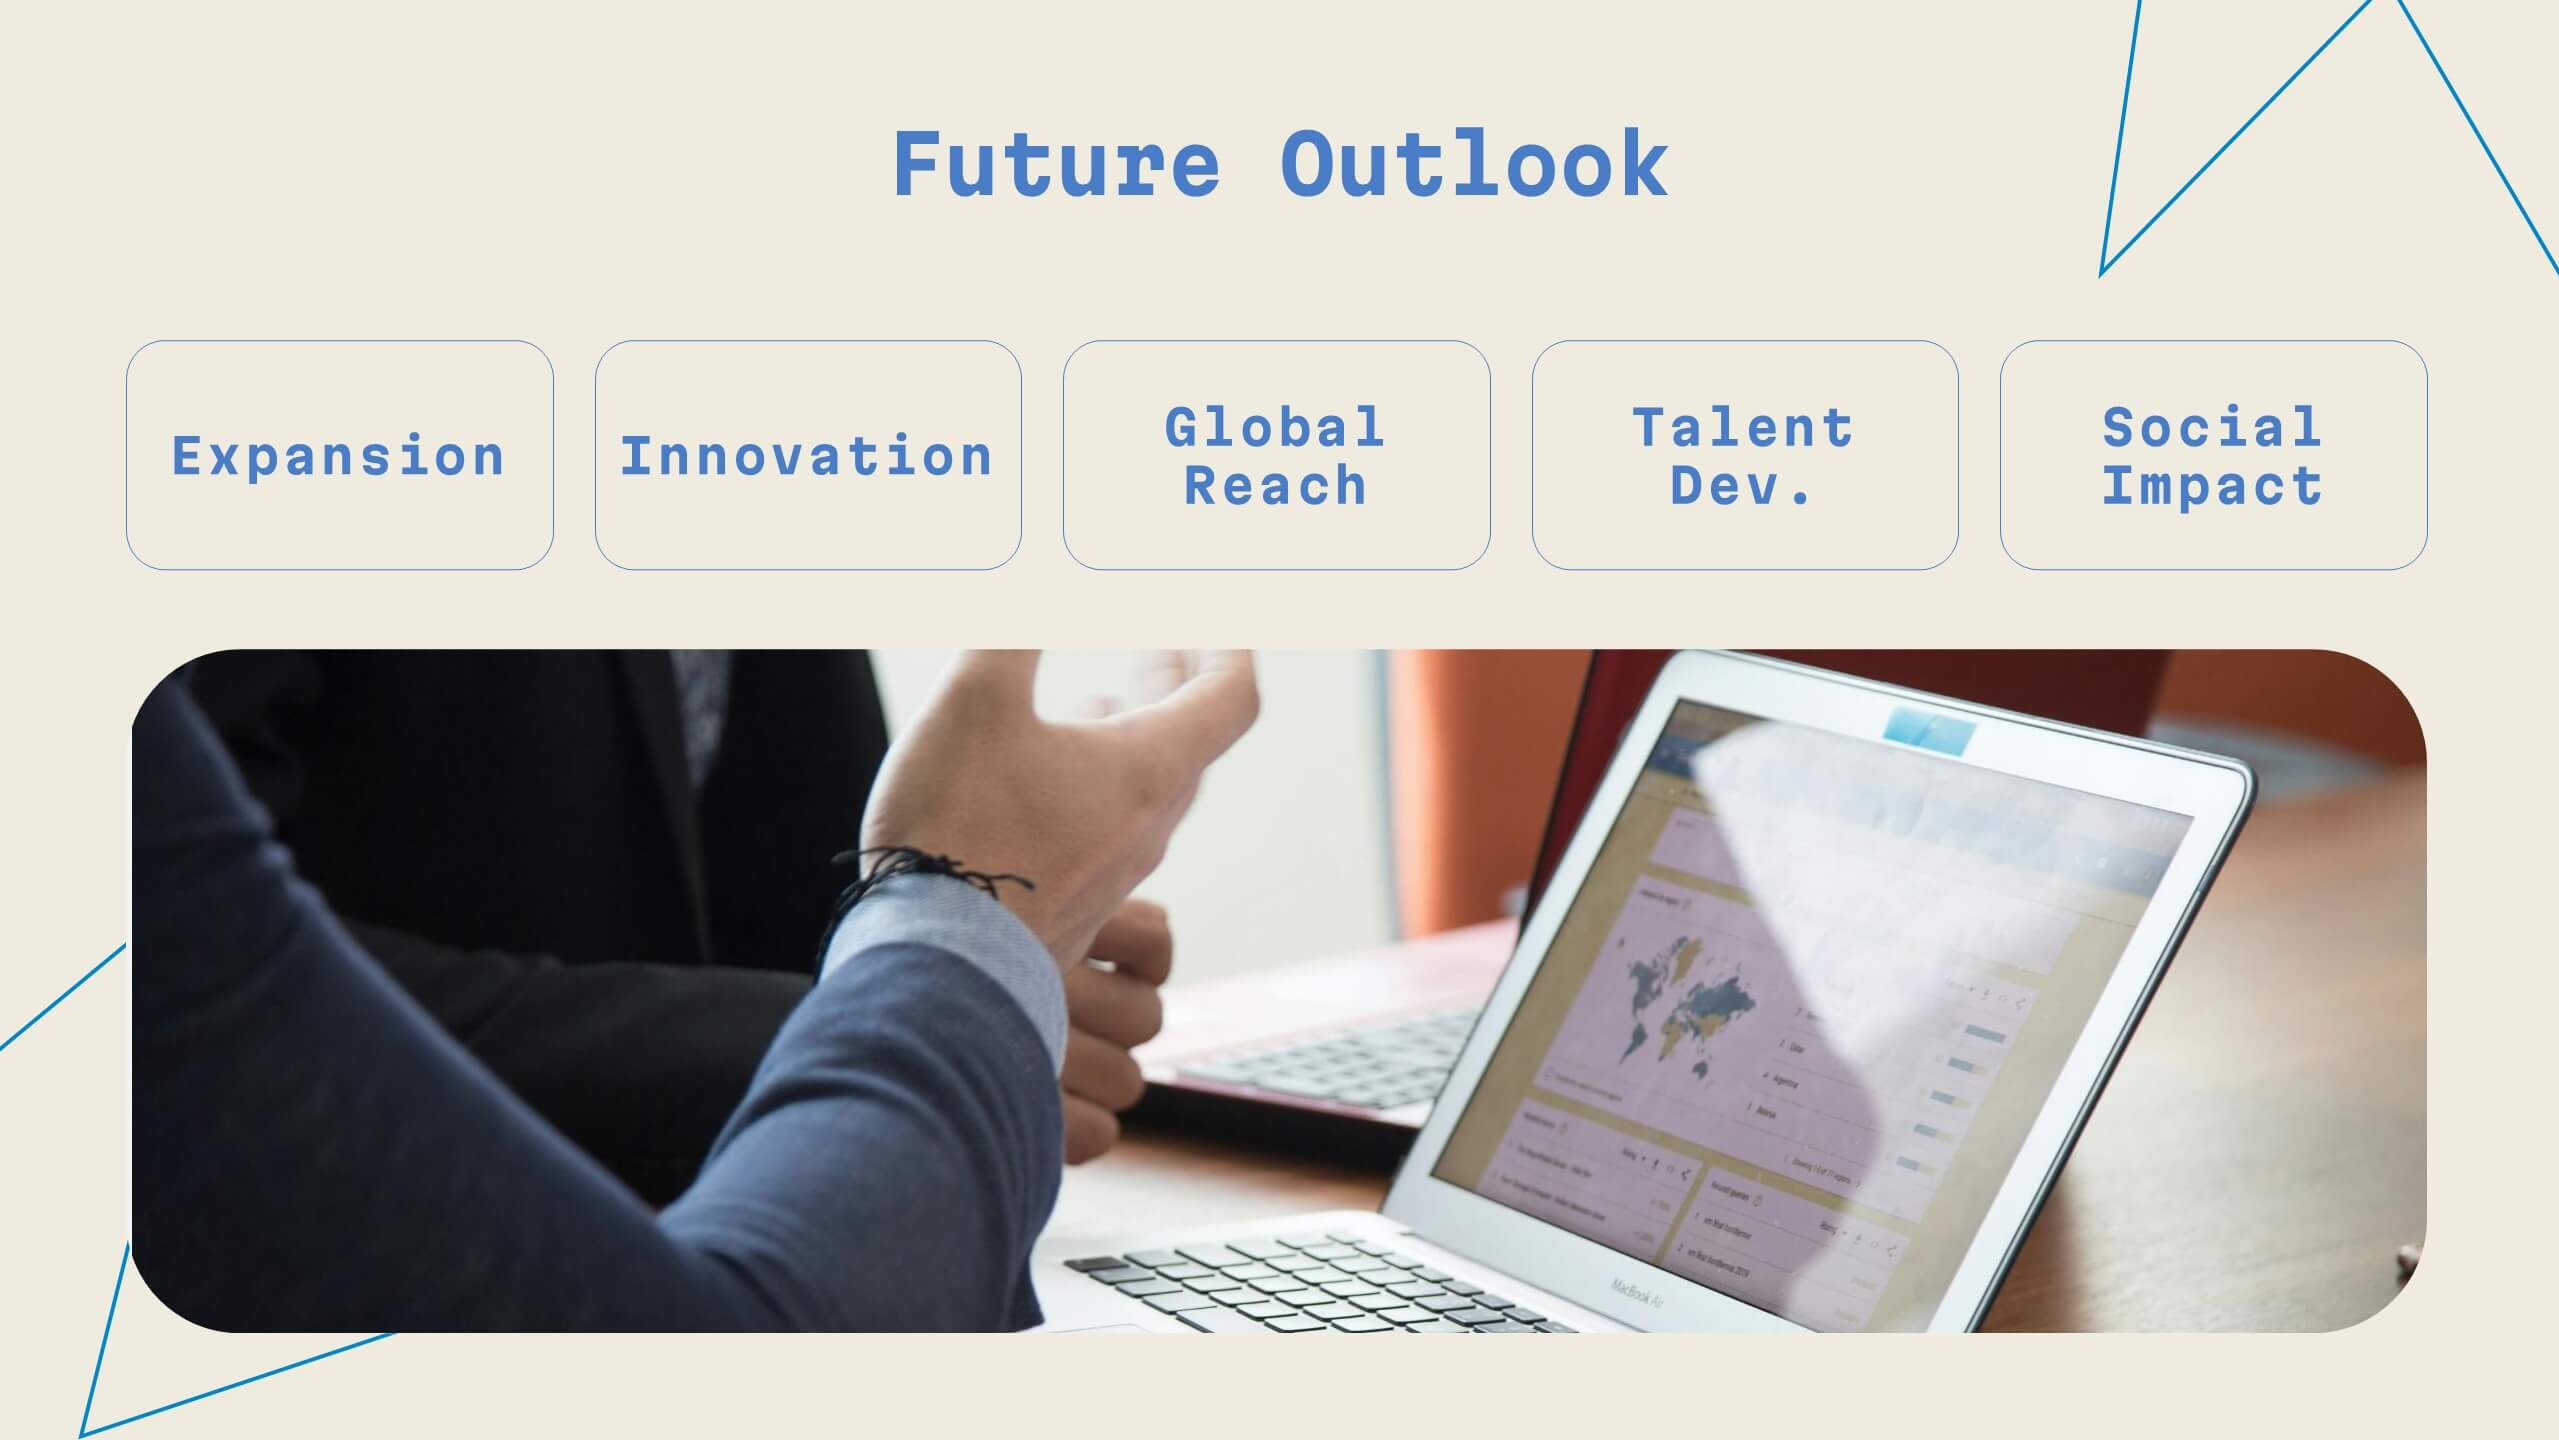
Step into the future of digital marketing with this sleek template! From case studies to strategy development, it offers a comprehensive guide for creating impactful presentations. Highlight client success stories, industry trends, and creative processes with ease. Perfect for showcasing your agency's expertise. Compatible with PowerPoint, Keynote, and Google Slides.


6 diapositivas
End-to-End Value Chain Process Presentation
Visualize every link in your process with the End-to-End Value Chain Process Presentation. This modern chain diagram helps illustrate each stage of your business or production flow—from initial input to final output. It's ideal for strategy, supply chain, and operational planning. Fully editable in PowerPoint, Keynote, Canva, or Google Slides.


6 diapositivas
Africa Richest Map Infographic
Africa is the world's second-largest and second-most-populous continent, It's a continent full of people, culture, and history. This infographic template is designed to help you inform your audience about everything they need to know about Africa's richest countries. Use this template to inform about Africa's most valuable exports and imports, the percentage of their GDP that is made up of oil revenue, and much more. This infographic map displays information on each country, including population density and economic ranking. This template is fully customizable and compatible with Powerpoint, Keynote, and Google Slides.