


Características


¿Tienes alguna pregunta?
Recomendar


20 diapositivas
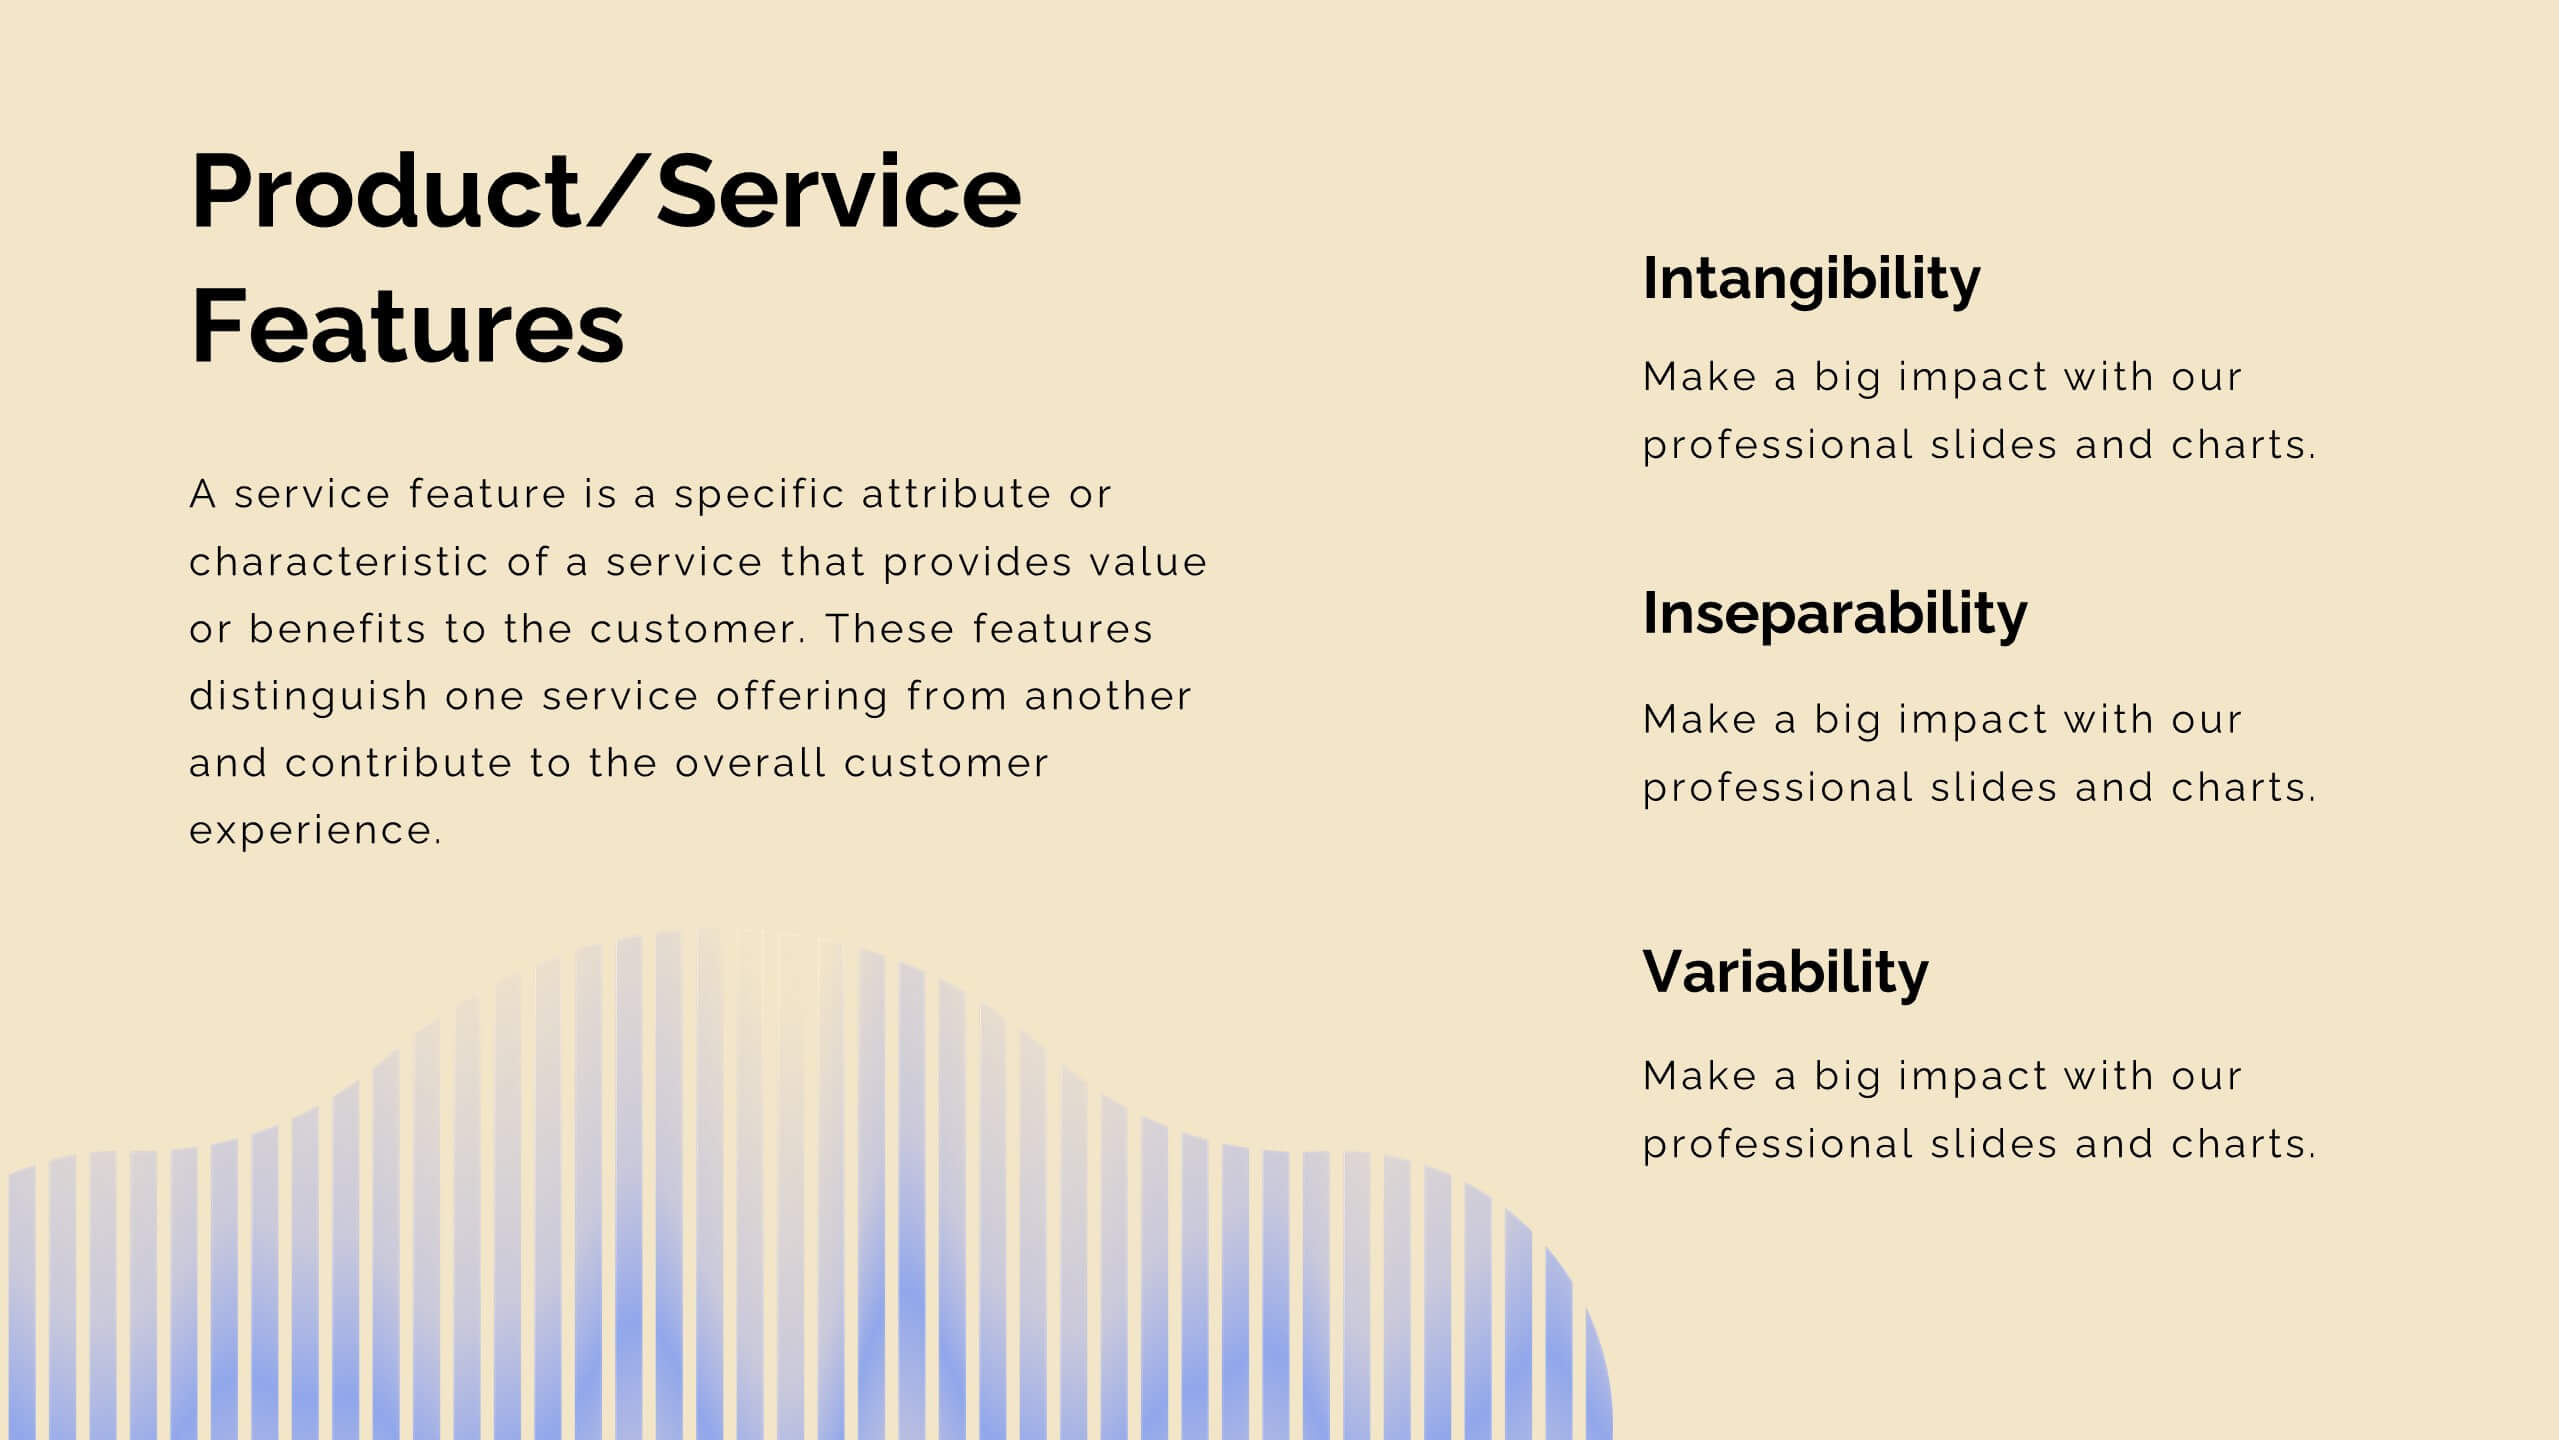
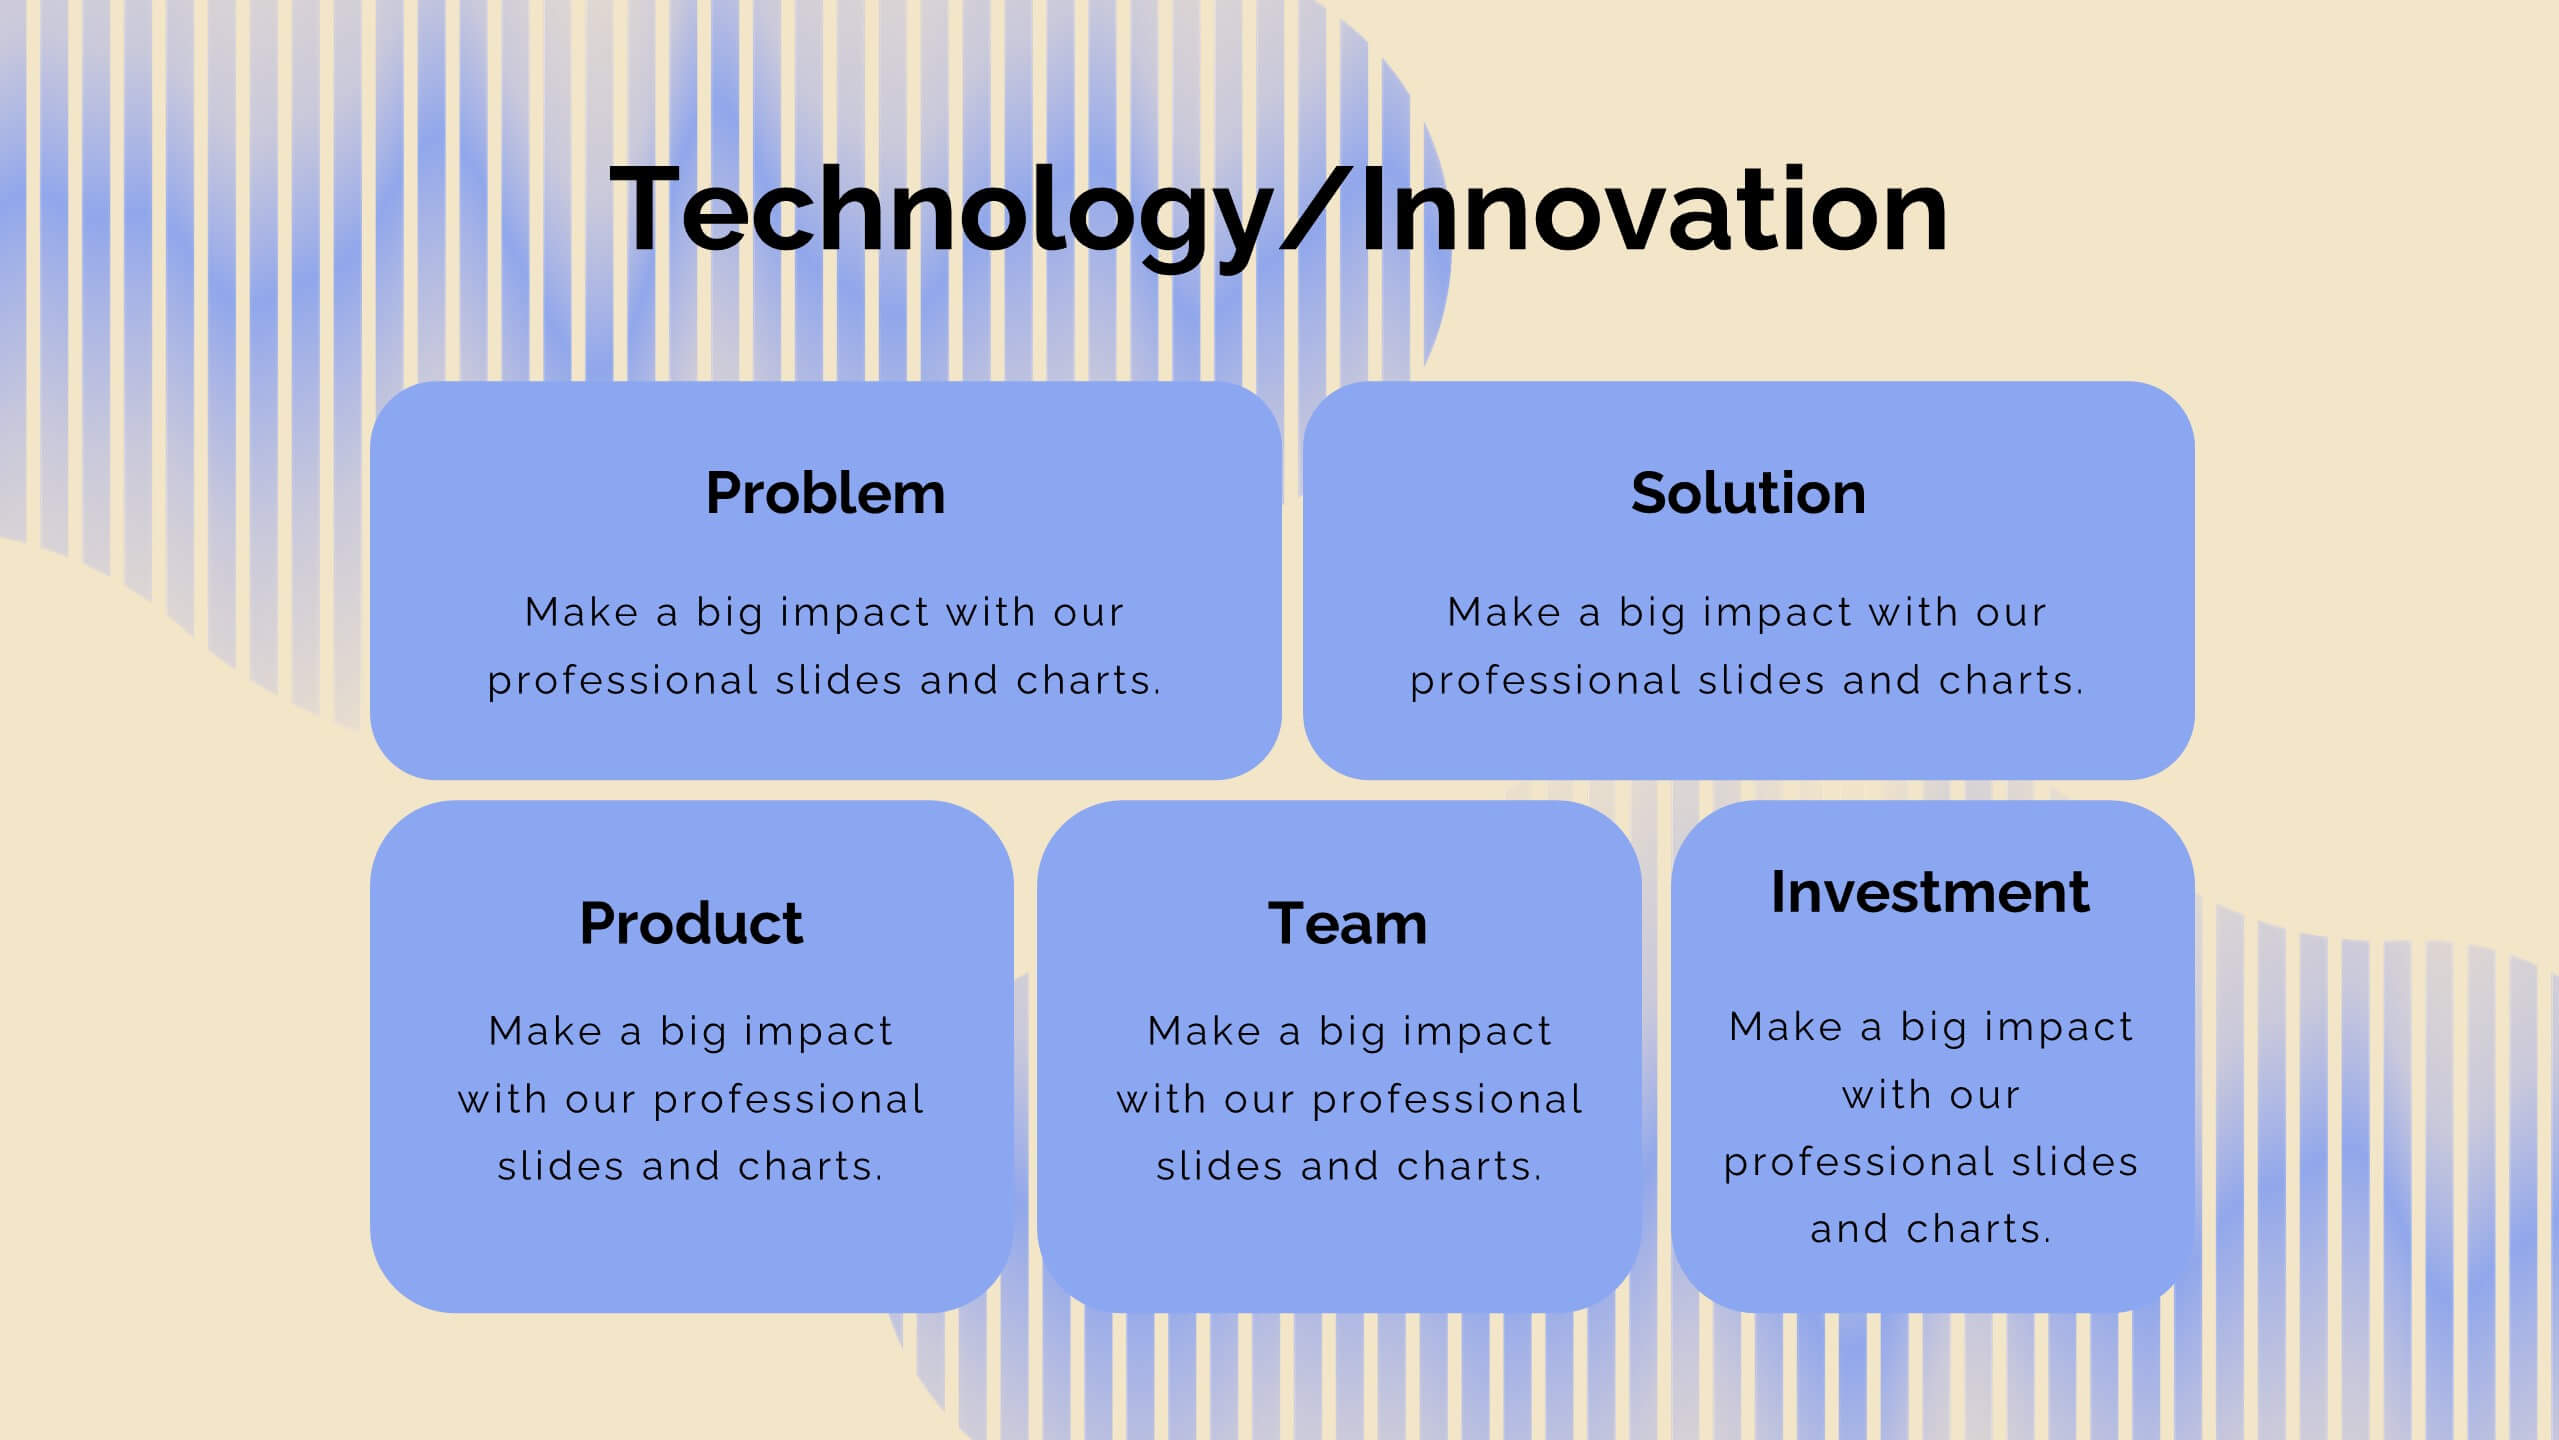
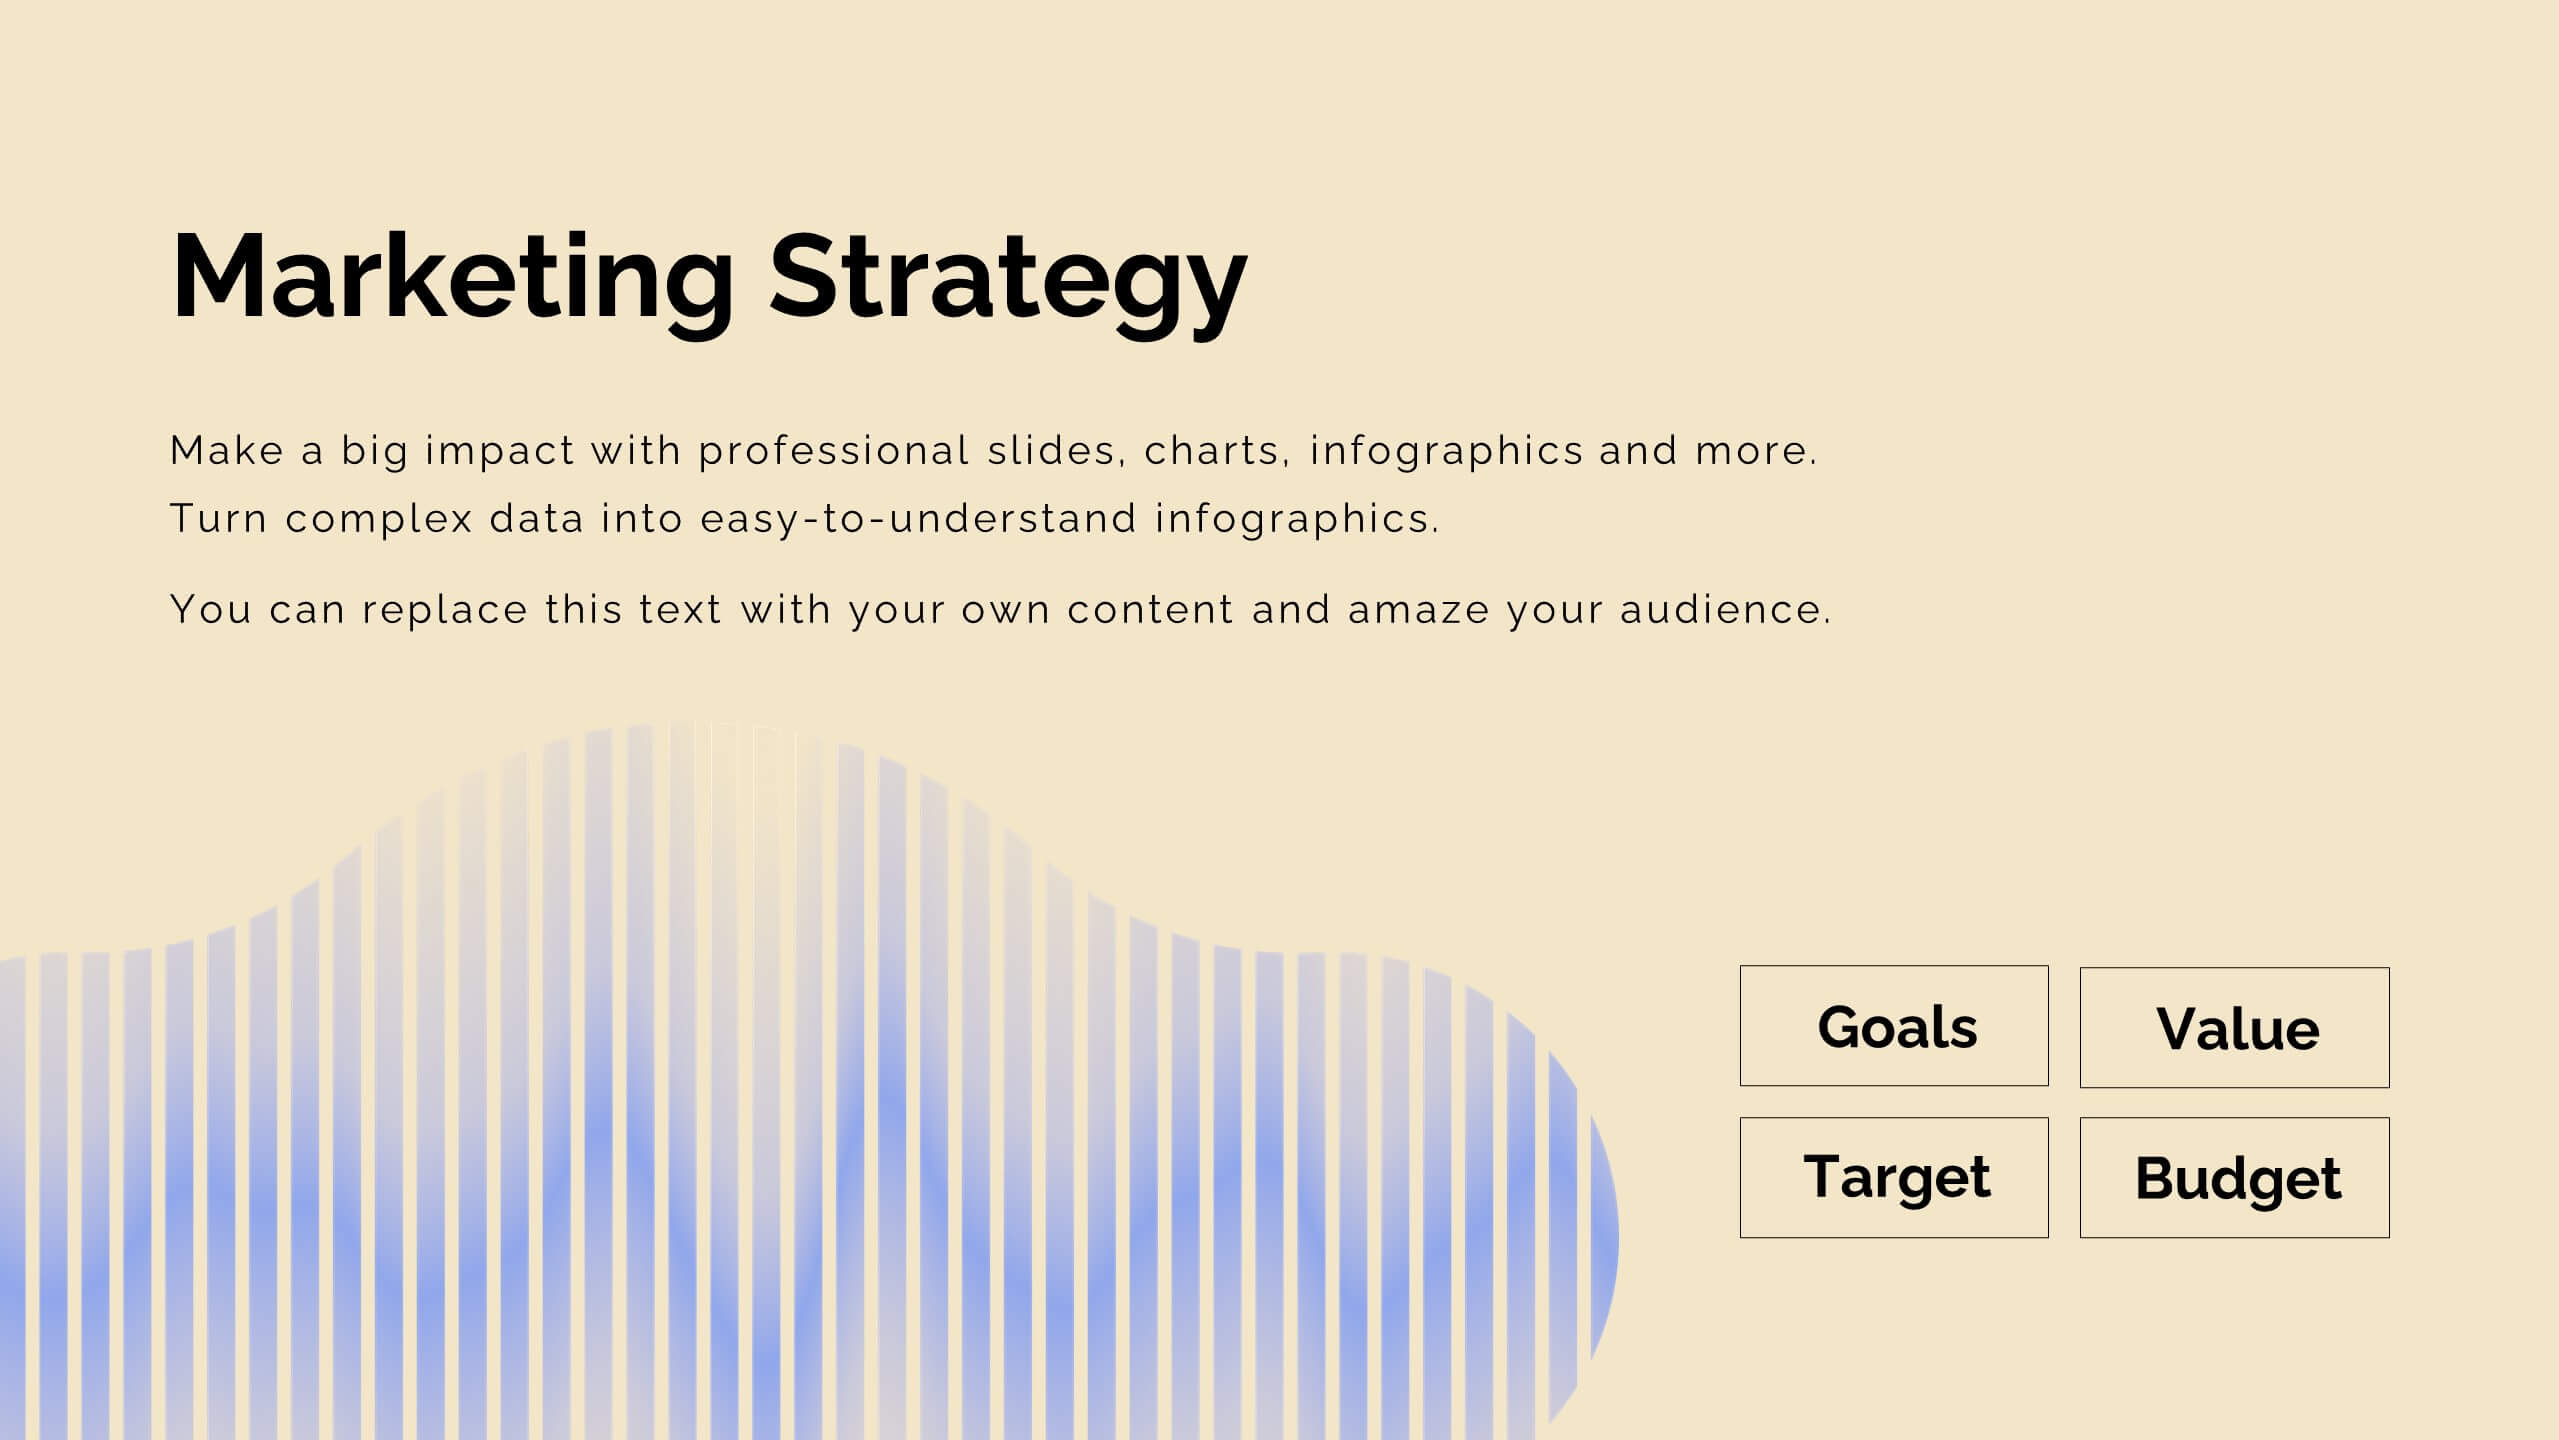
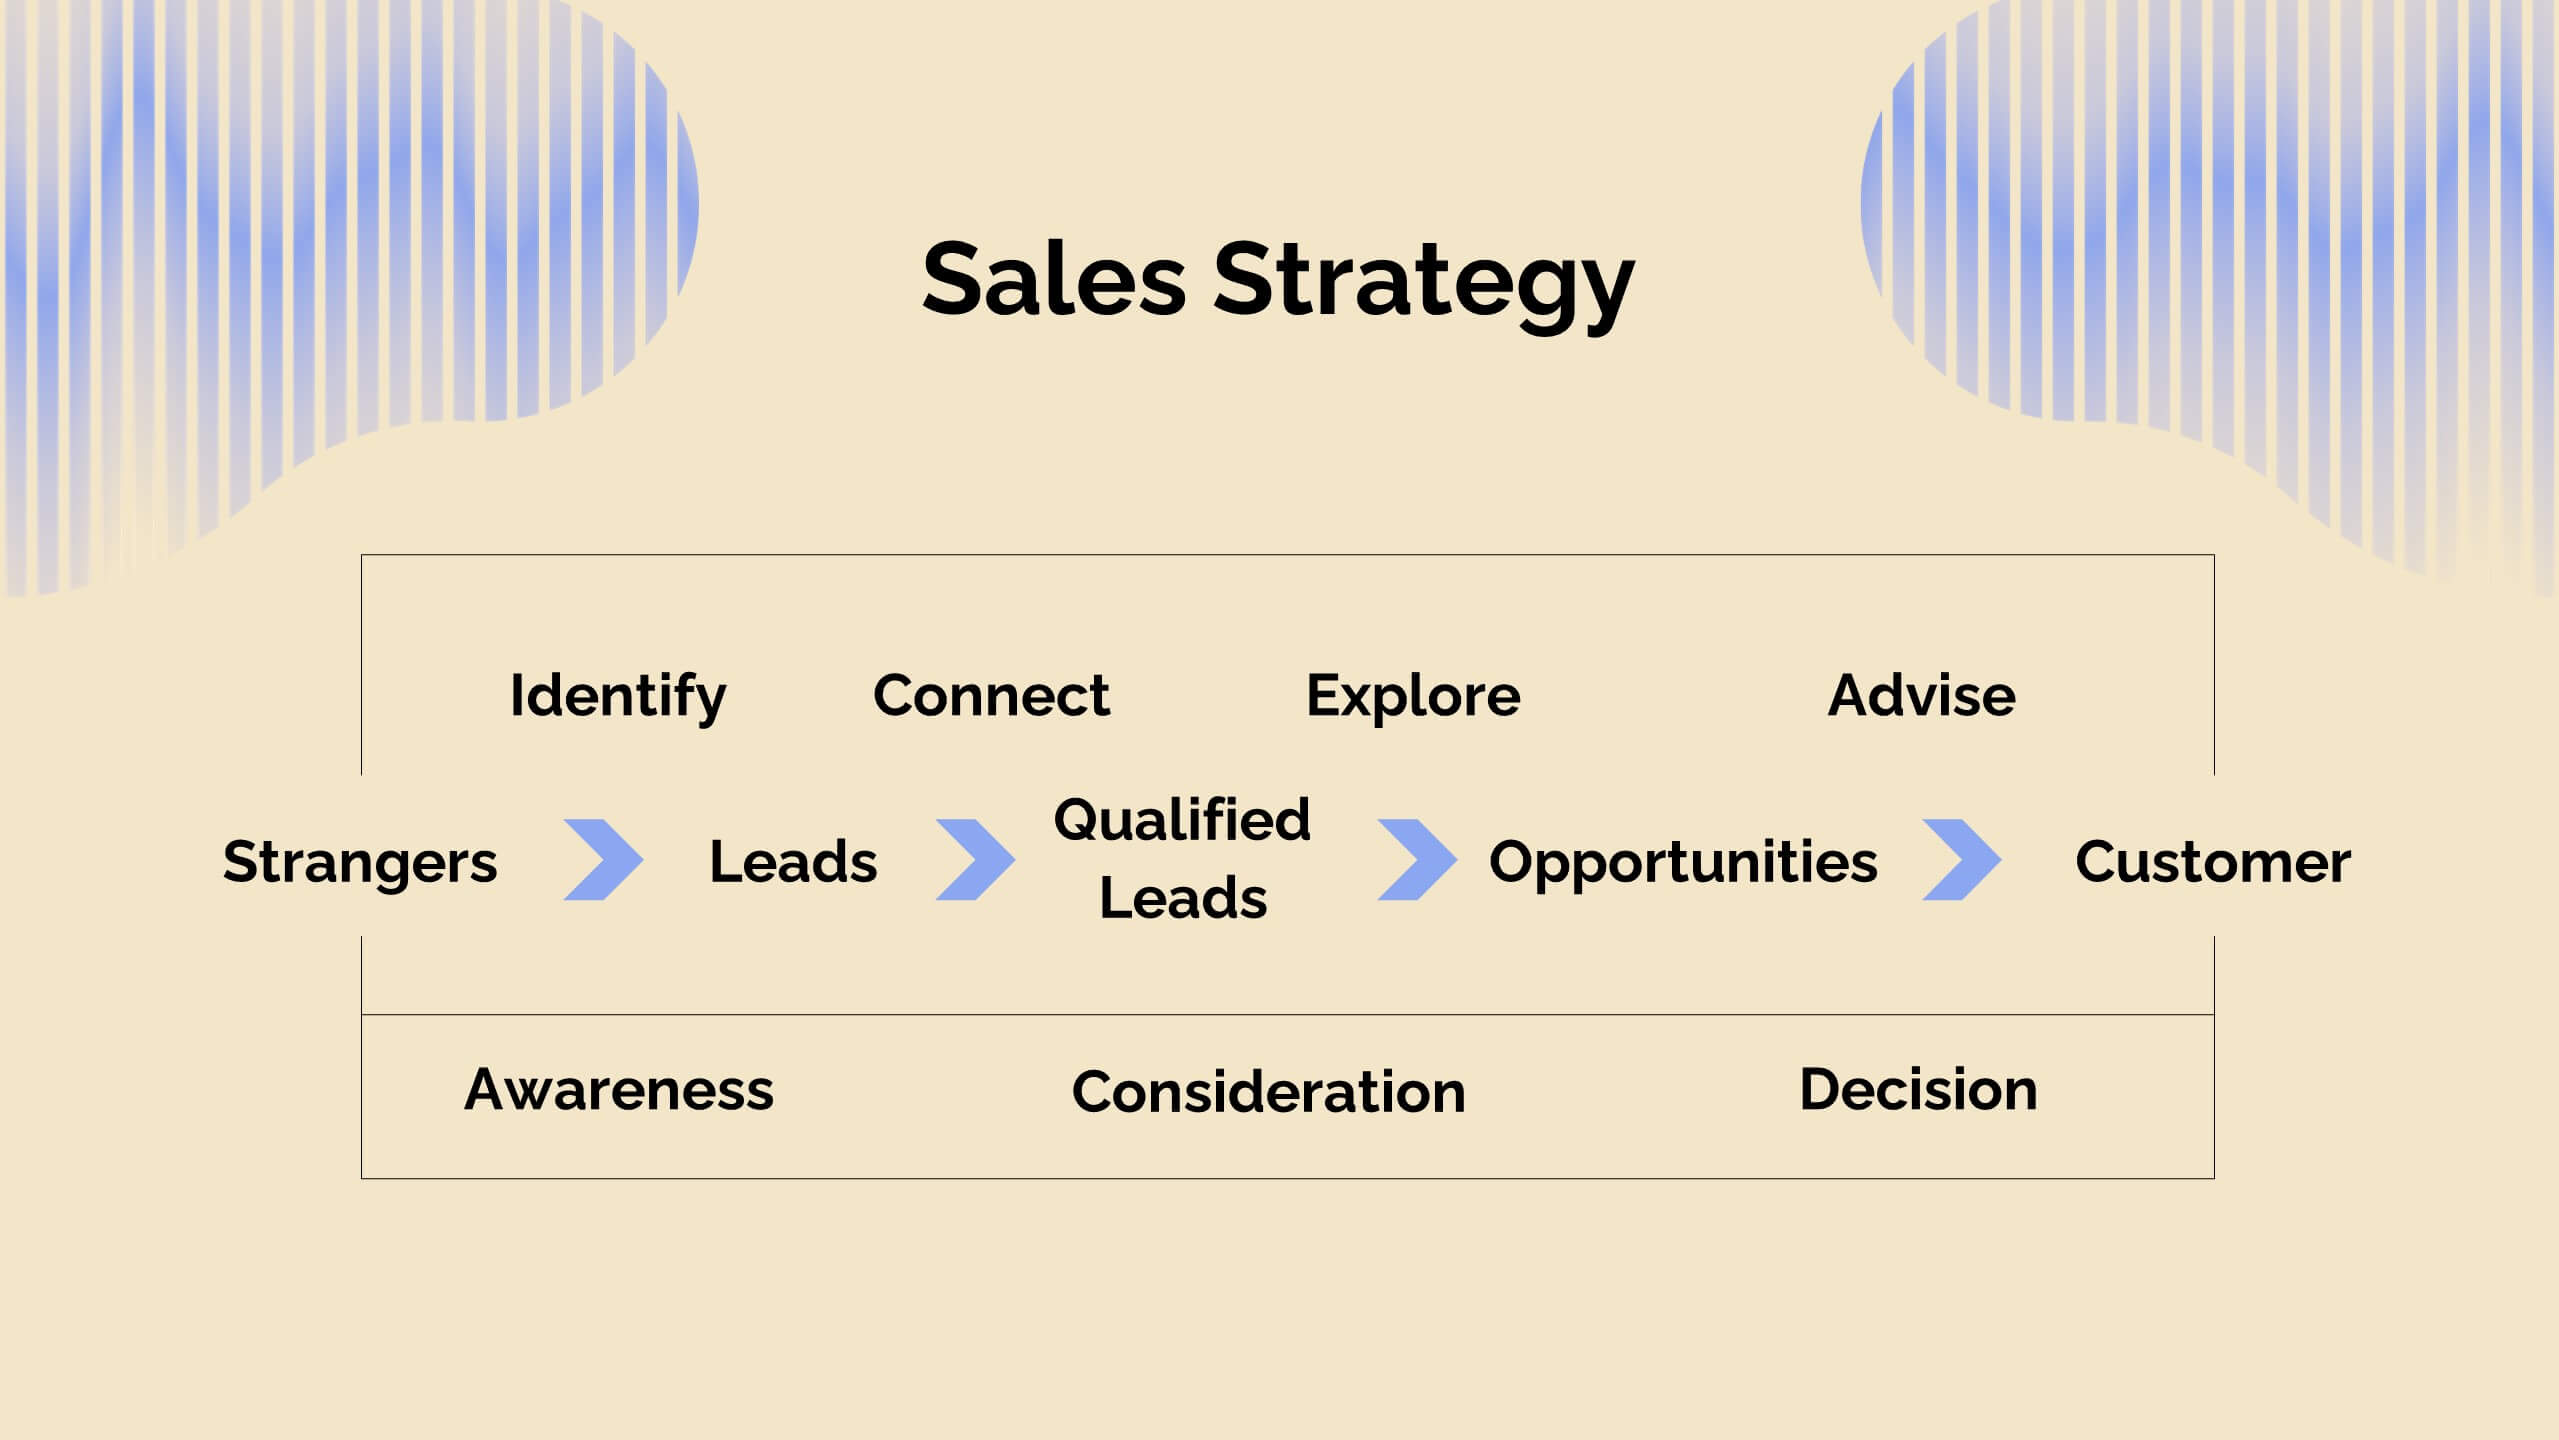
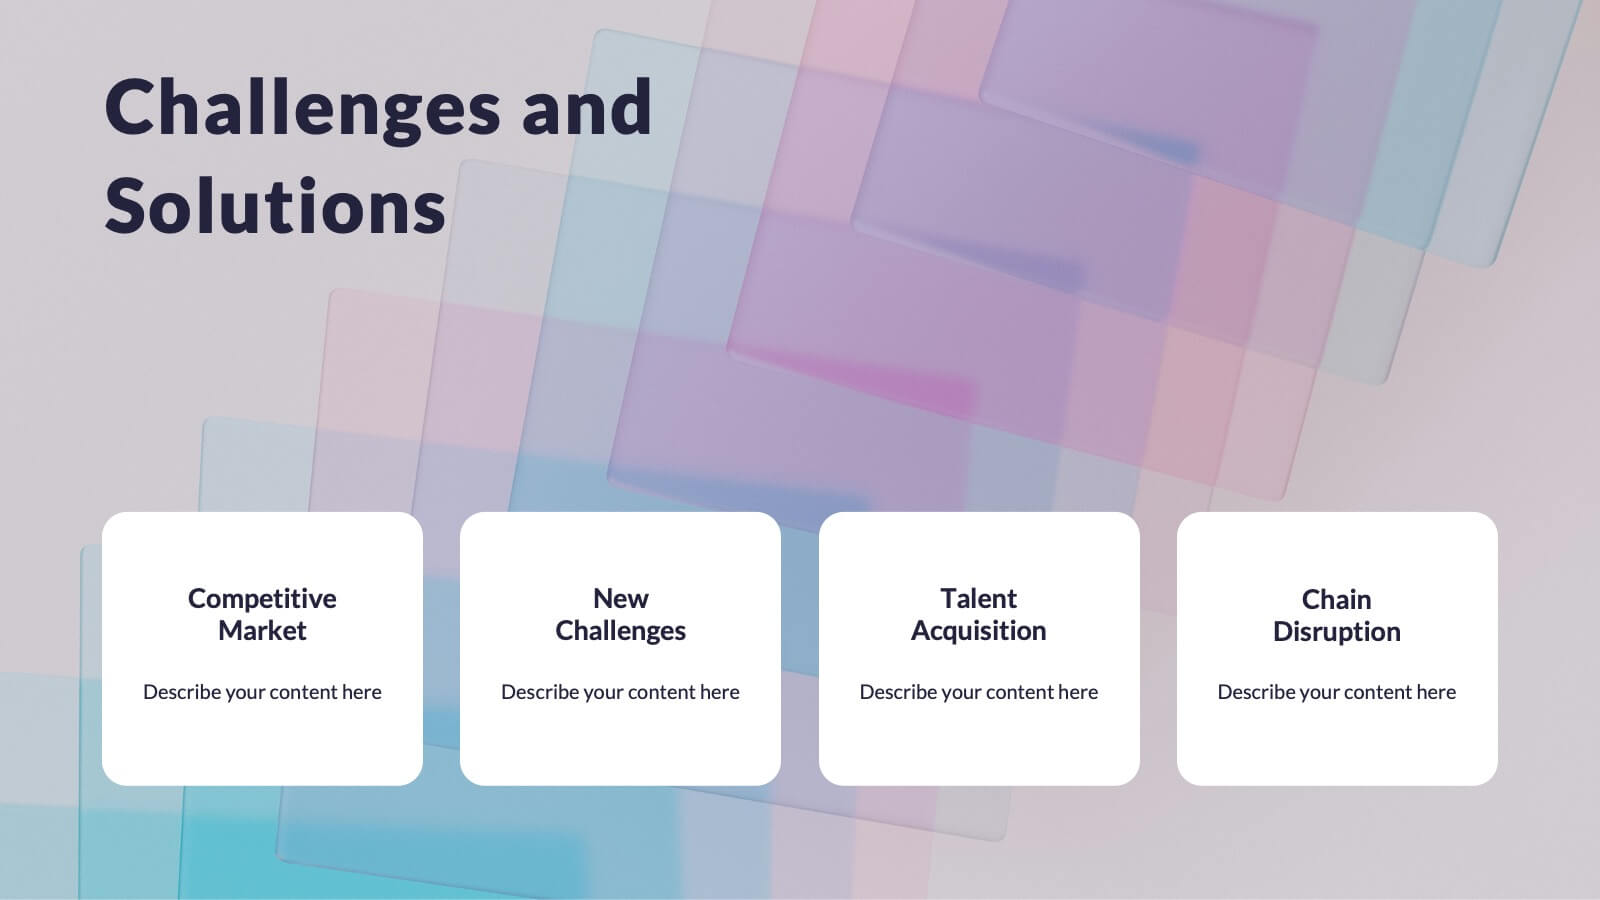
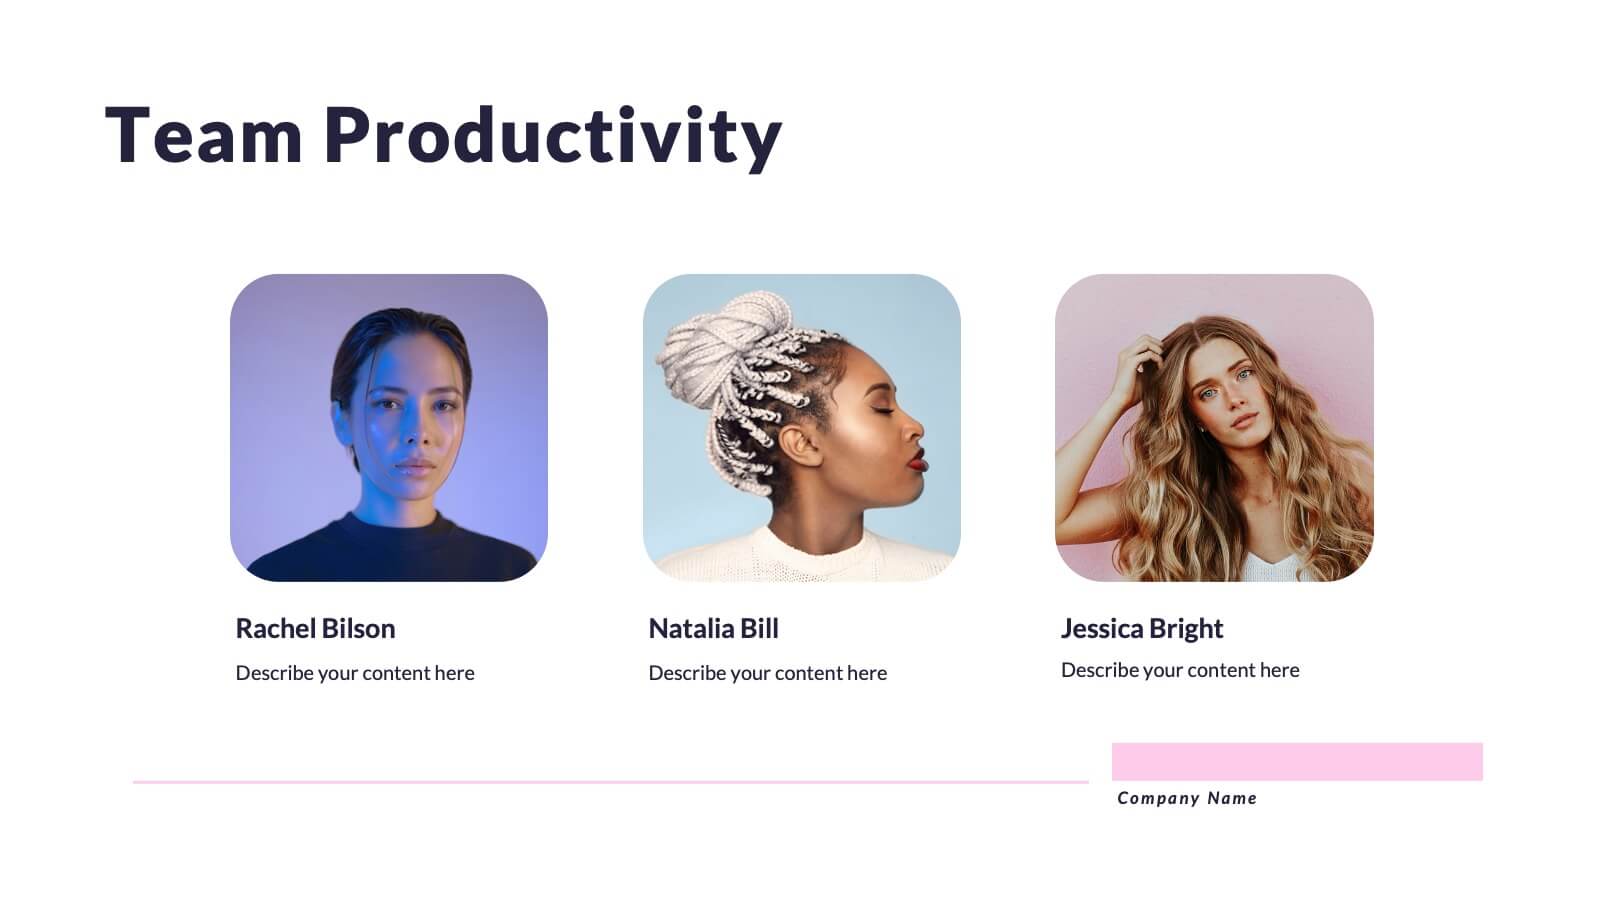
Cometis Small Business Pitch Deck Presentation
Introduce your business effectively with this pitch deck template, crafted for small businesses seeking impactful presentations. From company overview to objectives and strategies, this design is tailored to highlight your key messages. Dive into sections such as business highlights, team introductions, and future goals while maintaining a professional flow. This template includes callout slides, break announcements, and customizable placeholders for your brand visuals and content. Ideal for pitching ideas to stakeholders or presenting at workshops, it ensures clarity and engagement. Compatible with PowerPoint, Google Slides, and Keynote, it offers flexibility across platforms.


20 diapositivas
Victoria Design Strategy Proposal Presentation
This design strategy proposal template, crafted with a soft, modern aesthetic, offers a comprehensive layout for presenting design elements, processes, and deliverables. Each slide provides a clean, structured approach to showcase your brand’s design brief, target audience, color palette, typography, mood board, and project timeline. Perfect for designers and agencies, it supports PowerPoint, Keynote, and Google Slides for versatile use.


6 diapositivas
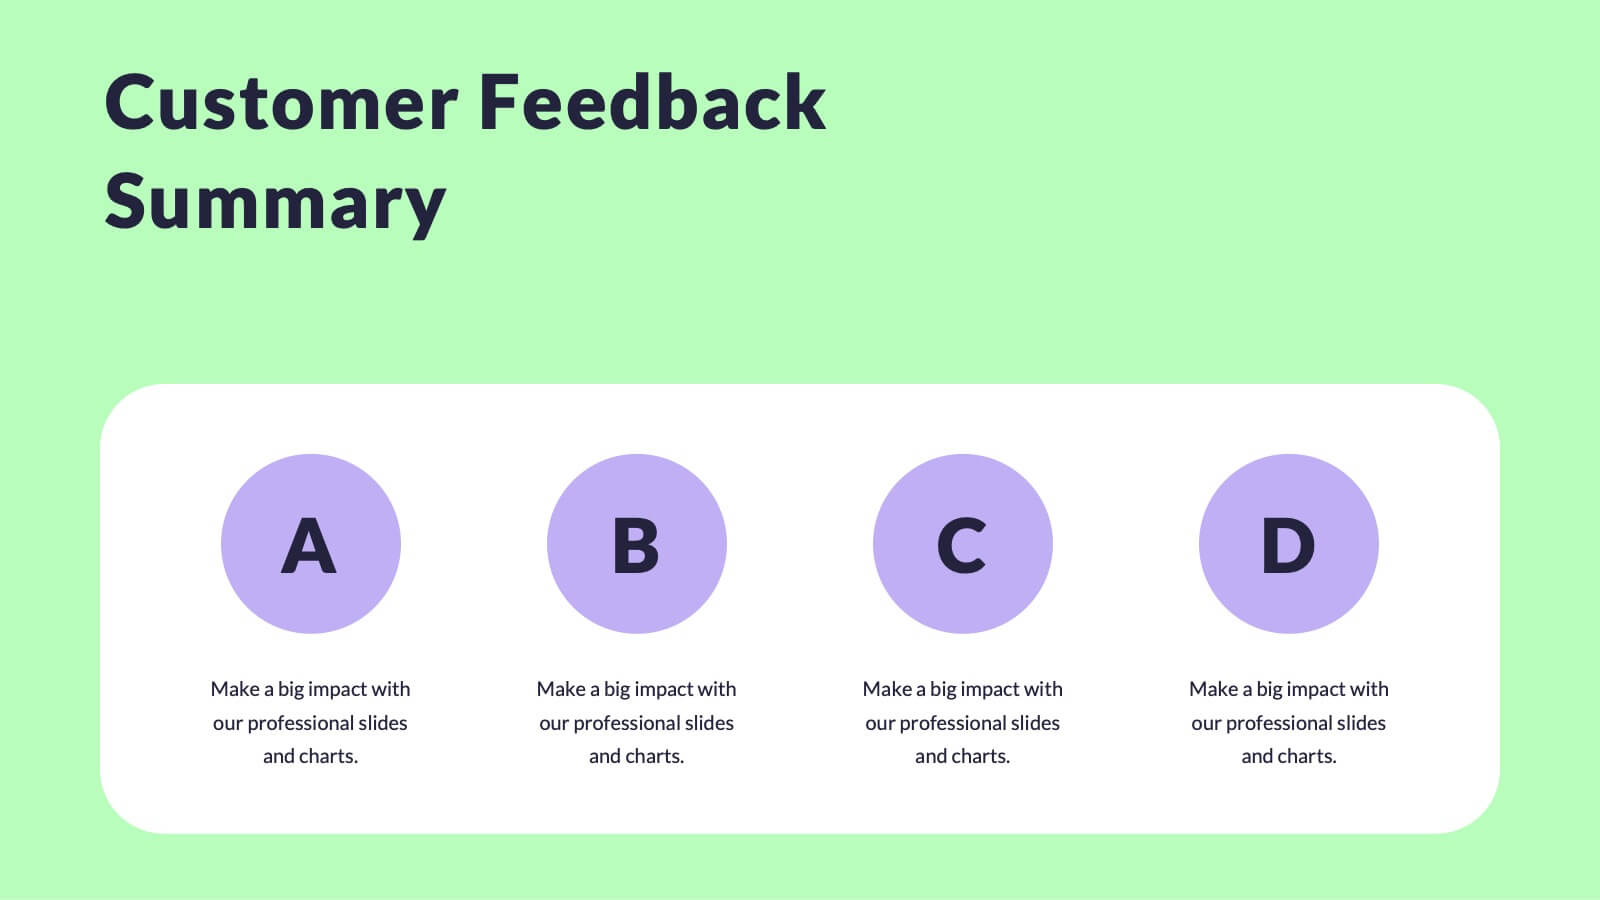
Preventative Healthcare and Fitness Presentation
Promote wellness and proactive care with this colorful and clean slide layout. Featuring a clipboard-style design with stacked icons and aligned descriptions from A to E, it’s perfect for presenting fitness tips, health programs, or preventative strategies. The vibrant sections help guide viewers through key points at a glance. Fully editable and compatible with PowerPoint, Keynote, and Google Slides.


7 diapositivas
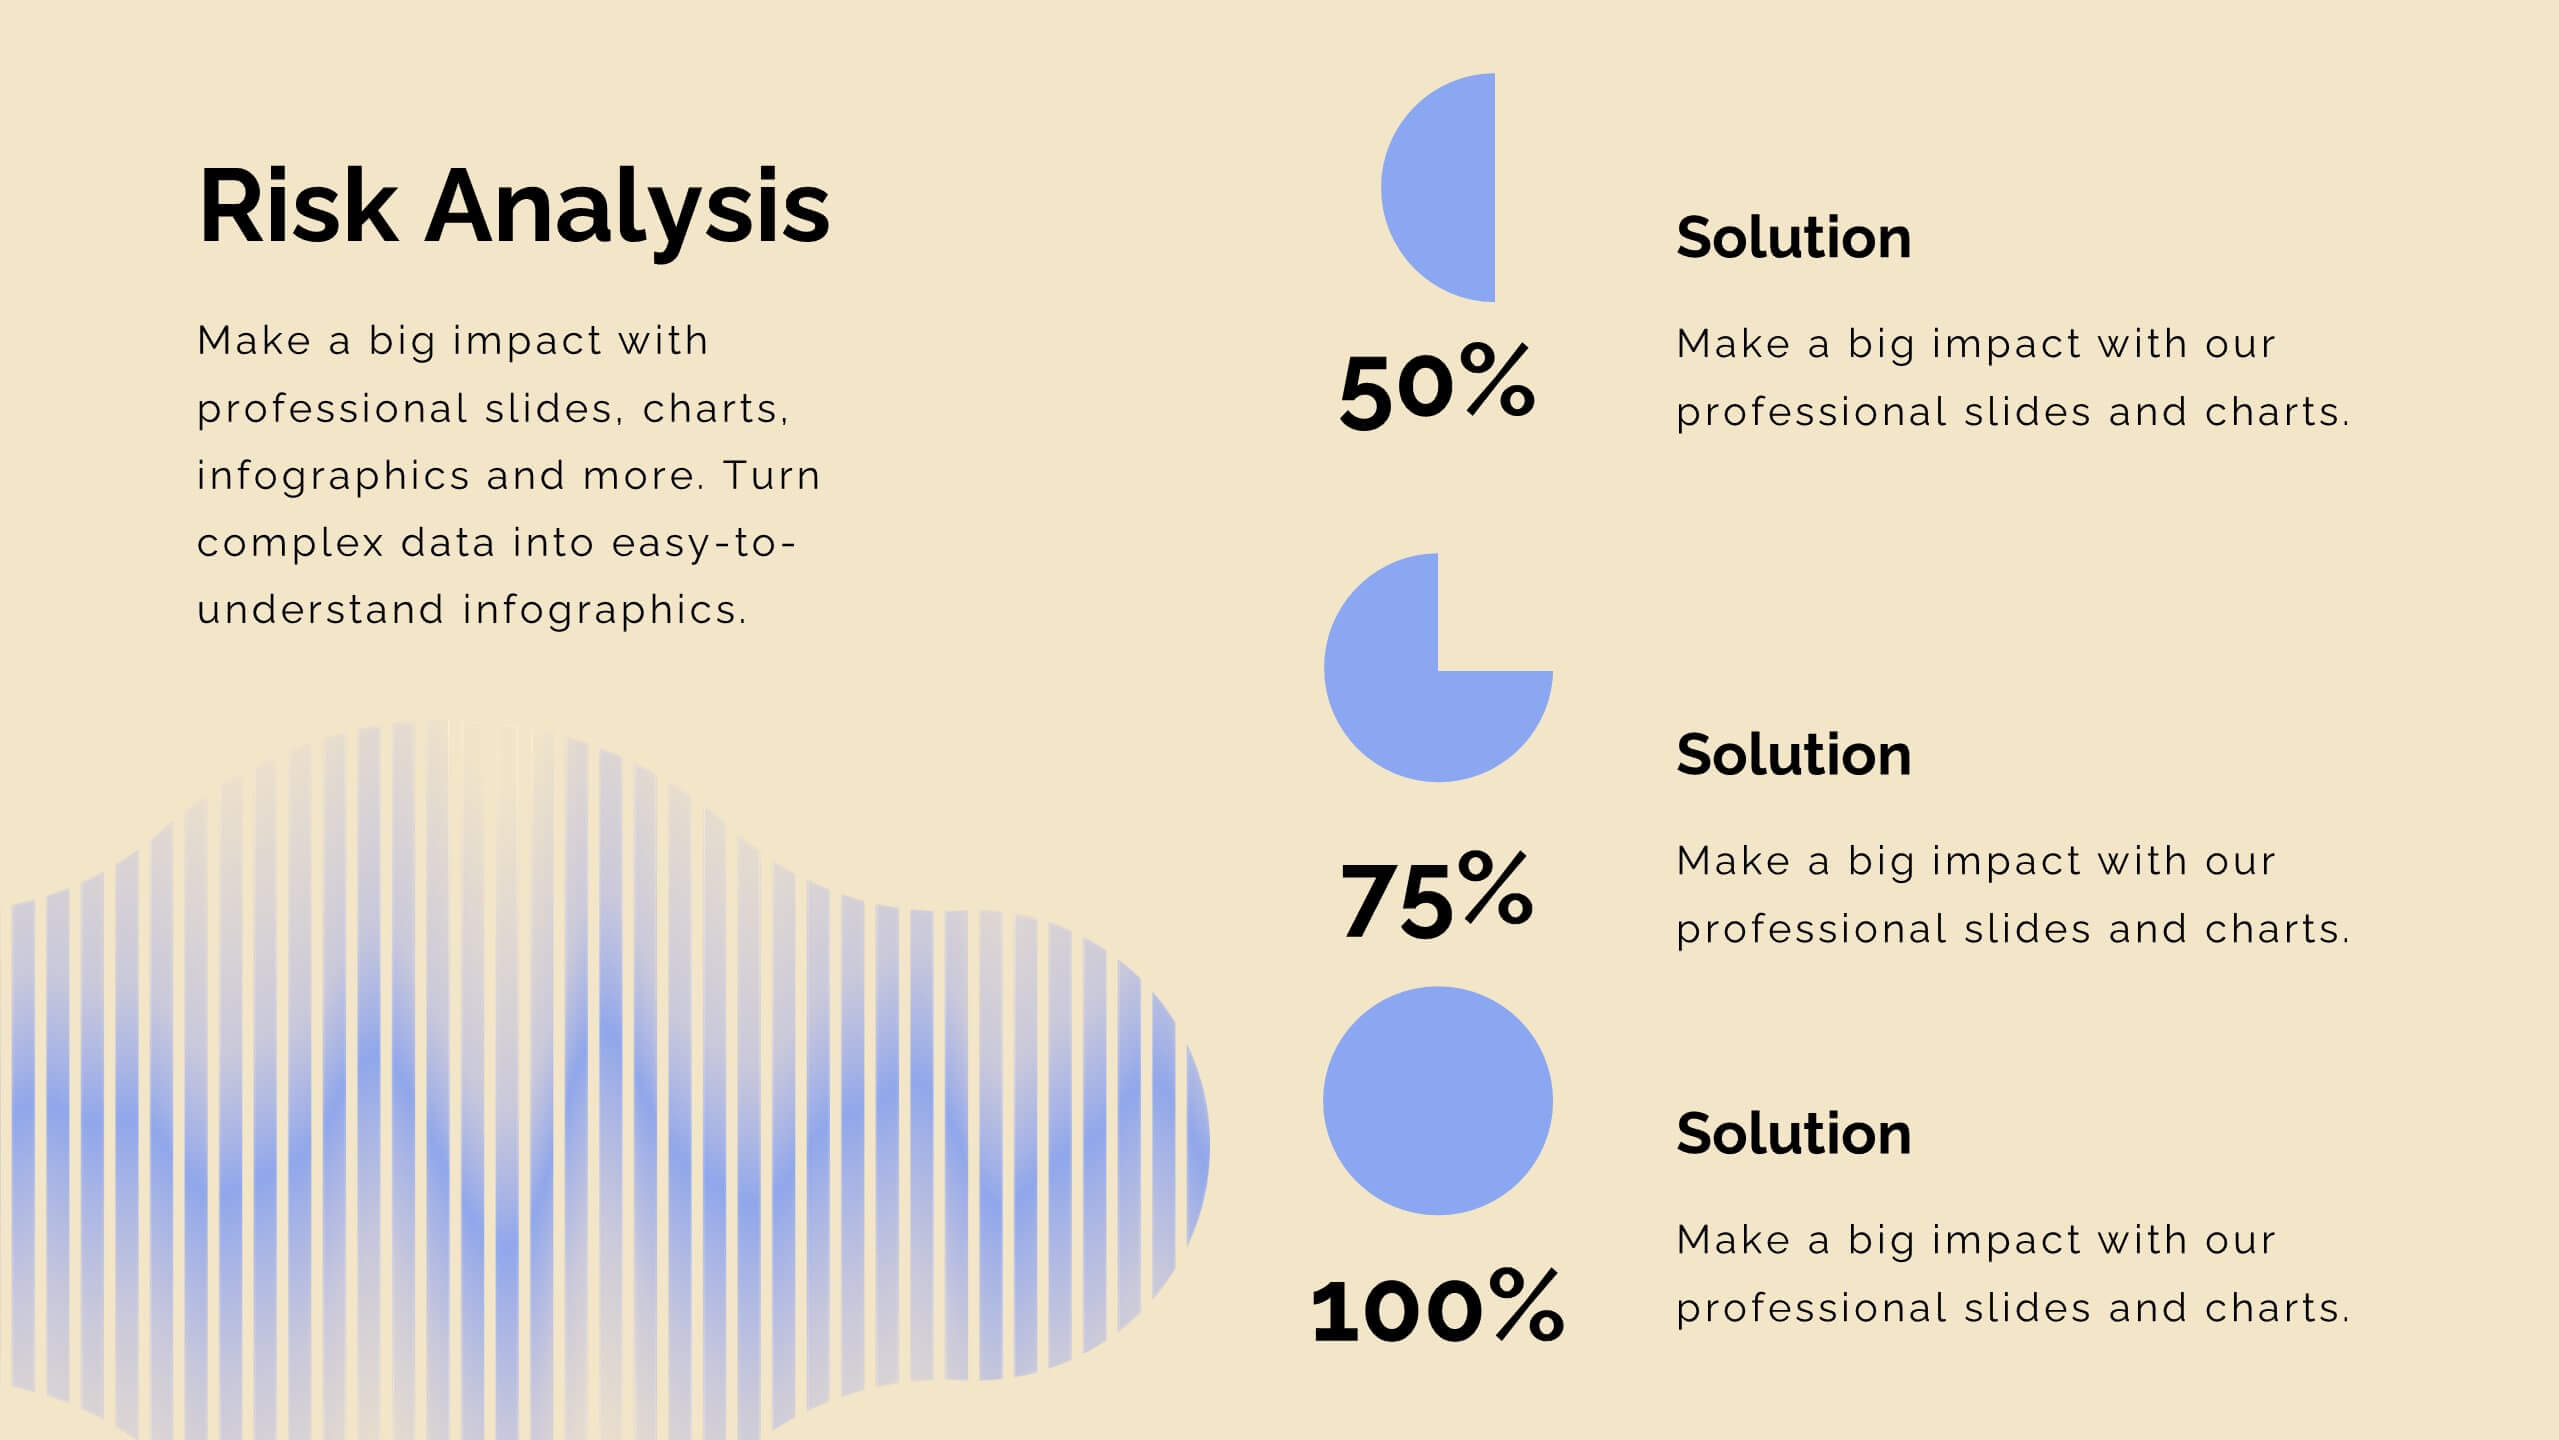
Common Problem Infographic
These slides offer a professional and clean design approach for presenting common challenges or issues within a project or organizational setting. Each slide is carefully structured to allow clear delineation and analysis of problems, providing a straightforward layout for presenting solutions and discussions. The design palette ranges from minimalistic to dynamic, catering to various presentation needs. Whether you are addressing an internal team, stakeholders, or a broader audience, these templates are adaptable to convey critical problems effectively. You can easily customize these slides to integrate specific details relevant to the issues at hand, making your presentation not only informative but also visually engaging.


6 diapositivas
Common Question for Businesses Infographic
Captivate your audience and enhance interaction with our collection of slide templates, perfect for engaging beginners and prompting them to ask top questions. These templates feature inviting designs and dynamic layouts, making them ideal for educational sessions, workshops, or any presentation aimed at beginners. Each template employs bright colors and creative graphics to draw attention and stimulate curiosity. The designs are crafted to not only pose questions but also to invite thoughtful responses and active participation. Whether you are hosting a seminar, leading a training session, or facilitating a learning module, these slides provide a friendly and approachable way to encourage questions and discussions. Customize these templates to suit your specific session, adapting the text, colors, and images to fit the theme and audience. They are a fantastic tool for educators and trainers looking to create a more engaging and interactive learning environment.


23 diapositivas
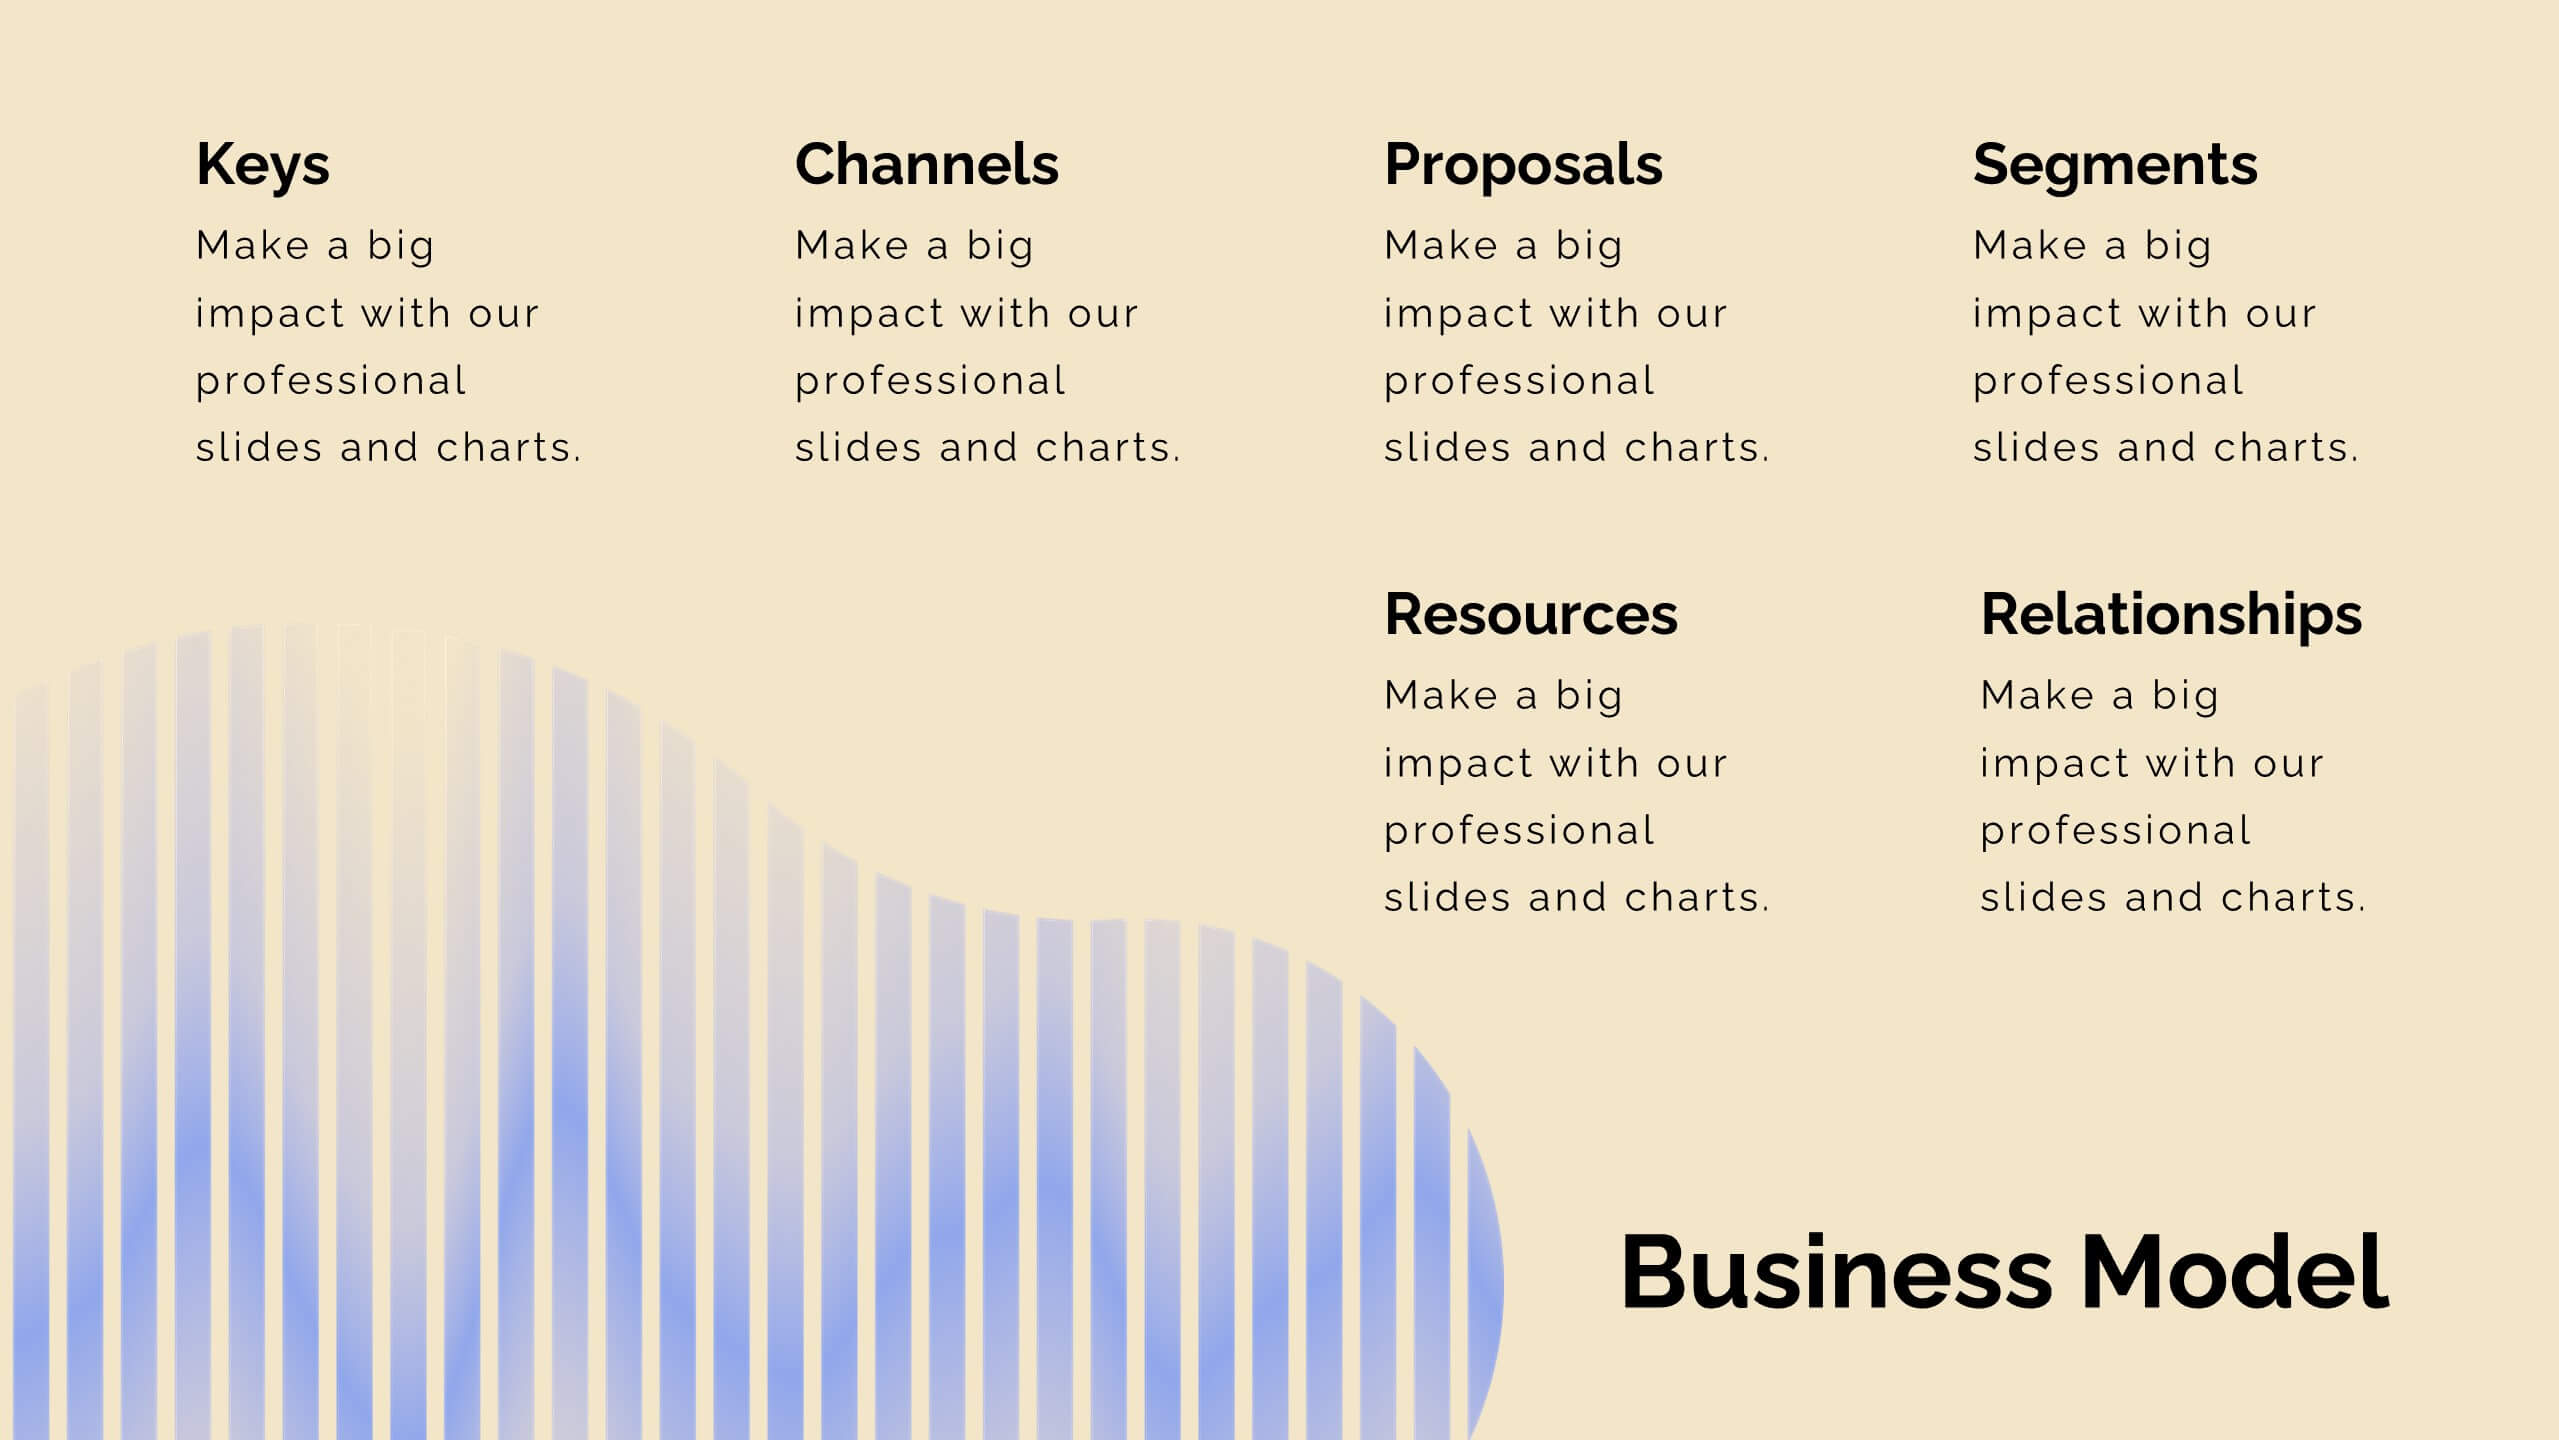
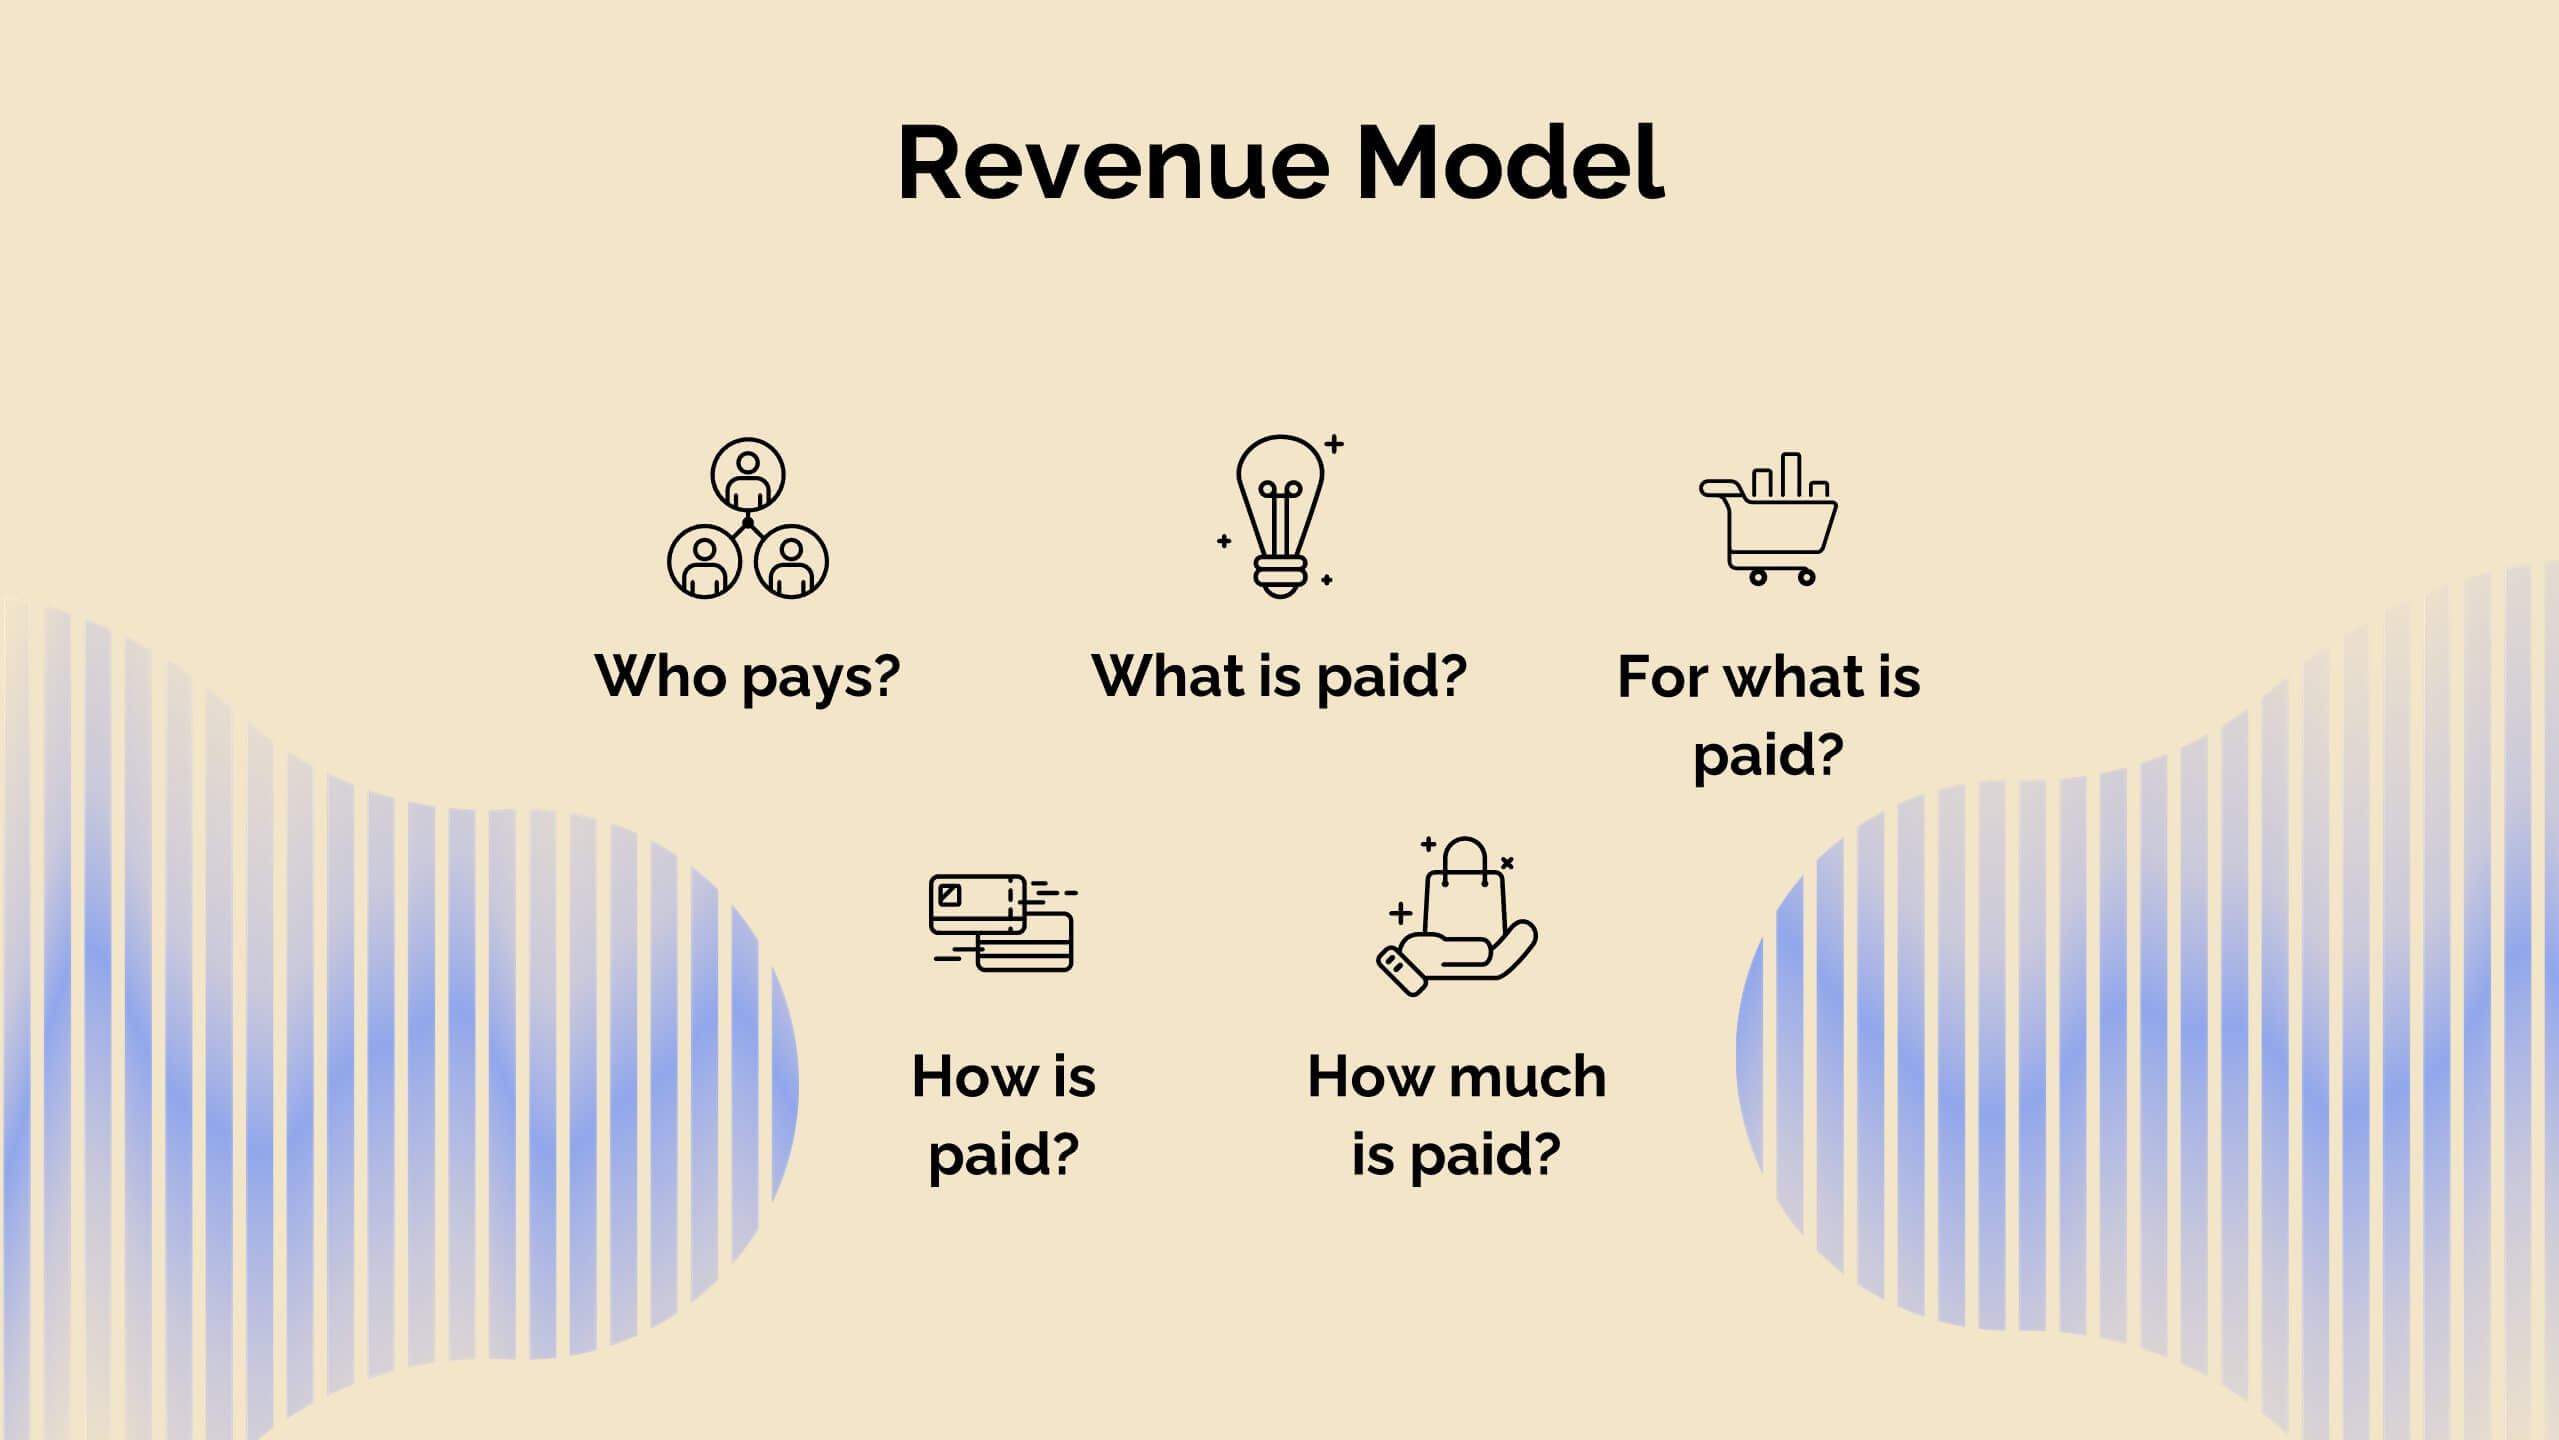
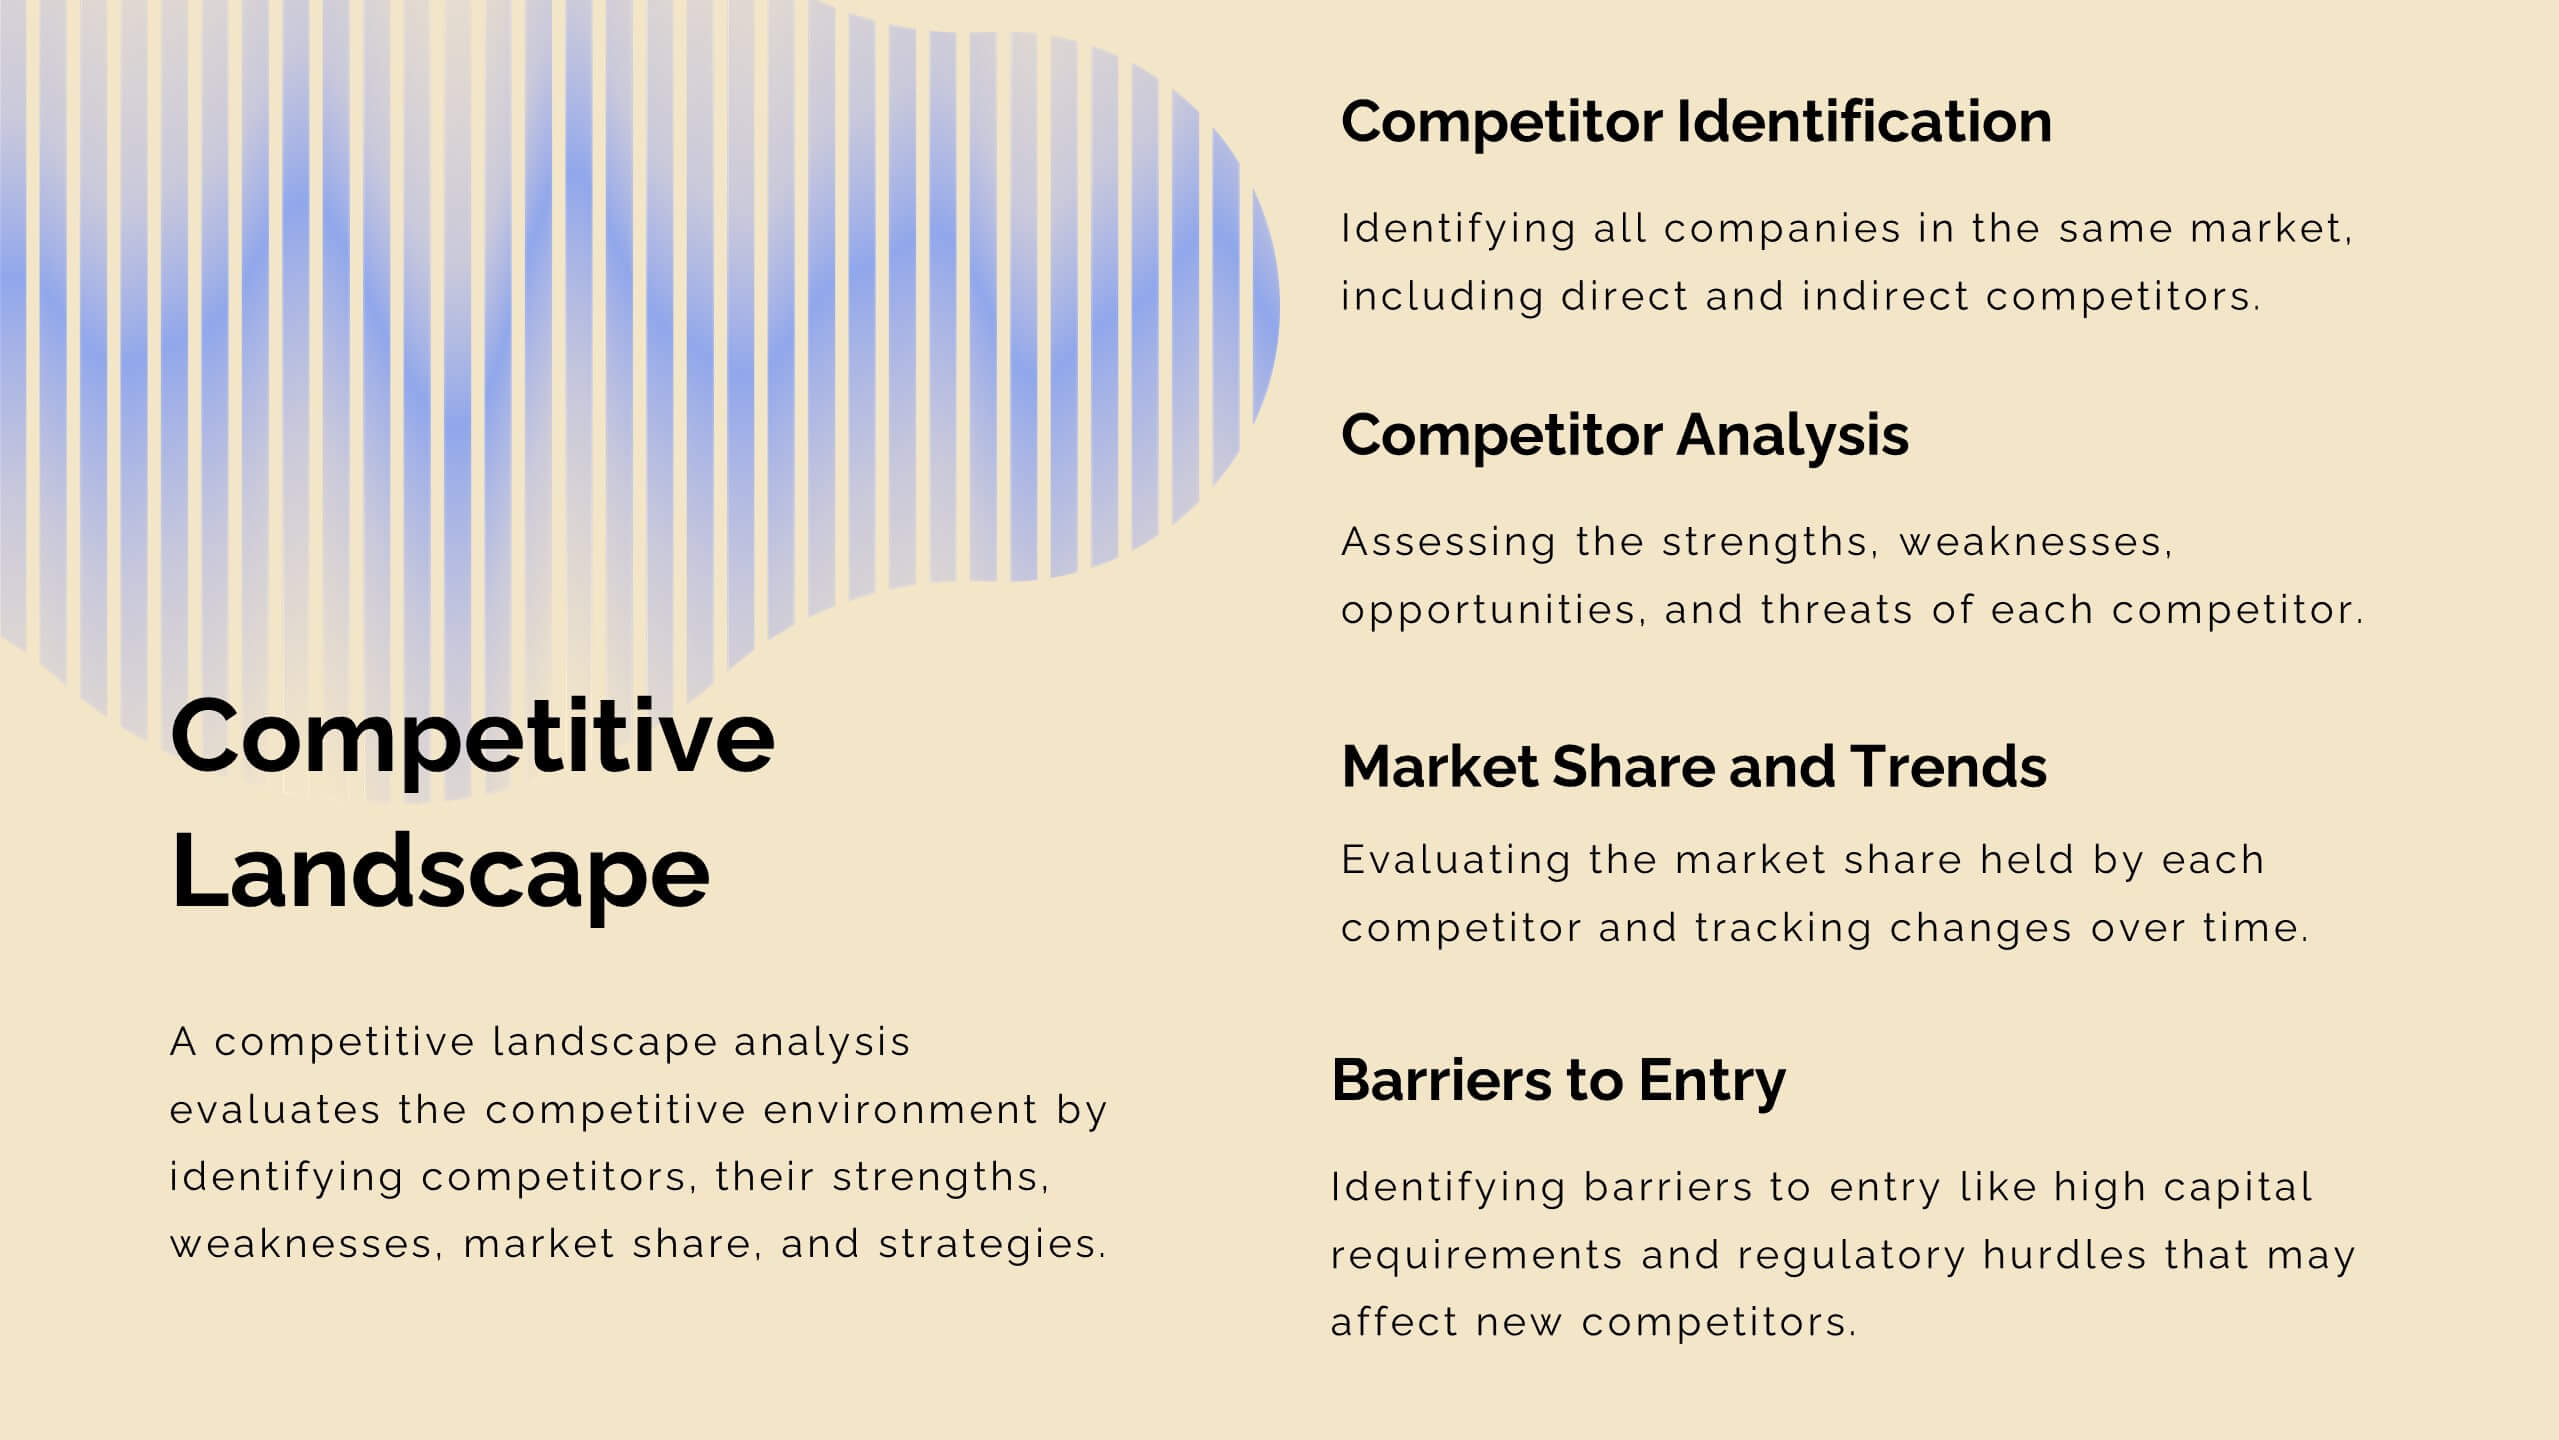
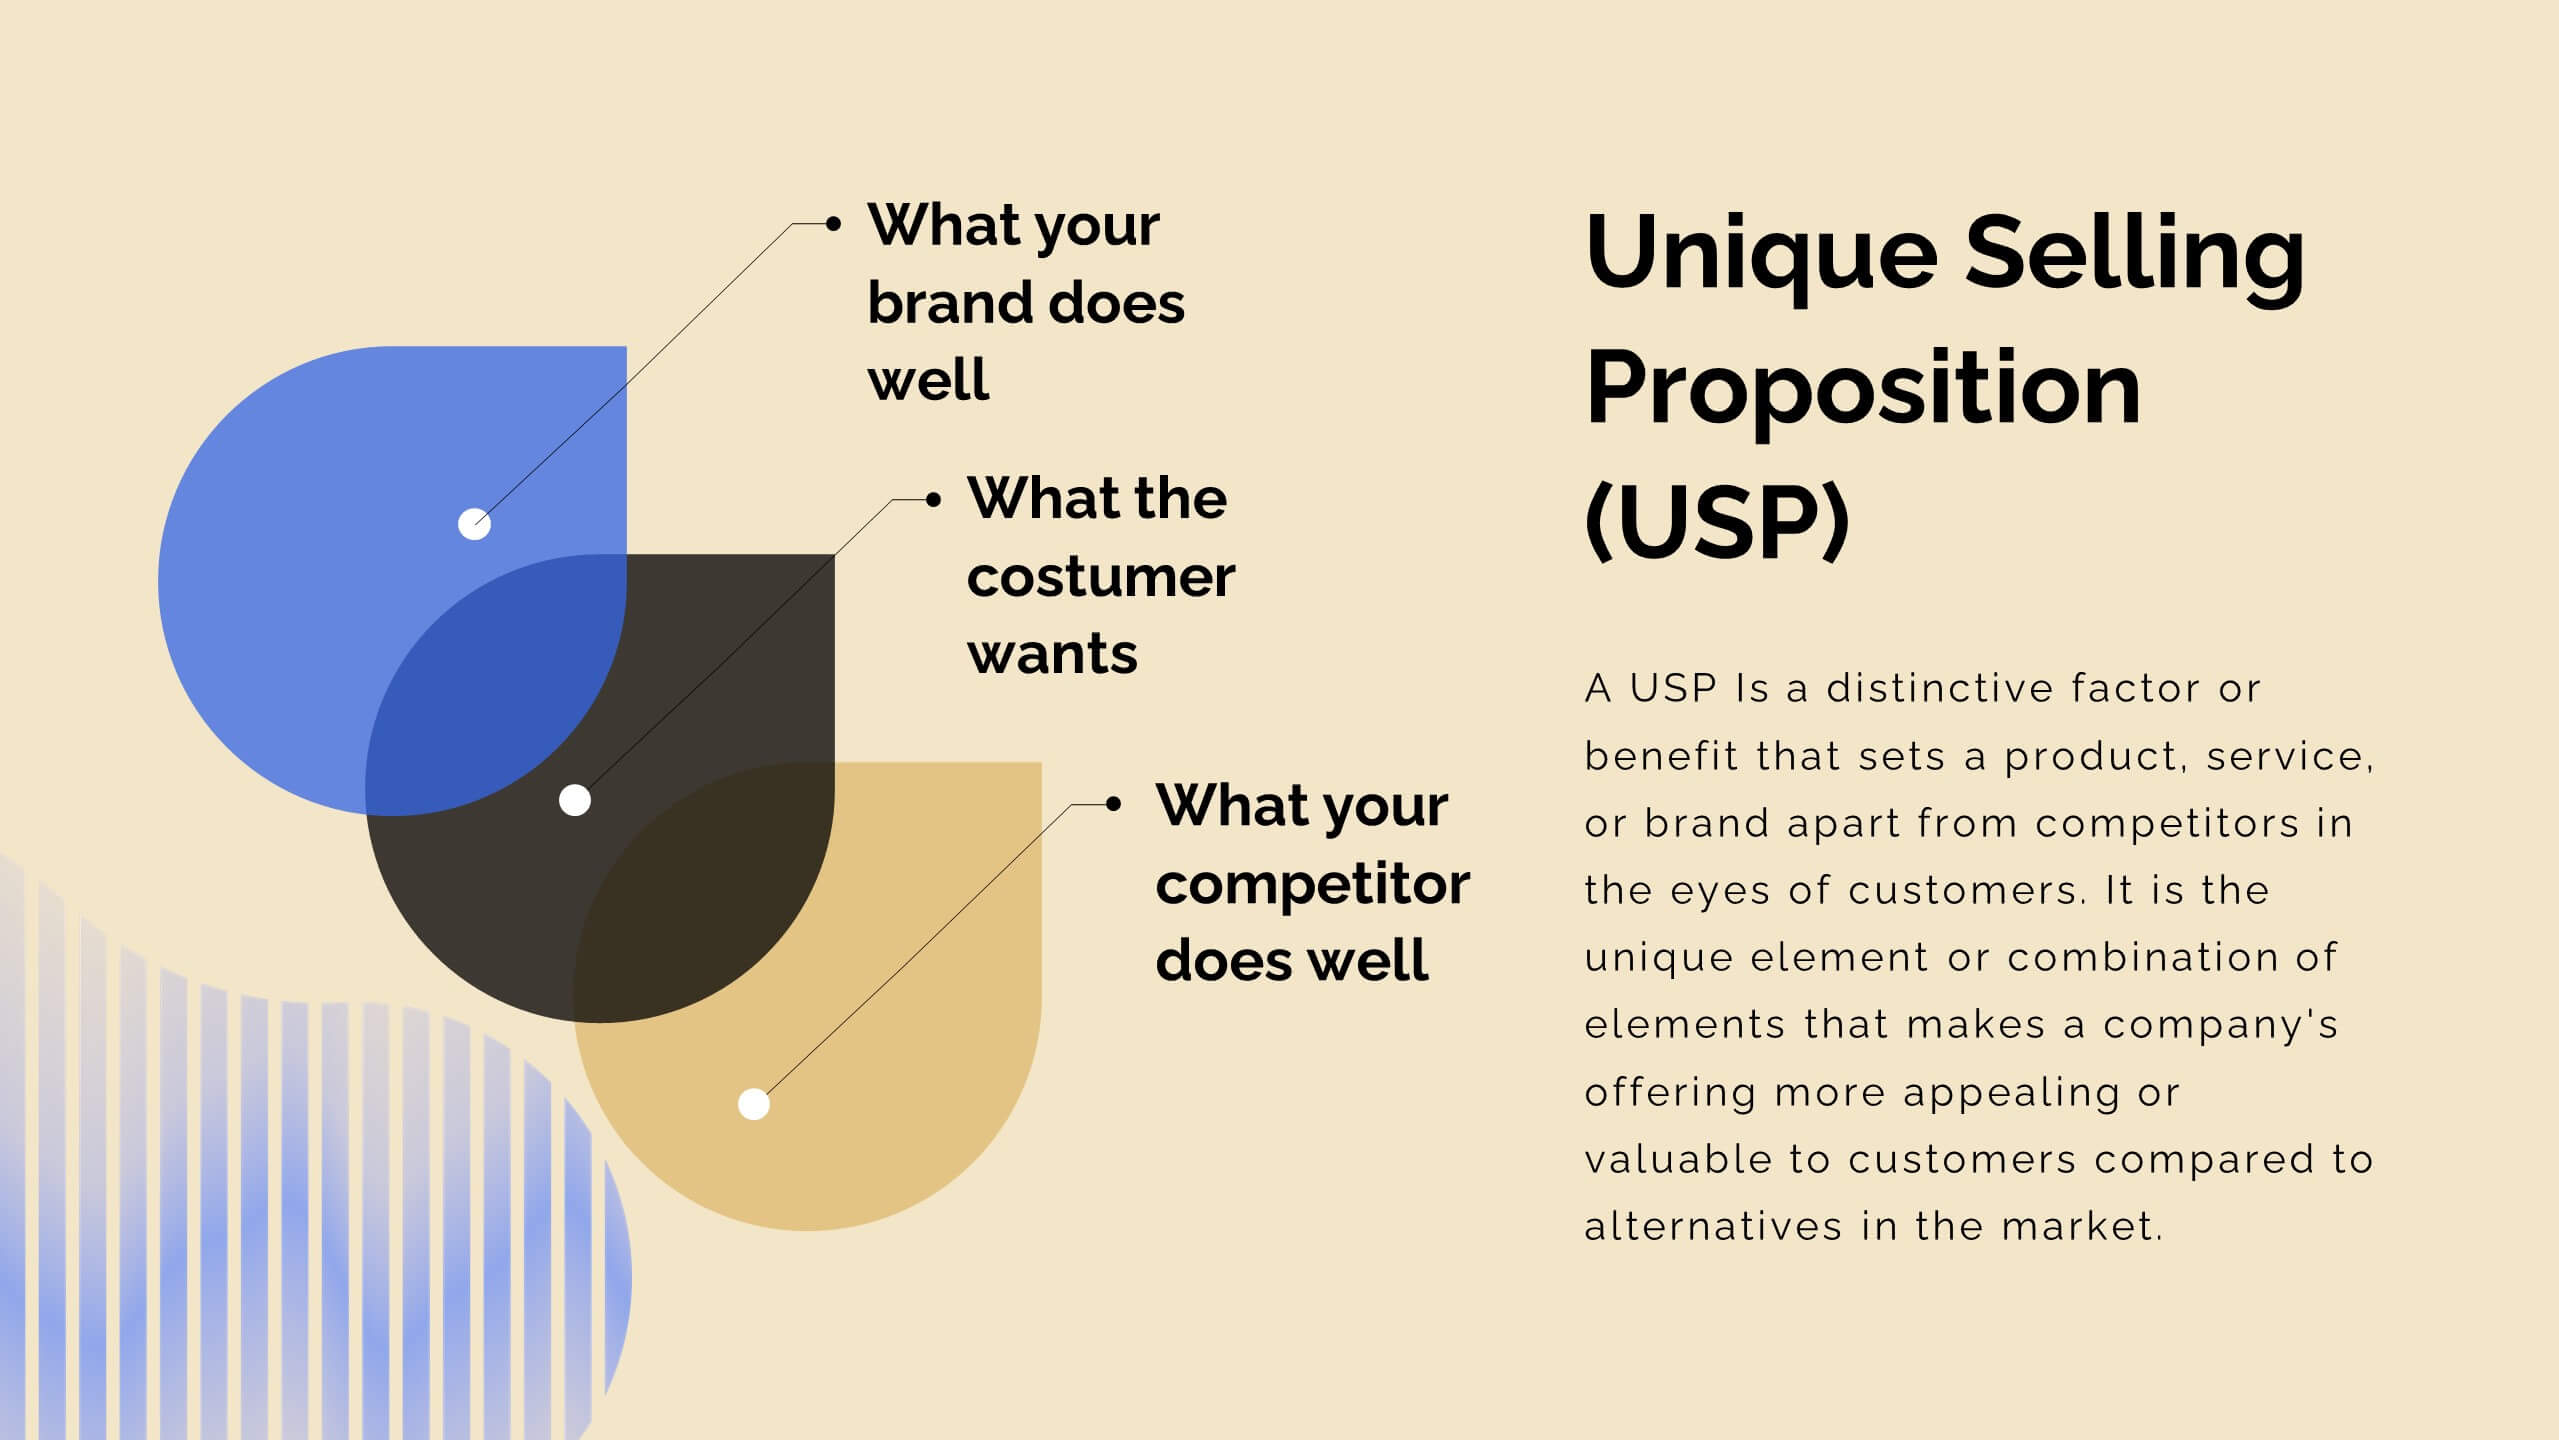
Journey Product Roadmap Presentation
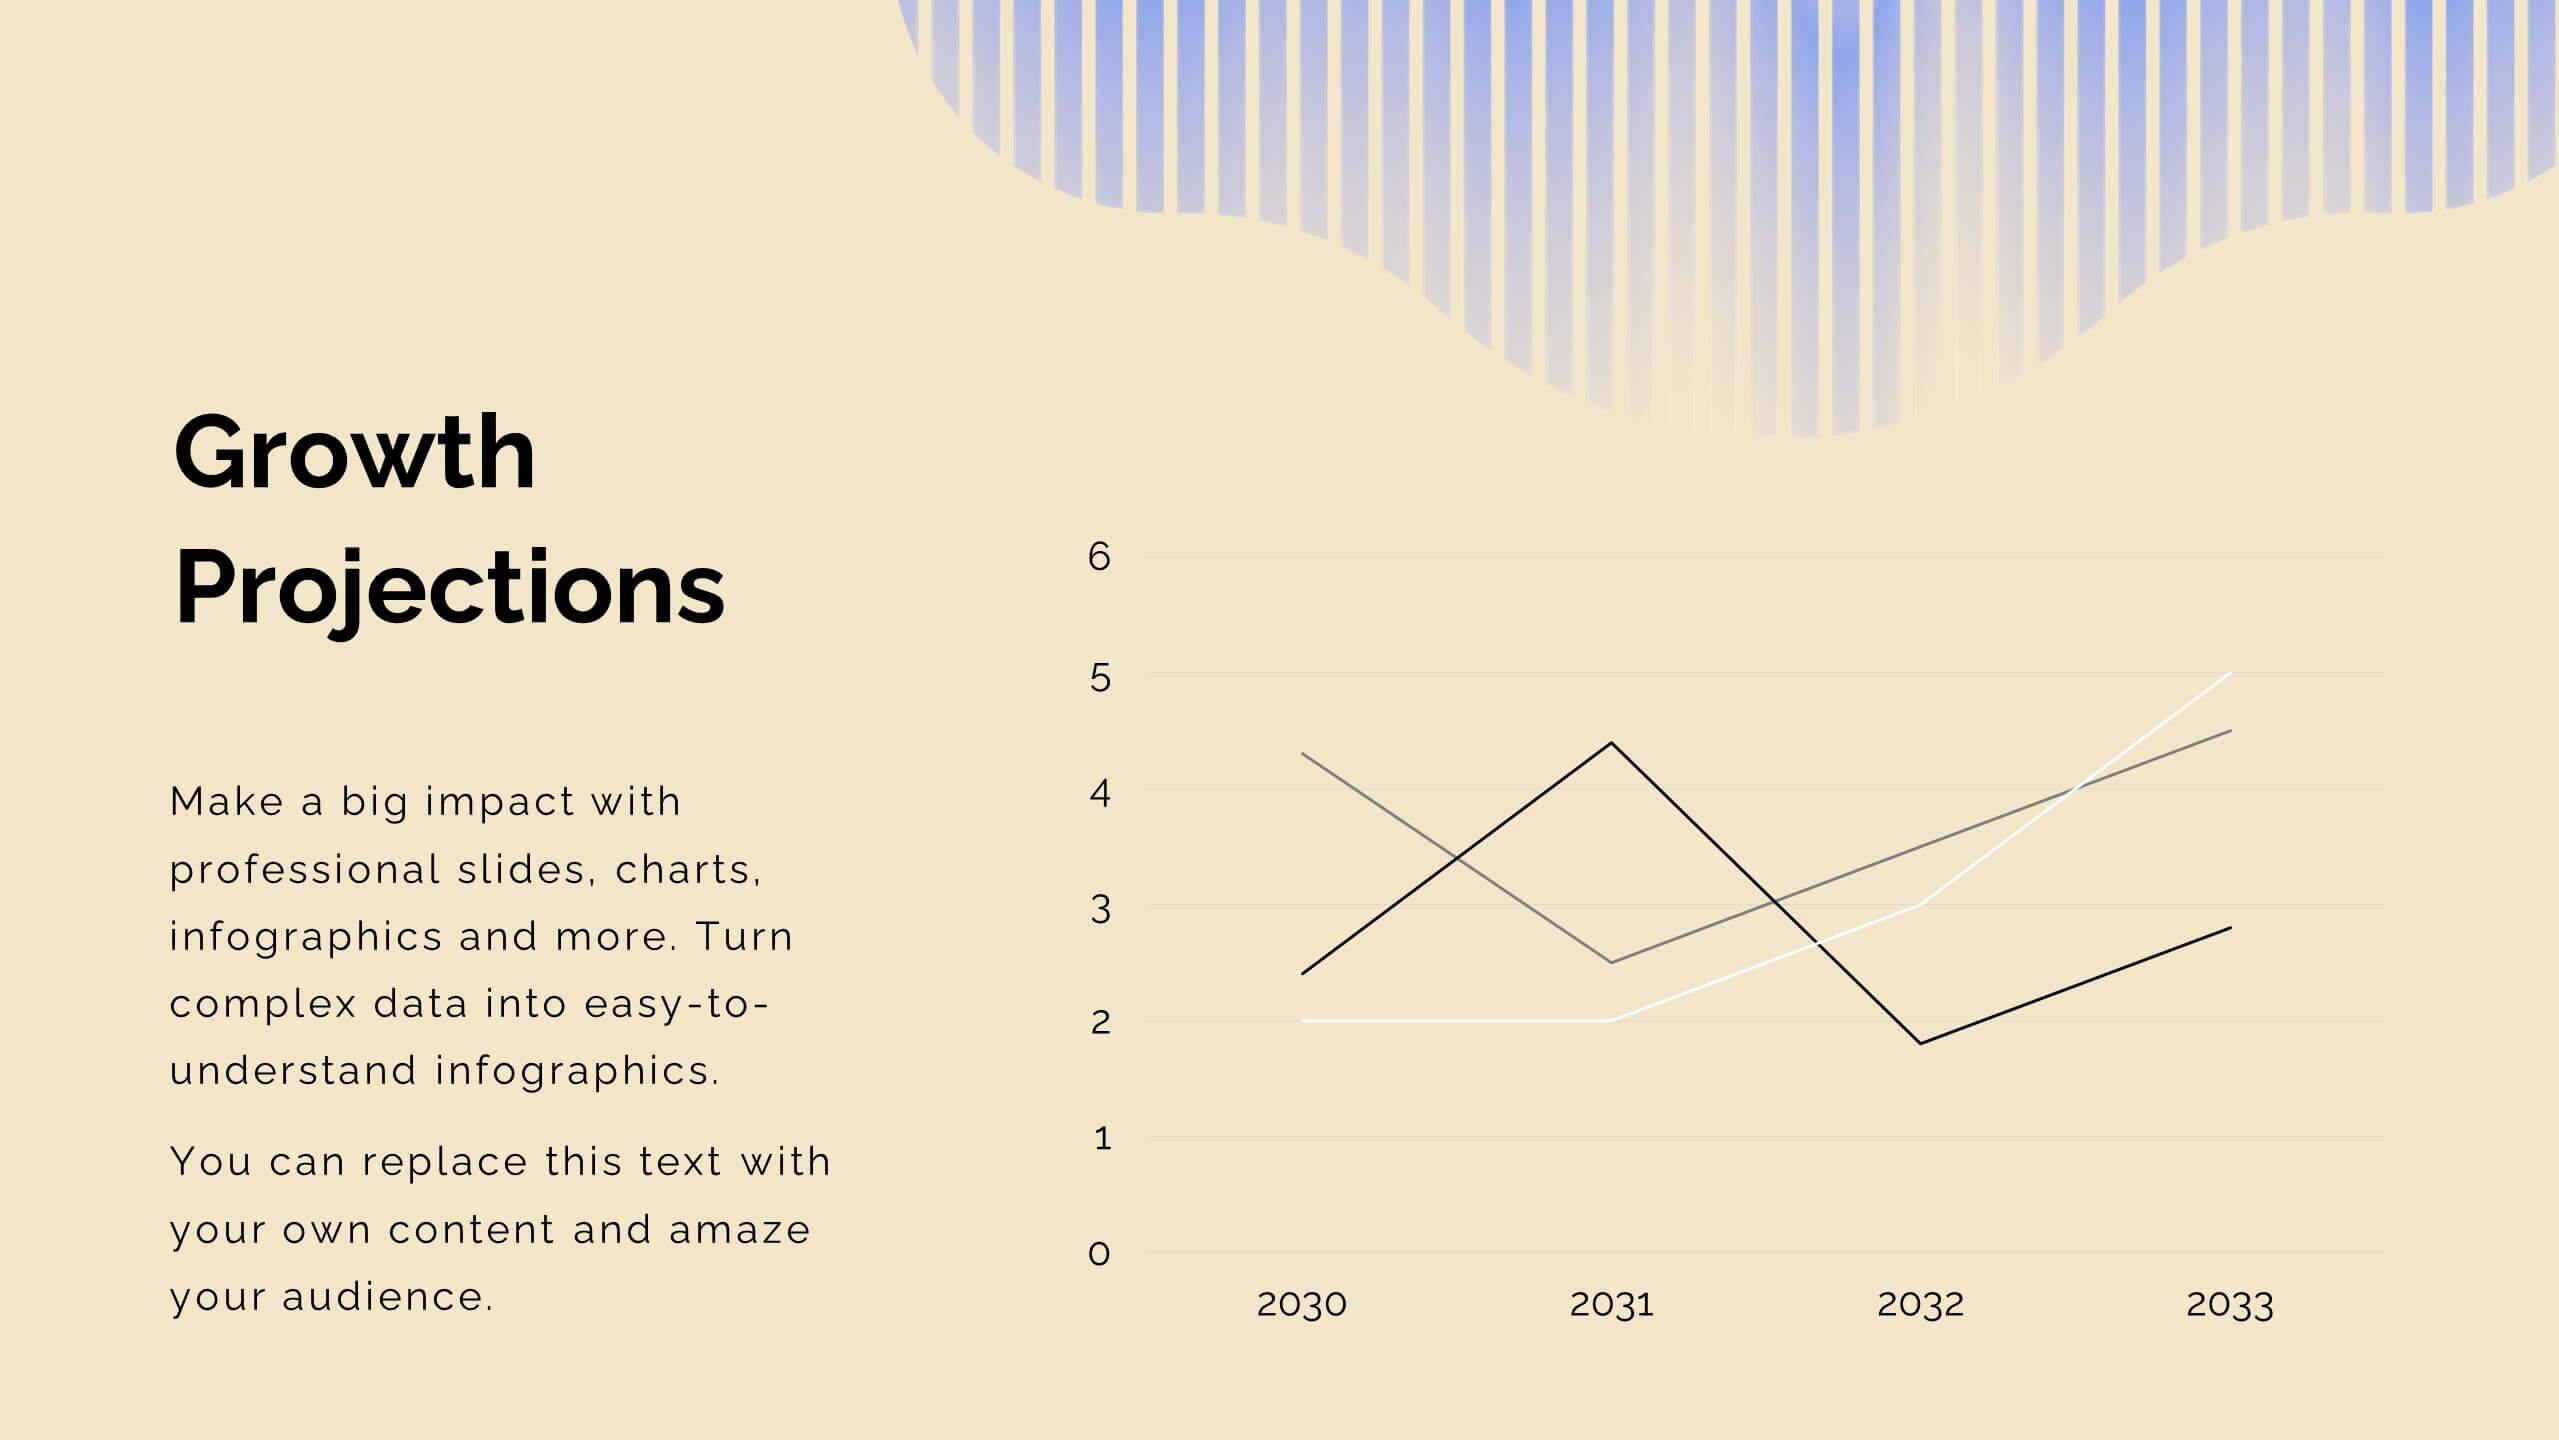
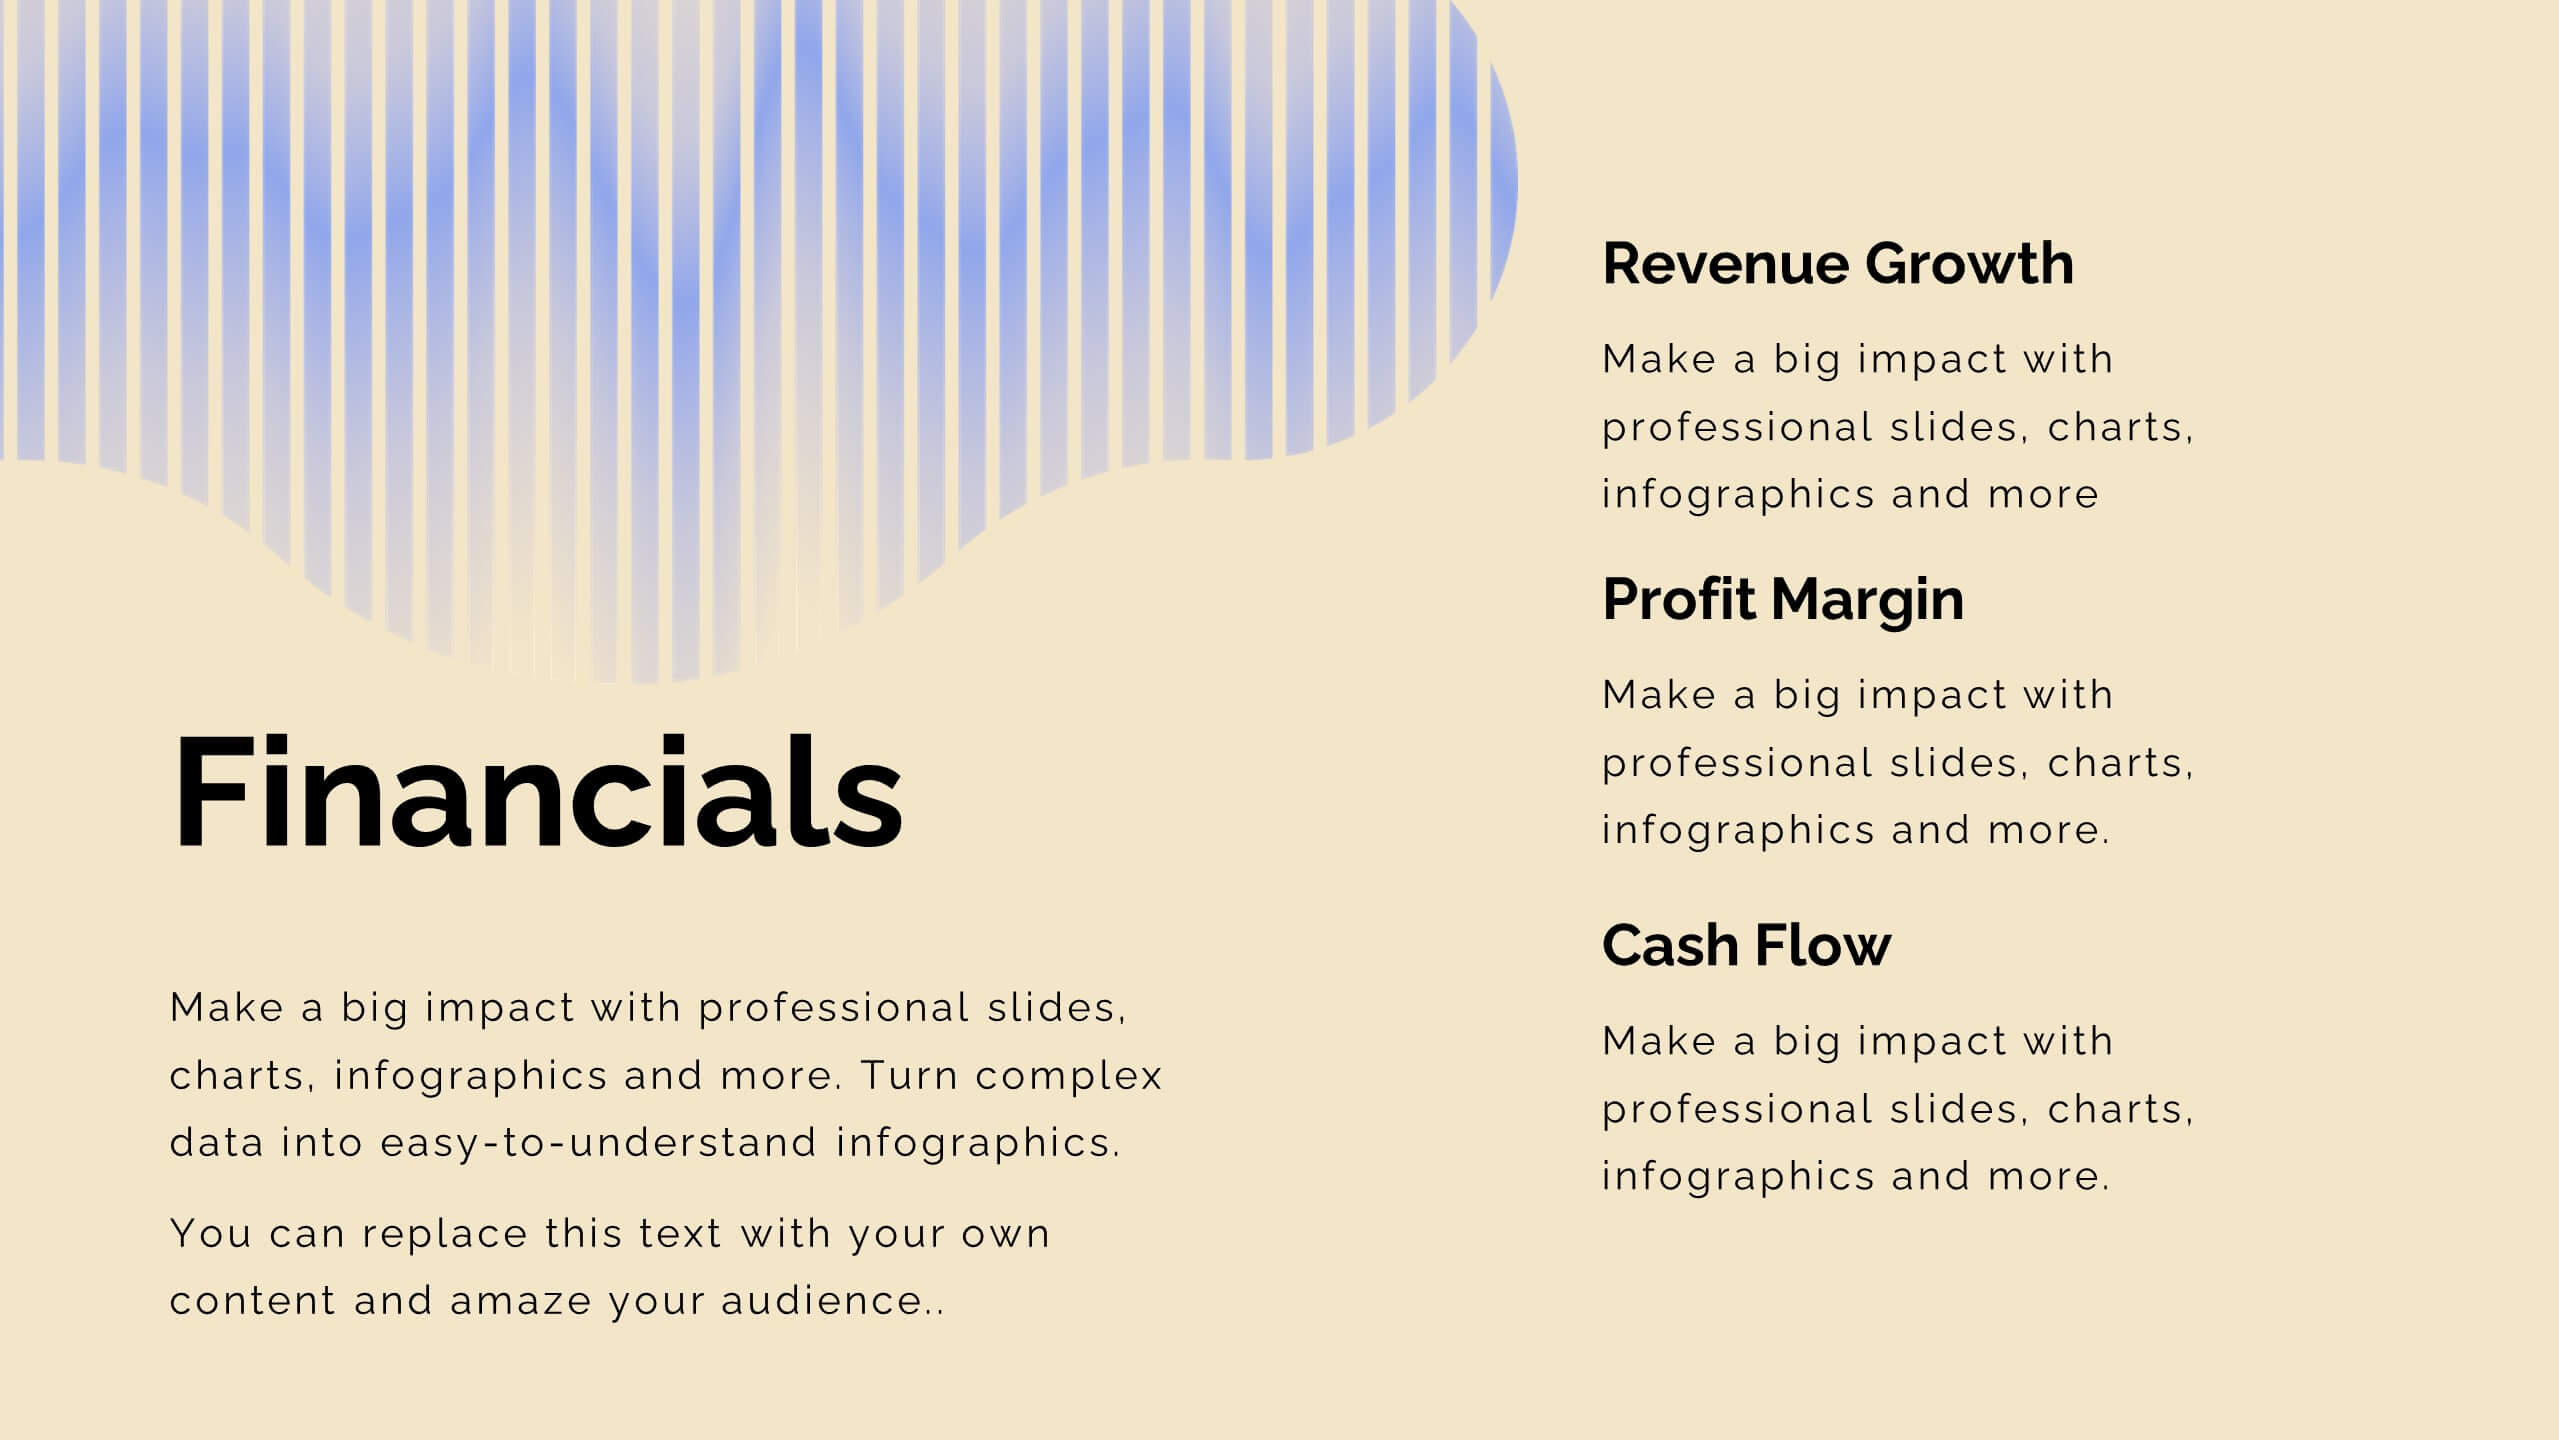
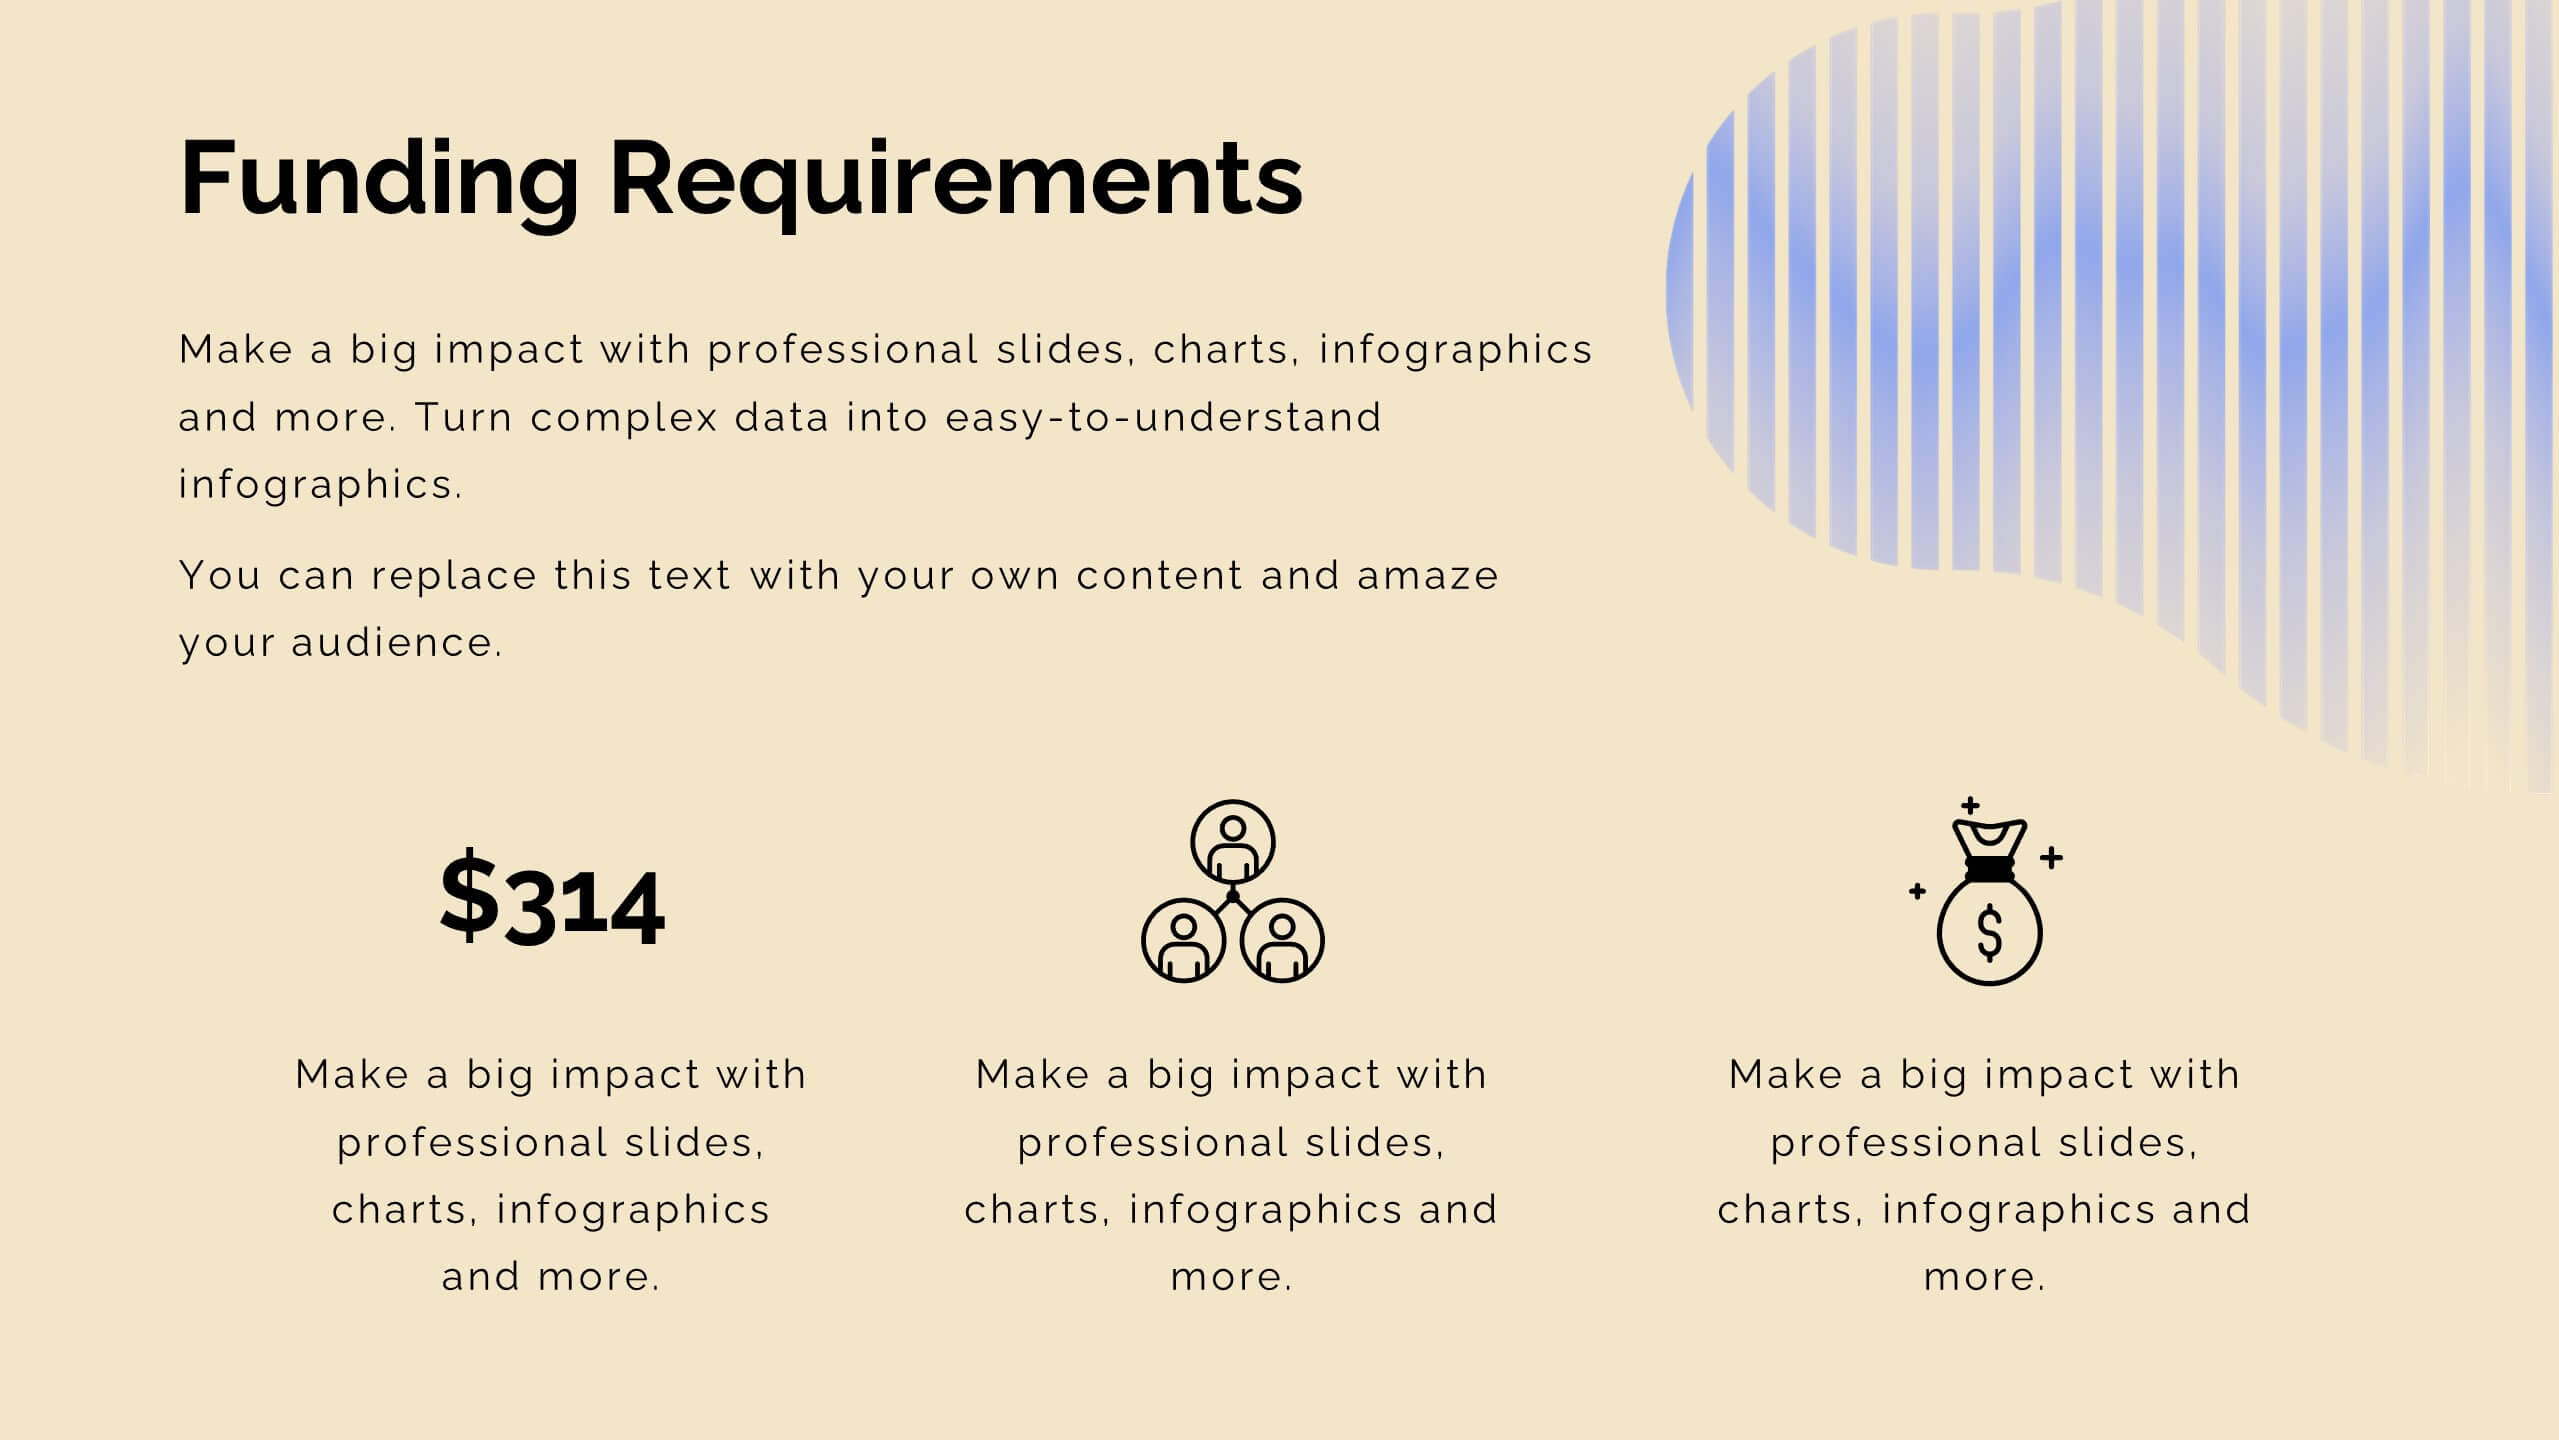
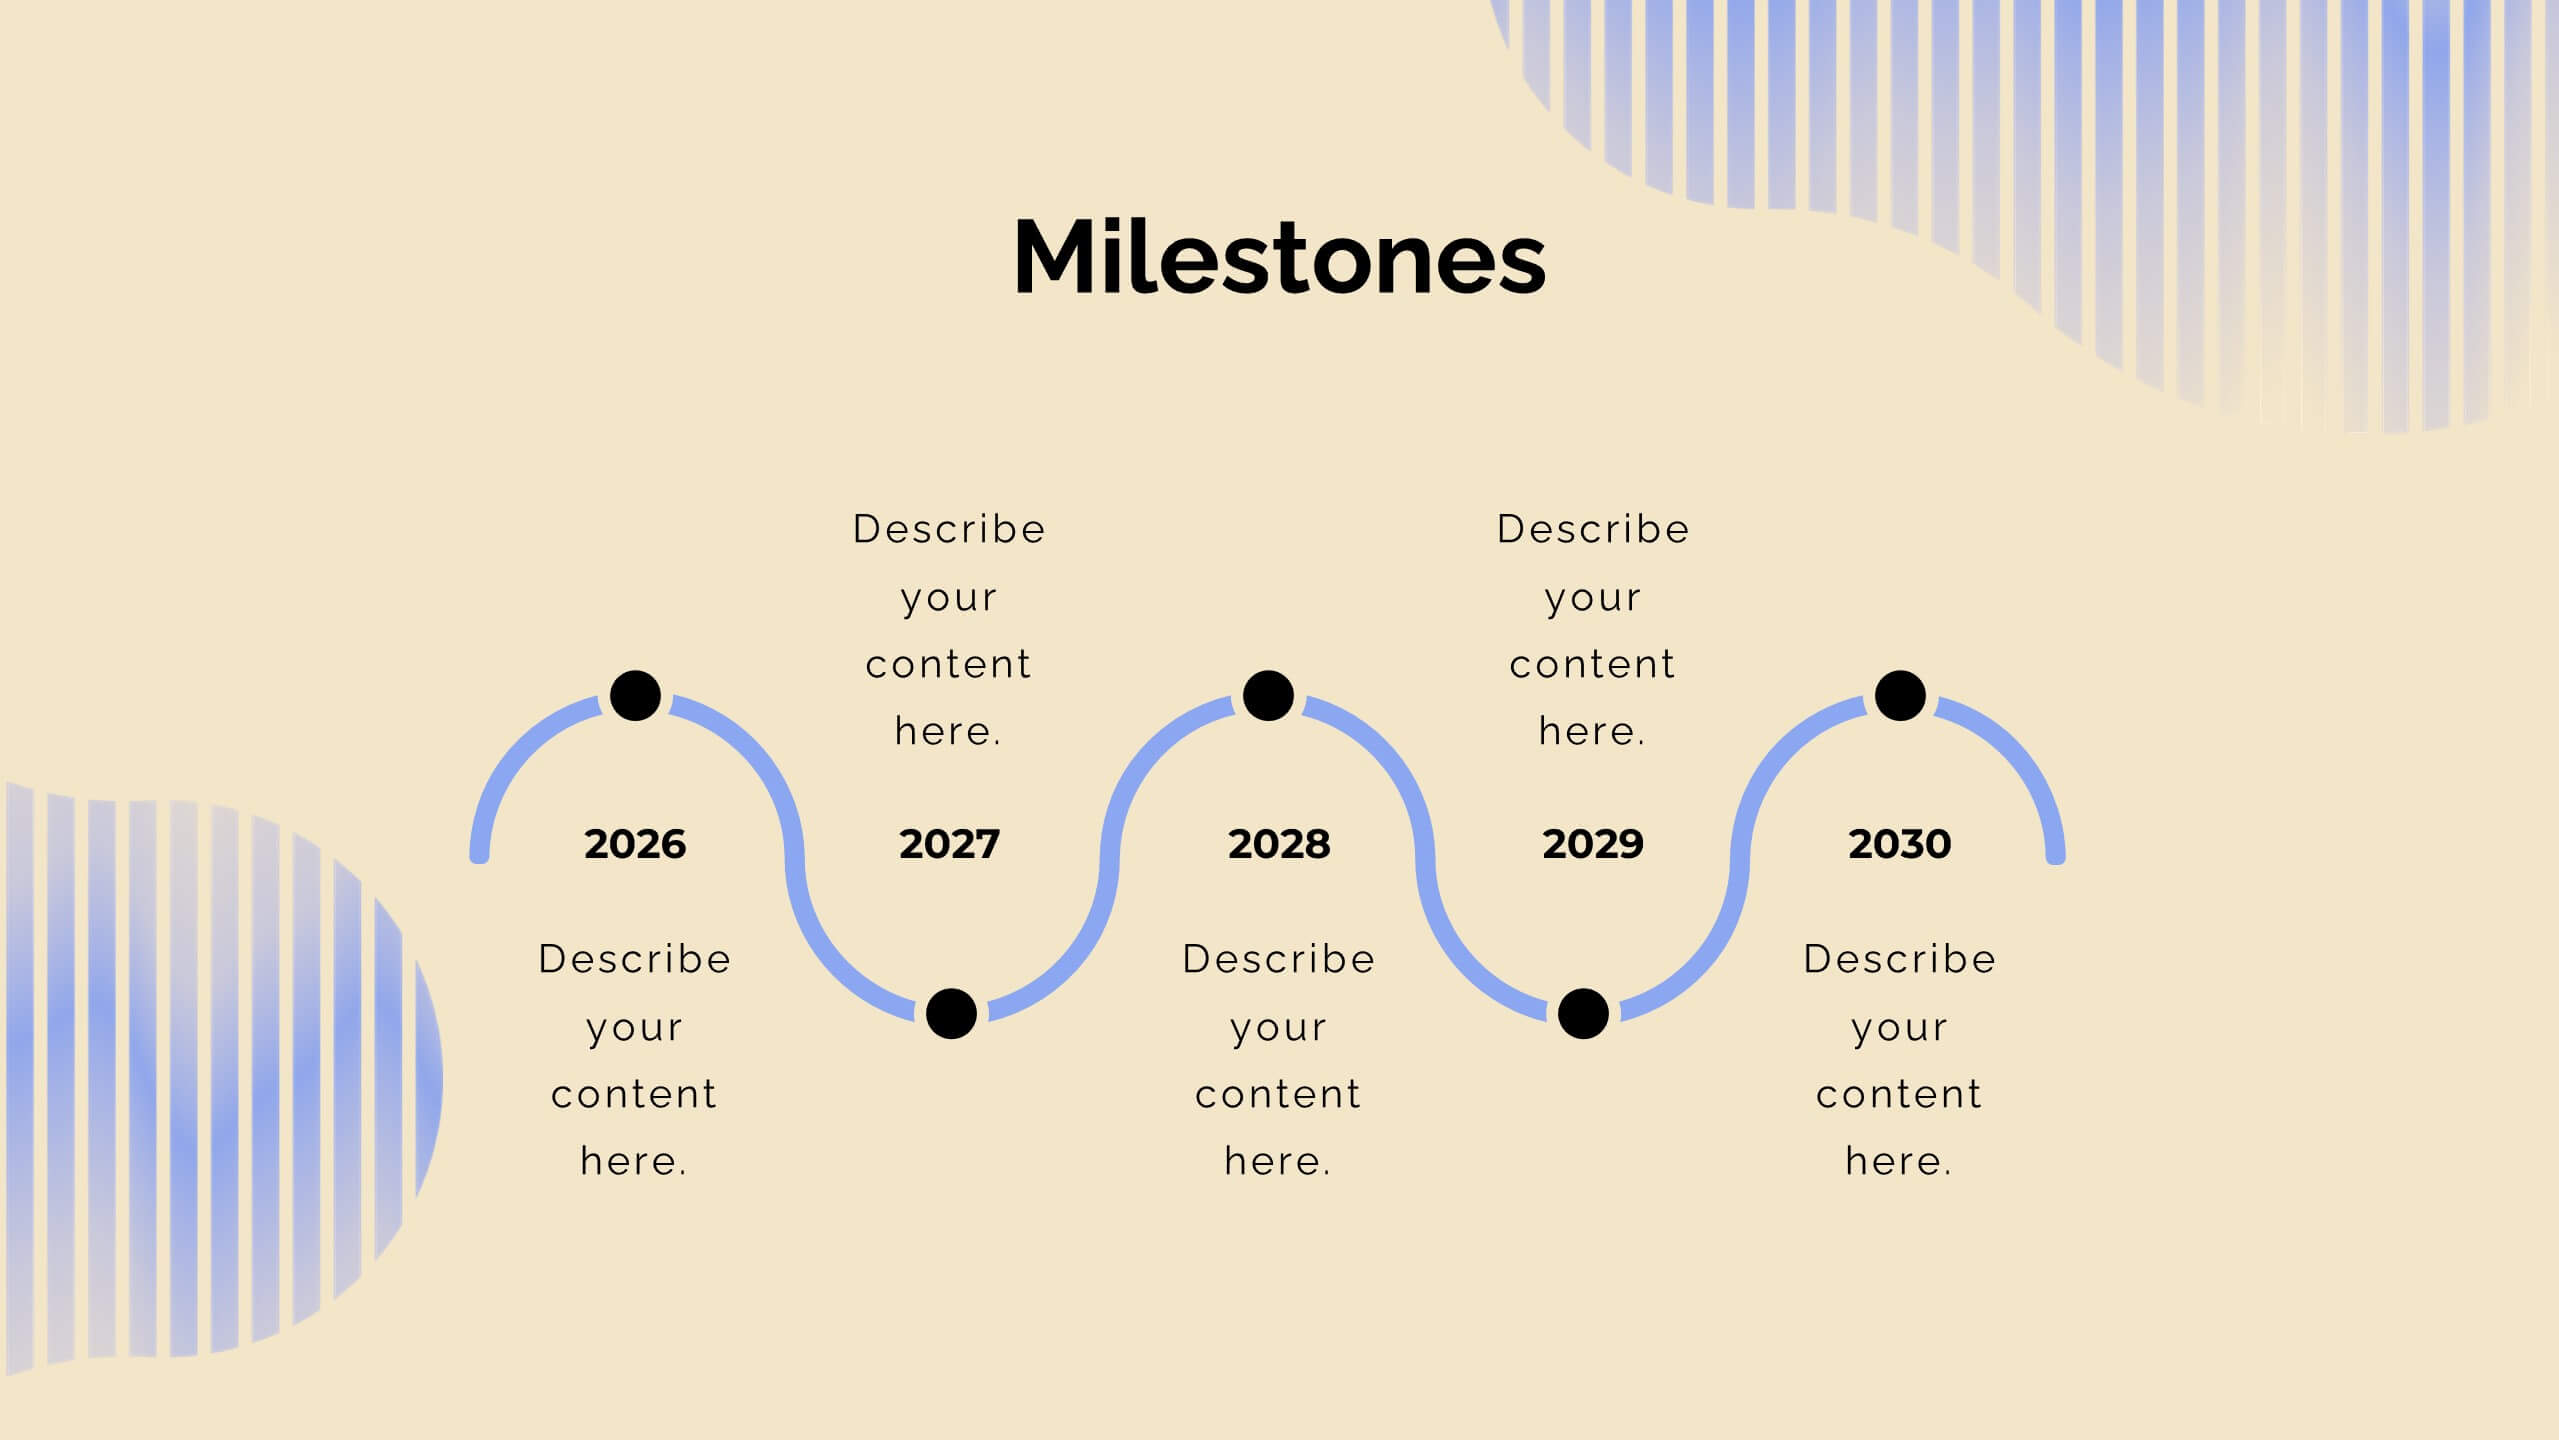
Embark on a seamless journey through your product’s lifecycle with this comprehensive roadmap template! Perfect for illustrating key milestones, business models, and market opportunities, it’s your go-to for clear and engaging presentations. Dive into competitive analysis, showcase your unique selling proposition, and outline your growth projections with style. Compatible with PowerPoint, Keynote, and Google Slides.


10 diapositivas
Business Growth and Market Statistics Presentation
Showcase key business growth trends and market insights with the "Business Growth and Market Statistics" presentation templates. These visuals are crafted to enhance clarity in communicating growth drivers, market dynamics, and performance metrics effectively. Ideal for corporate presentations, they're compatible with PowerPoint, Keynote, and Google Slides, ensuring a professional look across all platforms.


22 diapositivas
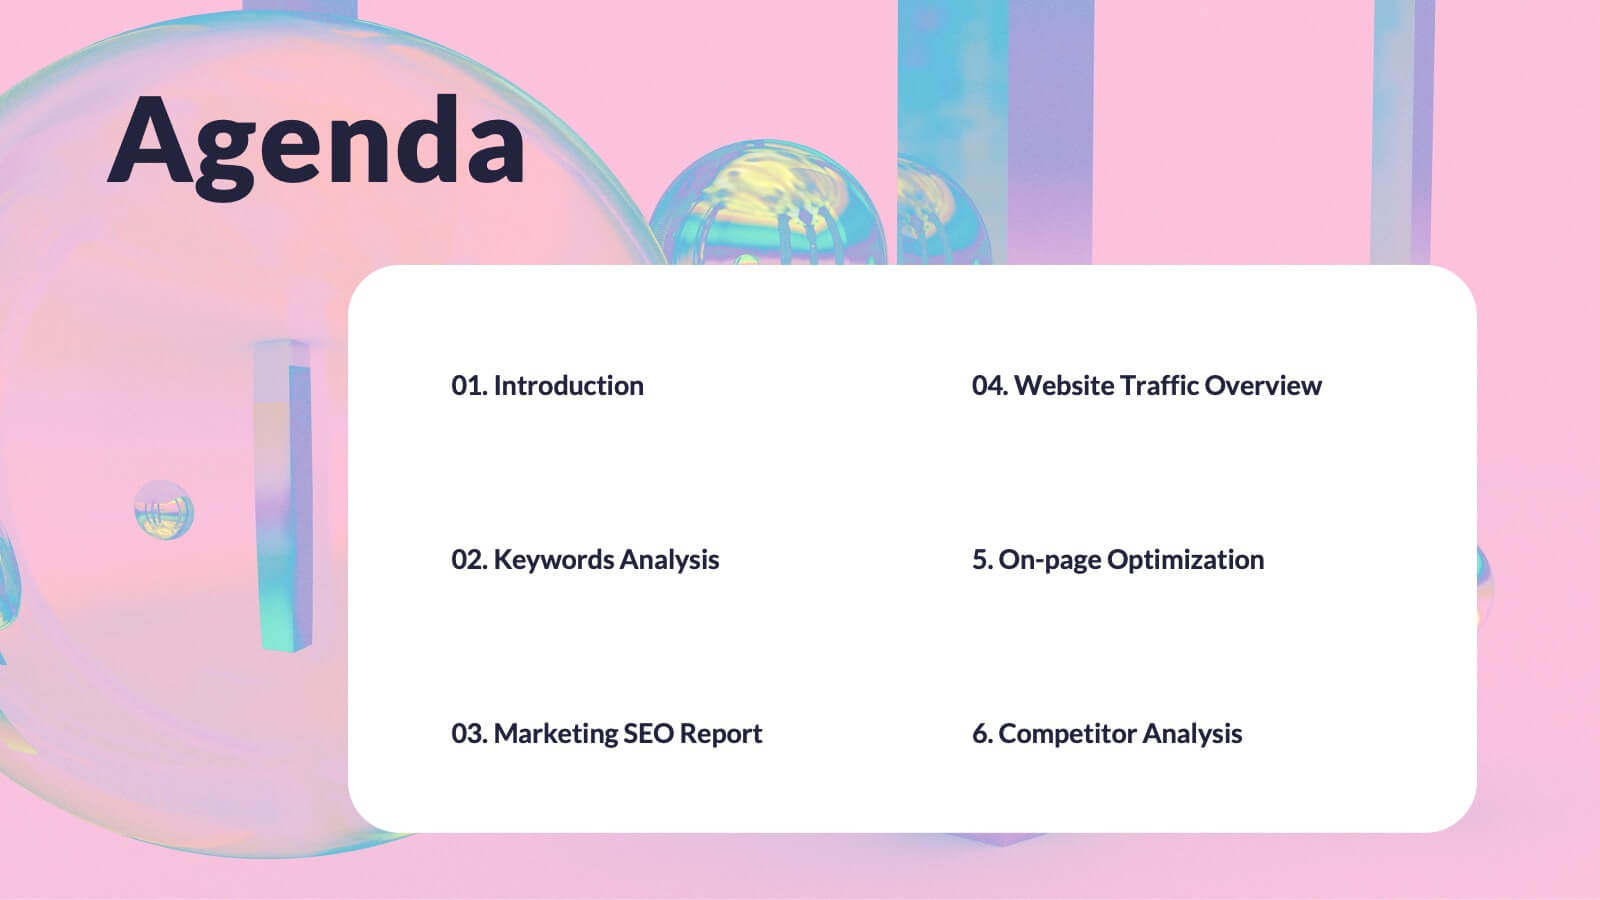
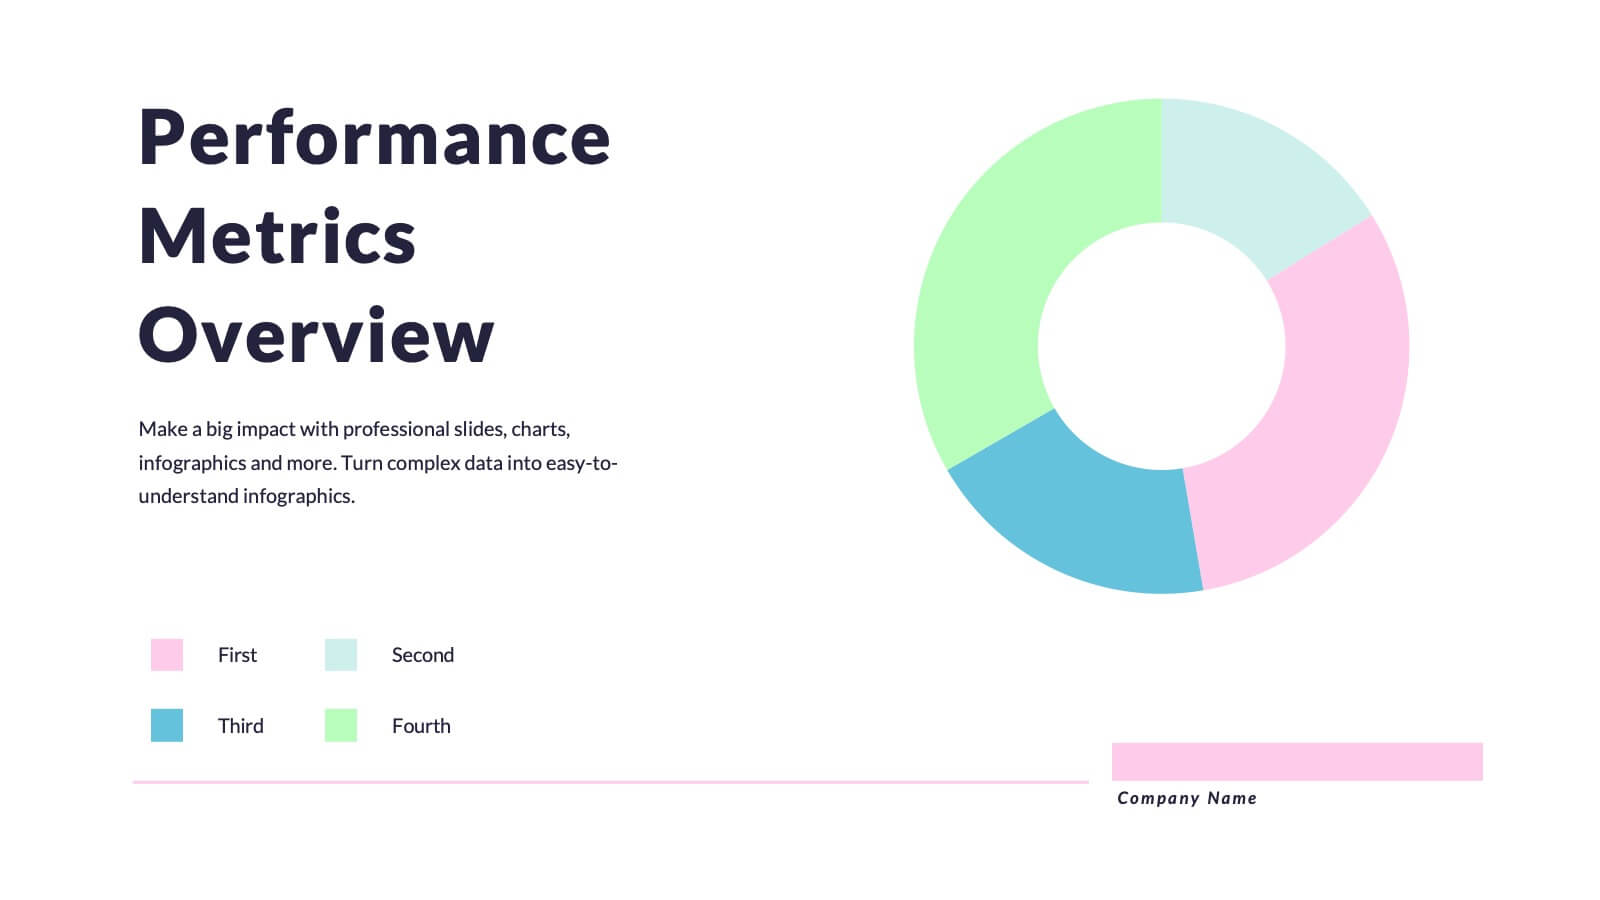
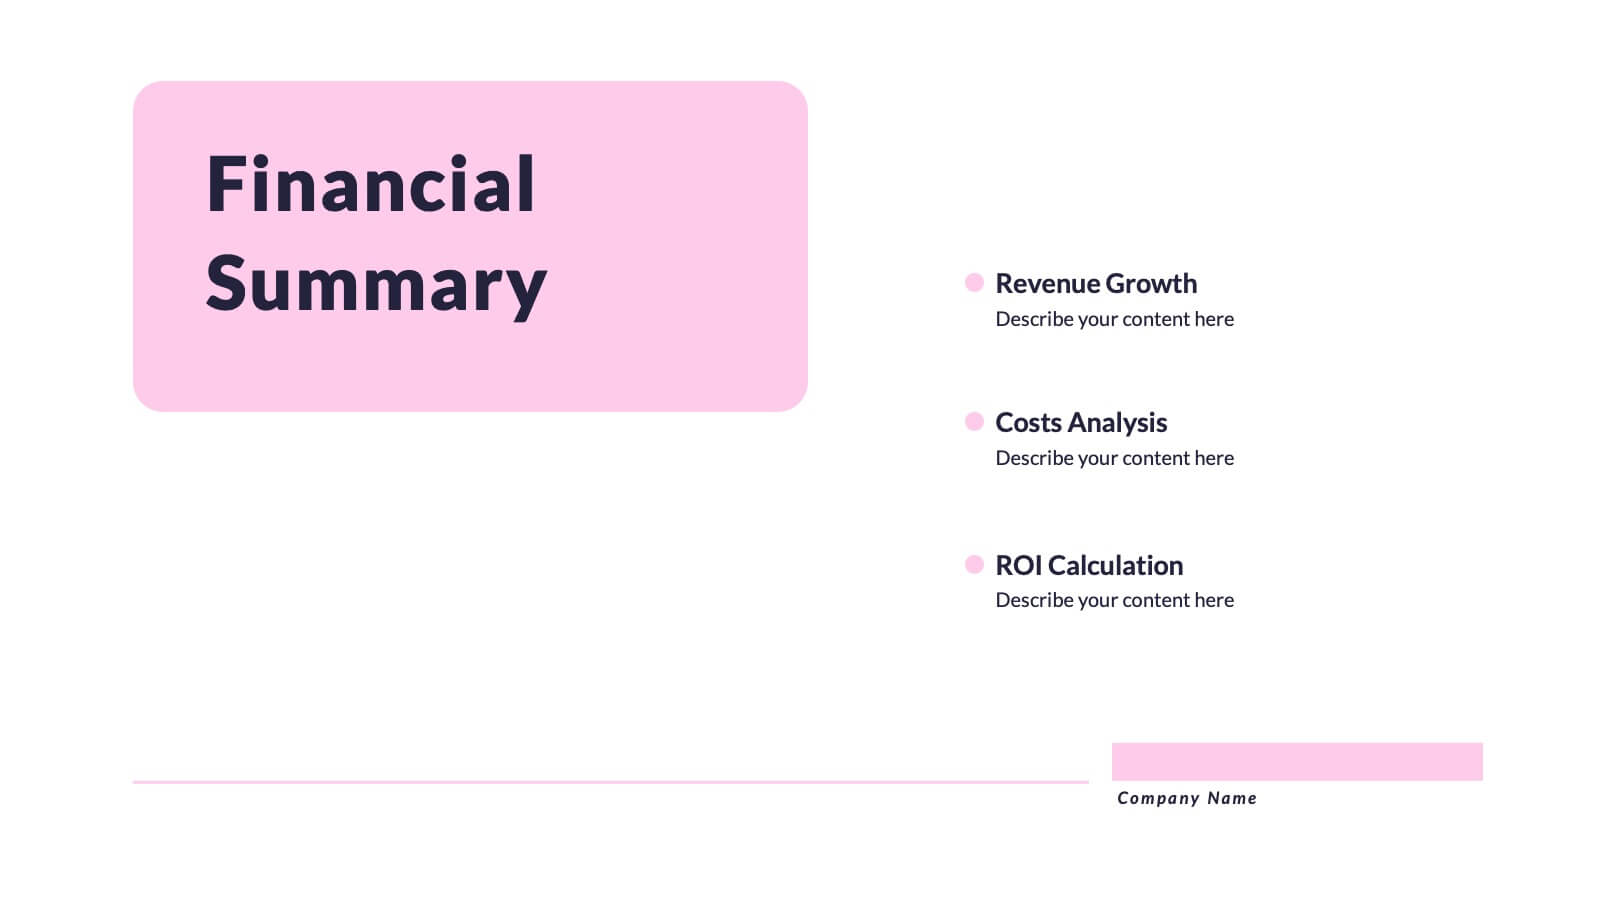
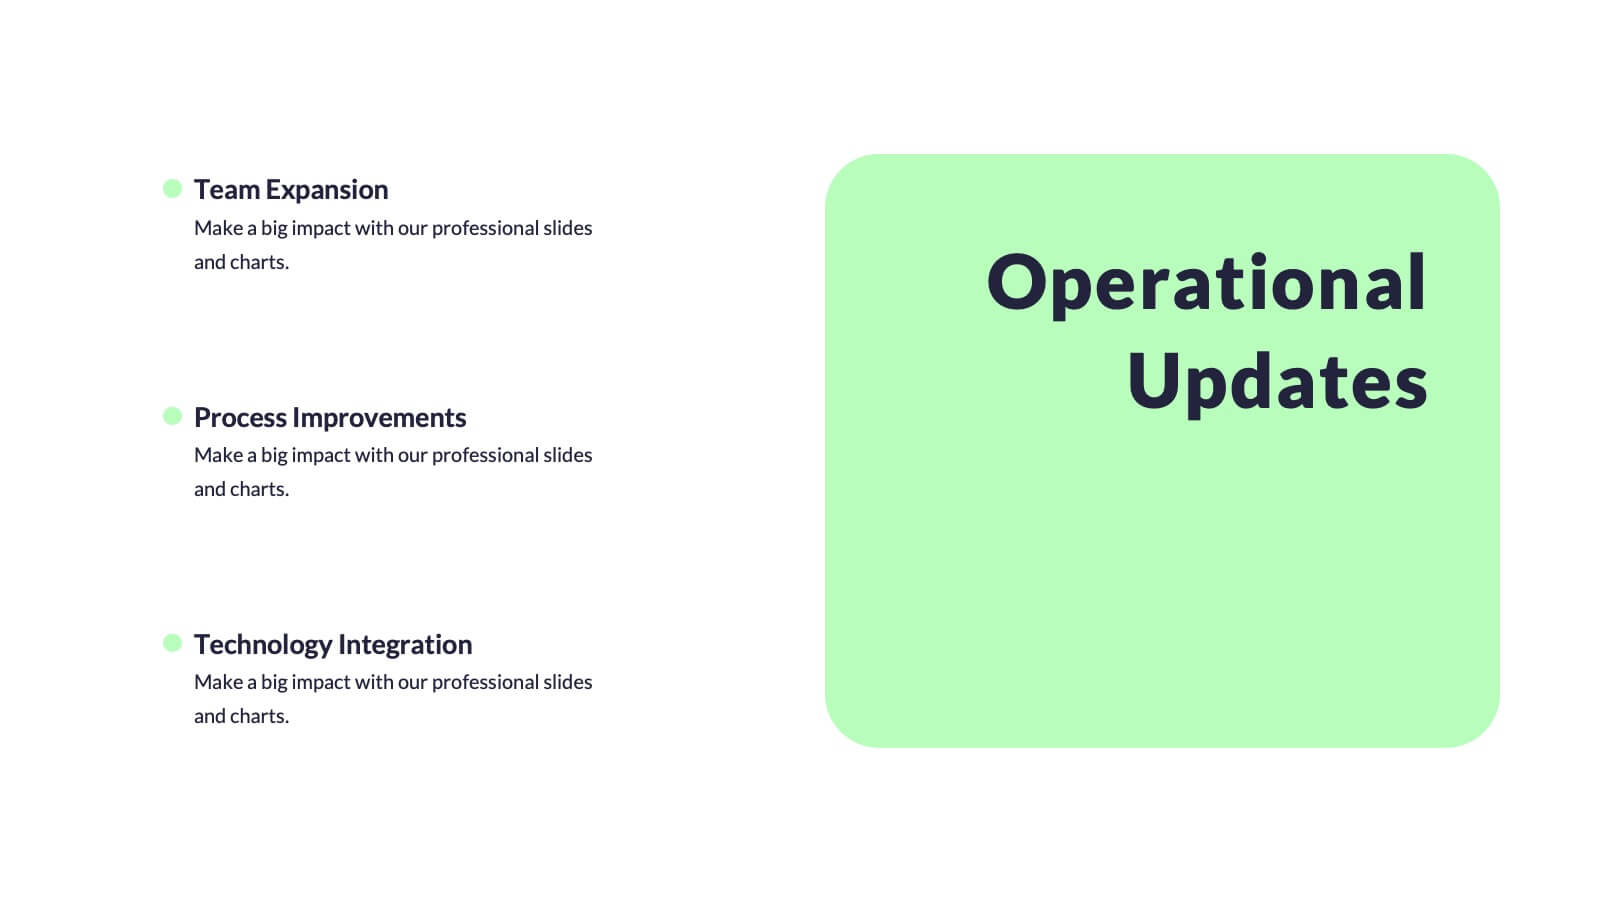
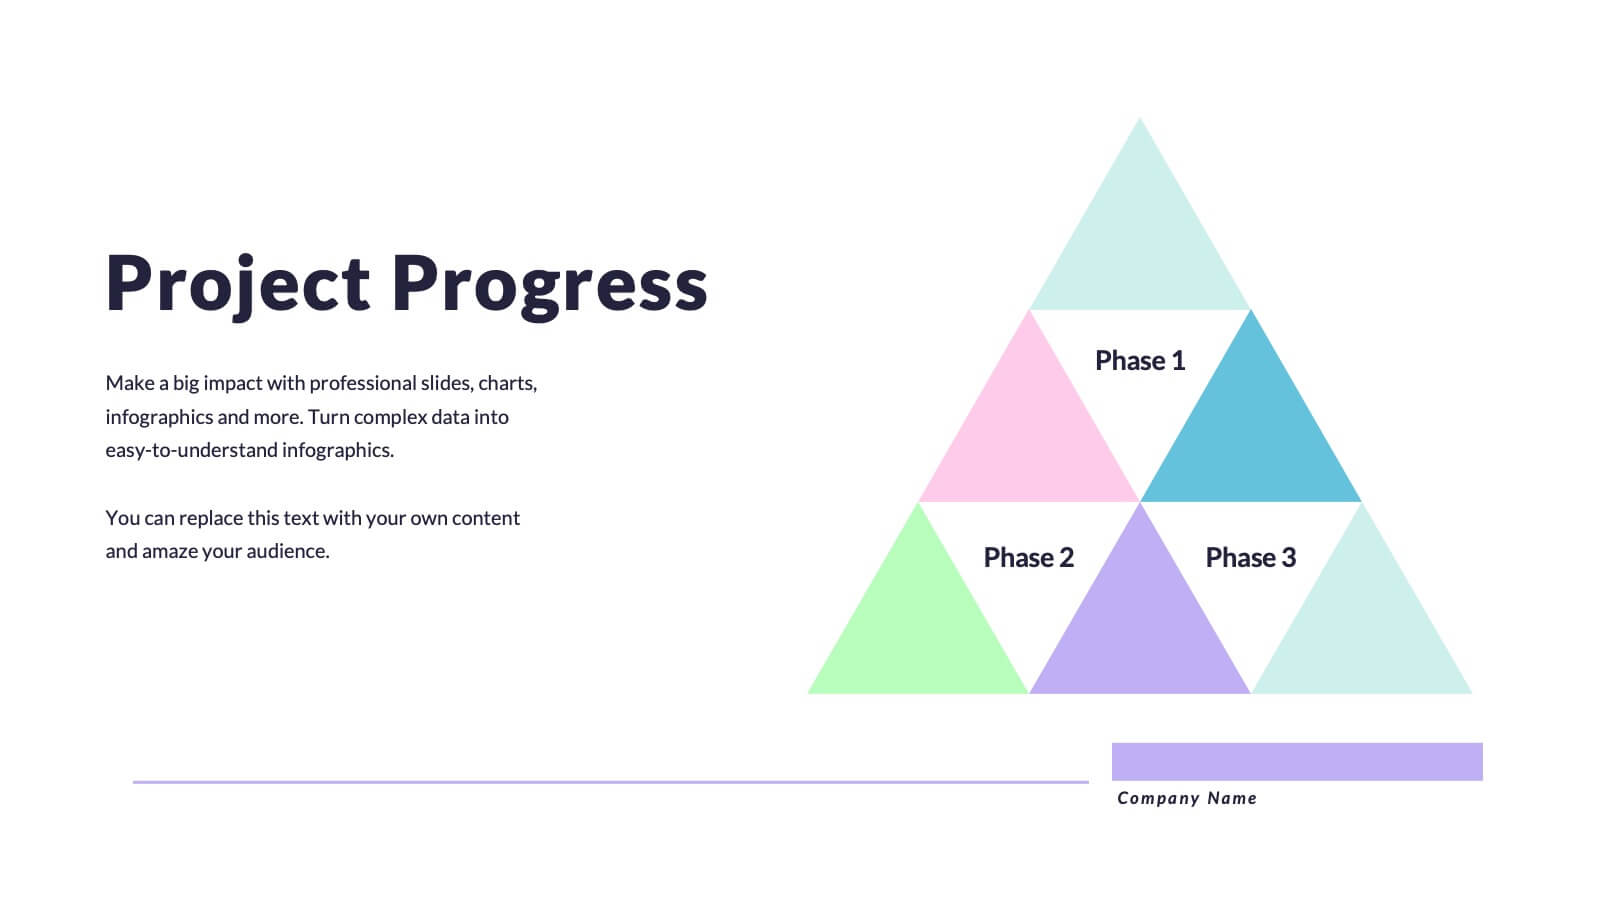
Quantum Research Findings Report Presentation
Discover insights like never before with this vibrant presentation template! Perfect for showcasing research findings, it includes slides for key findings, performance metrics, and market trends. Clearly present data and engage your audience with visually appealing graphics. Compatible with PowerPoint, Keynote, and Google Slides, making it easy to use on any platform.


5 diapositivas
SWOT Analysis Framework Presentation
The "SWOT Analysis Framework Presentation" template is strategically designed to help businesses and teams visually map out their Strengths, Weaknesses, Opportunities, and Threats. Each quadrant of the SWOT analysis is distinctly colored to facilitate quick recognition and understanding, enabling teams to efficiently analyze their internal and external environments. This template is versatile, suitable for a variety of industries and settings, from corporate strategic planning sessions to educational business courses. It aids in clearly identifying key factors that could influence future business decisions and strategies, making it an essential tool for any organization aiming to enhance its strategic planning process.


4 diapositivas
Freelancer Portfolio Showcase Presentation
Showcase your talents with this clean and modern portfolio slide. Featuring a photo placeholder, bold typography, and a vertical skill layout, it's perfect for freelancers and creatives. Easily customizable in PowerPoint, Keynote, or Google Slides—ideal for highlighting services, experience, and personal branding with a sleek, professional flair.


6 diapositivas
Workload Distribution and Calendar Plan Presentation
Stay on top of weekly responsibilities with the Workload Distribution and Calendar Plan Presentation. This visual planning template helps teams clearly assign tasks across days of the week, making it easy to organize schedules and boost productivity. Fully editable in PowerPoint, Keynote, and Google Slides.


6 diapositivas
IT System Design and Architecture Strategy
Present your IT blueprint with the IT System Design and Architecture Strategy Presentation. This modern pentagon layout helps map out five essential components of your system strategy clearly and efficiently. Fully editable in PowerPoint, Keynote, and Google Slides—perfect for IT leaders, consultants, and infrastructure teams.


8 diapositivas
Target Demographic Insights
Get a clear view of your audience with the Target Demographic Insights Presentation. This template uses a visual bullseye layout to highlight key demographic data through concentric circles and percentages. Ideal for marketers, brand strategists, or analysts, it helps you communicate audience segmentation and market reach effectively. Fully editable in PowerPoint, Keynote, and Google Slides.


7 diapositivas
RAPID Matrix Infographic Presentation Template
RAPID stands for Recommend, Agree, Perform, Input and Decide. The RAPID Matrix is a popular tool used to determine project planning and decision-making responsibilities. It helps ensure that the right people are involved at the right time, with the right knowledge and skills. This template makes it easy for anyone to efficiently take notes. Use it to share information on your company, business plan or vision, or for a brainstorming session with your team. Take your presentation to the next level with this easy-to-personalize template and eye catching infographic with tips for using it.


7 diapositivas
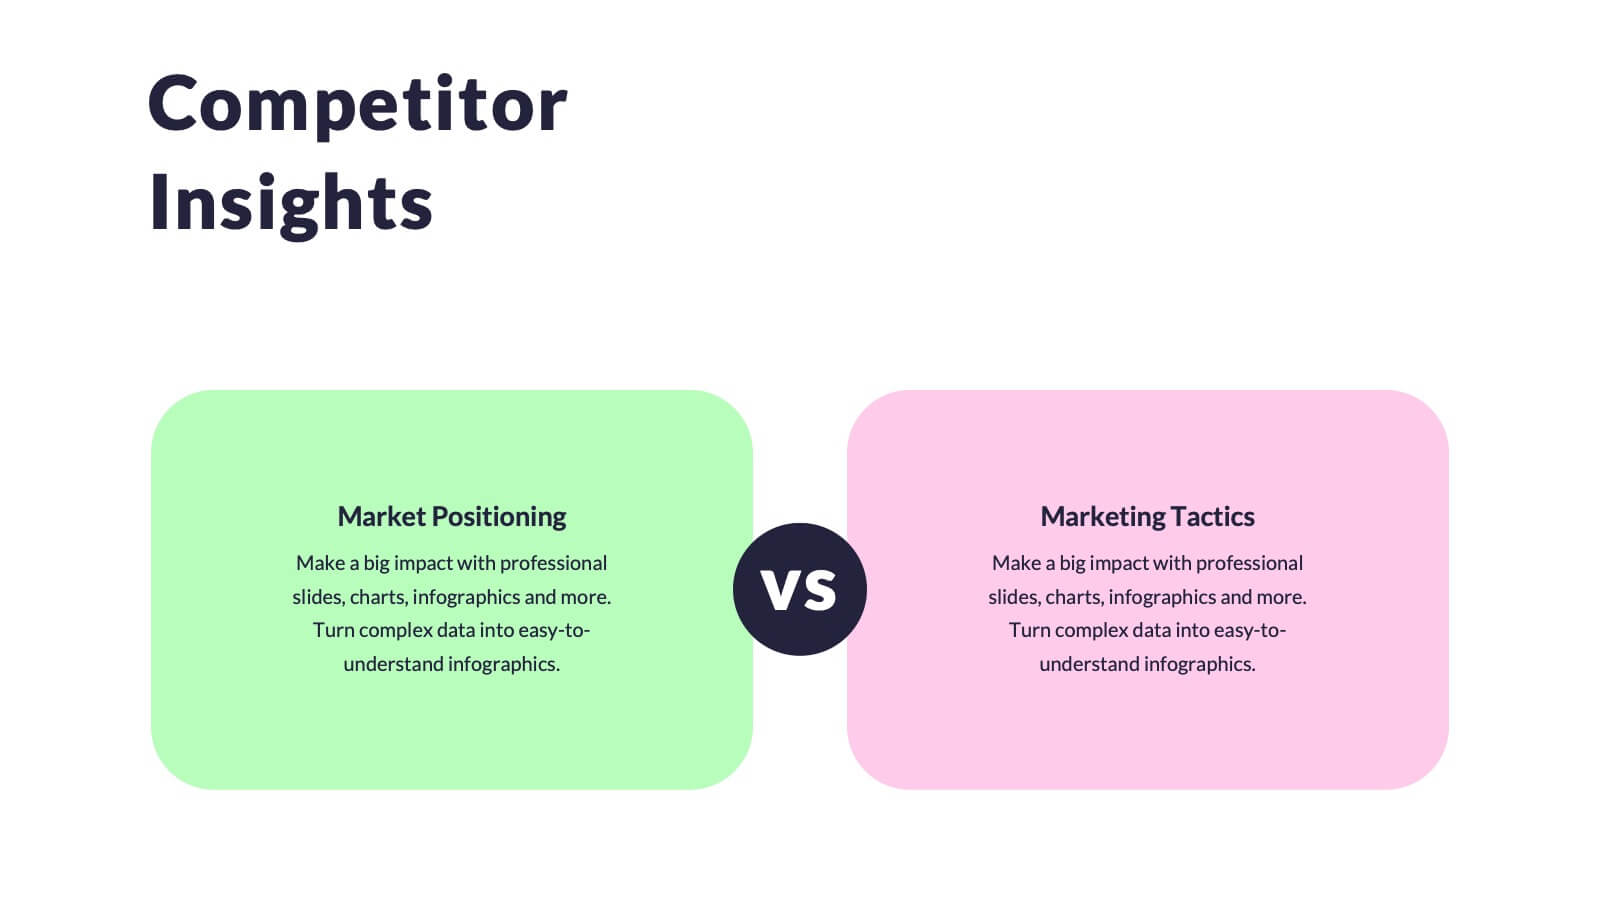
Title Comparison Infographic
This collection of slides presents a visually cohesive and professionally designed set of templates, perfect for a variety of business presentations. The color scheme of orange and white is consistently applied across slides, enhancing visual appeal and thematic unity. These designs cater to multiple business needs, including strategic planning, project proposals, and company introductions. Particularly notable is the use of clear, concise layouts that highlight key topics such as the "Business Model Canvas," ensuring that complex ideas are communicated effectively. Each slide is crafted to maintain viewer interest and deliver content in a digestible format, making them ideal for detailed corporate presentations and briefings. This selection also includes slides tailored for 'About Us' sections and planning frameworks, which are essential for businesses to introduce their core values, objectives, and strategic directions. These slides are an excellent resource for any professional looking to present ideas in a clear, organized, and visually attractive manner during meetings or in digital content.


6 diapositivas
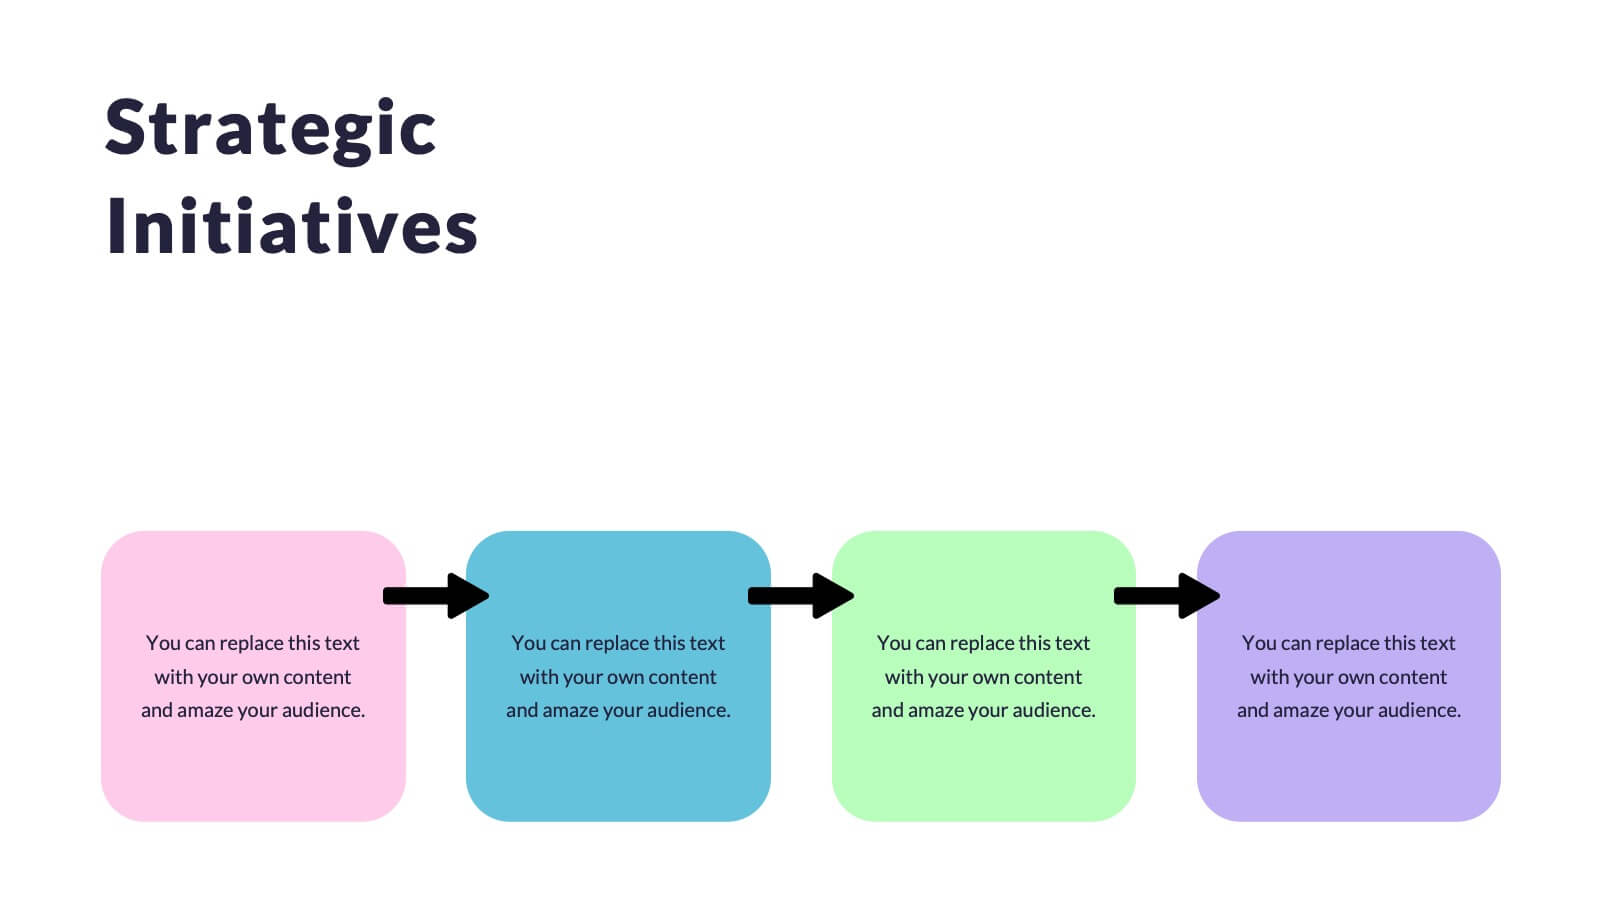
Numbered Steps Diagram Presentation
Watch your workflow come to life as each step rises in a clean, structured path that makes progress easy to follow. This presentation guides audiences through sequential actions with clarity, helping simplify processes, plans, or instructions. Perfect for business, training, or project teams. Fully compatible with PowerPoint, Keynote, and Google Slides.


6 diapositivas
OKR Goal-Setting Framework
Clarify your goals and drive performance with this OKR-based layout that maps Objectives, Key Activities, and Results in a clear, actionable format. Ideal for teams, managers, and performance reviews. Each section is fully editable to match your organizational strategy. Compatible with PowerPoint, Keynote, and Google Slides.