


Características


¿Tienes alguna pregunta?
Recomendar


7 diapositivas
Medical Center Infographic
A medical center, often referred to as a healthcare center, is a facility or establishment where a range of medical services and care are provided to individuals in need of medical attention. This infographic template is designed to provide a comprehensive overview of the medical center, emphasizing its services, healthcare professionals, facilities, patient satisfaction, and community engagement. This infographic is fully customizable and compatible with Powerpoint, Keynote, and Google Slides. Easily customize and design this to align with your specific medical center's brand and message.


2 diapositivas
Modern Business Title Slide Presentation
Step into the future of presentations with the "Modern Business Slide," designed to make your corporate message shine. This template features a sleek, minimalist layout with bold typography and a striking visual of a stylish office setting, perfect for making a professional impact. Ideal for any business presentation, it's compatible with PowerPoint, Keynote, and Google Slides, ensuring versatility across different platforms.


22 diapositivas
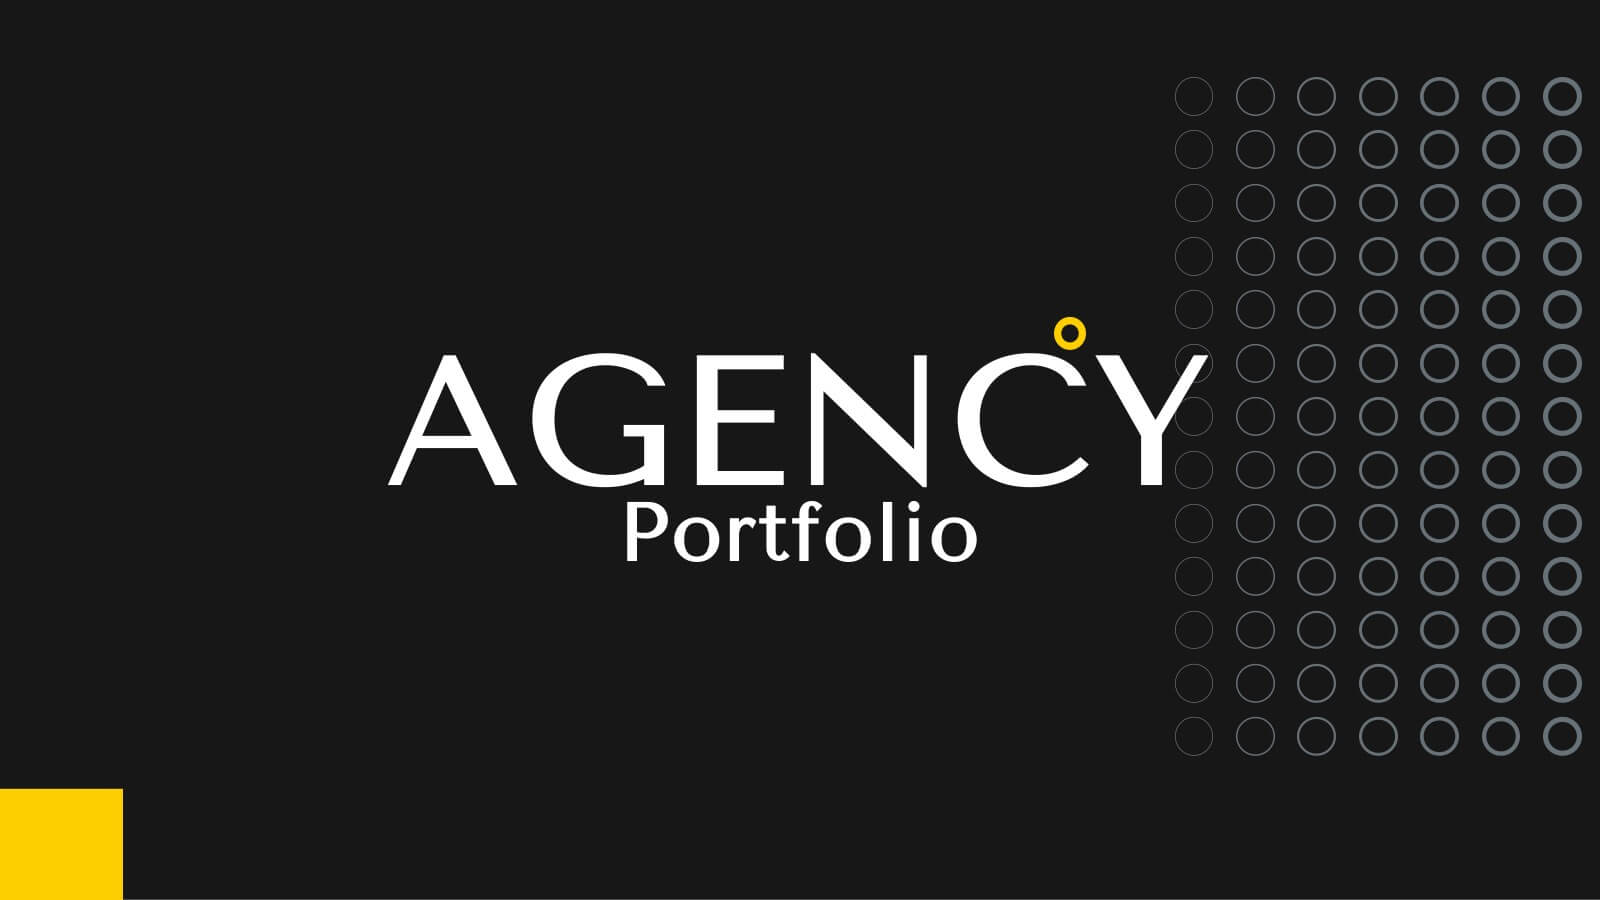
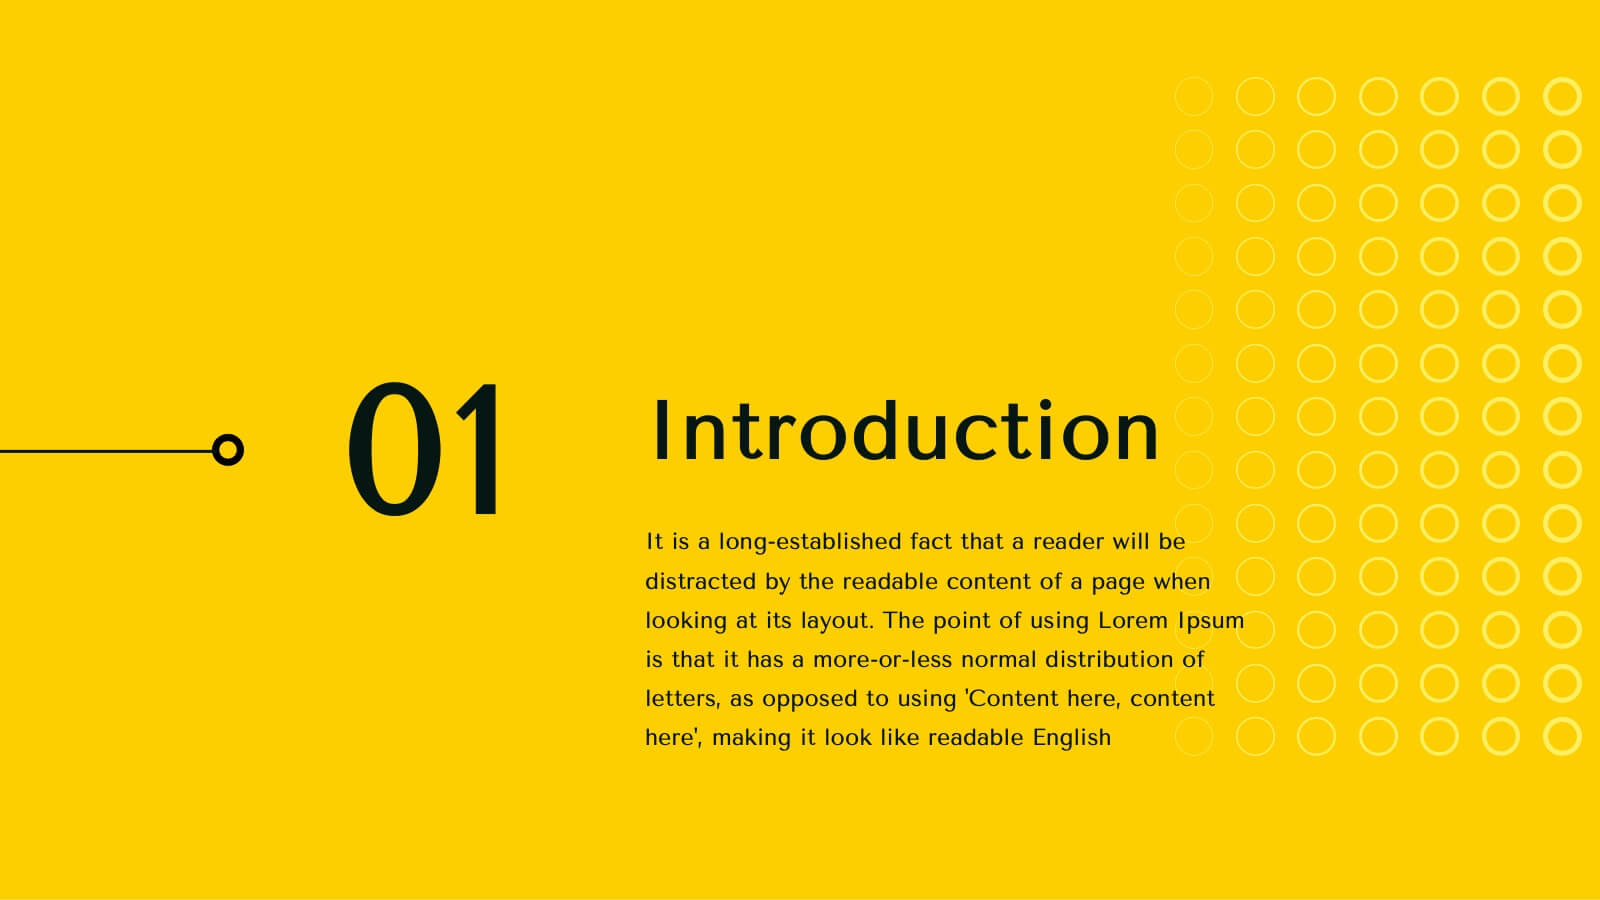
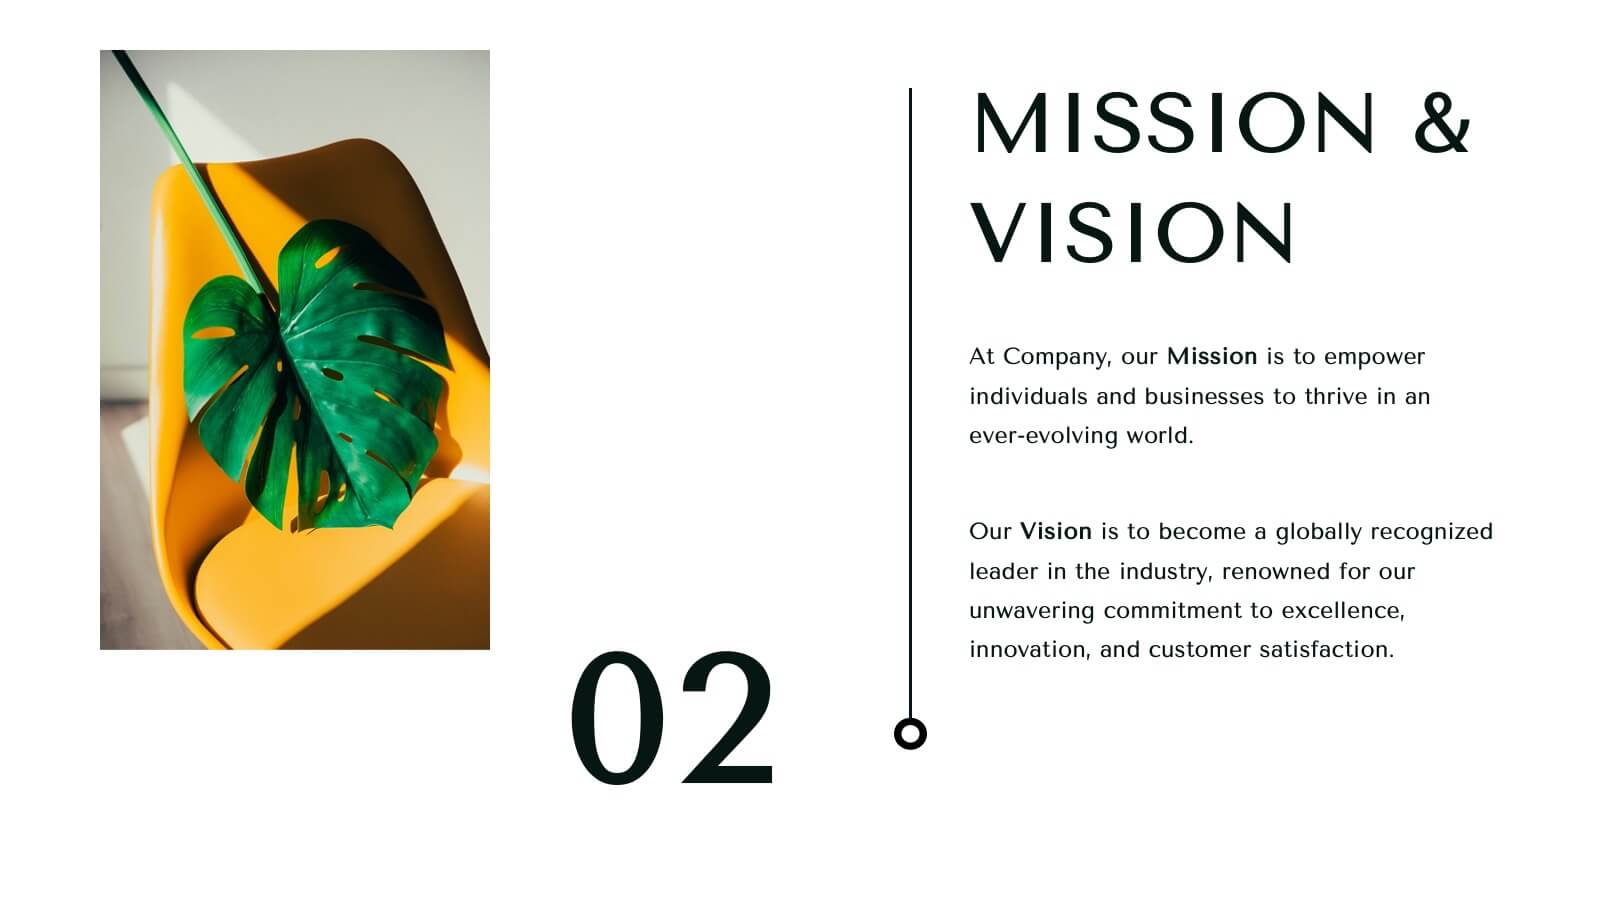
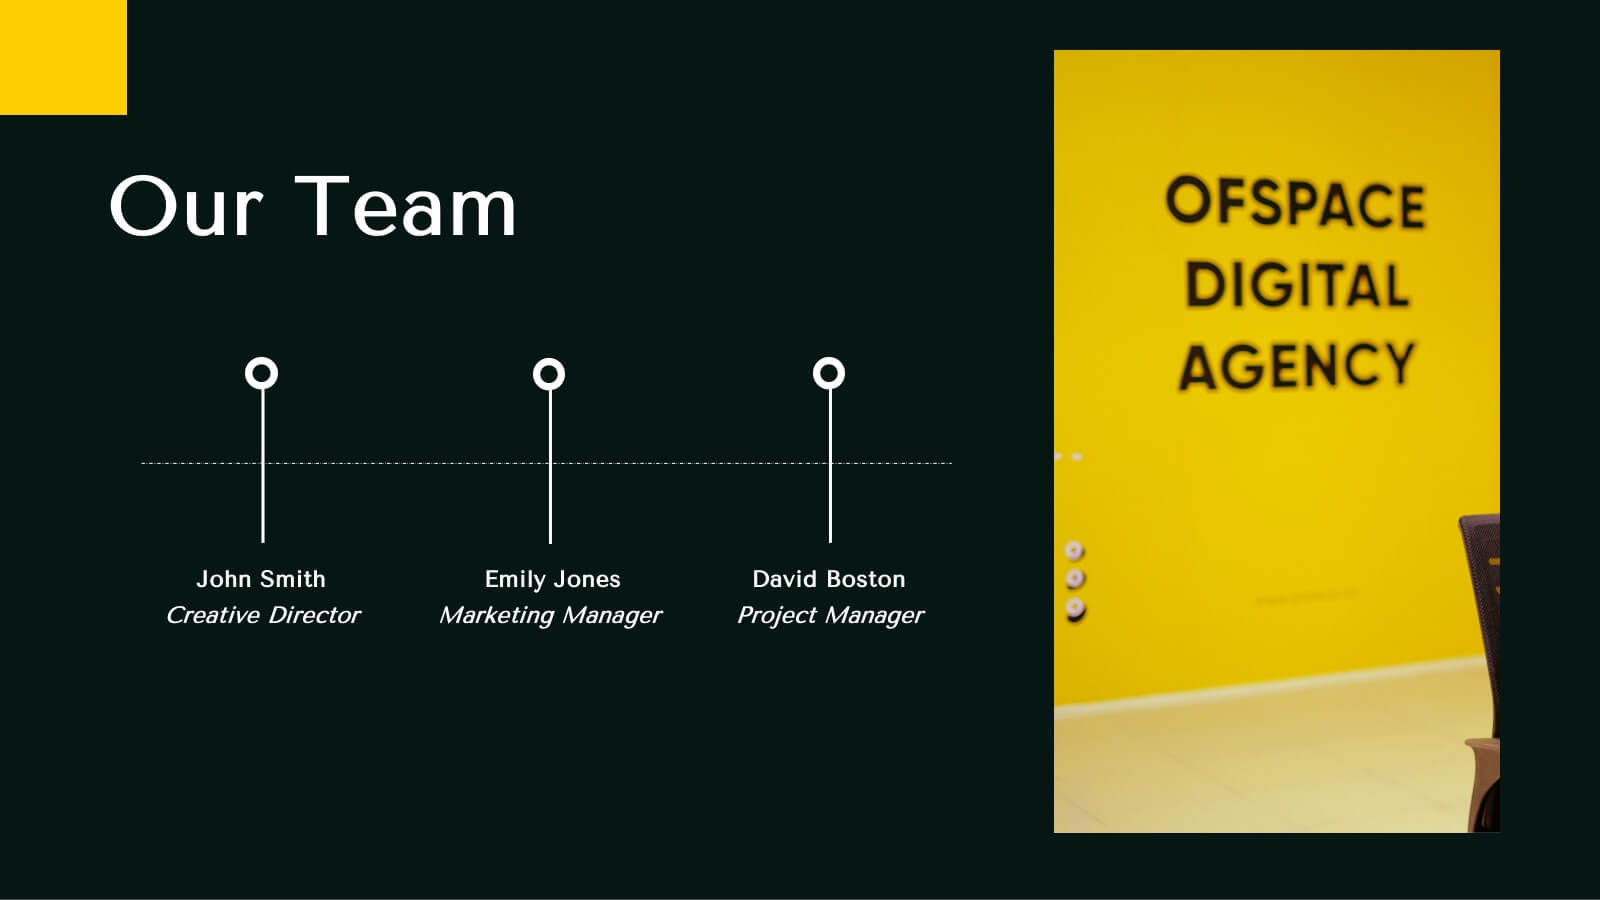
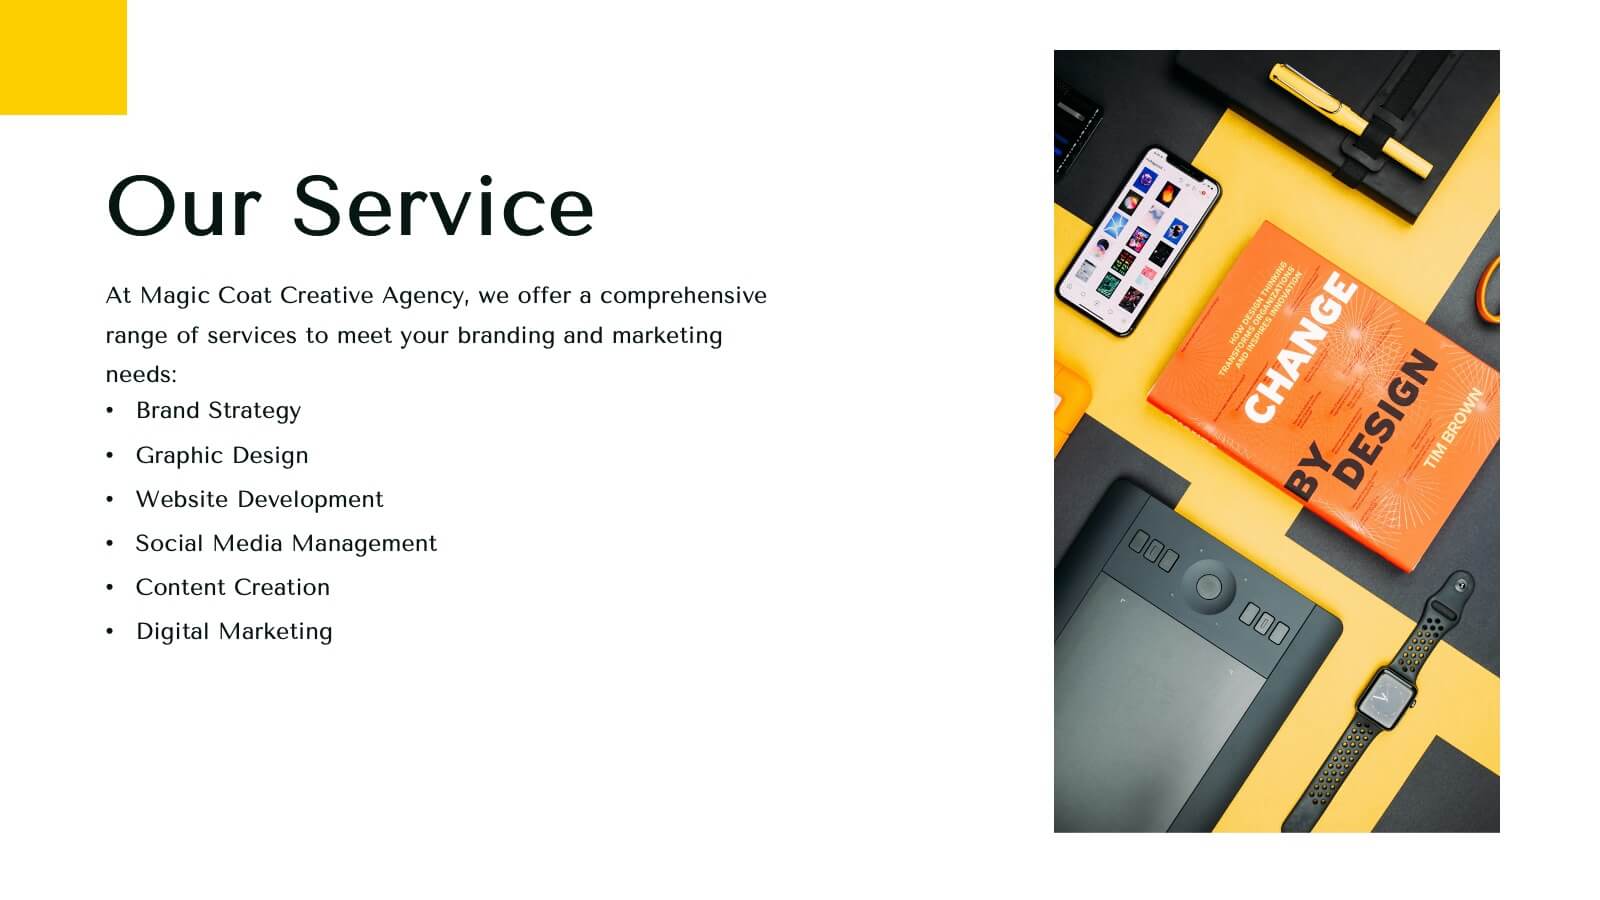
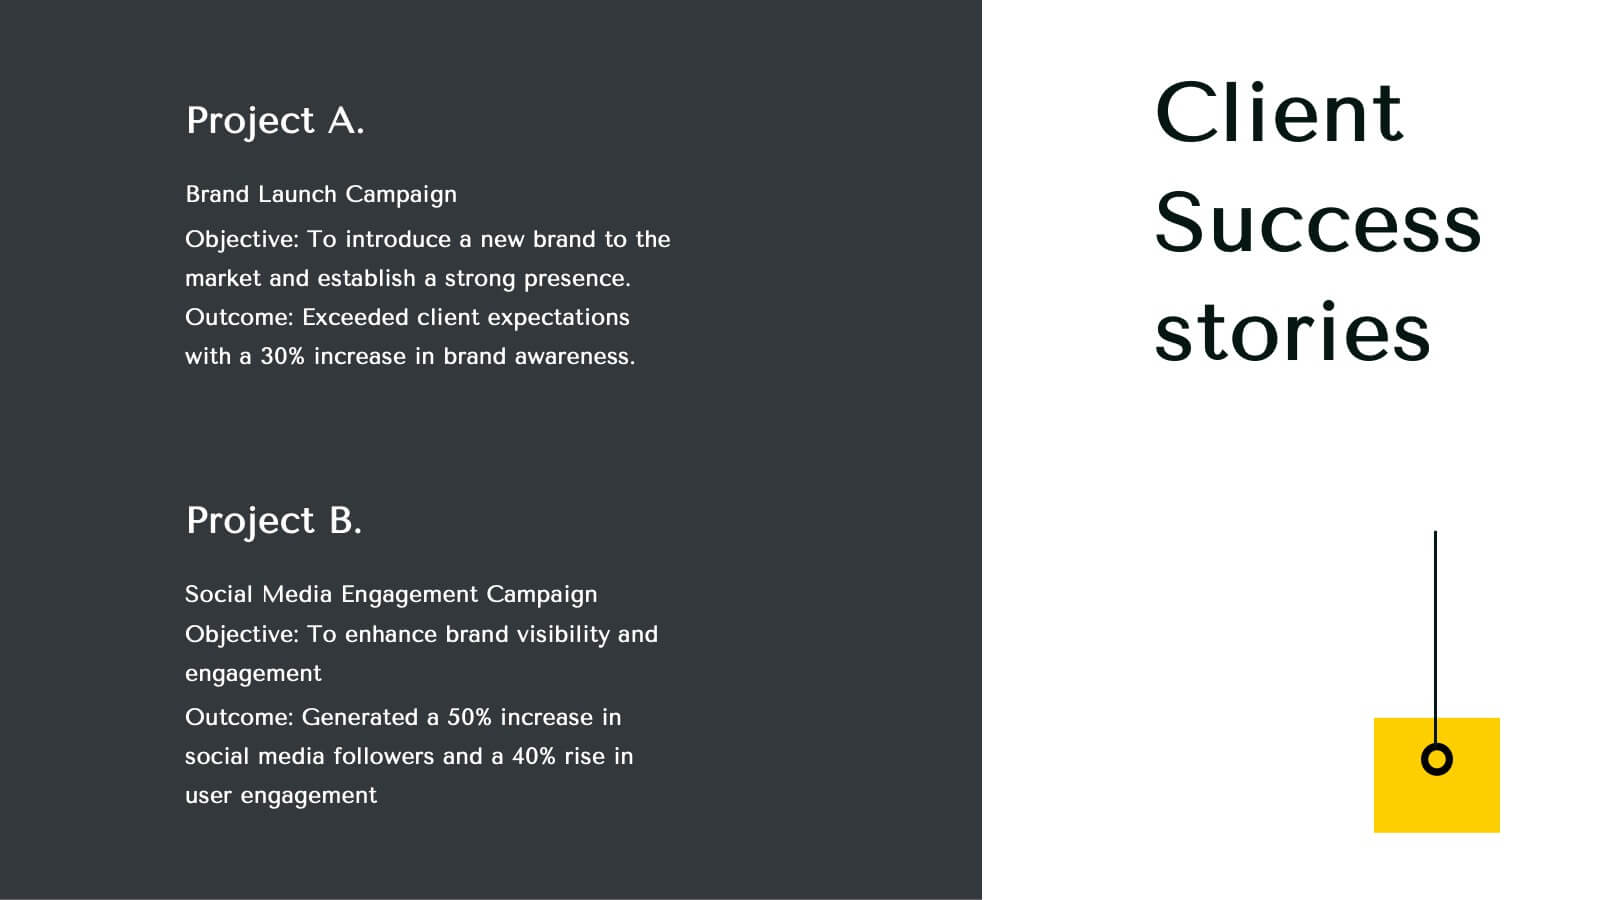
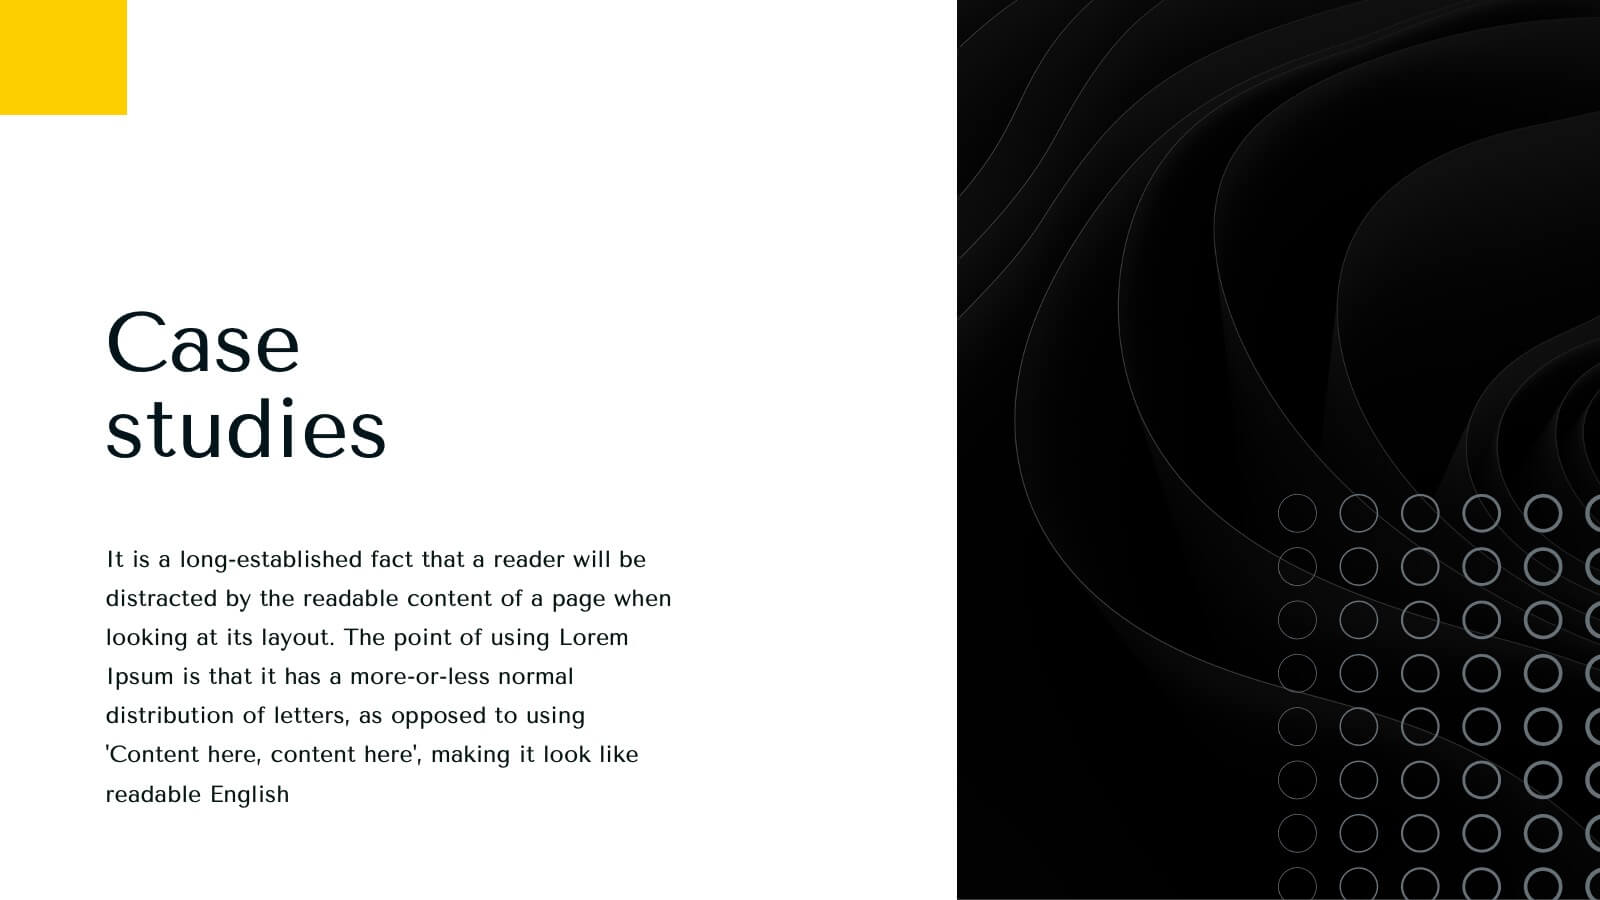
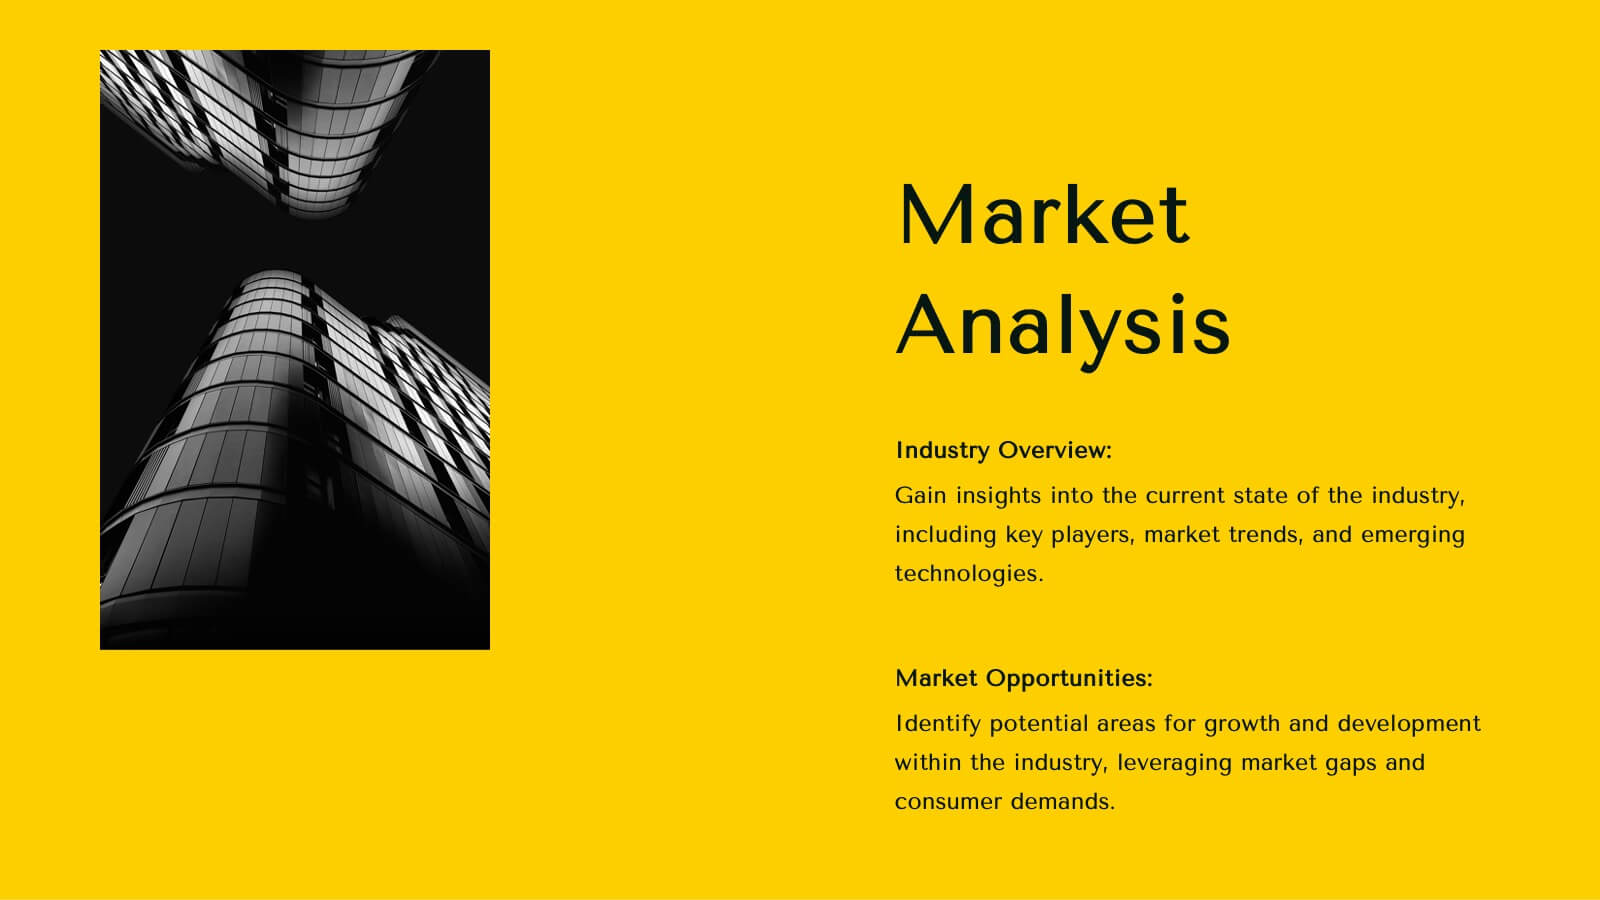
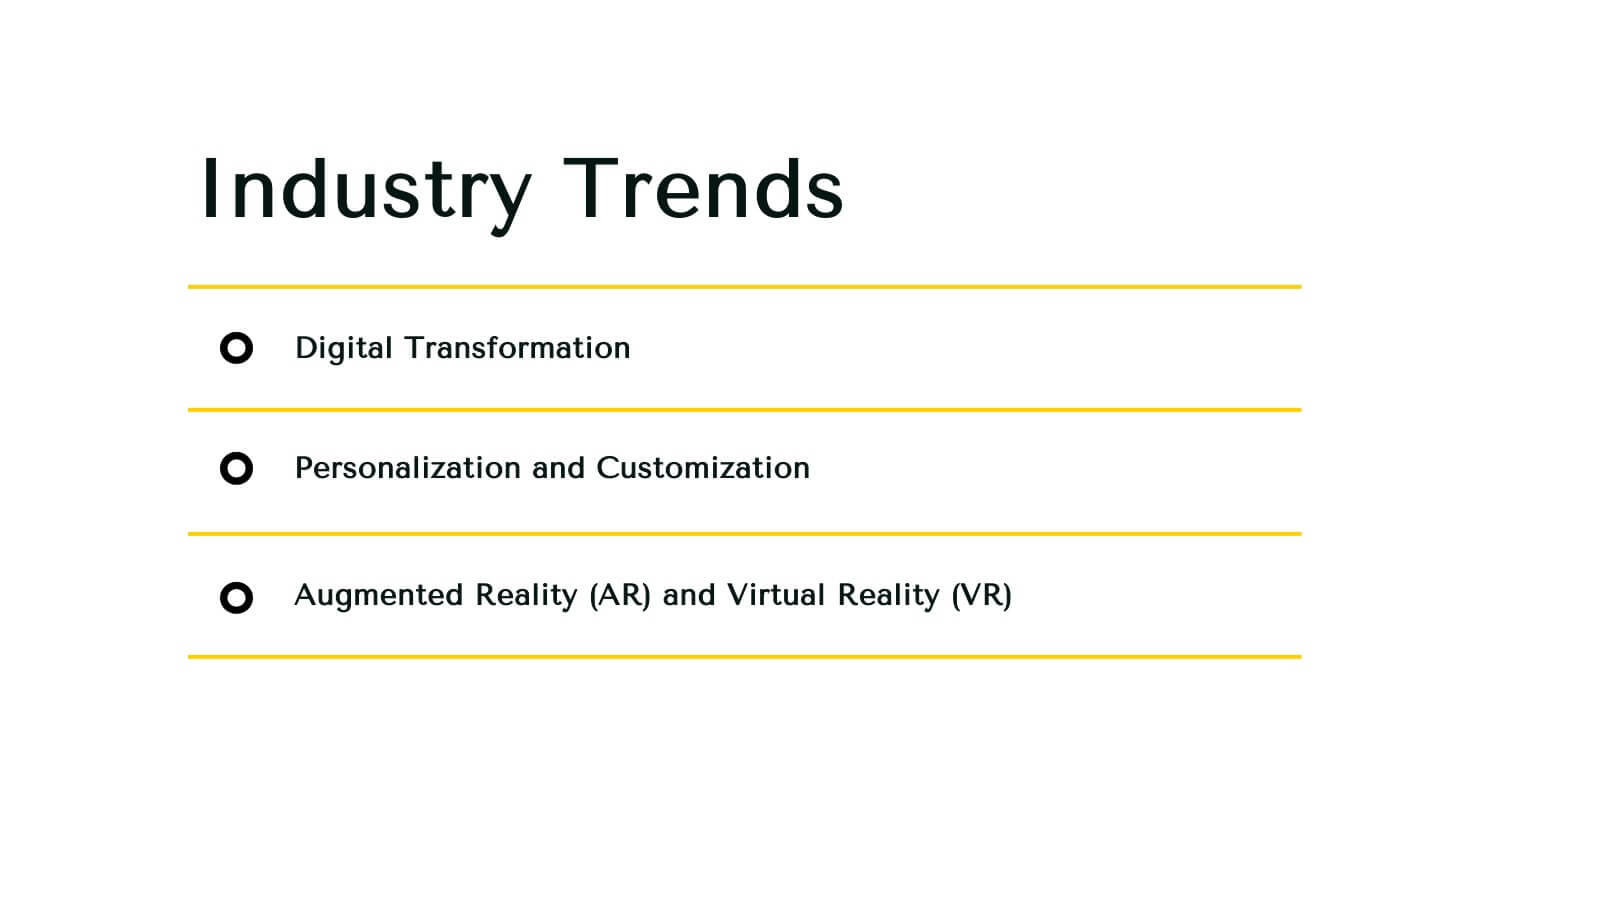
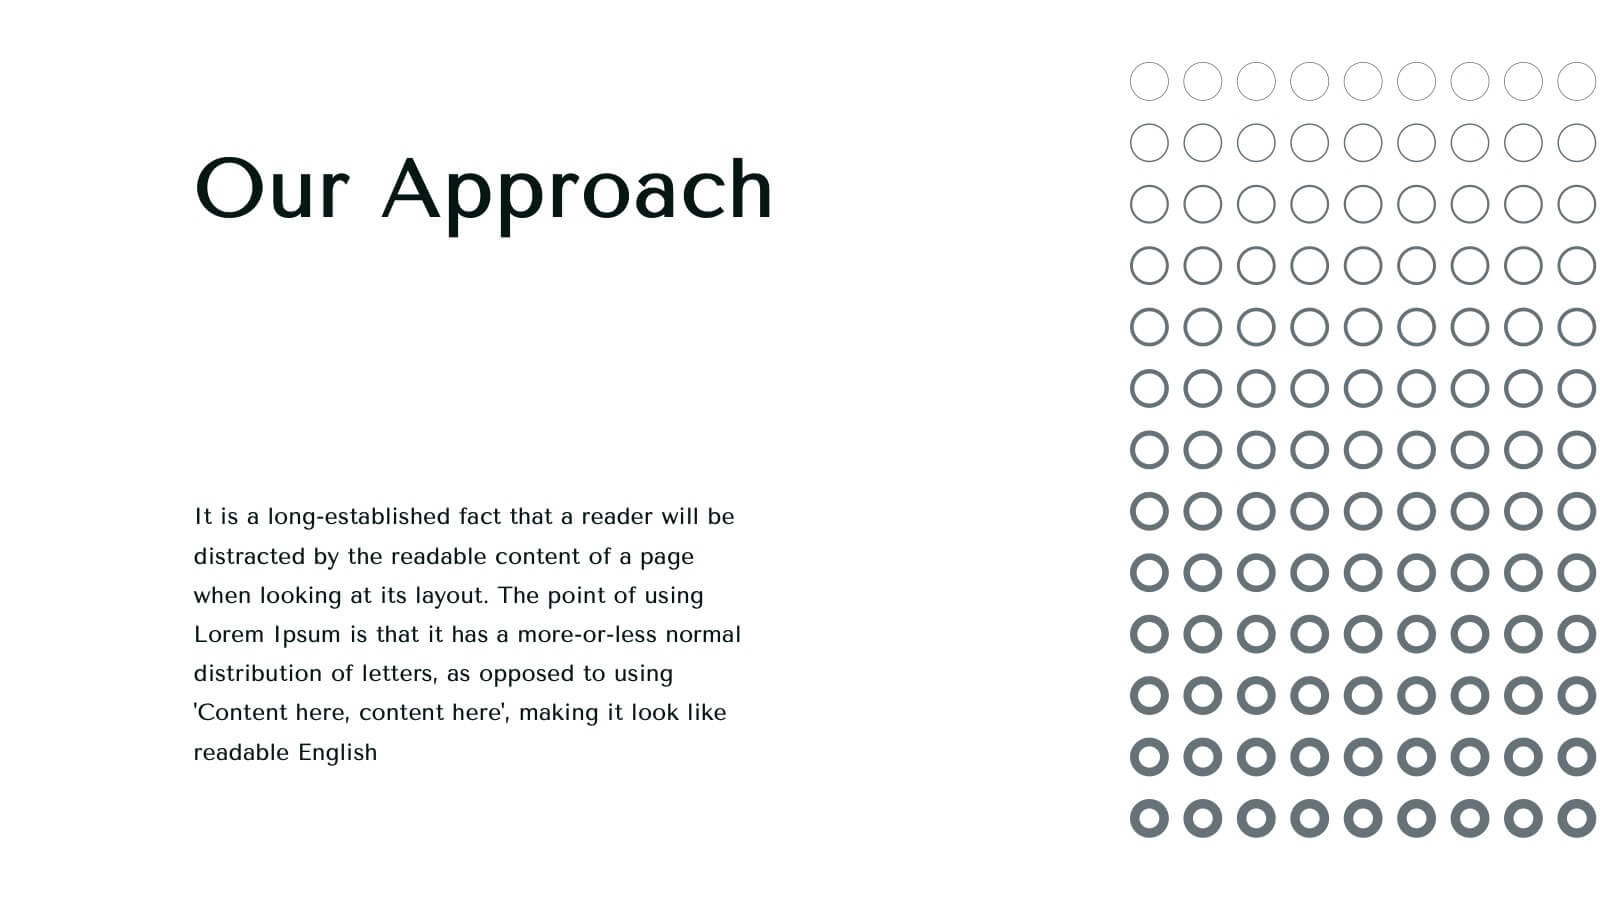
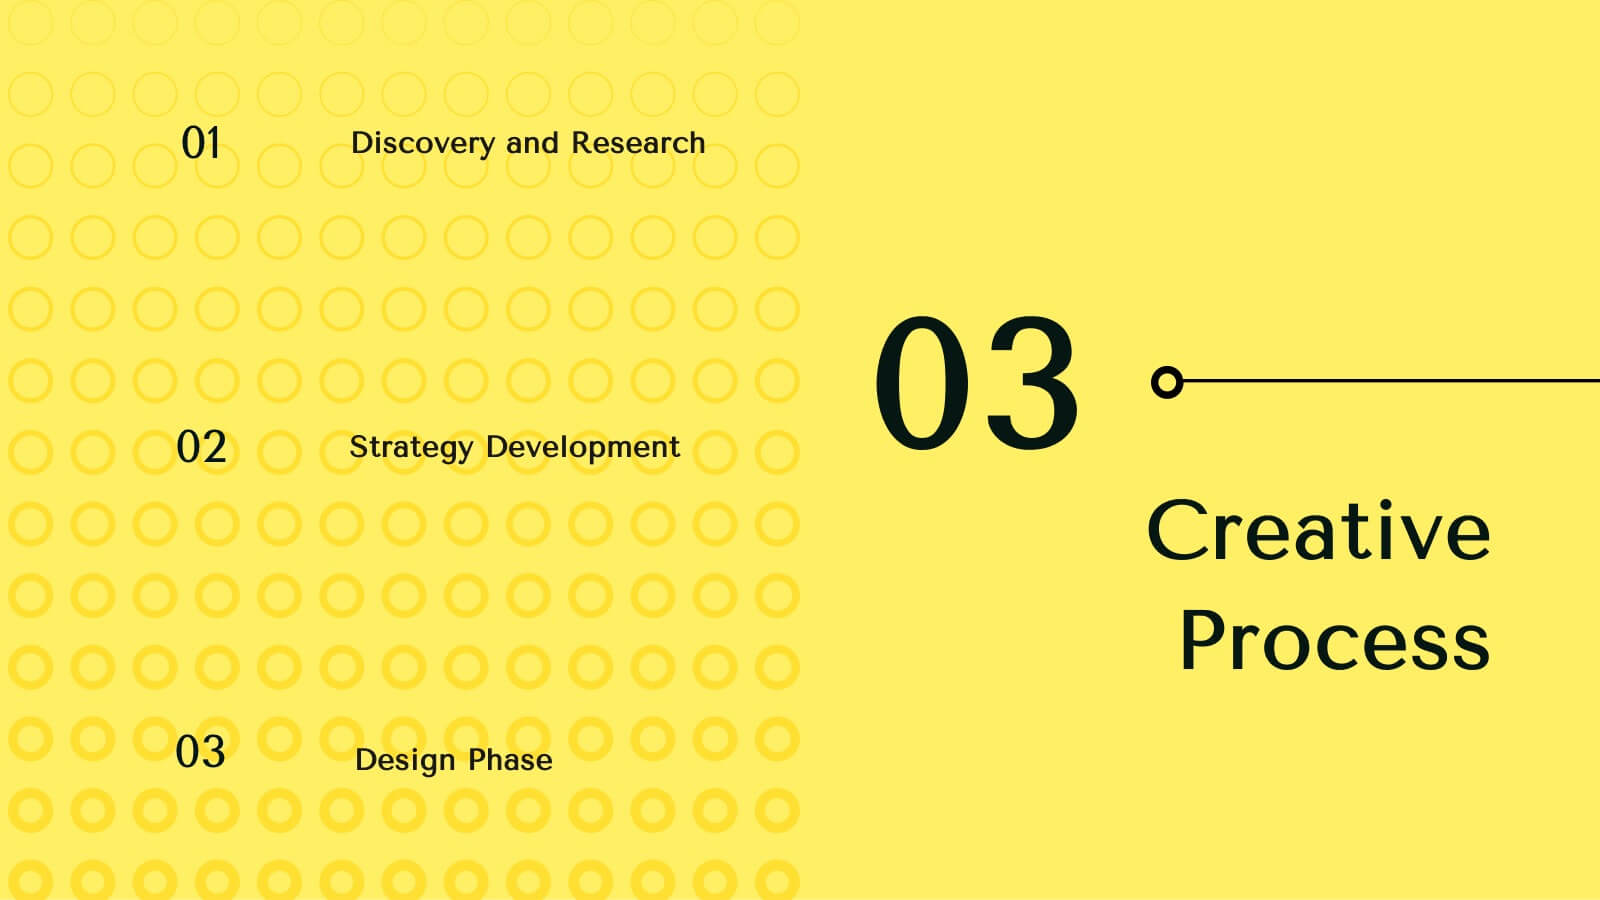
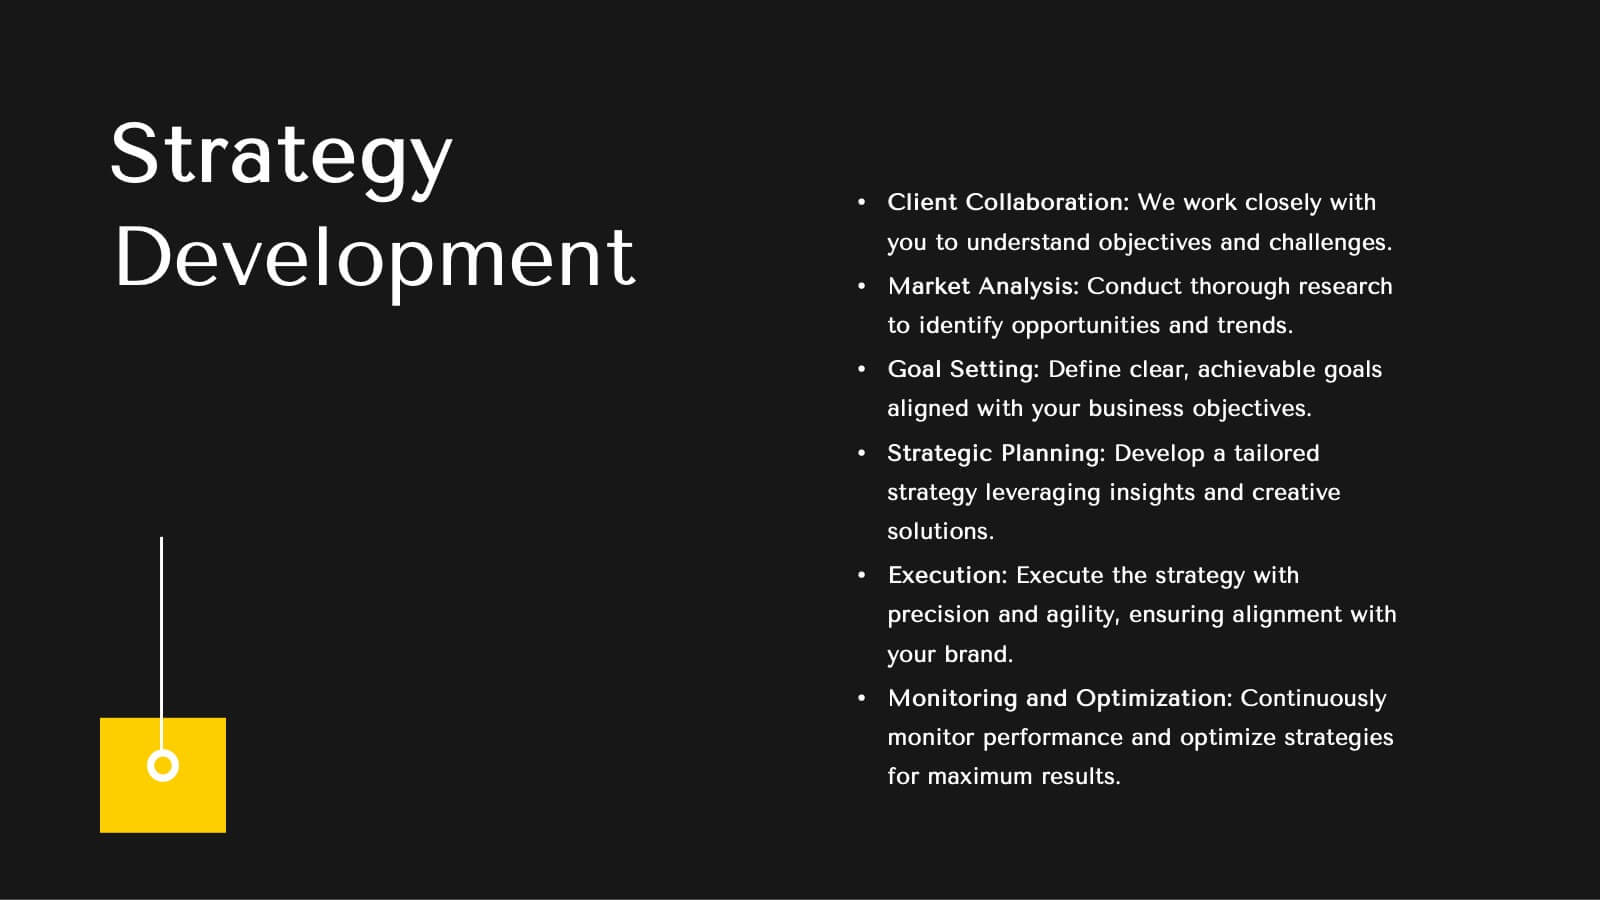
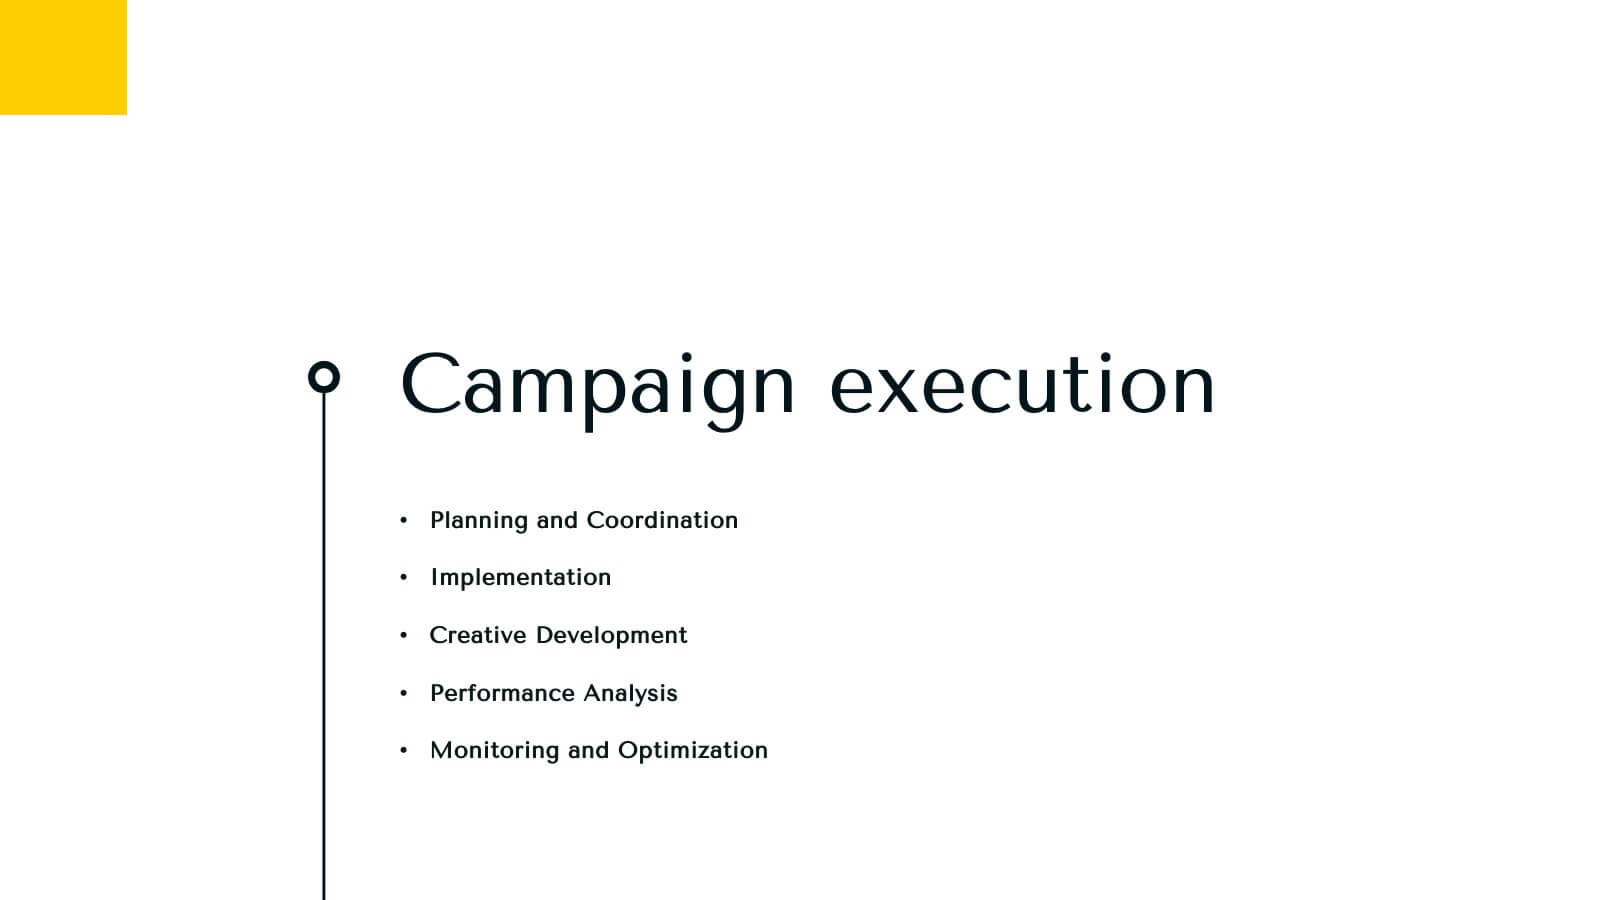
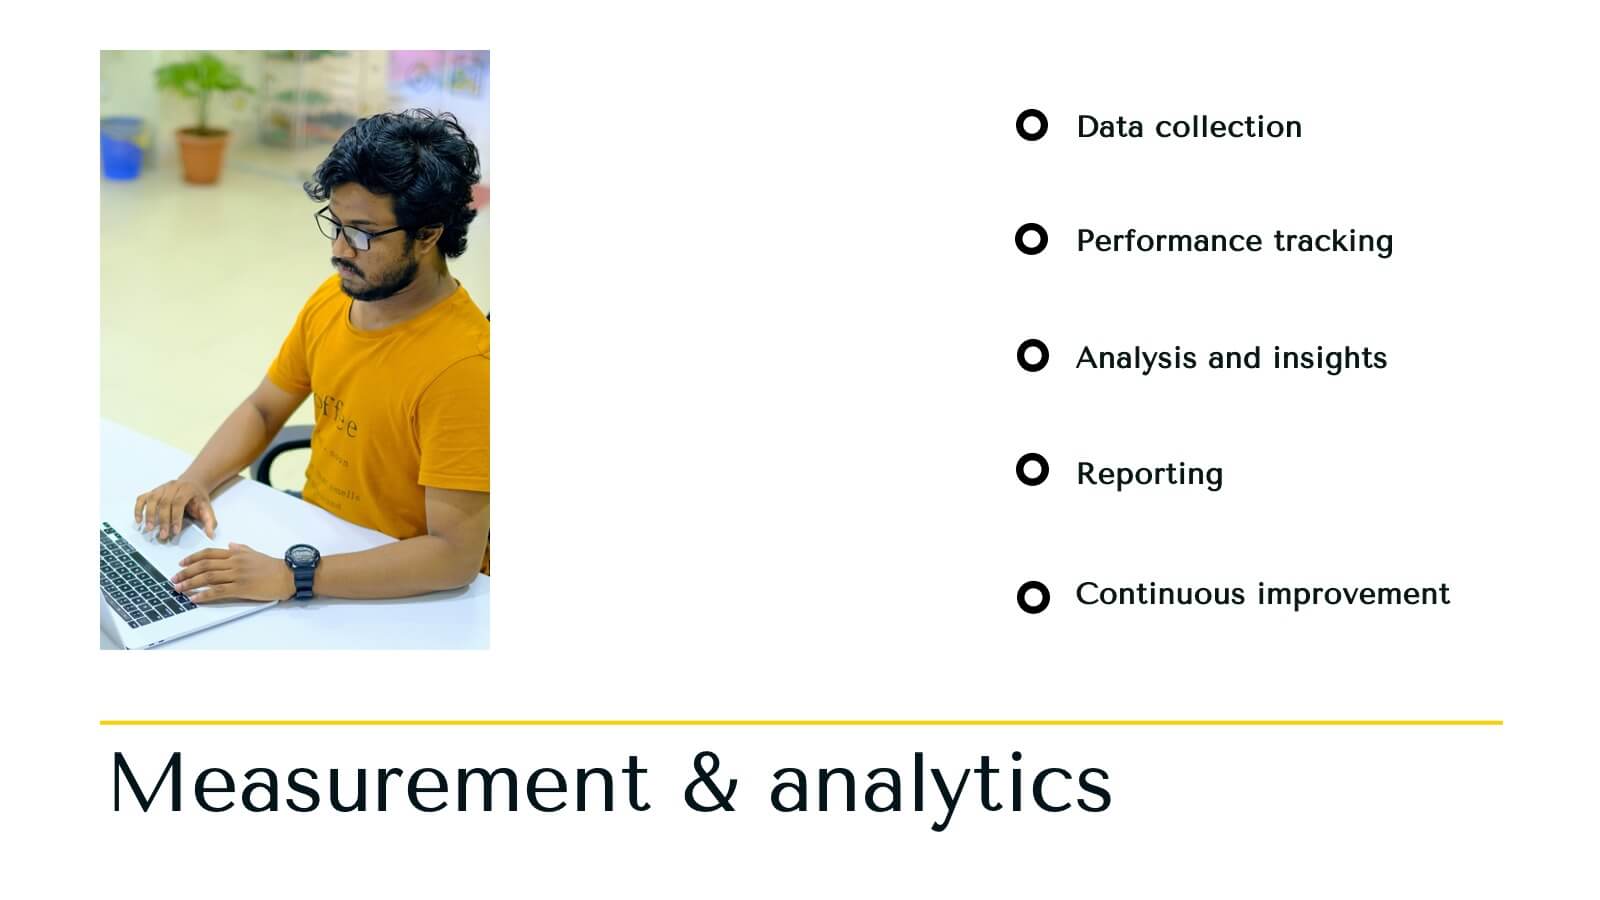
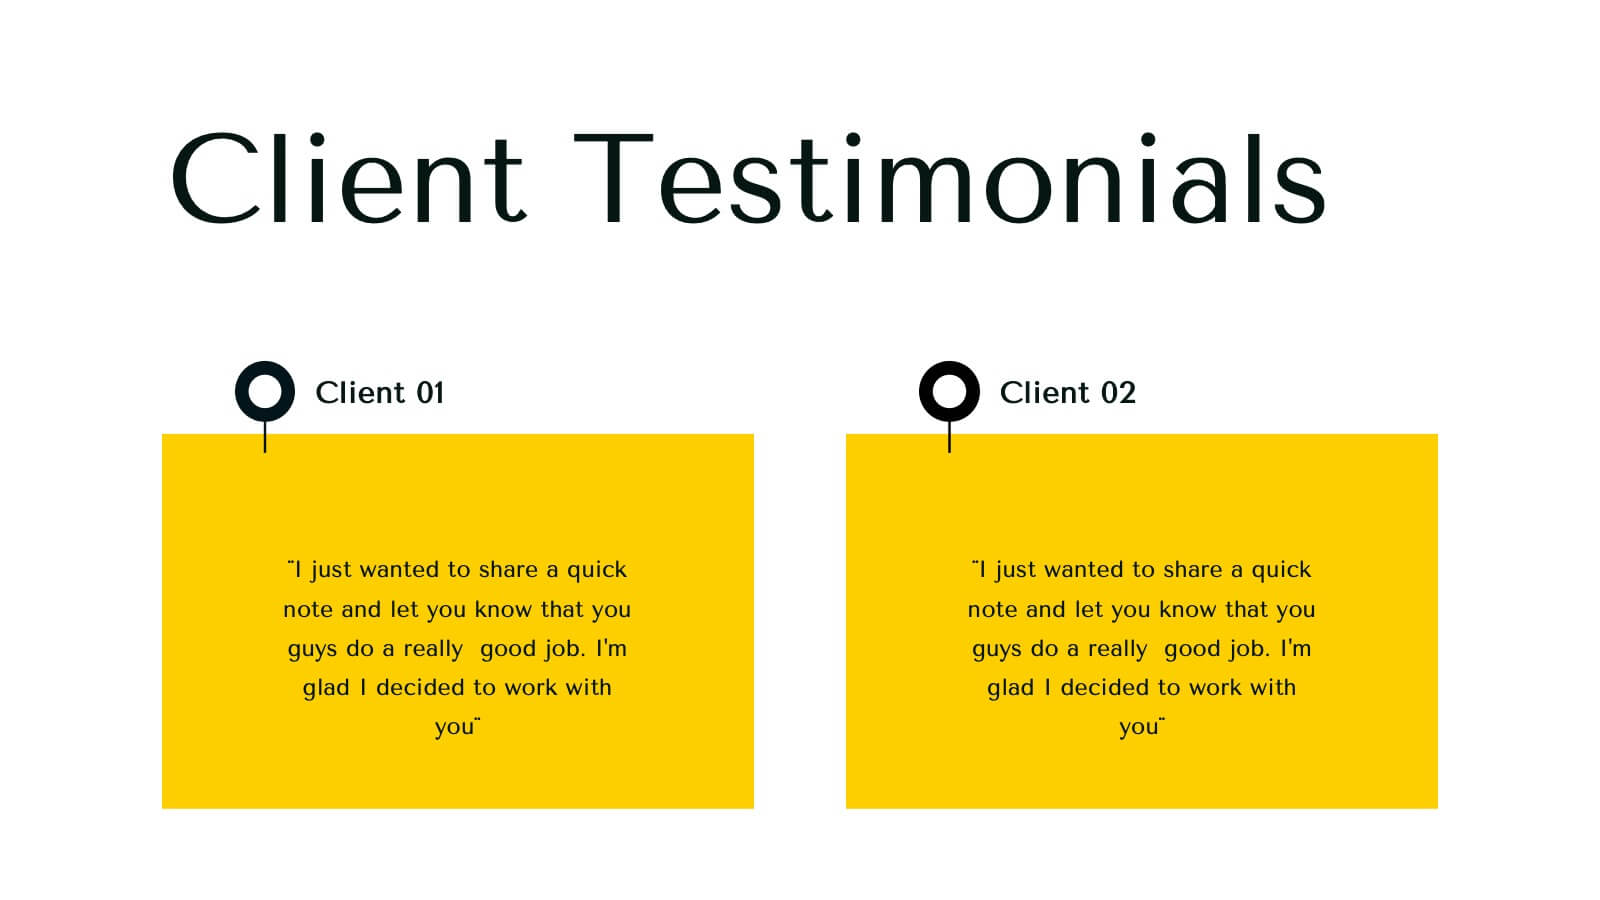
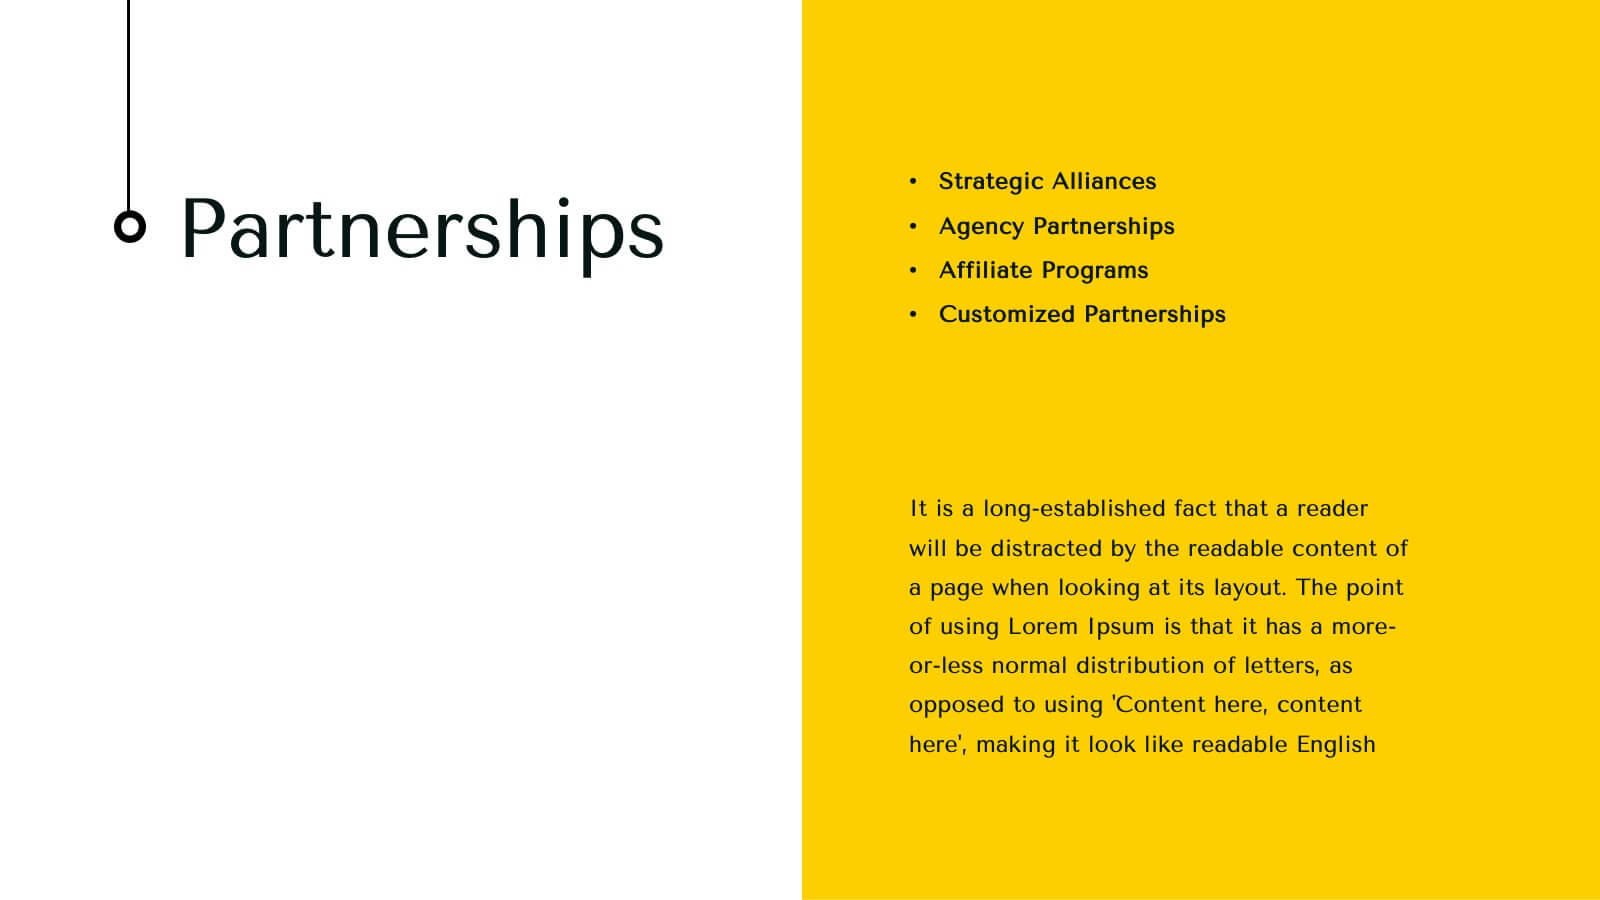
Infinity Agency Portfolio Presentation
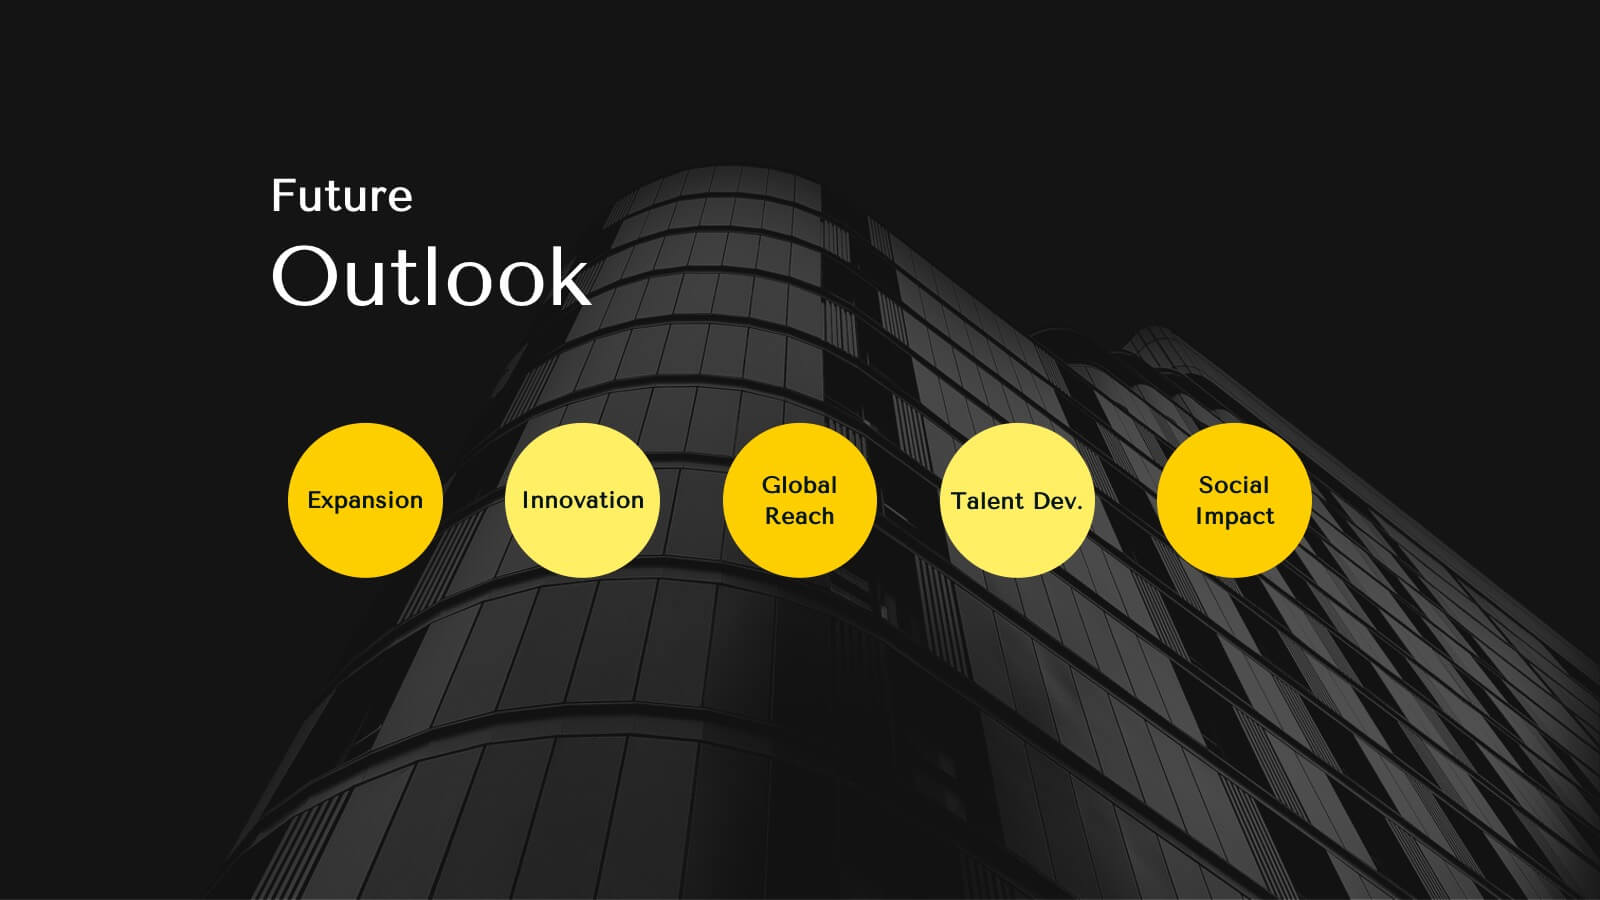
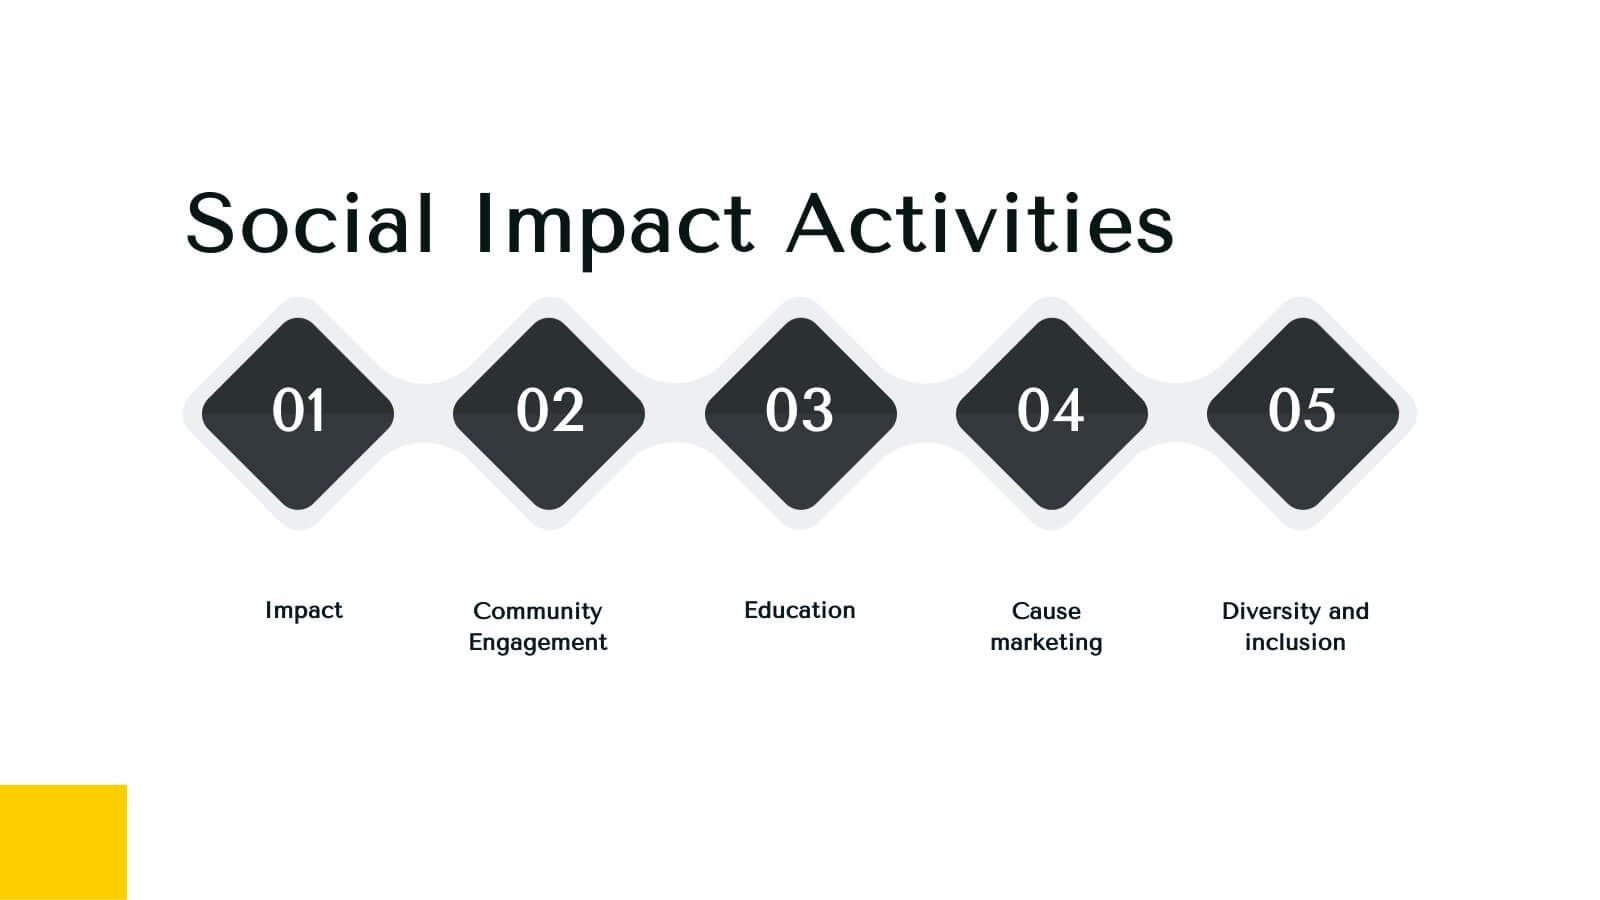
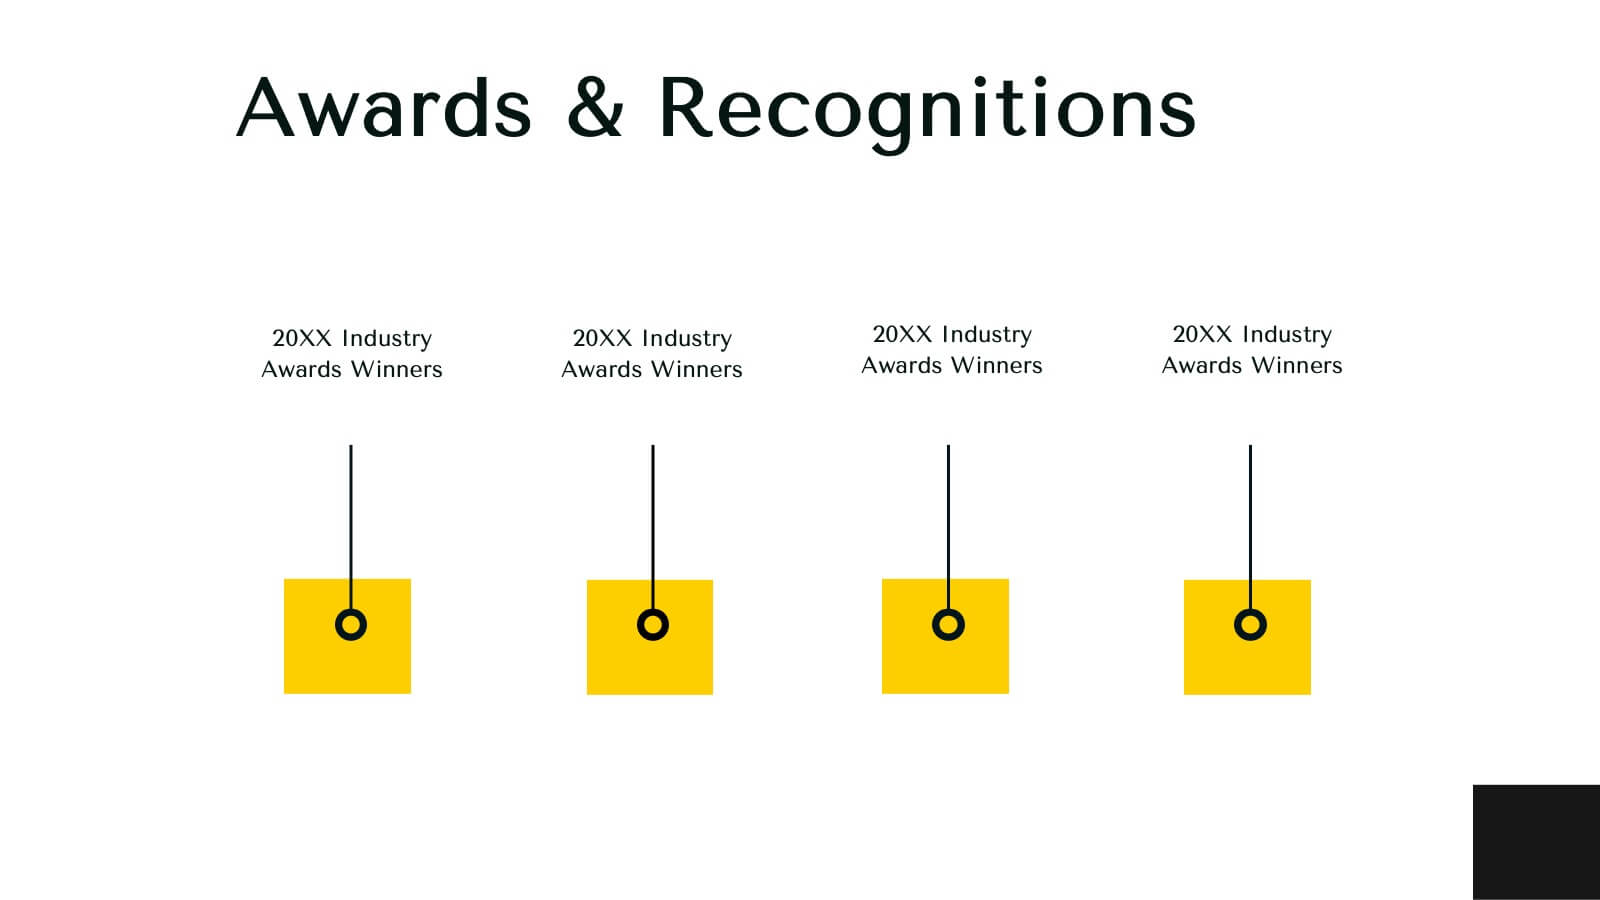
Showcase your agency's excellence with this dynamic and modern presentation template. Ideal for presenting market analysis, client success stories, and strategic development plans, it features a bold design with a vibrant yellow and black theme. Highlight your unique approach and creative process to captivate your audience. Compatible with PowerPoint, Keynote, and Google Slides, it's perfect for any platform.


23 diapositivas
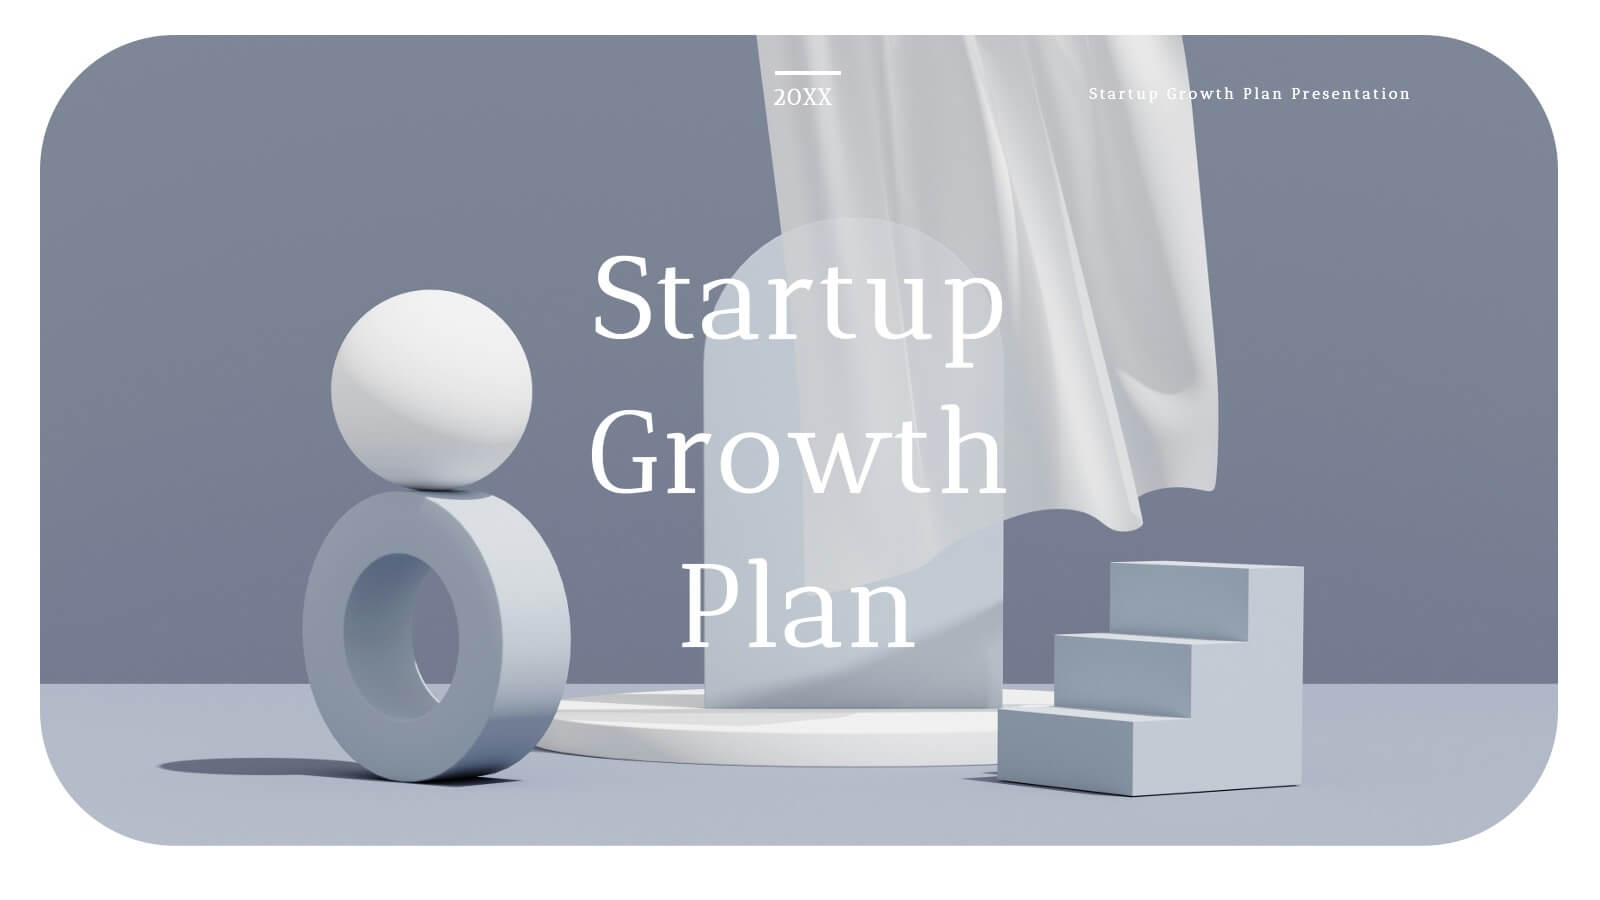
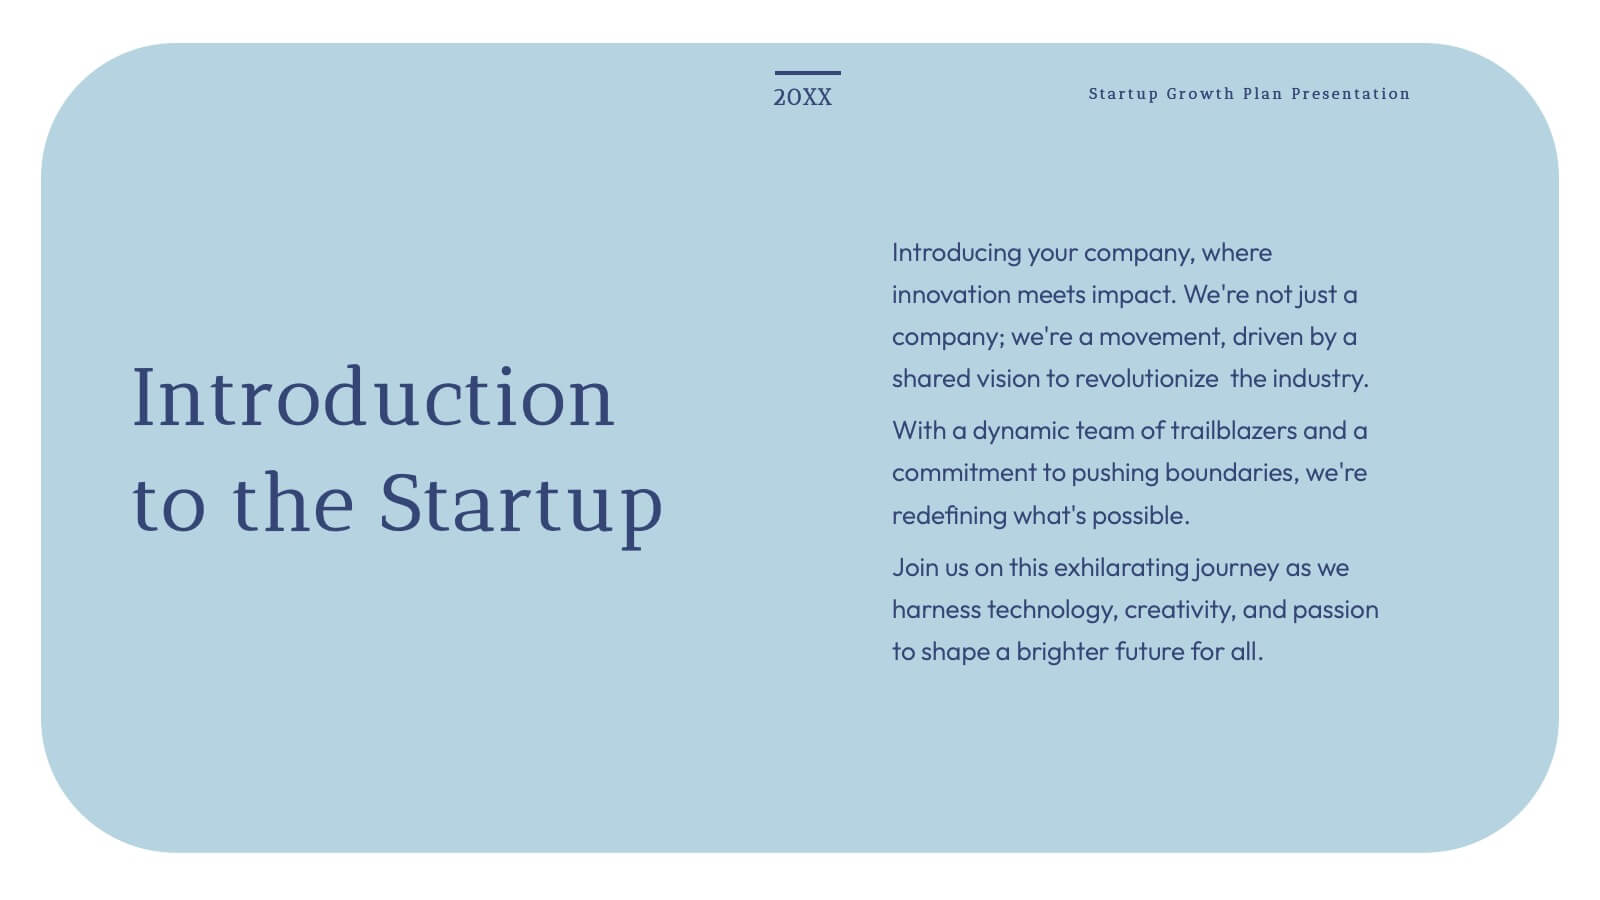
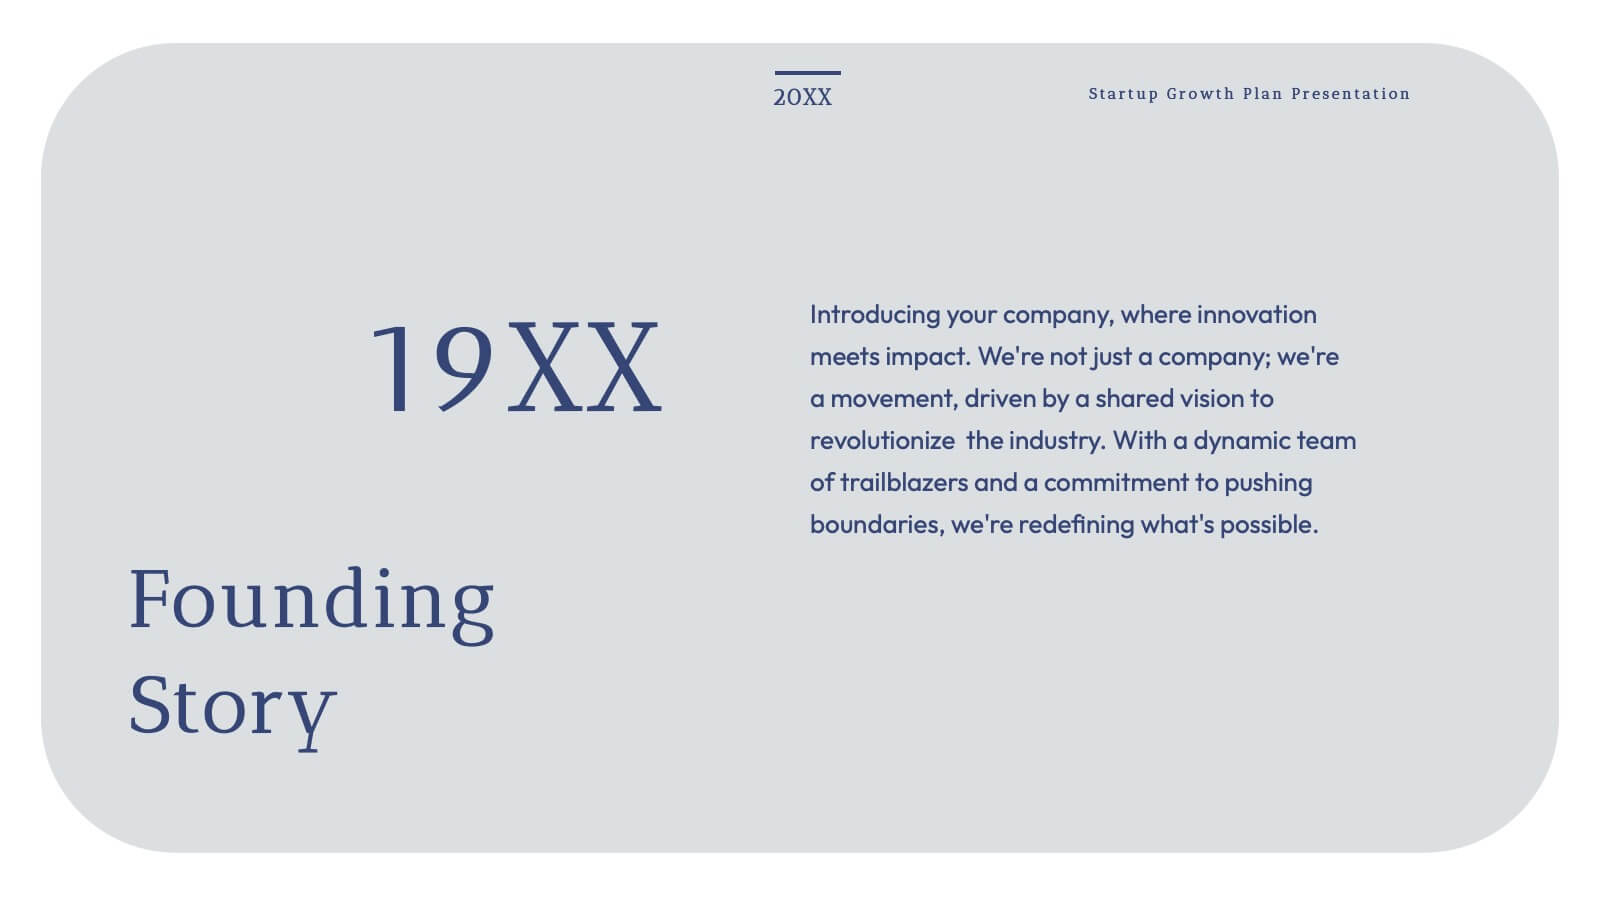
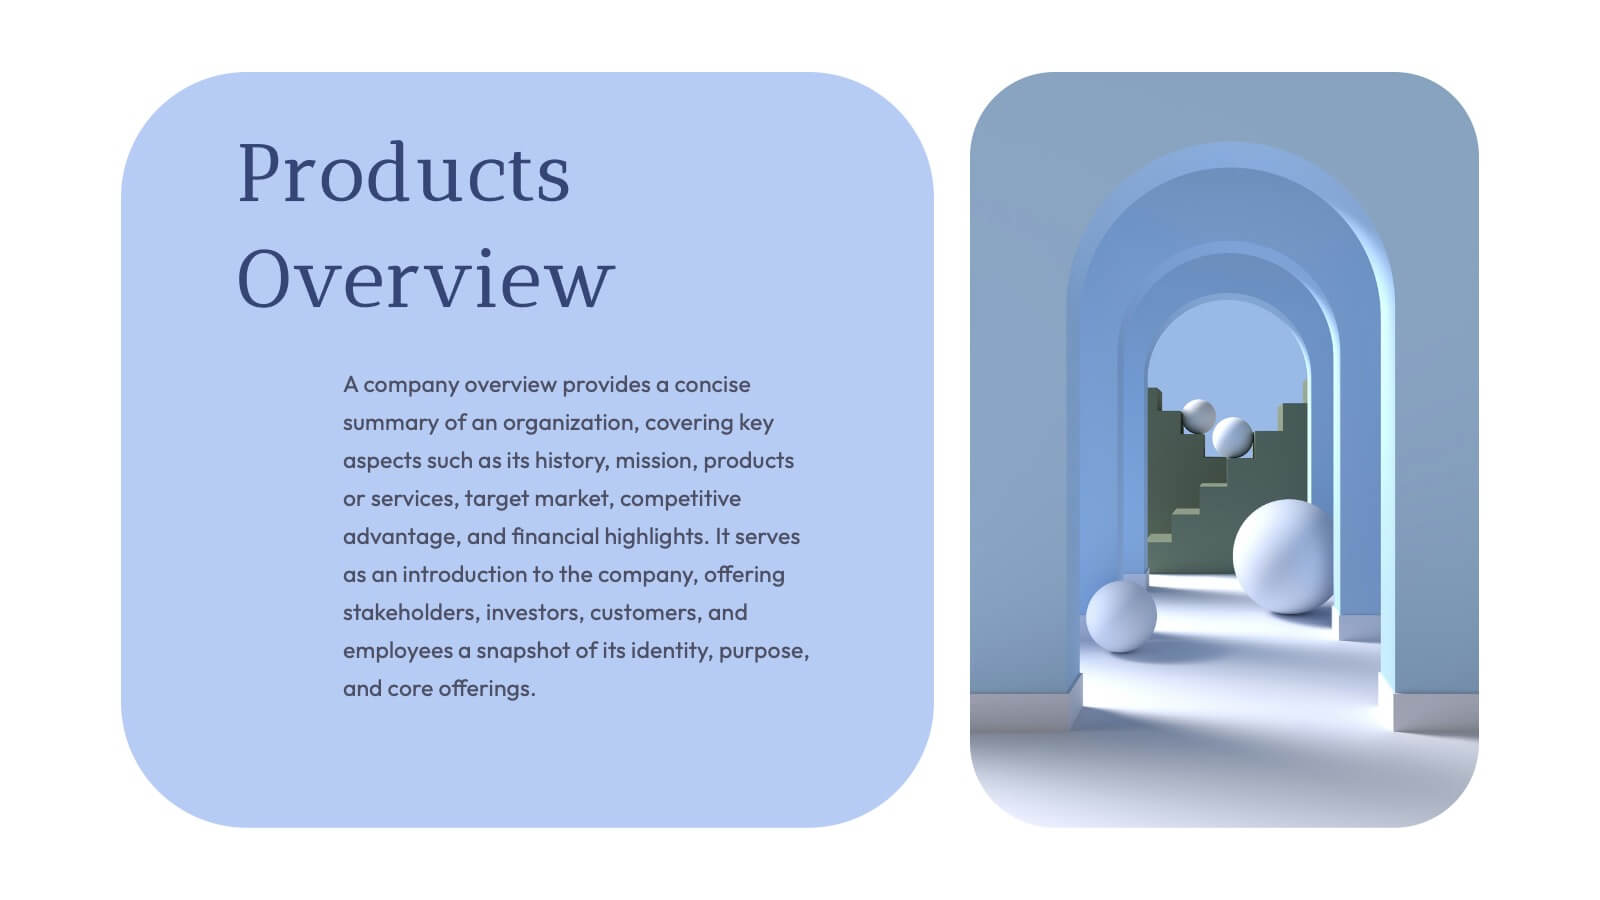
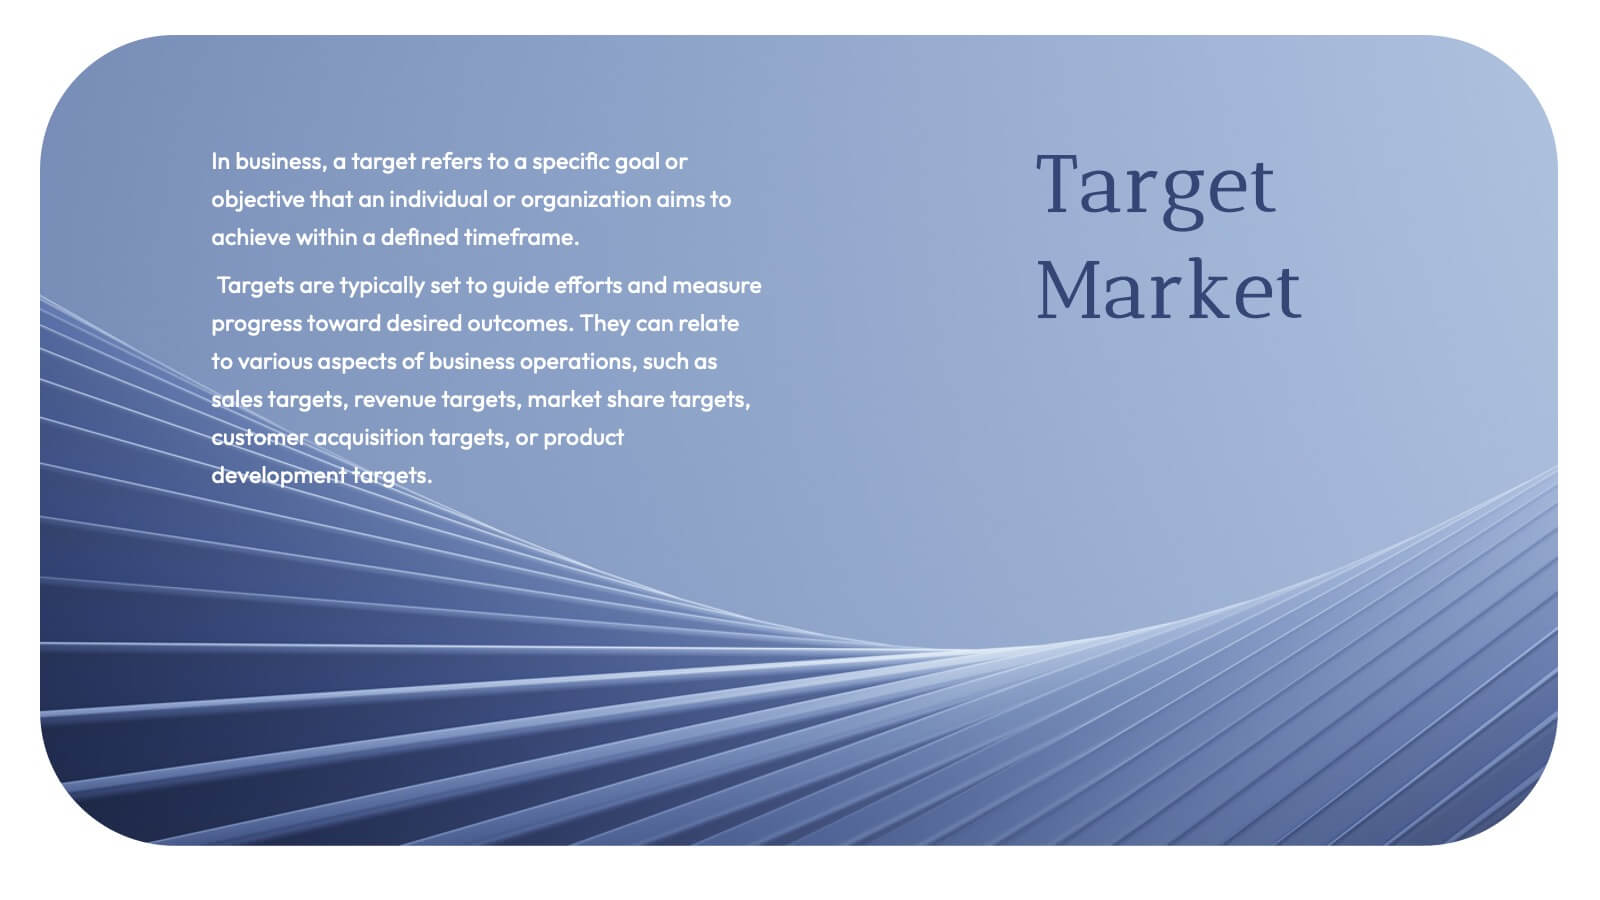
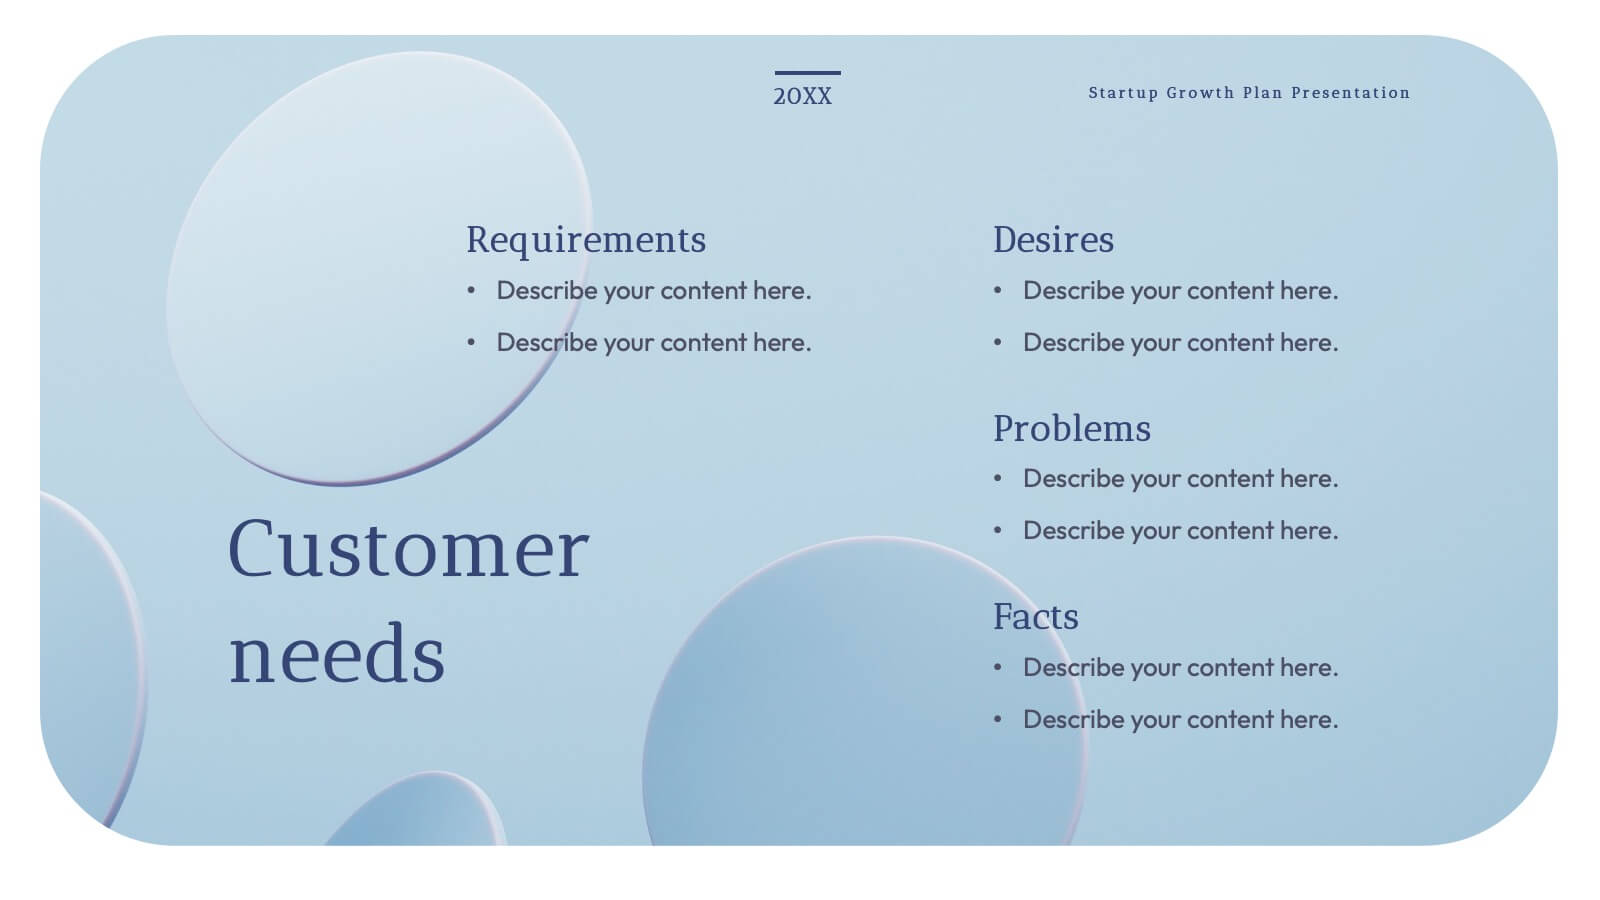
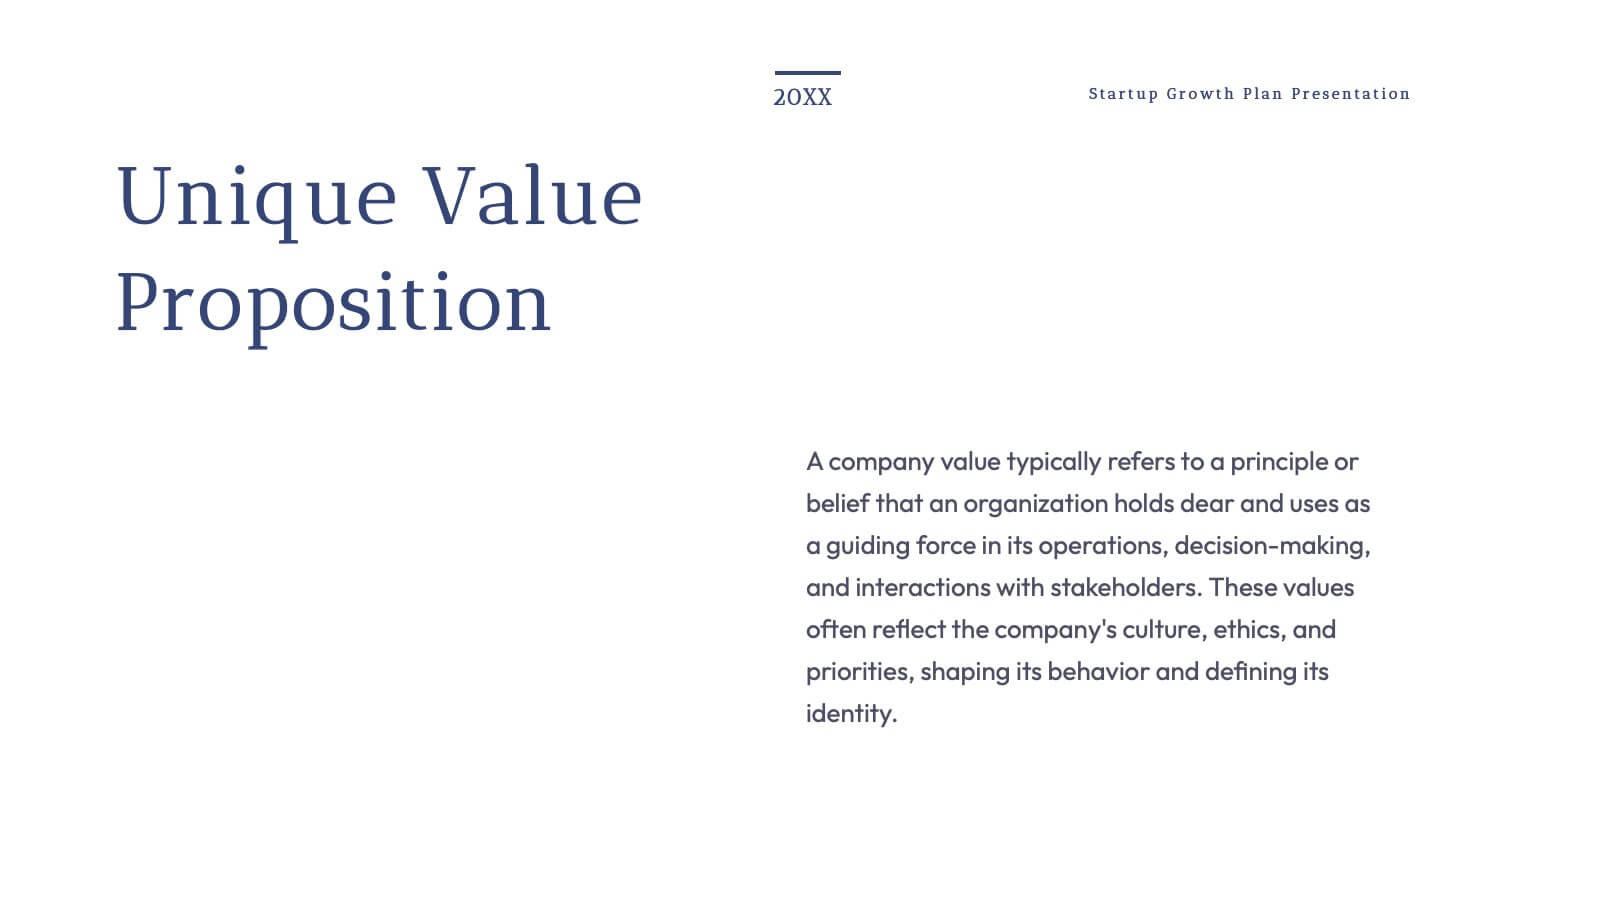
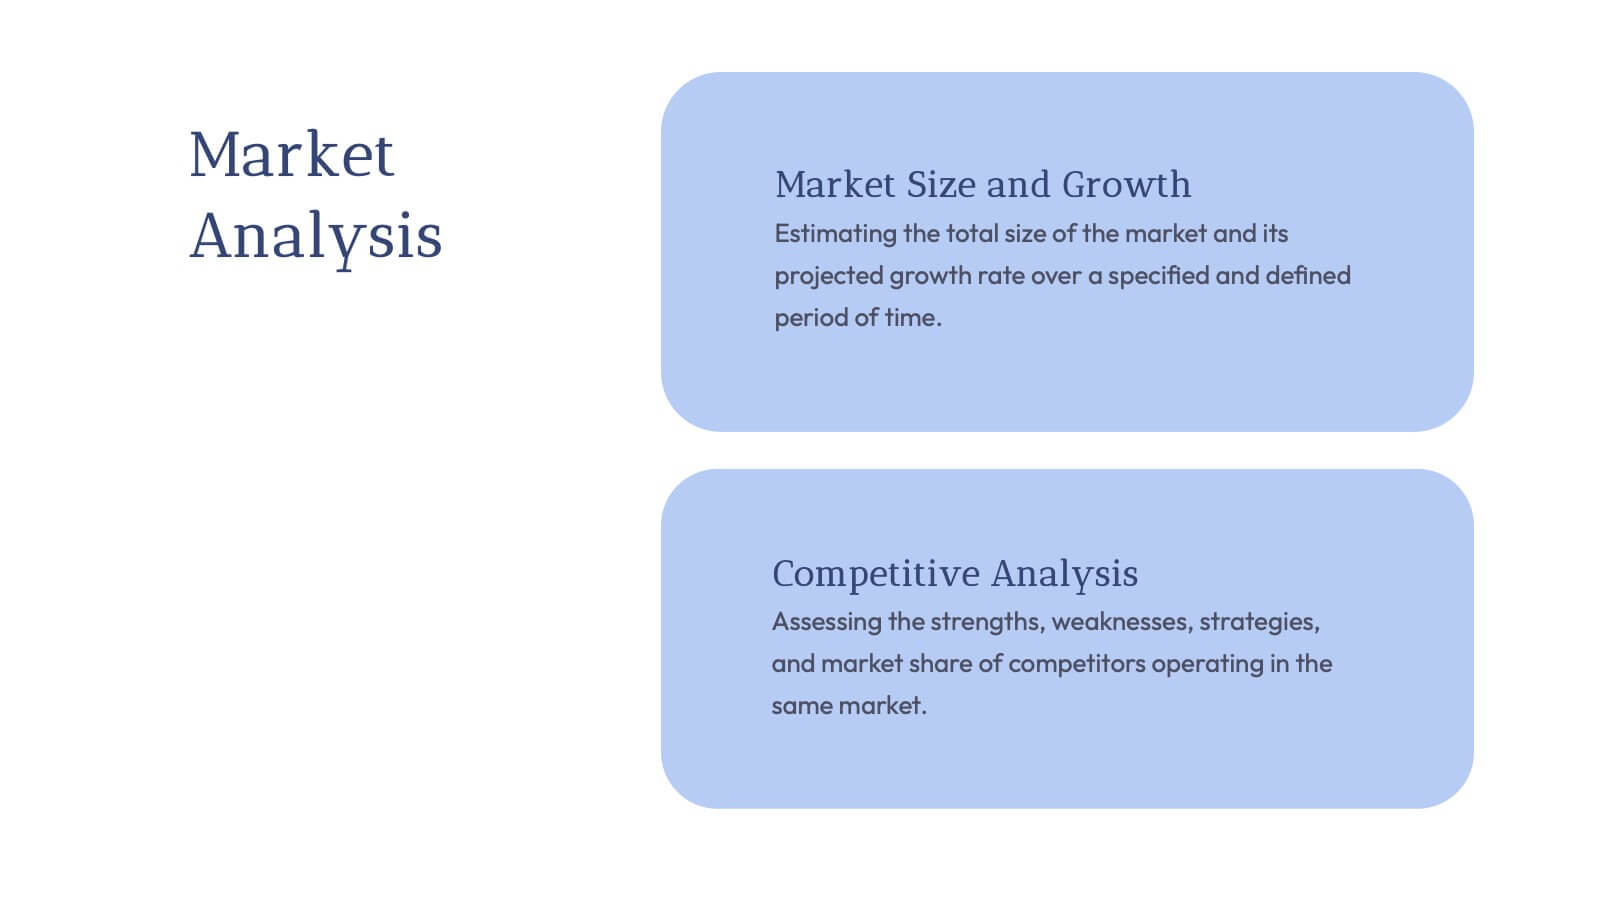
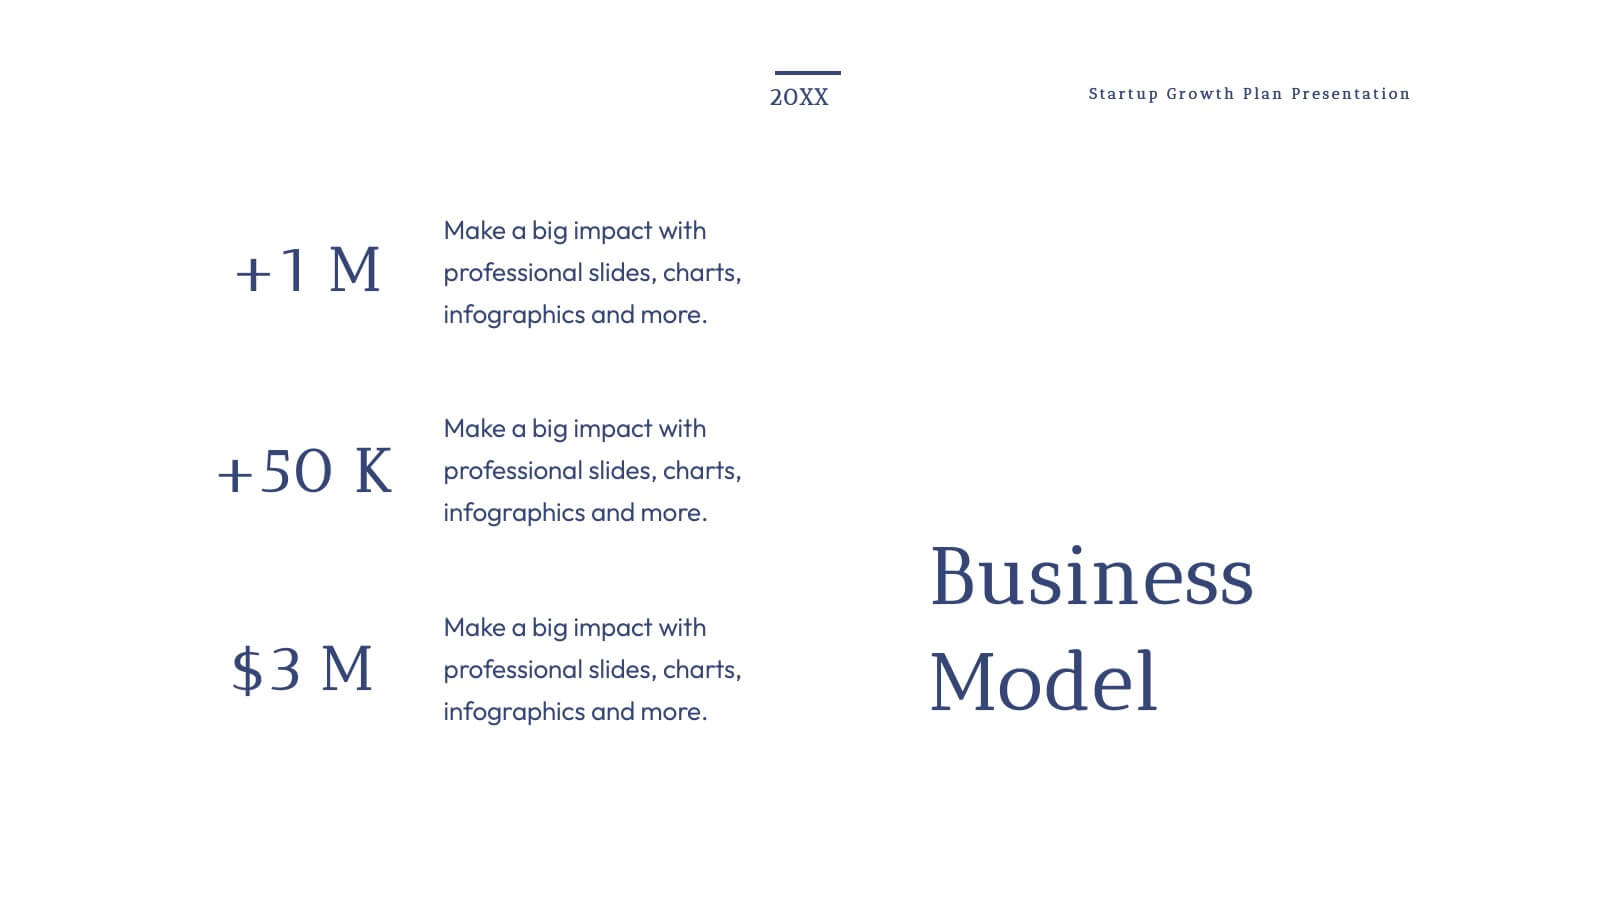
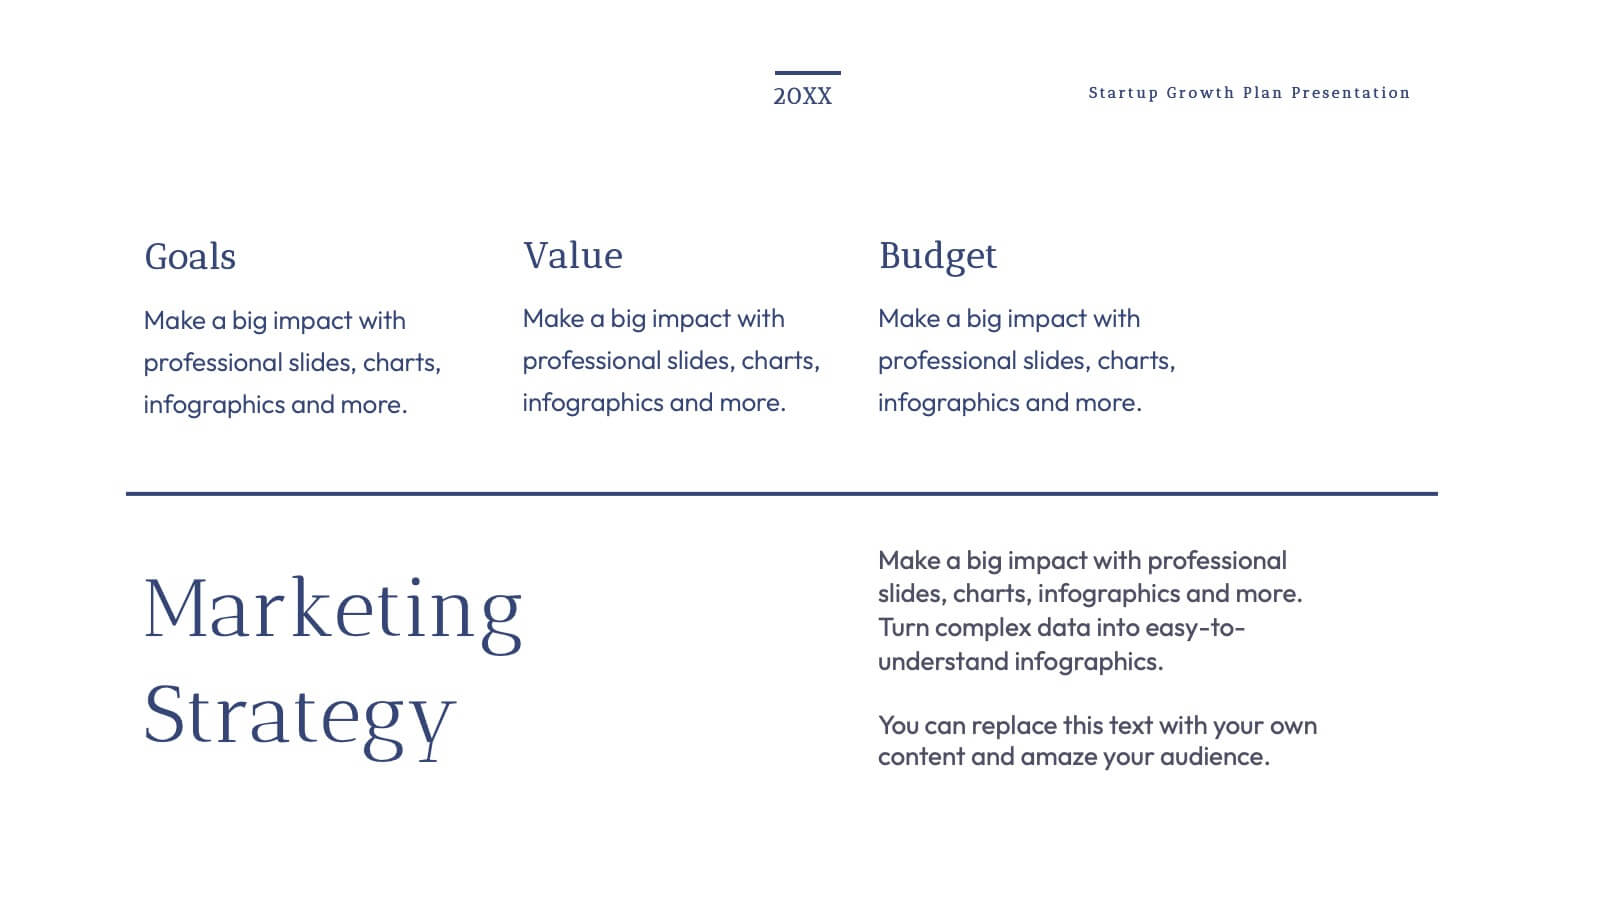
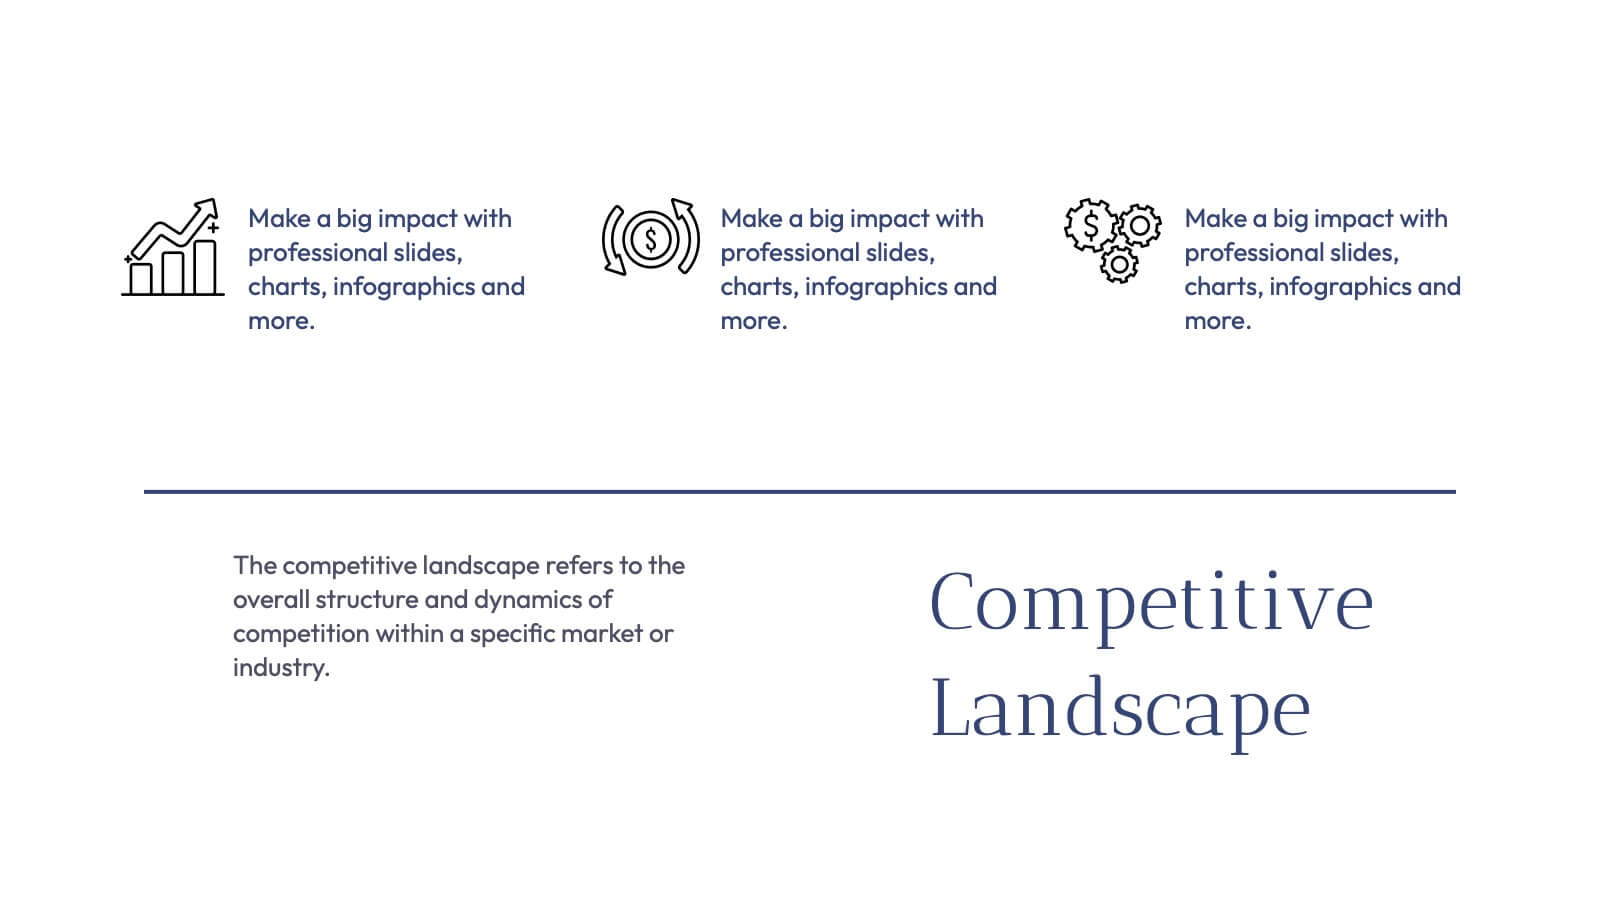
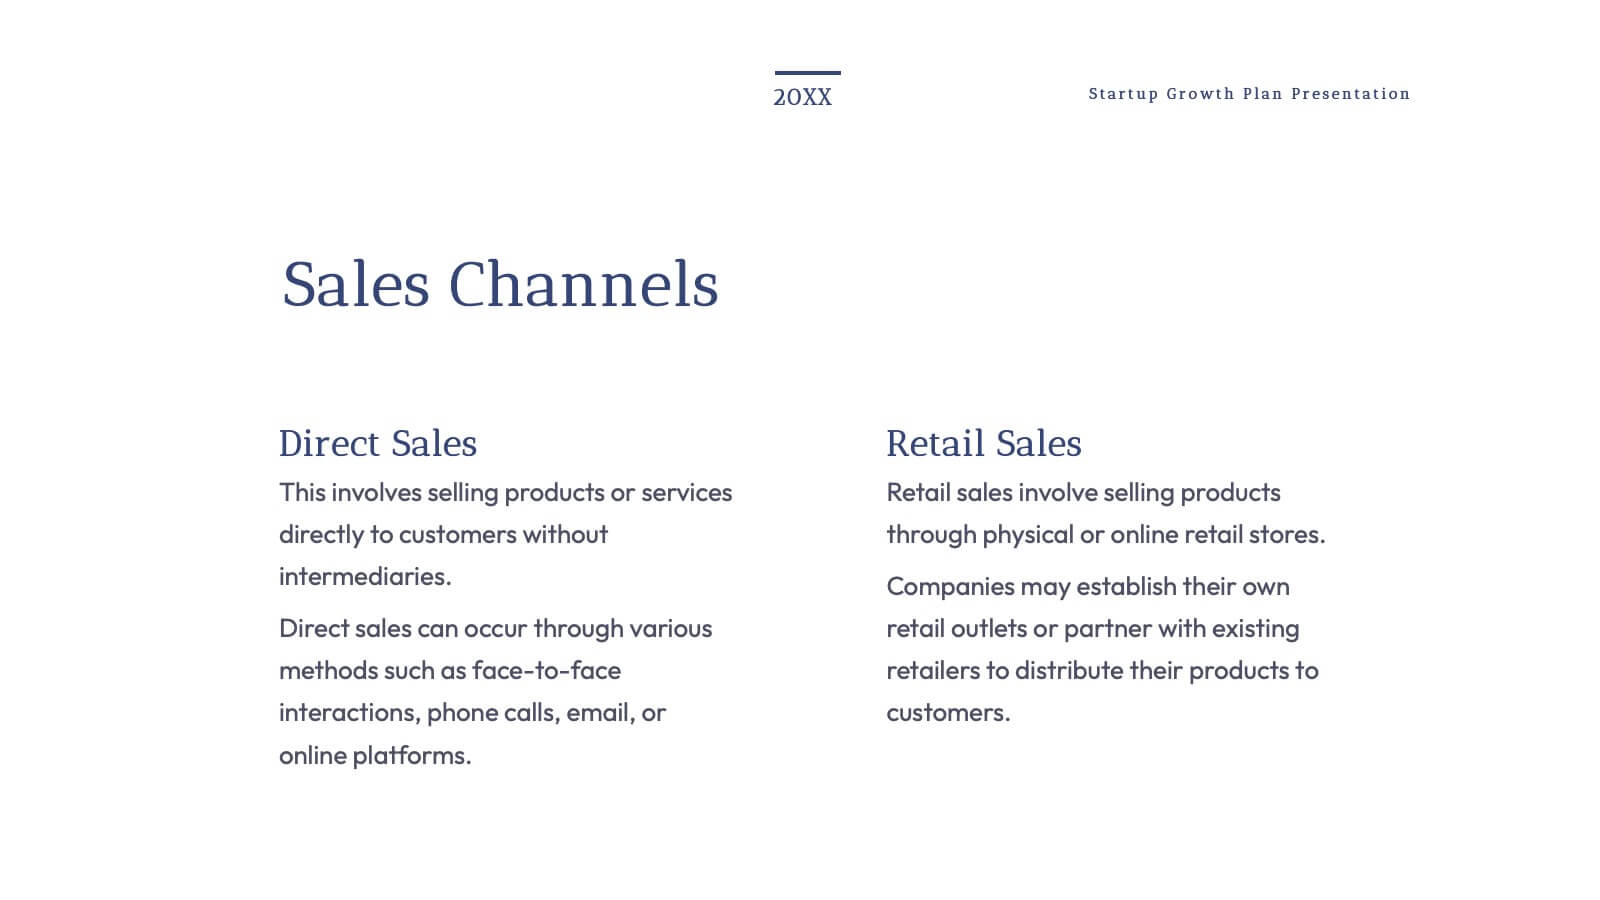
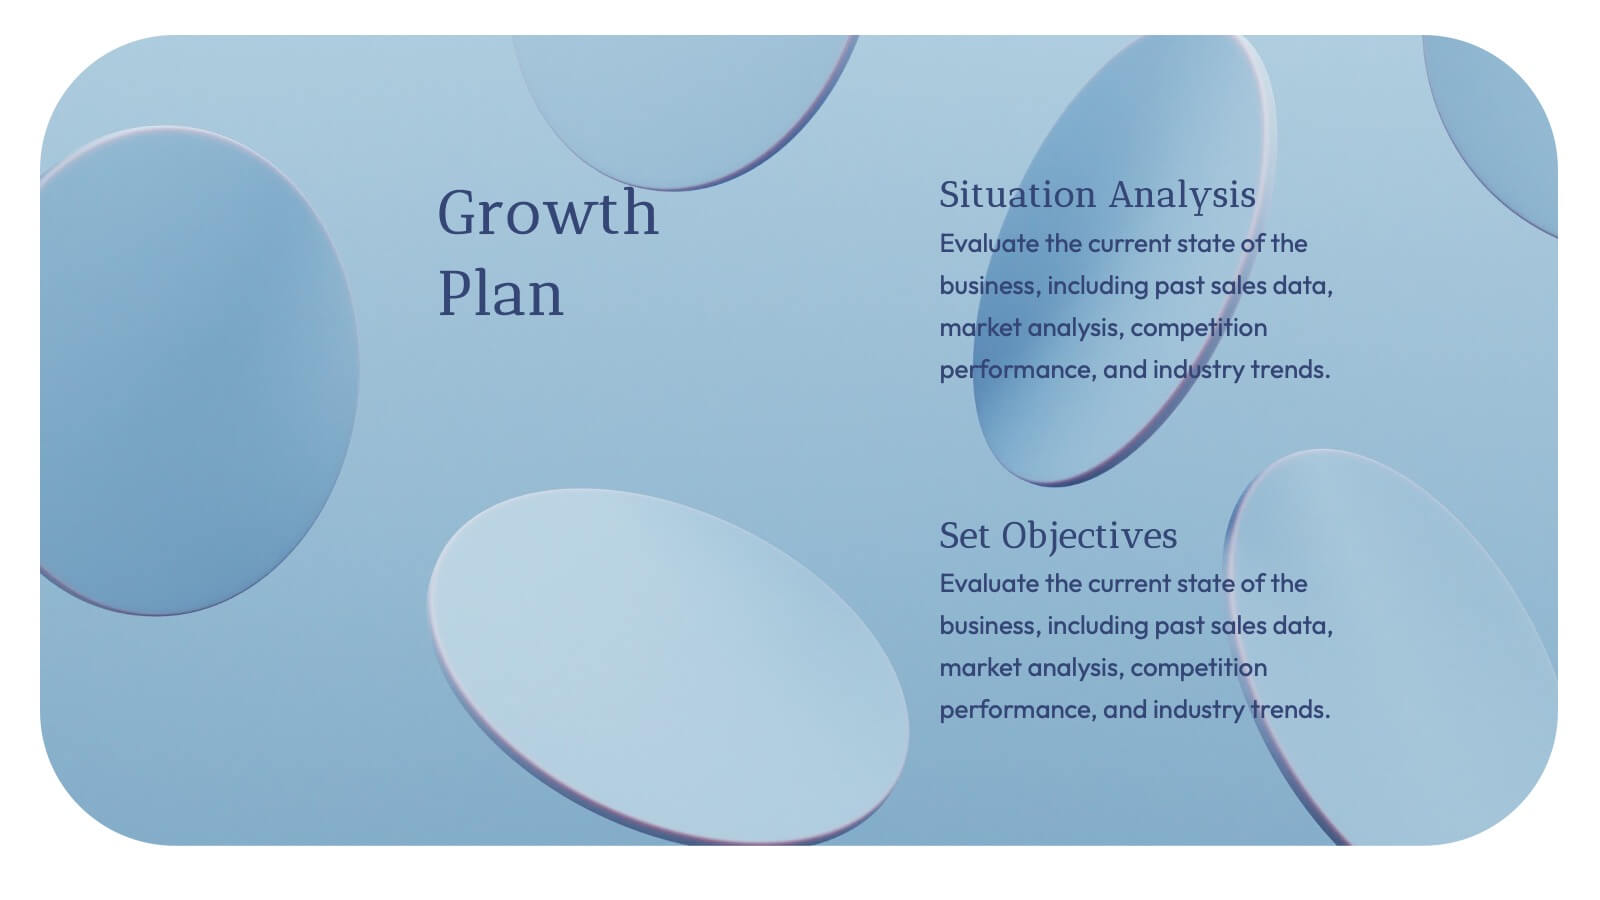
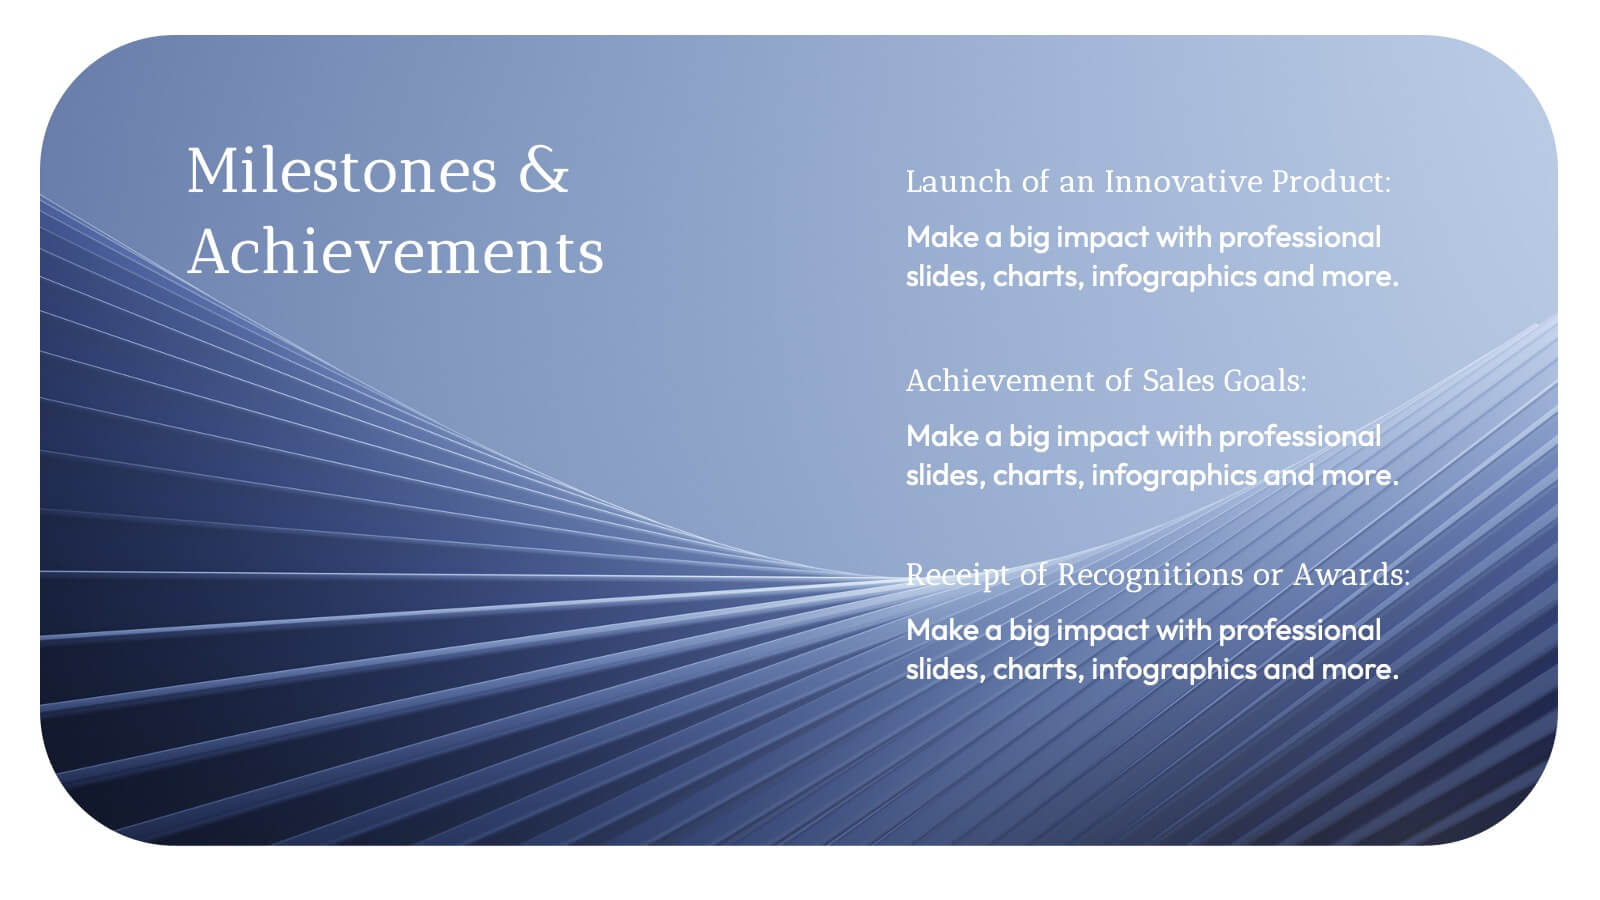
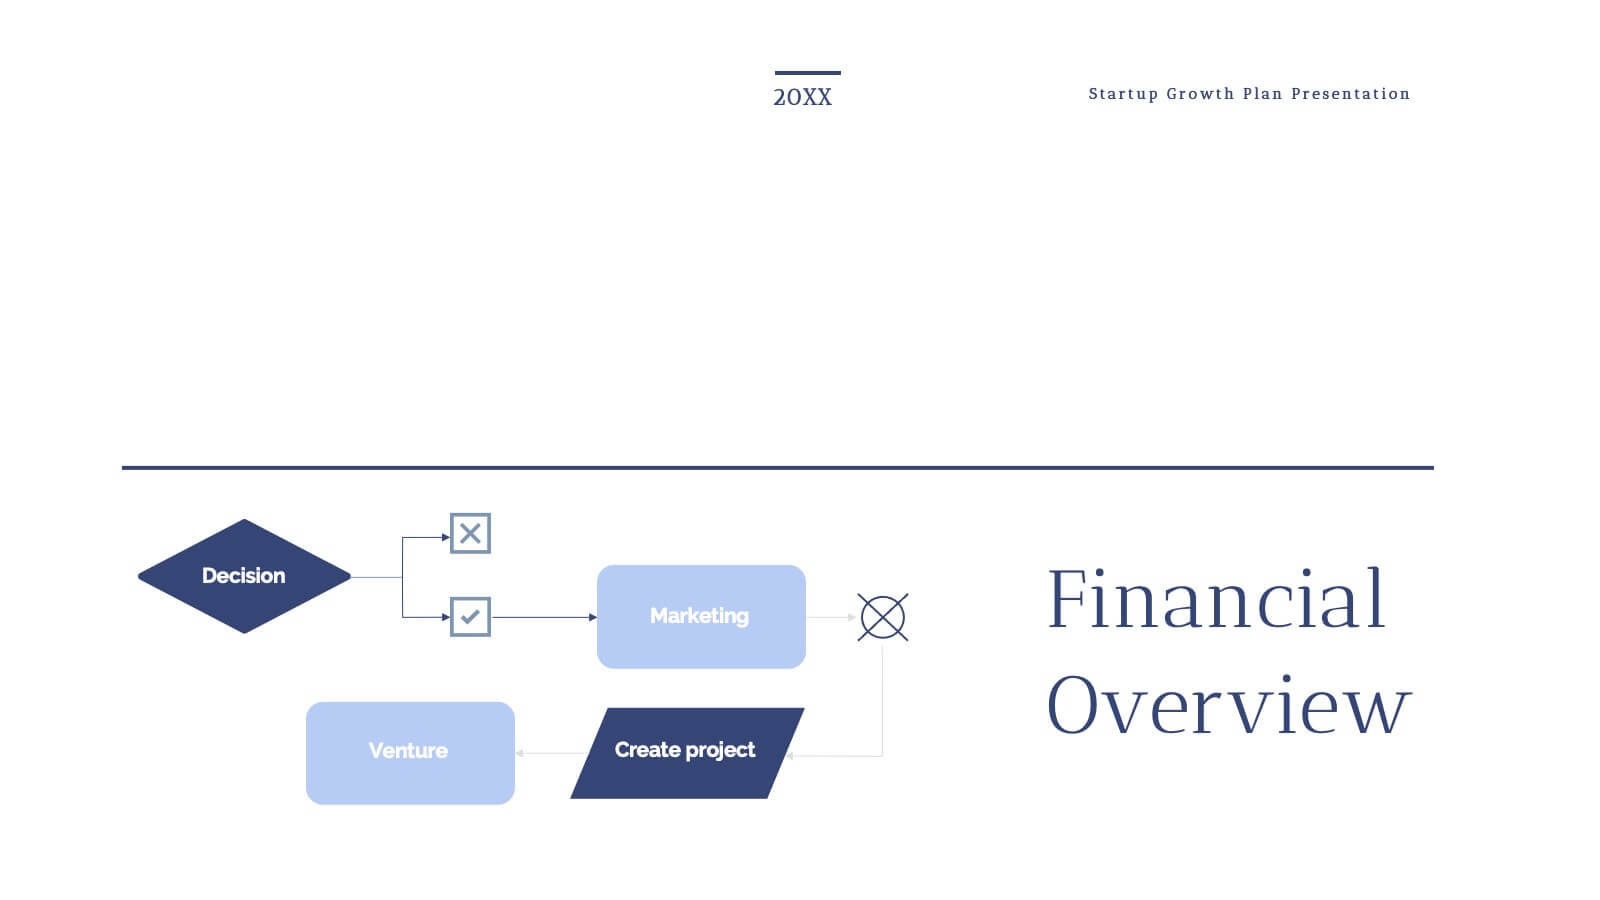
Grecian Startup Growth Plan Presentation
Elevate your pitch with this stunning Grecian-inspired presentation template, perfect for outlining your startup's growth plan! Showcase your business strategy, revenue projections, and scaling opportunities with a clean, elegant design that grabs attention. Impress investors and stakeholders with every slide. Compatible with PowerPoint, Keynote, and Google Slides for seamless customization.


23 diapositivas
Lexicon Startup Pitch Deck Template Presentation
The Startup Pitch Deck Presentation Template provides a modern and professional design with 23 fully customizable slides, ideal for startups seeking funding or presenting their business idea. Key sections include company overview, problem statement, solution, market opportunity, business model, and unique selling proposition (USP). It also covers competitive landscape, product features, financials, milestones, and funding requirements, ensuring a comprehensive pitch. The vibrant orange and gray color scheme adds energy and creativity to the presentation. Compatible with PowerPoint, Keynote, and Google Slides, this template is perfect for impactful startup pitches.


26 diapositivas
Haeleigh Presentation Template
The Haeleigh Powerpoint Template is a 26 modern slide template that is perfect for any presentation. With a clean classy aesthetic and easy to read text, this template is ideal for reading content and looking professional. The use of nude colors helps keep the look clean and easy to read. The theme comes packed with features to target your audience and help you get your message across. The charts, graphics, timelines included are easy to edit. This template is also perfect for businesses seeking to make an impression on their audience. Haeleigh is mobile friendly and easy to navigate.


5 diapositivas
CBD Oil Infographics
CBD oil, also known as cannabidiol oil, is a natural extract derived from the cannabis plant. These infographic templates can effectively present information about CBD oil in an engaging and informative manner, allowing your audience to grasp the potential benefits and practical considerations associated with its use. It is designed to educate and inform the audience about the uses, benefits, and considerations related to CBD oil. The infographics are fully customizable with visually appealing vibrant colors, relevant icons, and eye-catching layouts to capture your audience's attention.


7 diapositivas
Performance Summary Infographic
Boost your reporting capabilities with our Infographic Templates, designed to deliver exceptional clarity and impact. This series is perfectly suited for professionals seeking to present performance data compellingly and concisely. With a variety of designs including radial graphs, tiered lists, and comparative bars, these templates allow for an informative and aesthetically pleasing showcase of critical metrics. Each template is customizable, letting you adjust the color schemes and text to fit your corporate style, enhancing both visual appeal and brand consistency. Whether used in PowerPoint, Google Slides, or Keynote, these tools are vital for anyone looking to articulate achievements, assess comparative results, and plan based on solid data insights. They are indispensable for consultants, managers, and team leaders who require clear, persuasive presentation resources to drive decisions and highlight successes.


21 diapositivas
Echochime Project Timeline Presentation
Outline your project’s milestones and deliverables with this comprehensive timeline-focused presentation template. Ideal for project managers and teams, this layout streamlines the process of showcasing objectives, schedules, and key milestones with clarity and precision. The template includes dedicated slides for problem statements, resource allocation, budget planning, stakeholder communication, risk management, and quality assurance. Its visually engaging timeline design ensures a clear and professional overview of your project's progress. Designed for seamless customization, this template is fully compatible with PowerPoint, Google Slides, and Keynote, allowing you to tailor colors, fonts, and layouts to align with your project branding. Present your strategy and progress with confidence, ensuring stakeholders and team members stay informed and aligned.


6 diapositivas
1-Page Executive Summary Slide Presentation
Bring clarity to complex updates in a single, colorful layout designed to keep your audience engaged from start to finish. This clean and modern slide breaks down key messages into six distinct points, making it easy to showcase progress, milestones, or strategies. Fully compatible with PowerPoint, Keynote, and Google Slides.


7 diapositivas
Demographic Traits Infographic
Dive deep into the world of demographics with our demographic traits infographic. Painted in hues of white, yellow, and blue, this infographic expertly visualizes population data within a map layout, ensuring a cohesive understanding of varied traits across regions. Tailored for market researchers, sociologists, business analysts, and educators, this tool is designed to make complex demographic data comprehensible and engaging. Whether you're using PowerPoint, Keynote, or Google Slides, our infographic will seamlessly fit, elevating the quality and clarity of your presentation.


10 diapositivas
Checklist and Action Plan List Presentation
Stay organized and achieve goals efficiently with this checklist and action plan template. Designed for task tracking, project management, and strategic planning, it provides a clear visual structure for prioritizing tasks. Perfect for professionals and teams aiming for productivity. Compatible with PowerPoint, Keynote, and Google Slides for seamless editing and presentation.


6 diapositivas
Bubble Diagram for Idea Development Presentation
Visualize your creative process with this Bubble Diagram for Idea Development template. Ideal for brainstorming sessions, project planning, and innovation strategies, this slide uses color-coded lightbulbs and numbered bubbles to illustrate key ideas and their relationships. Perfect for entrepreneurs, teams, and educators, it simplifies complex concepts into a clear, engaging format. Fully editable and compatible with PowerPoint, Keynote, and Google Slides for seamless customization.


7 diapositivas
Cloud Services Infographic Presentation
A Cloud Infographic is a type of visual representation that uses graphic design elements and data to explain and illustrate the concept of cloud computing. This cloud infographic template uses diagrams, charts, and other graphical elements to showcase the benefits and features of cloud computing. This can be used for businesses, education, and individuals to understand and promote the concept of cloud computing. This Cloud template has been designed in a simple but effective style that allows you to focus on your content. This template is designed for powerpoint, keynote and google slides.


5 diapositivas
Regional Development in Oceania Map Presentation
The Regional Development in Oceania Map template provides a comprehensive visualization of growth and development metrics across various regions in Oceania. This template is designed to aid in presenting demographic data, economic indicators, or development status in a clear, easily understandable format. It's suitable for reports, presentations, and educational materials. Compatible with PowerPoint, Keynote, and Google Slides.


23 diapositivas
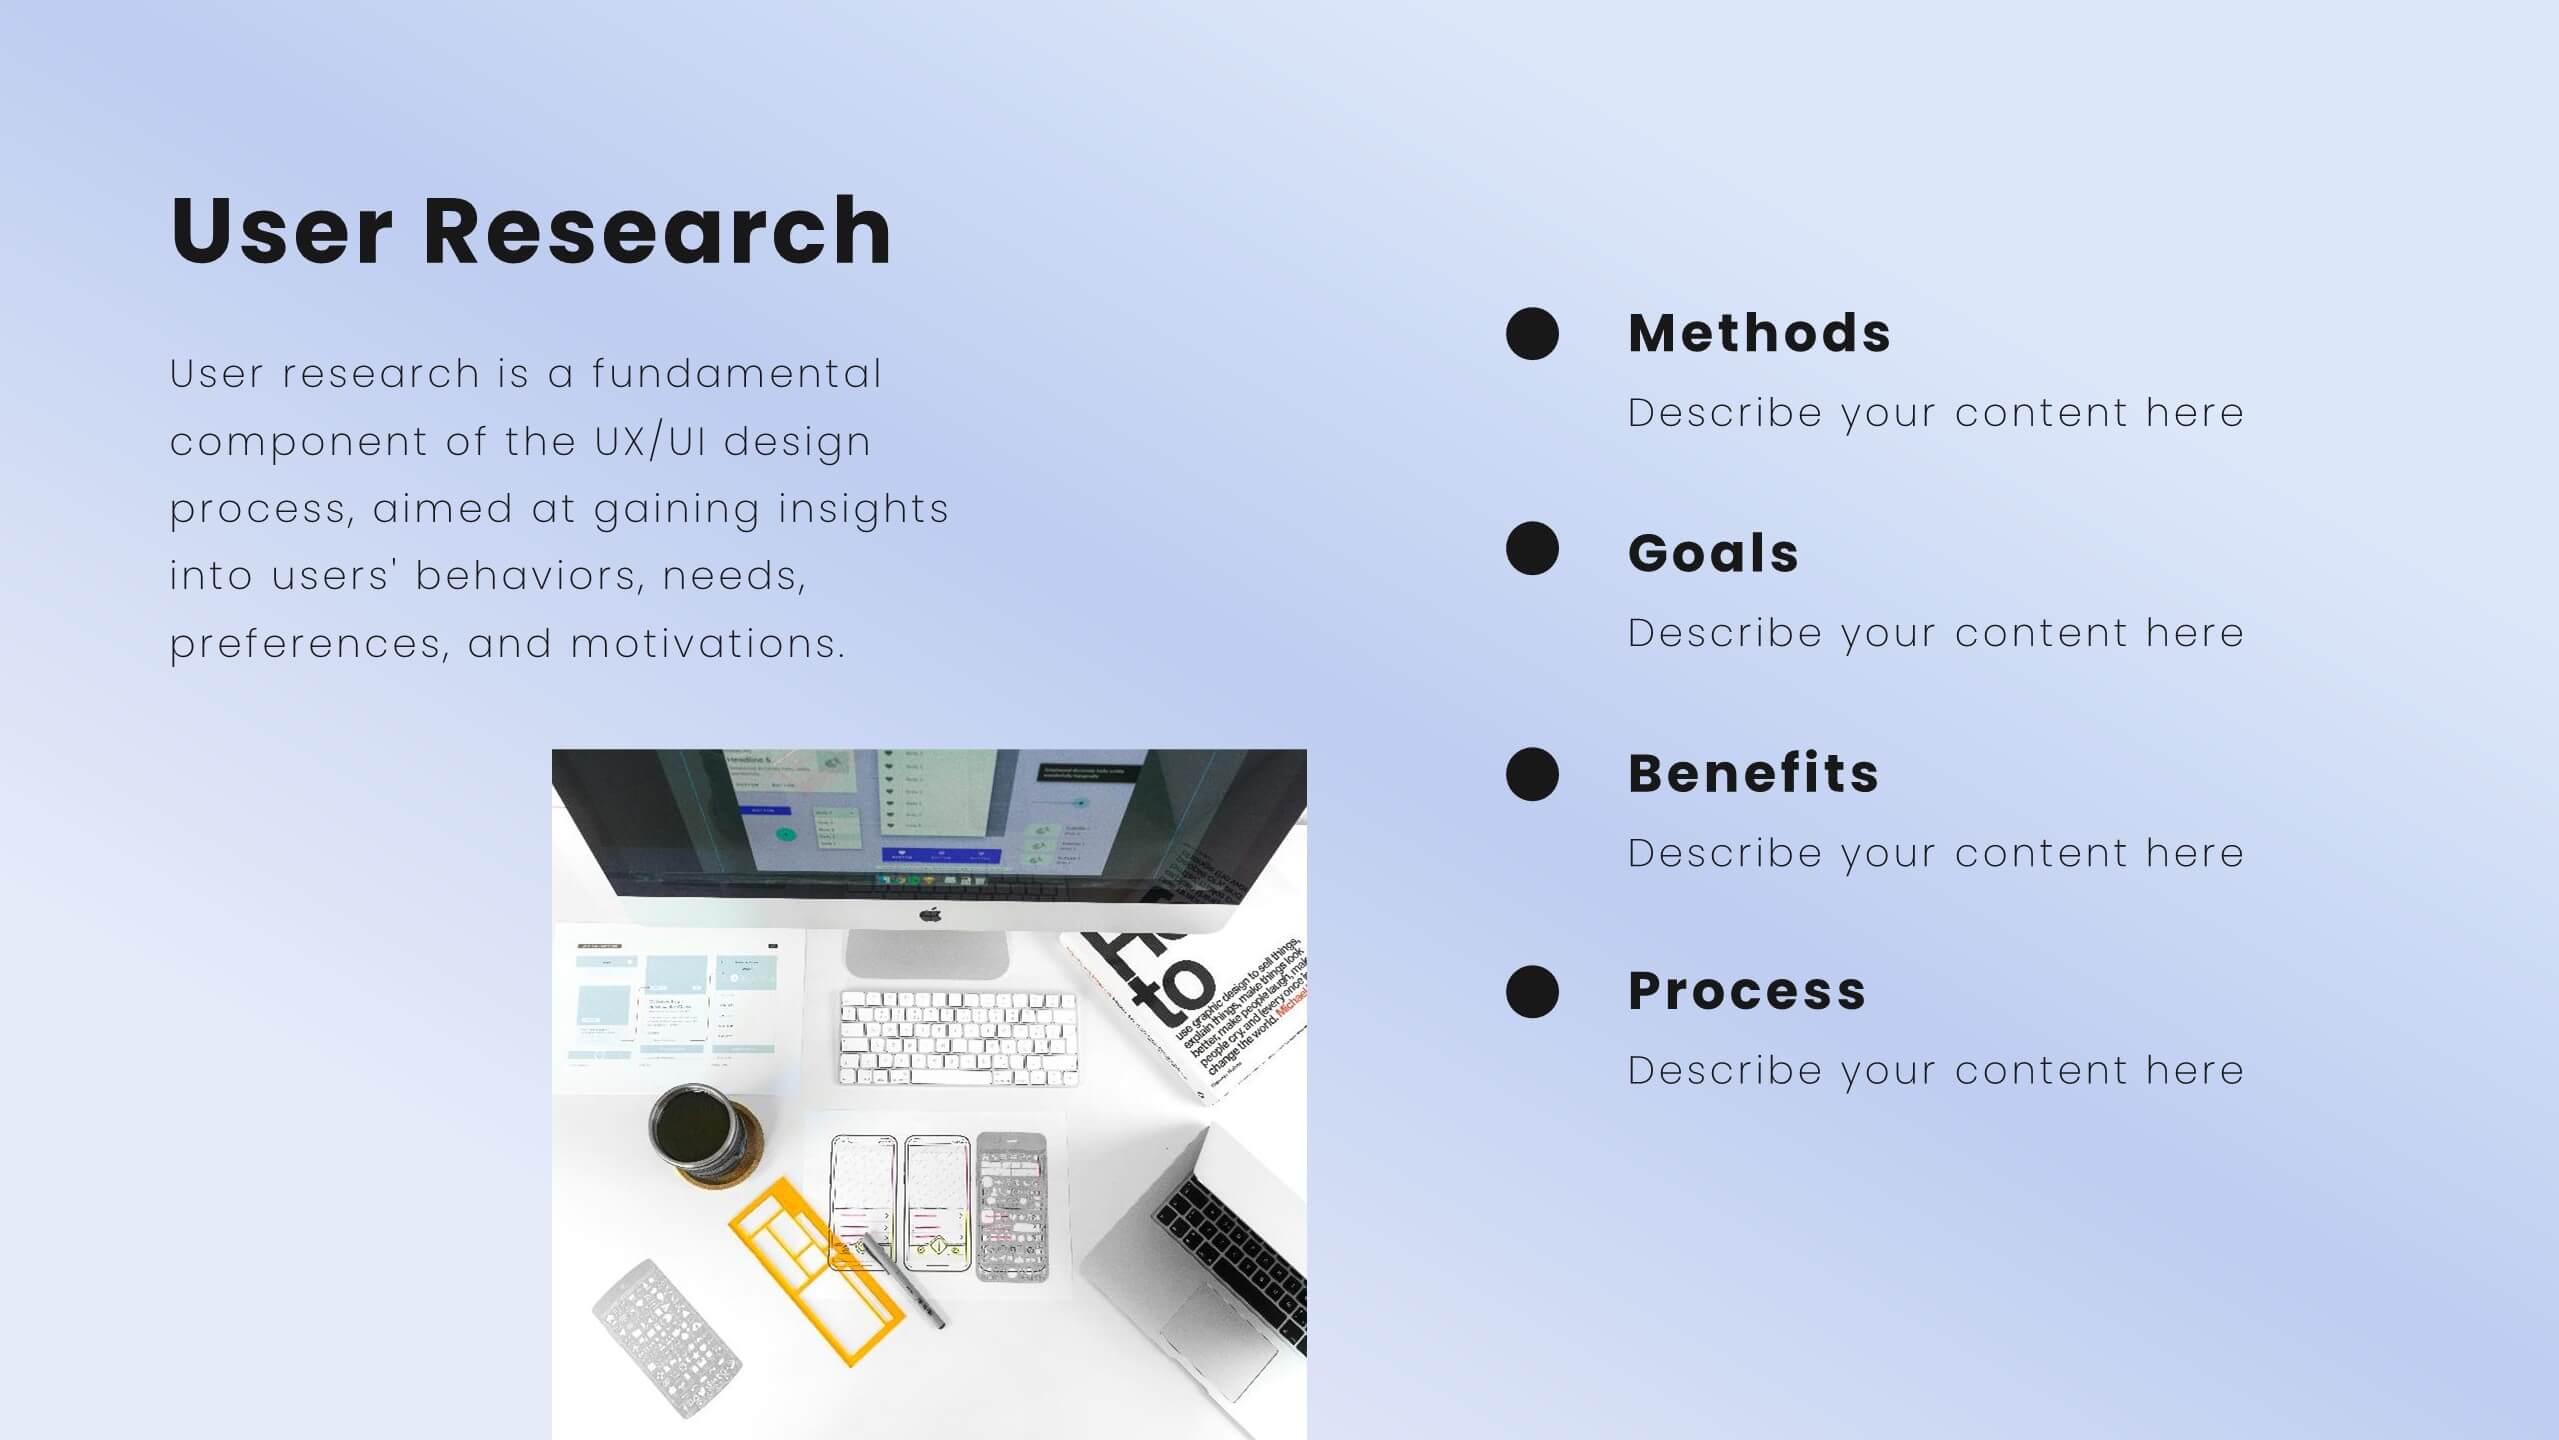
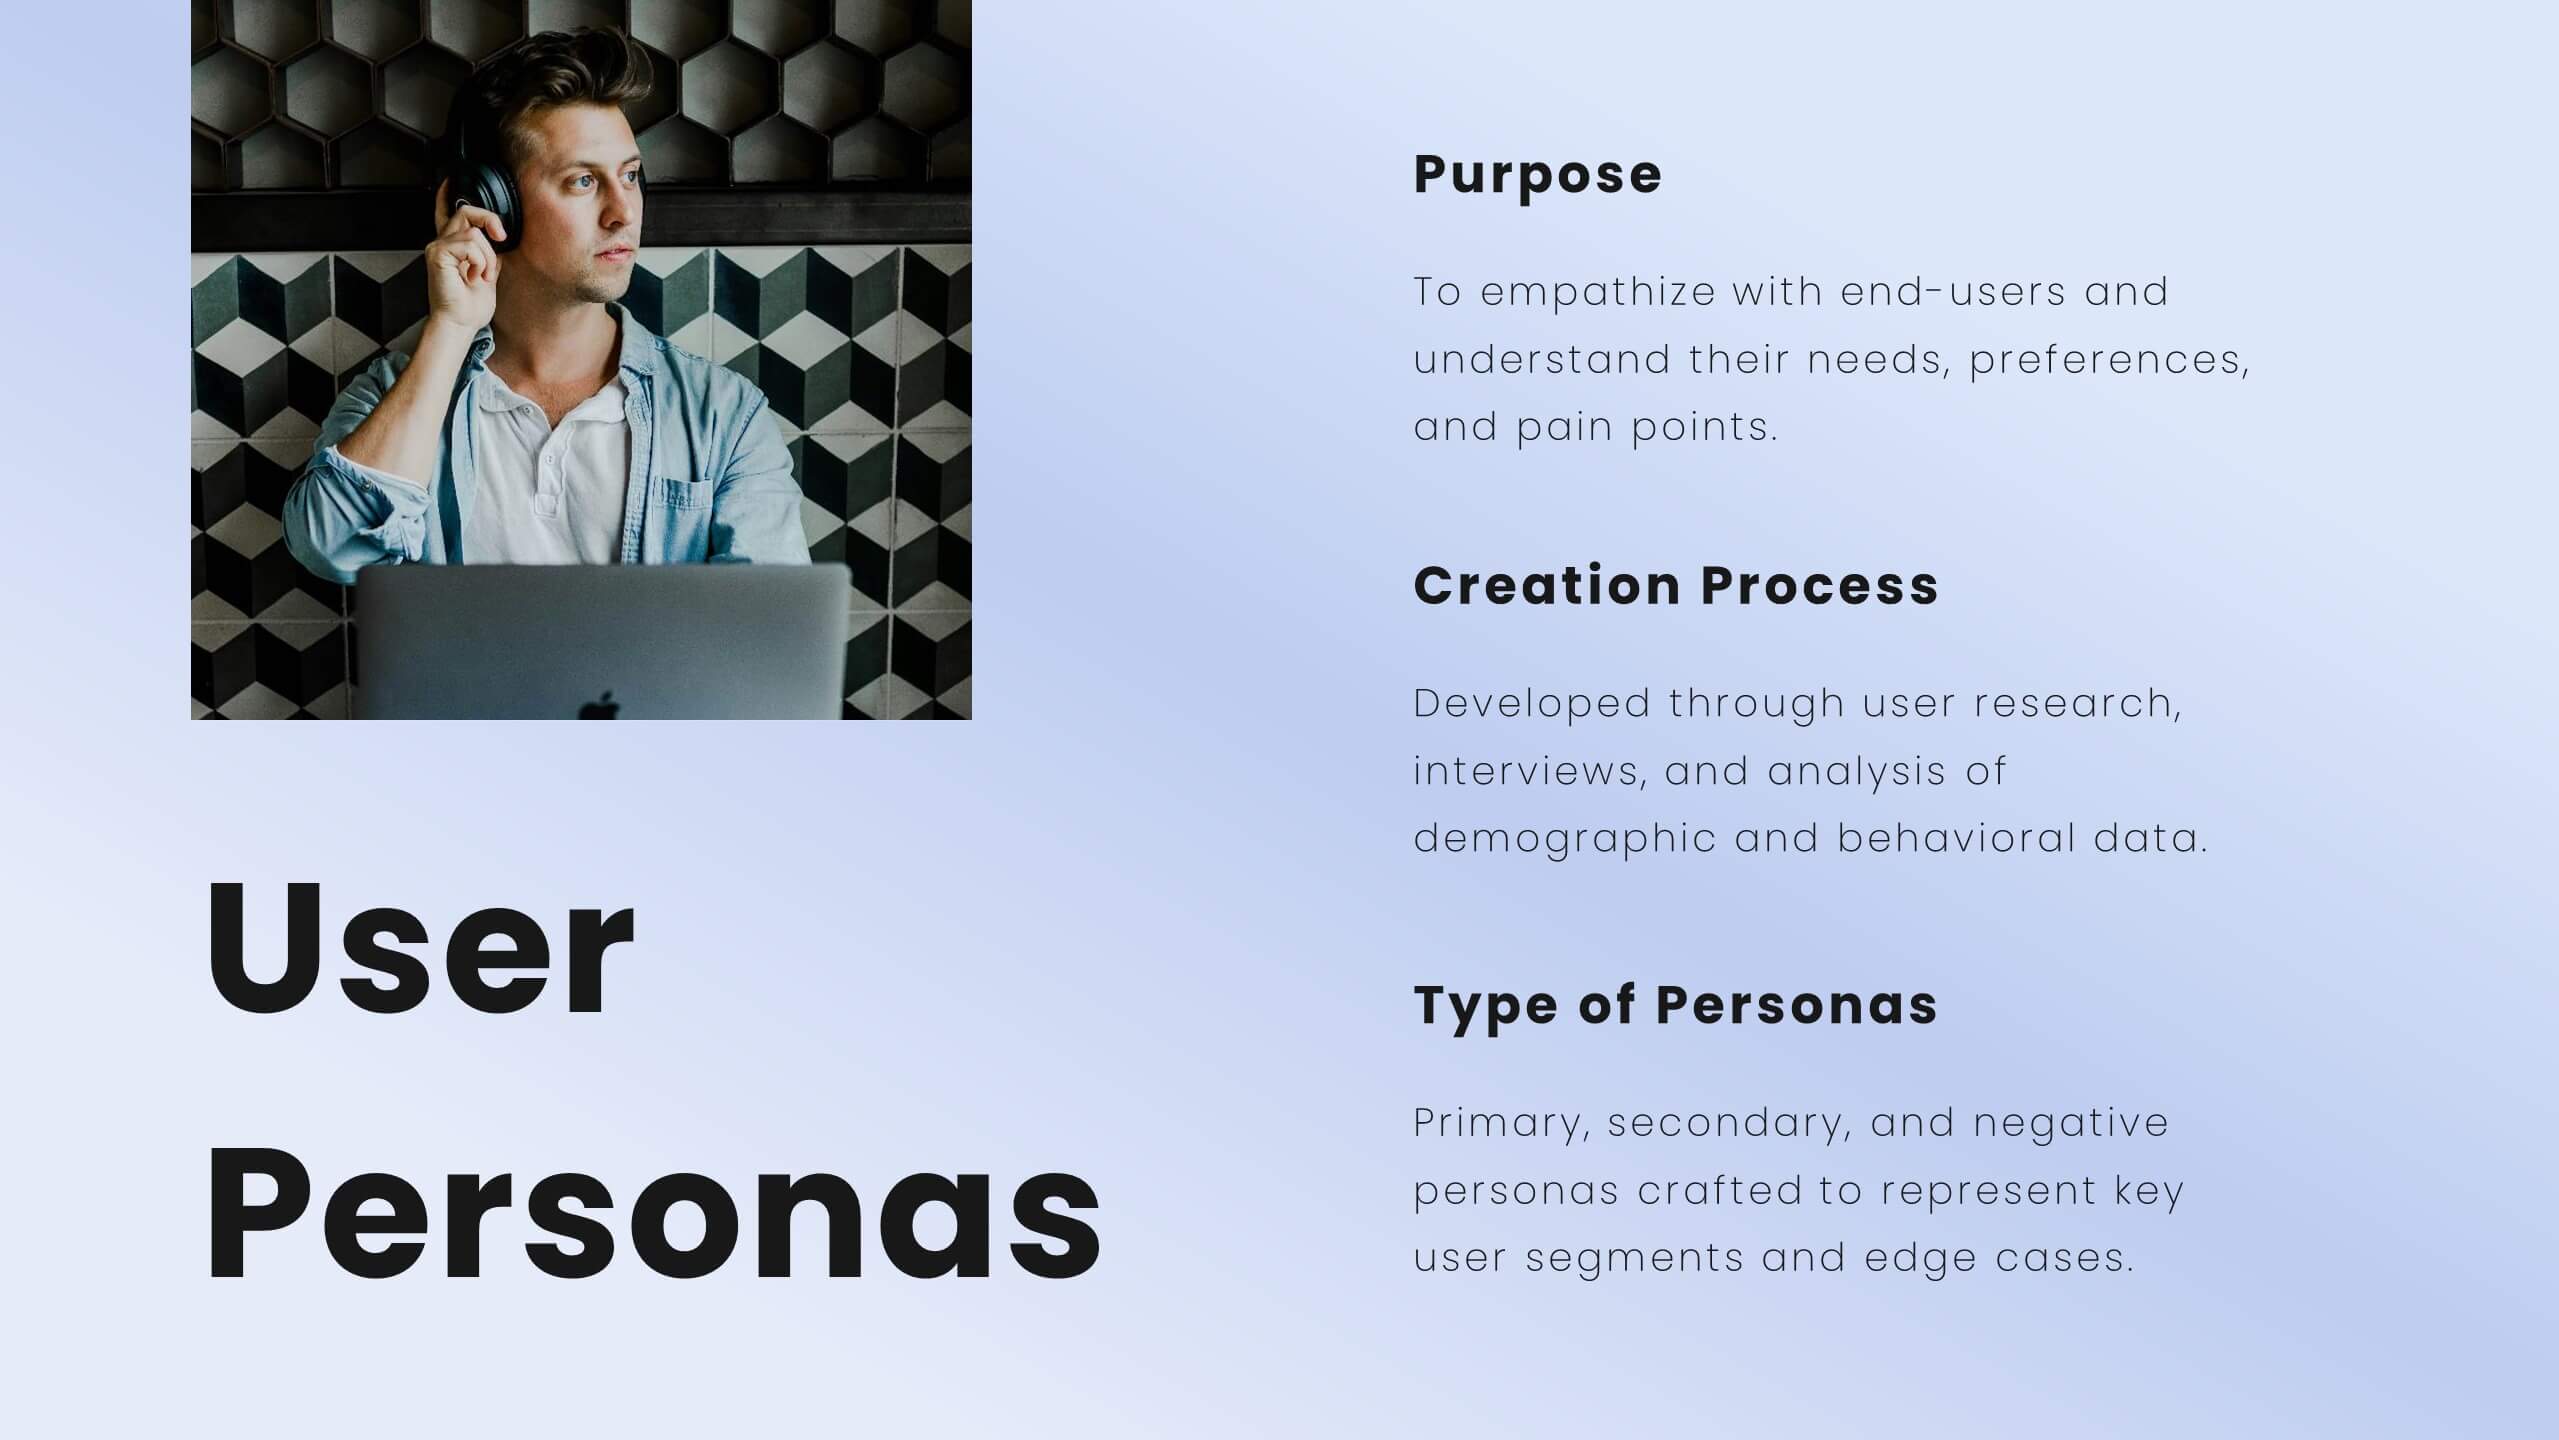
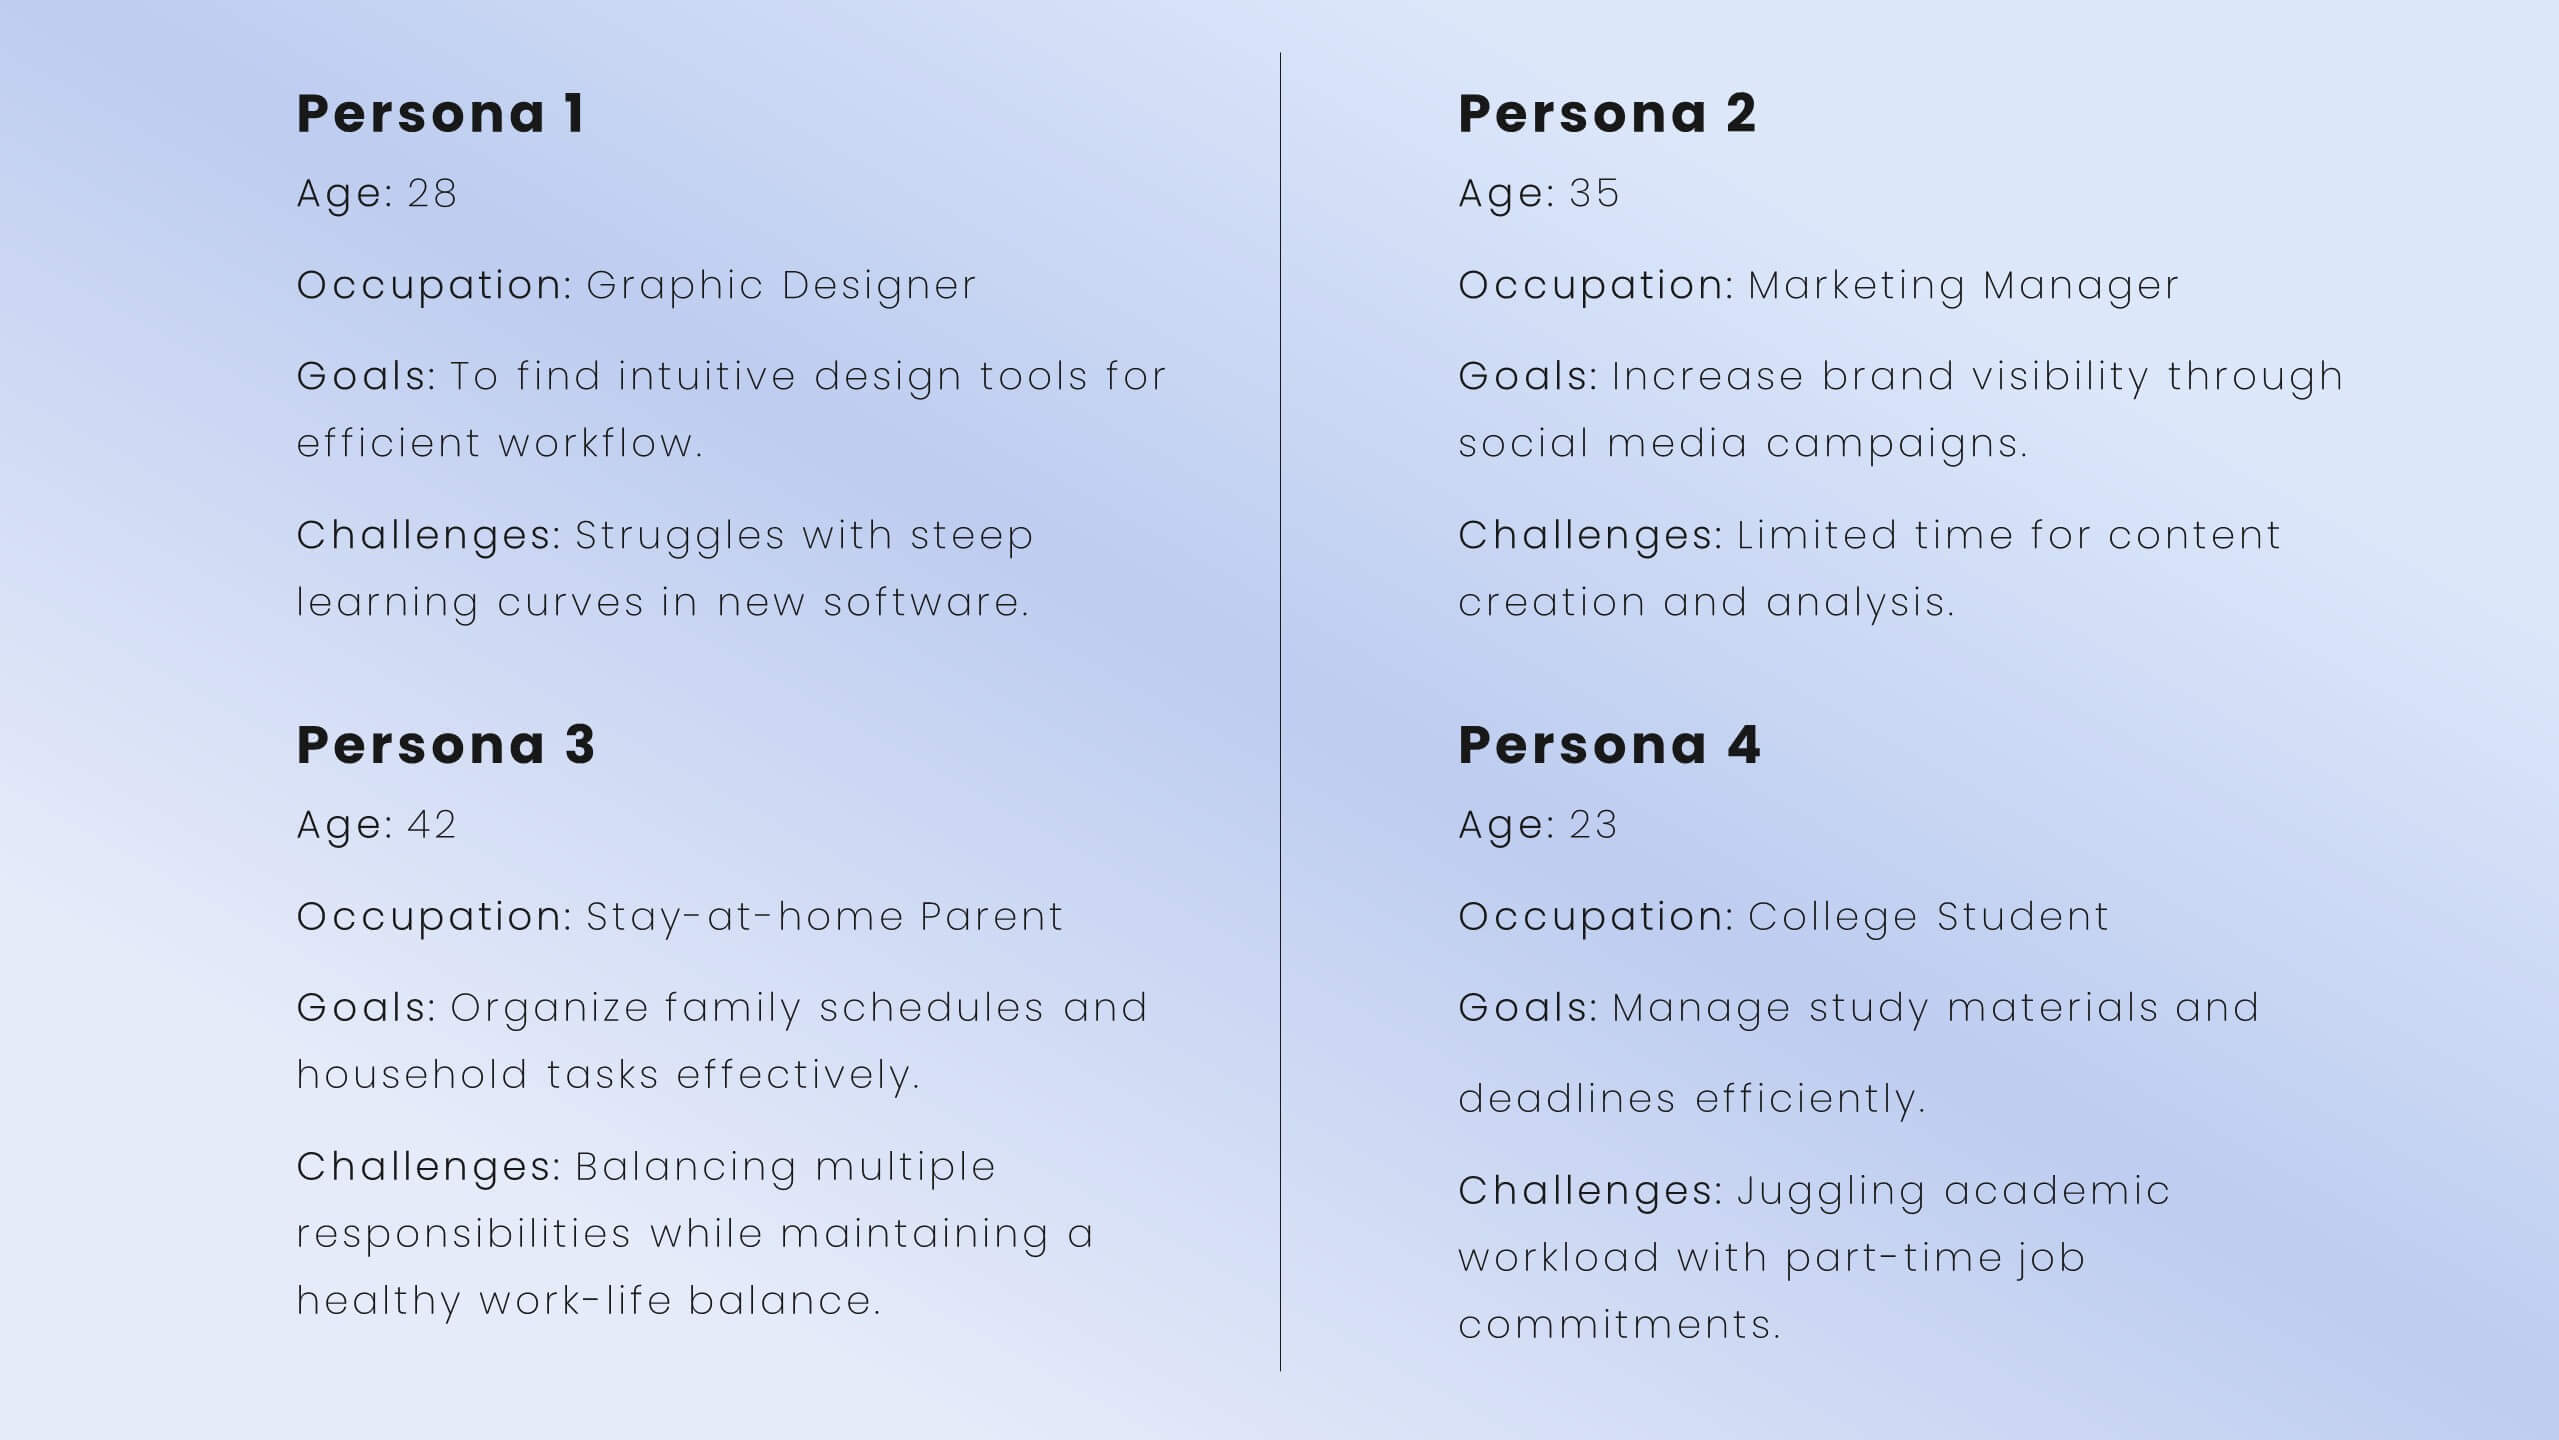
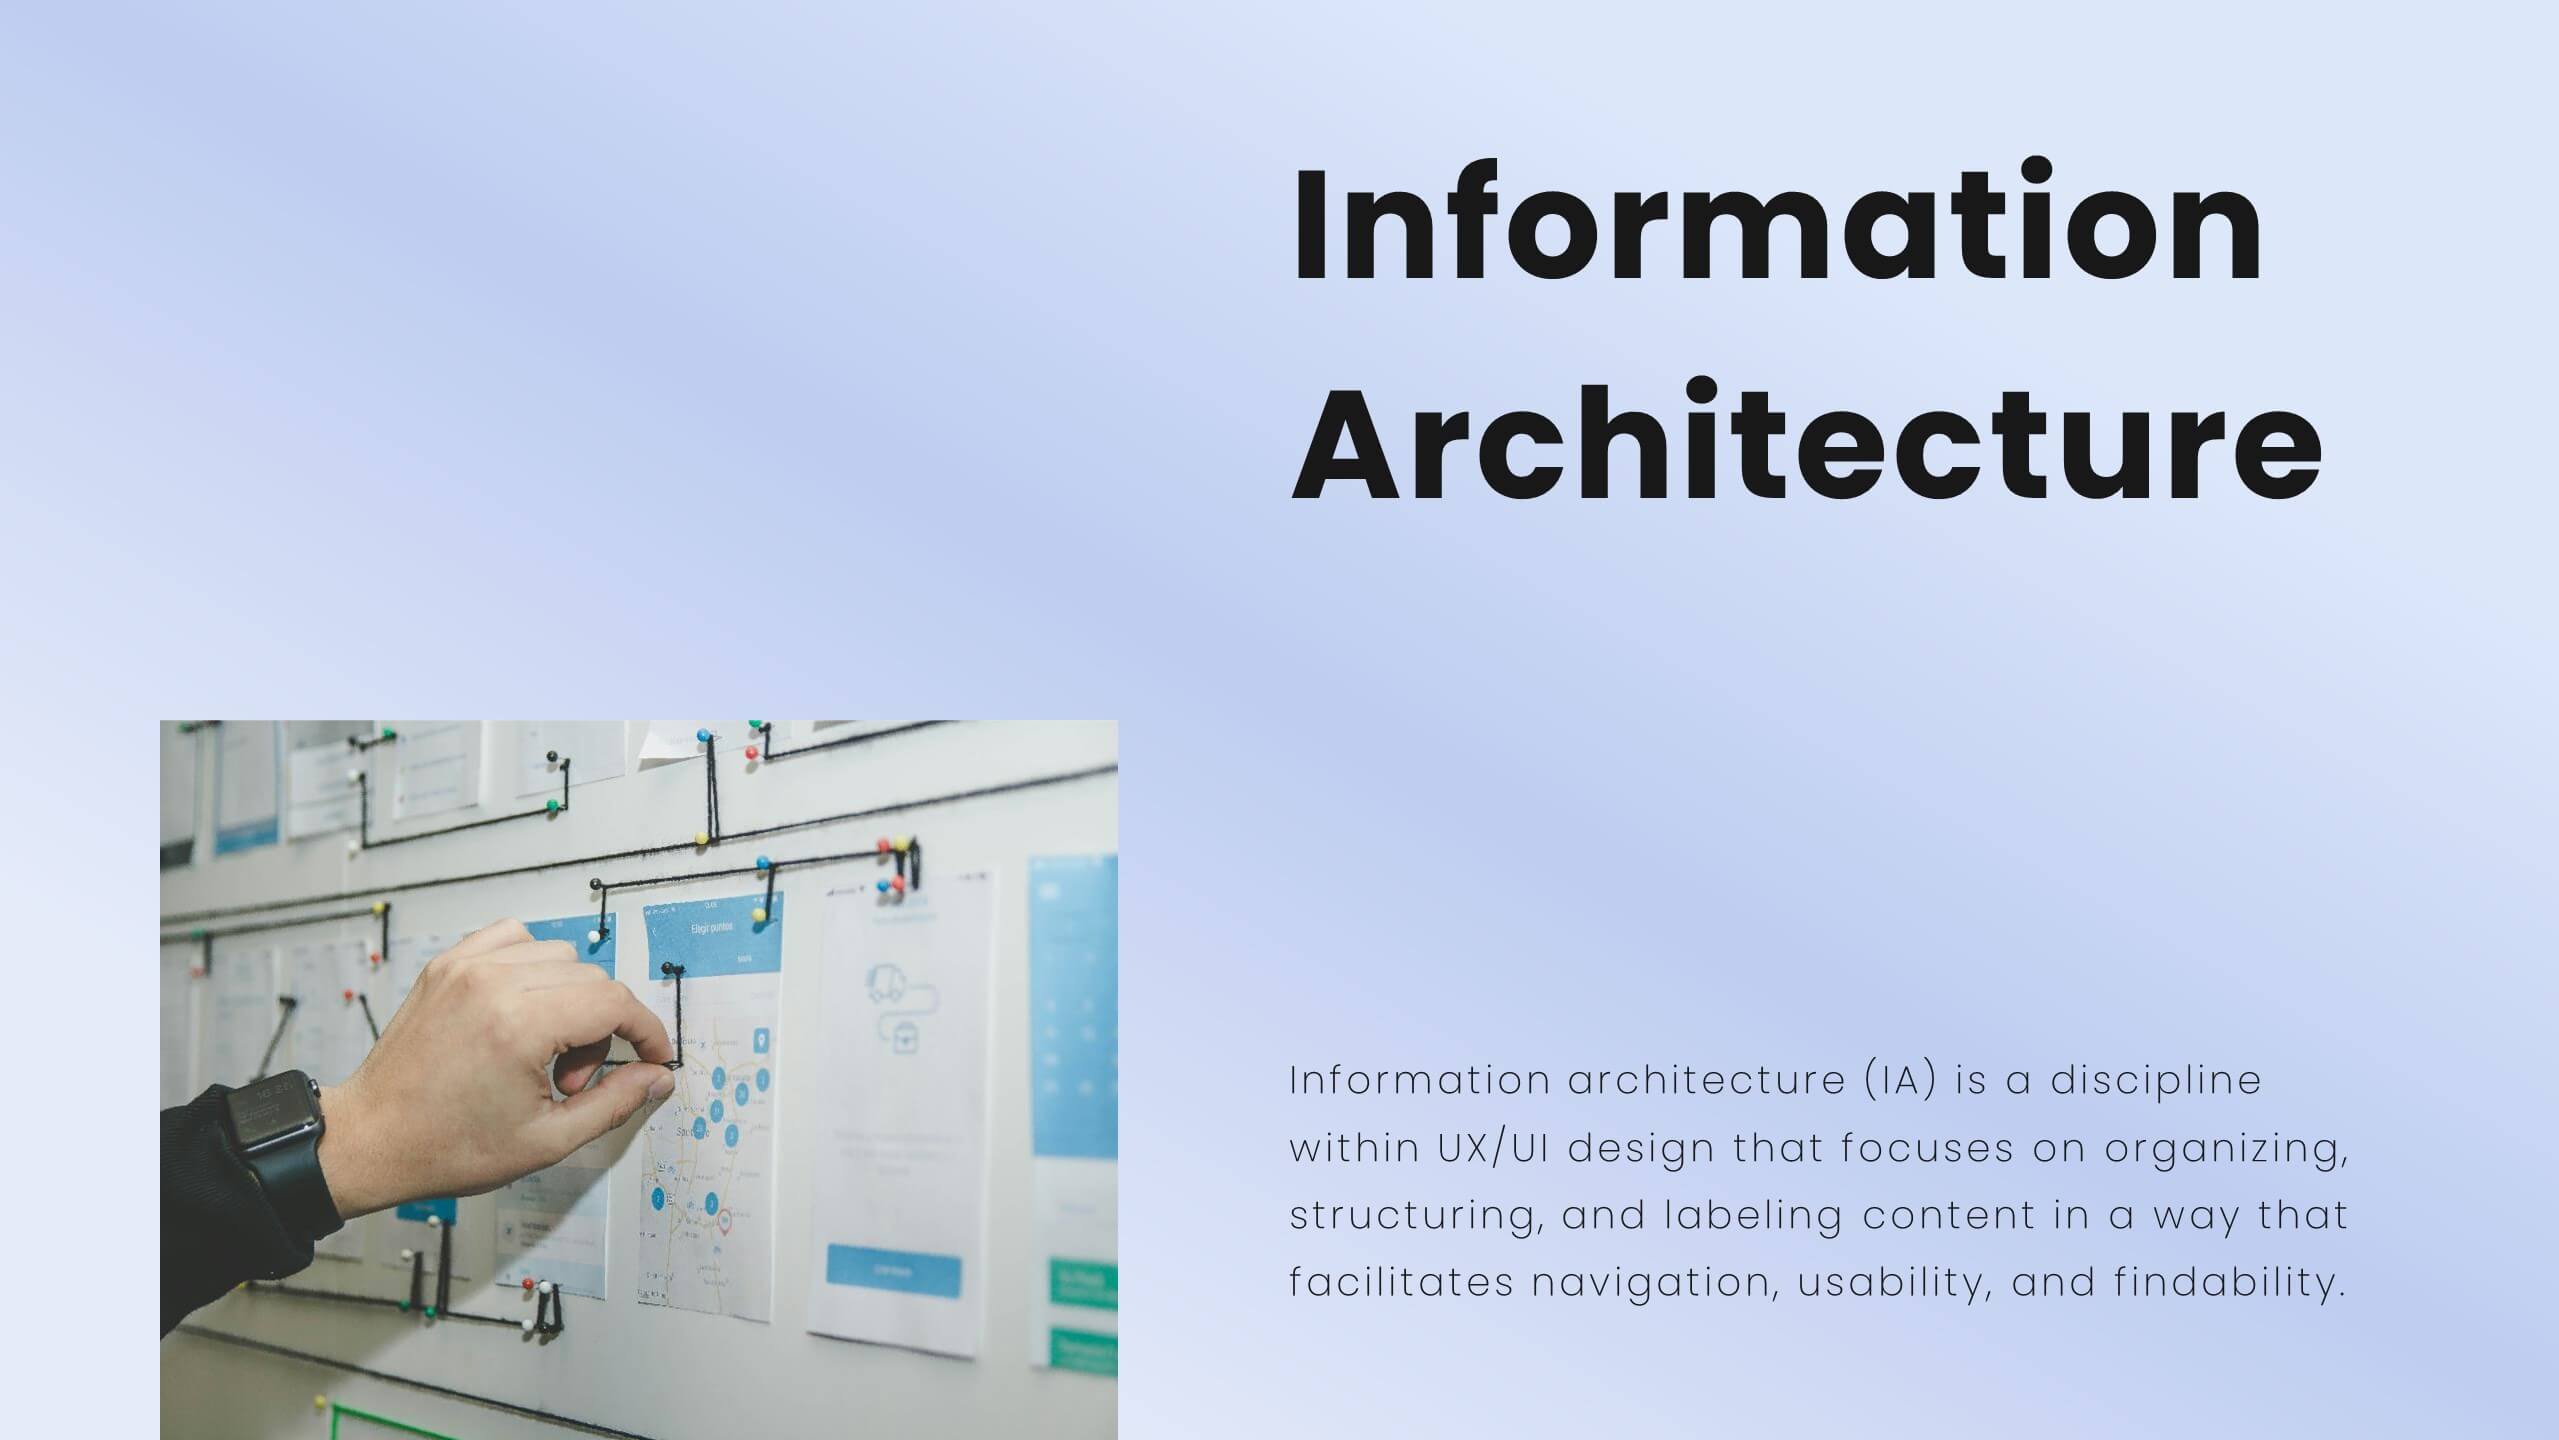
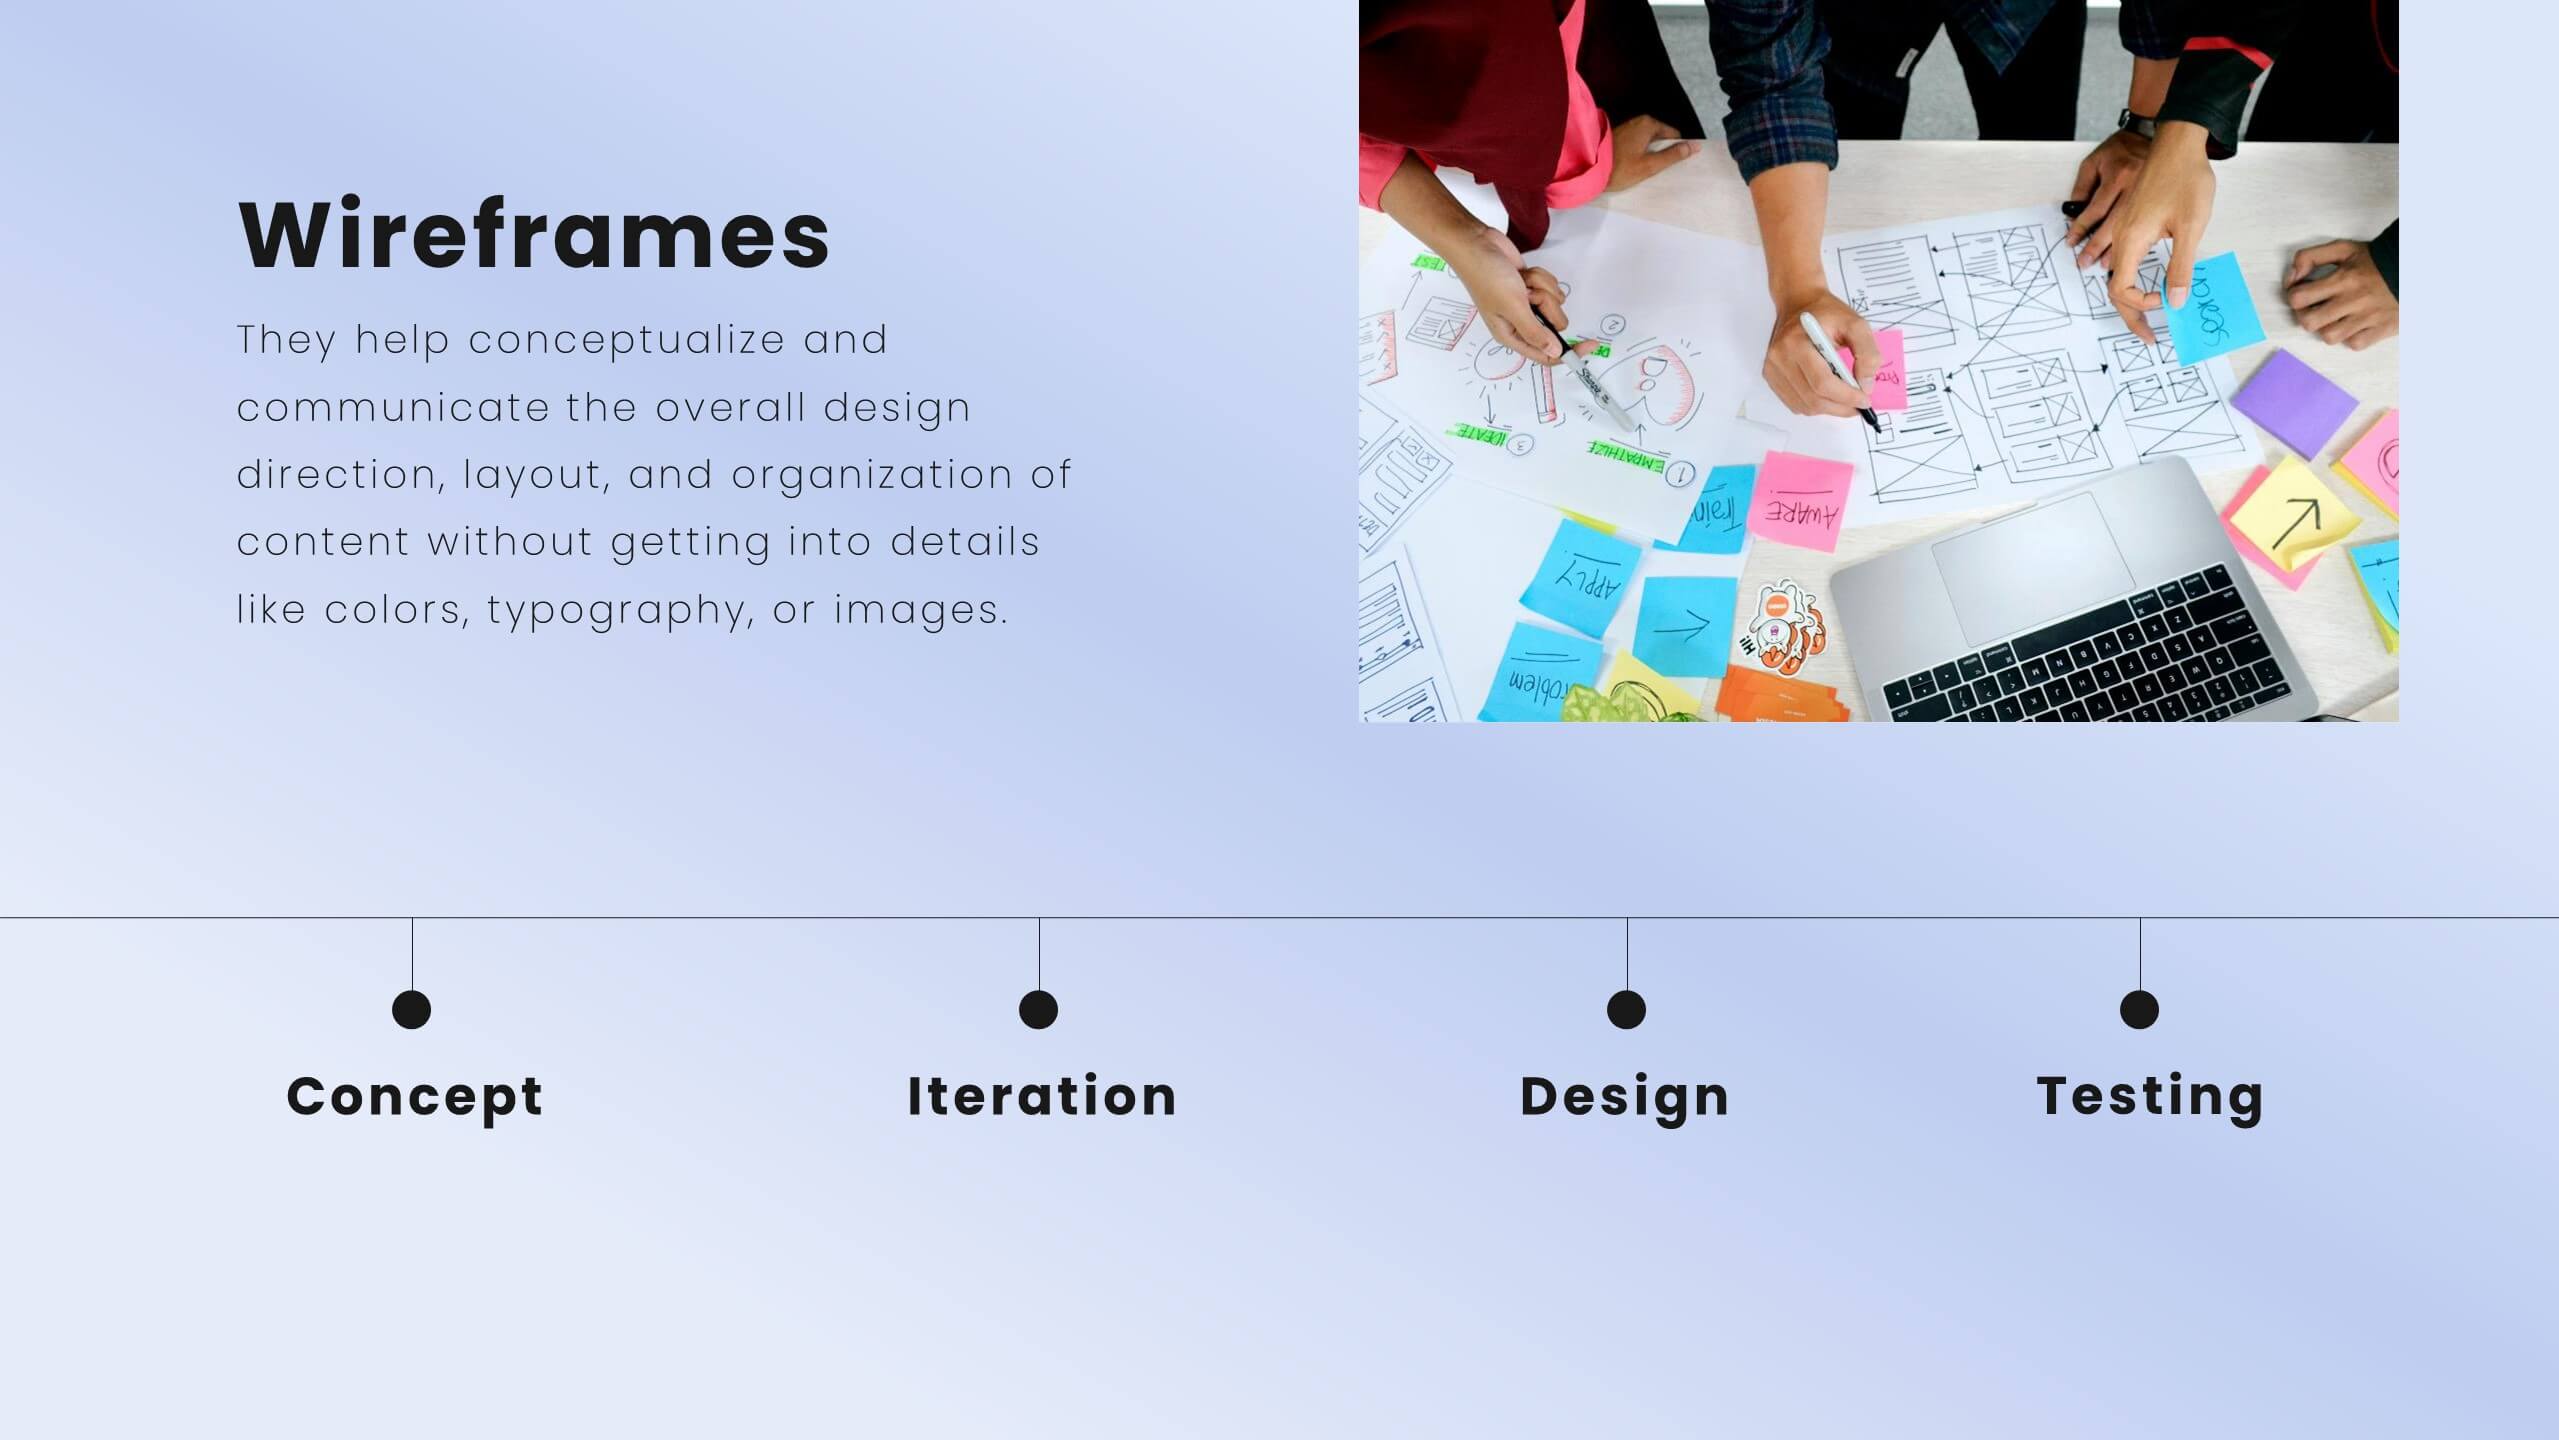
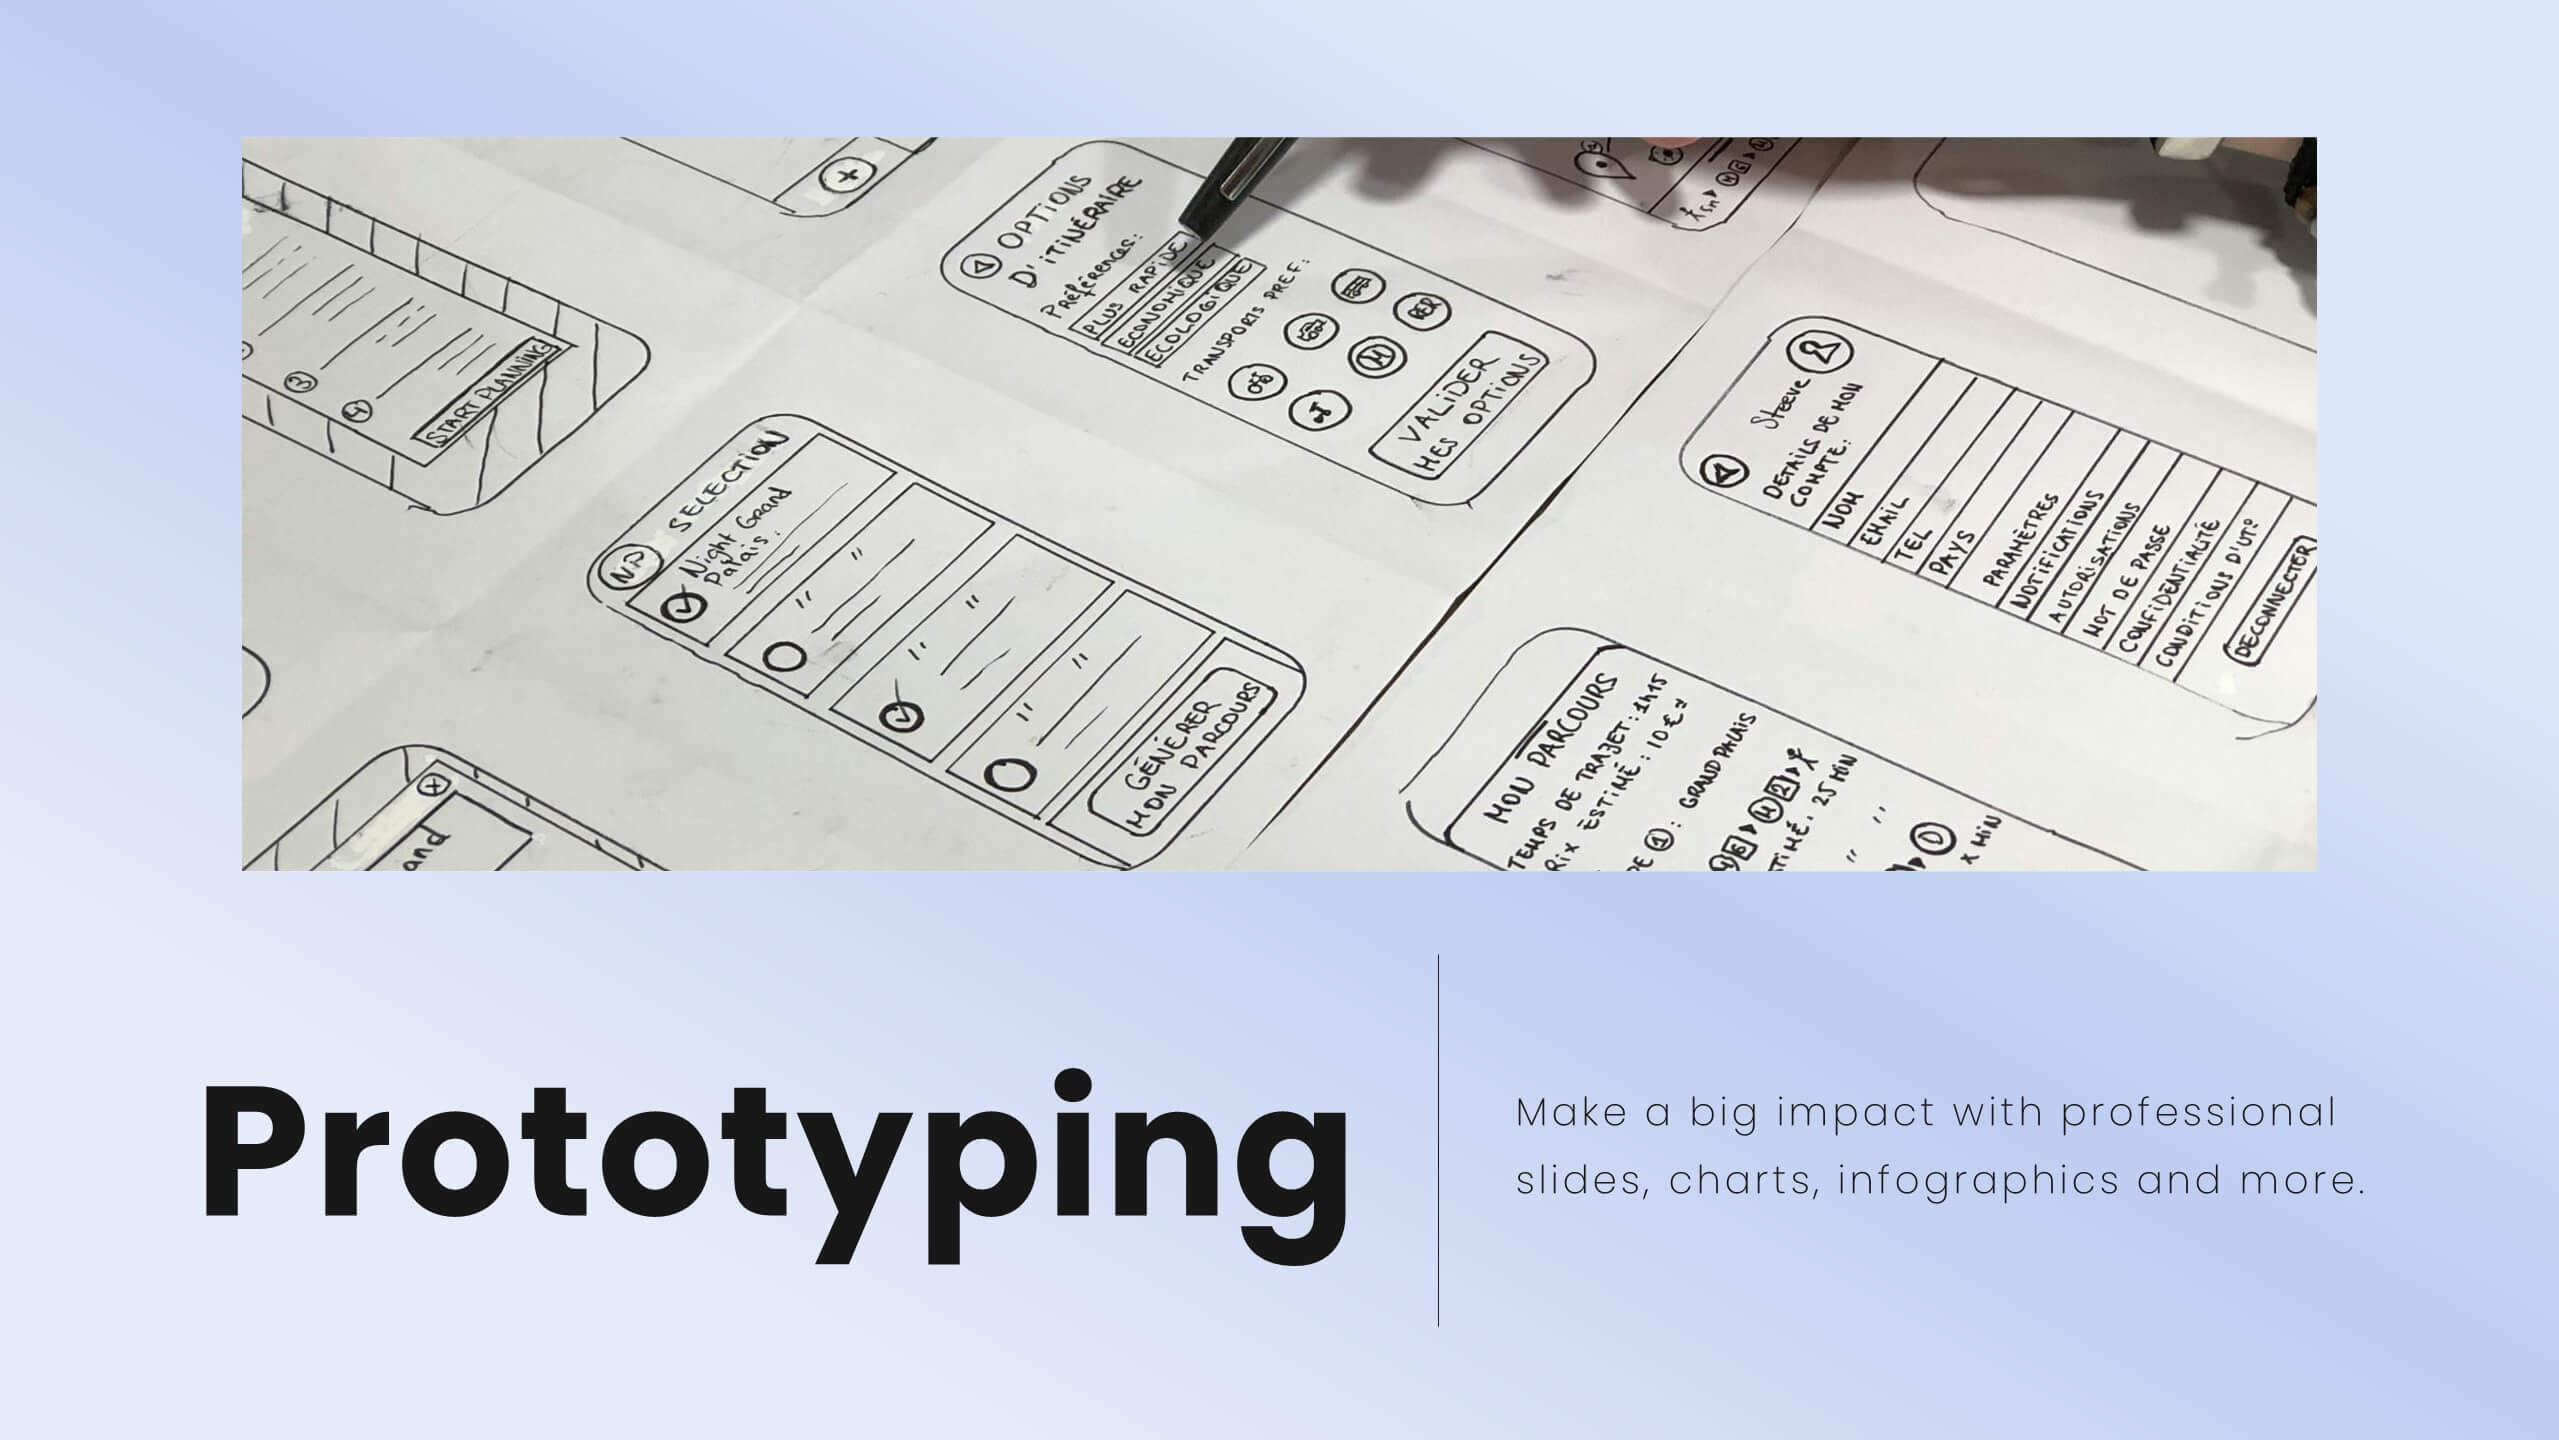
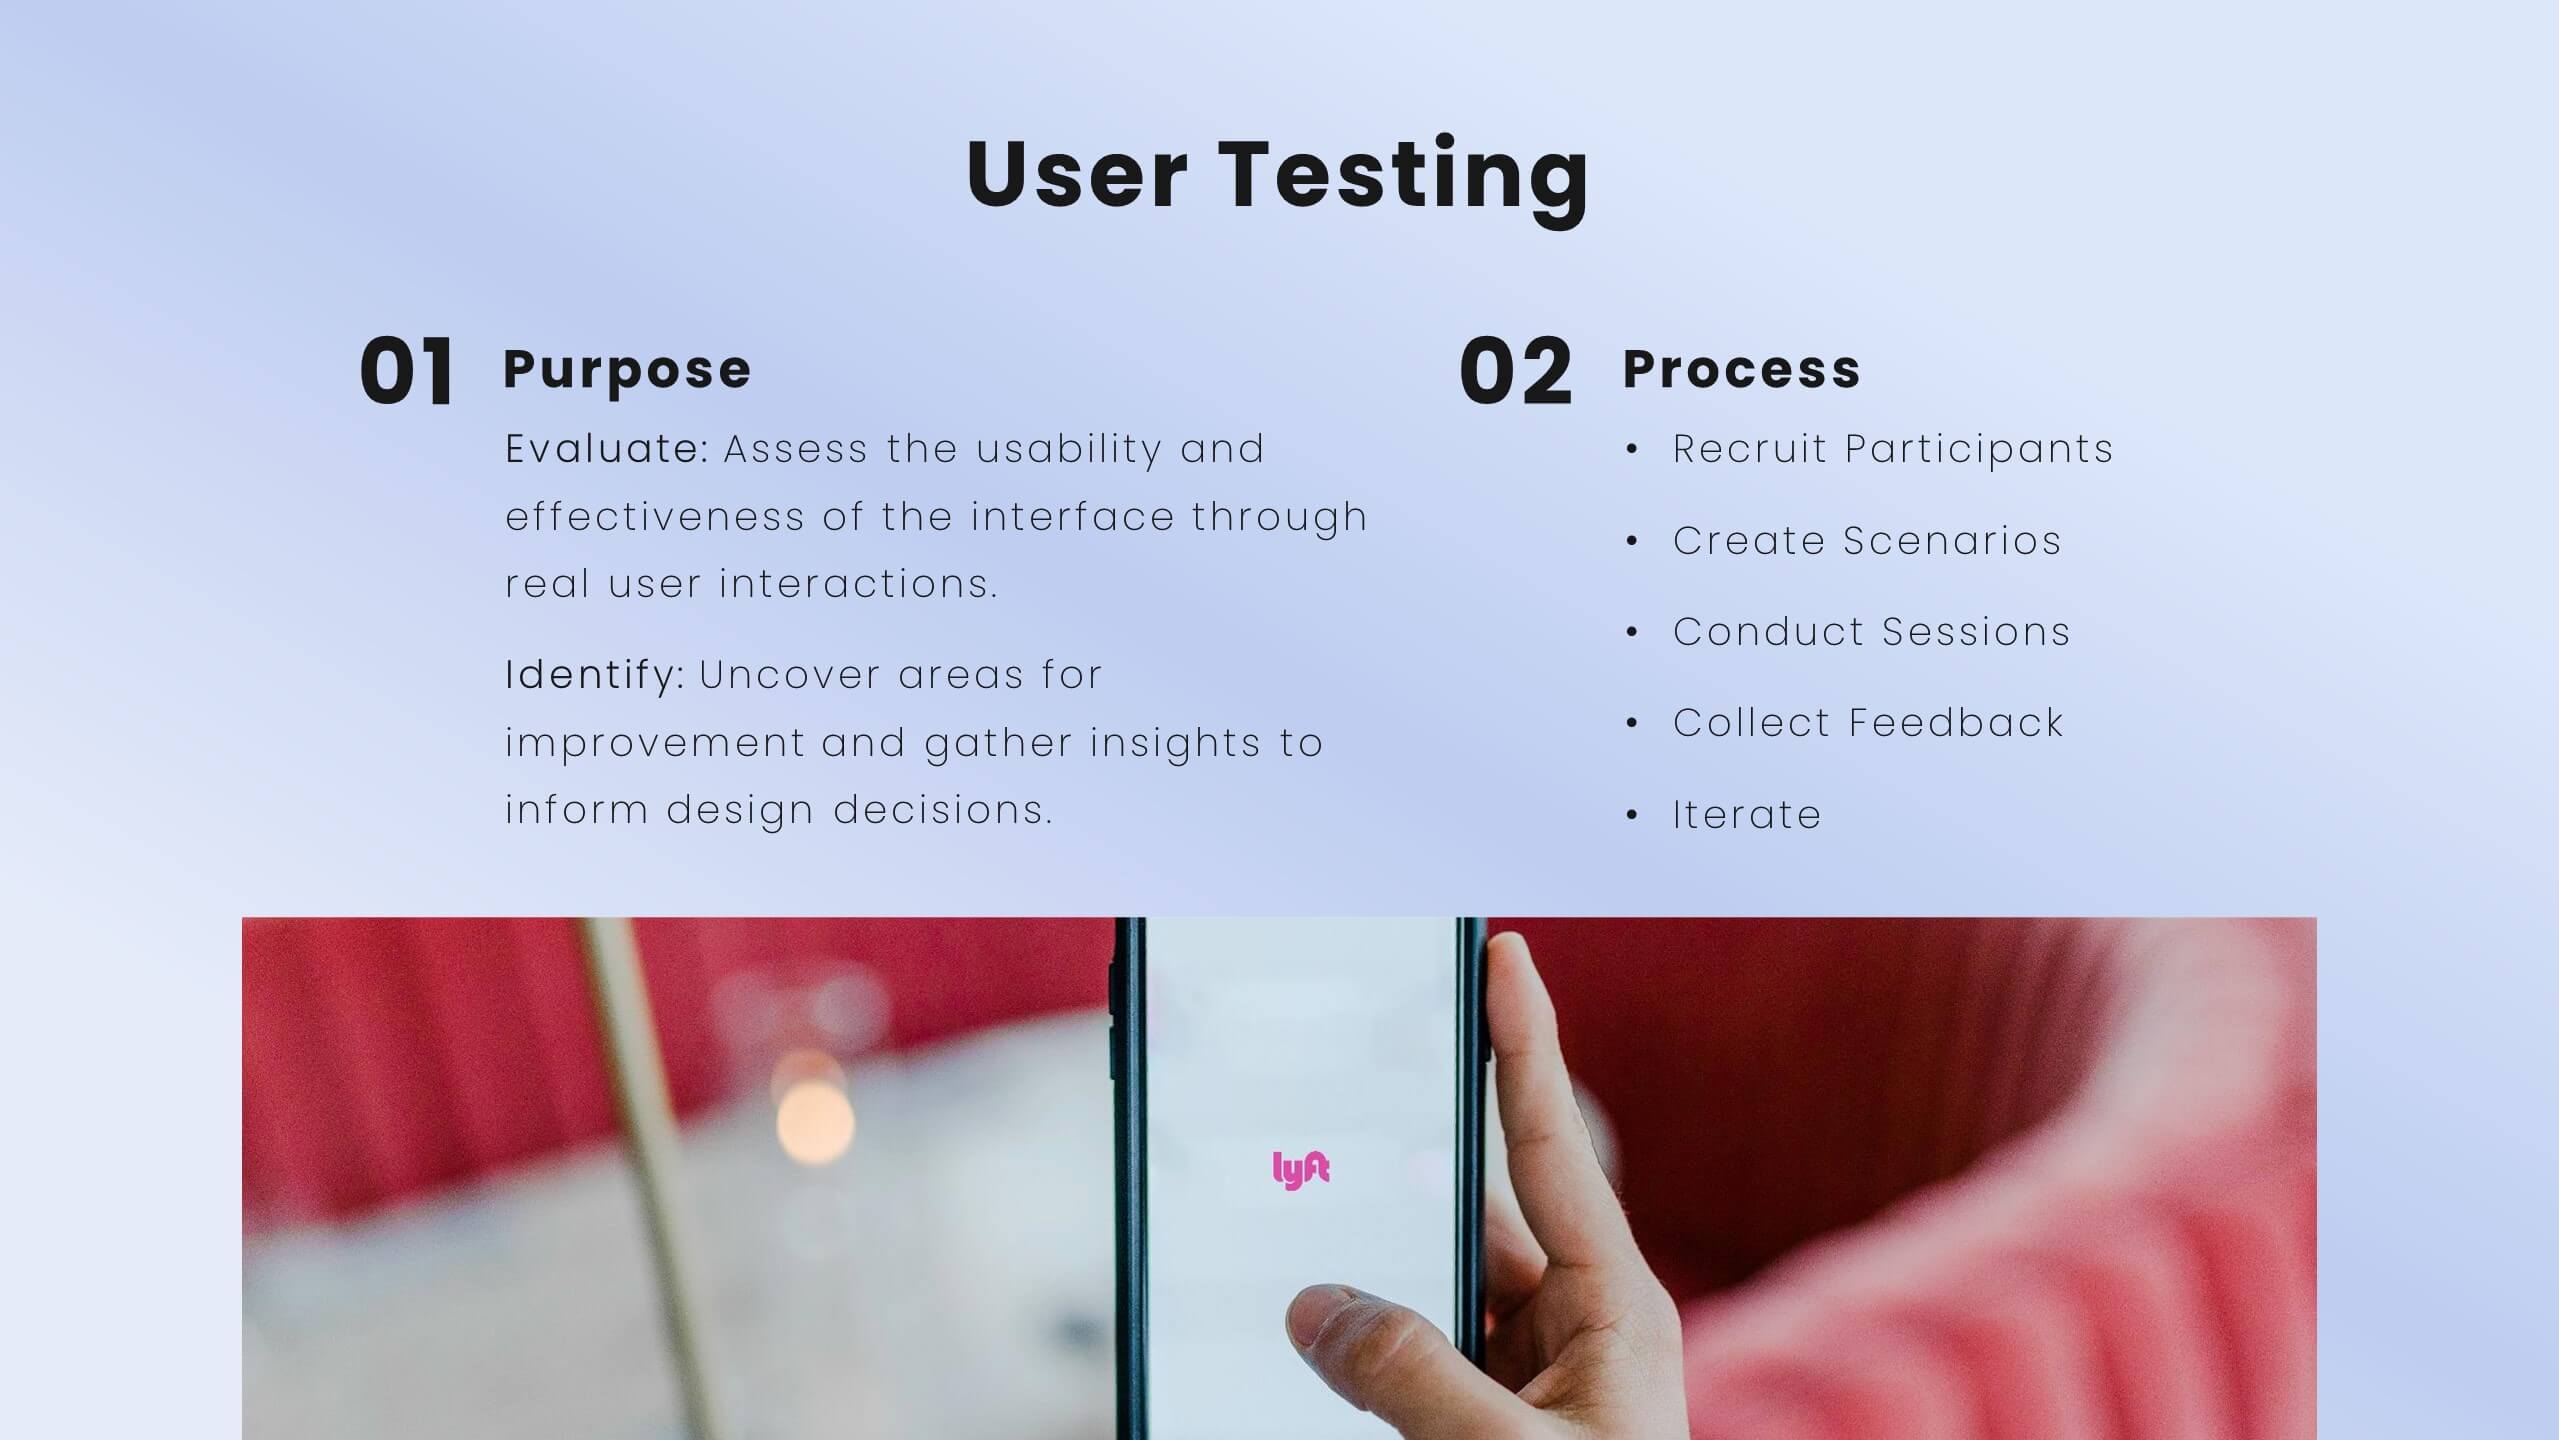
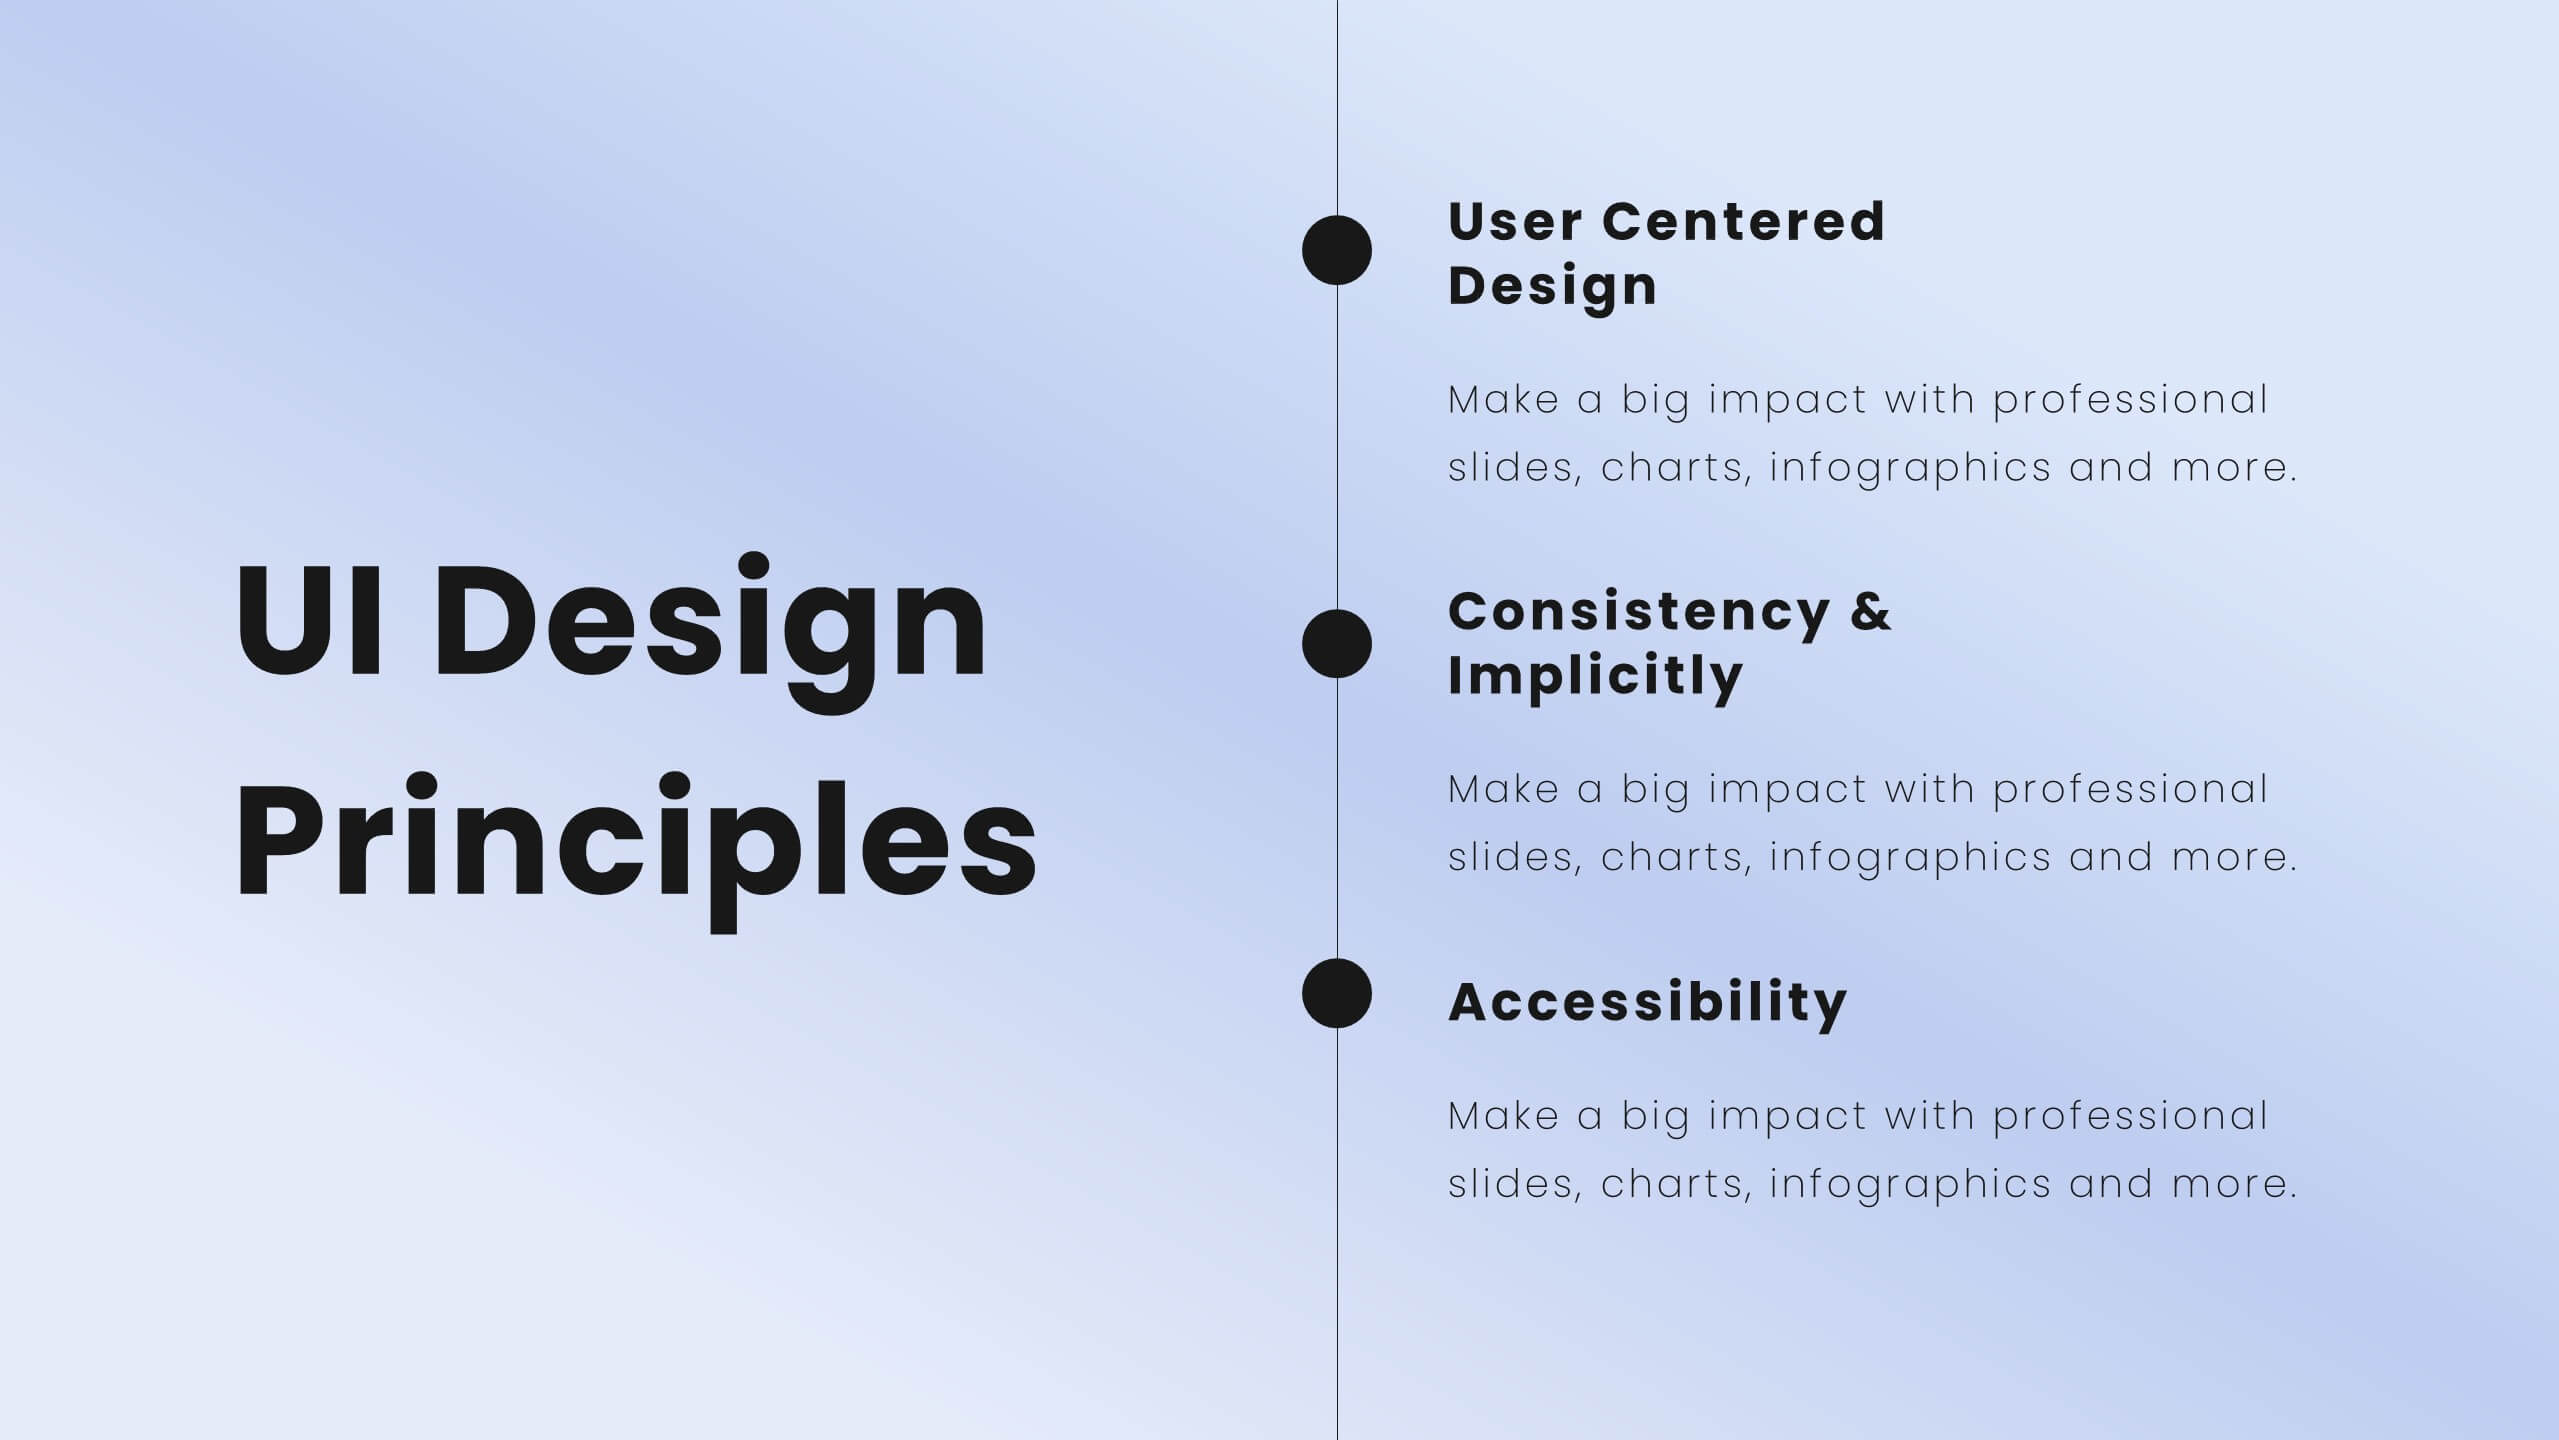
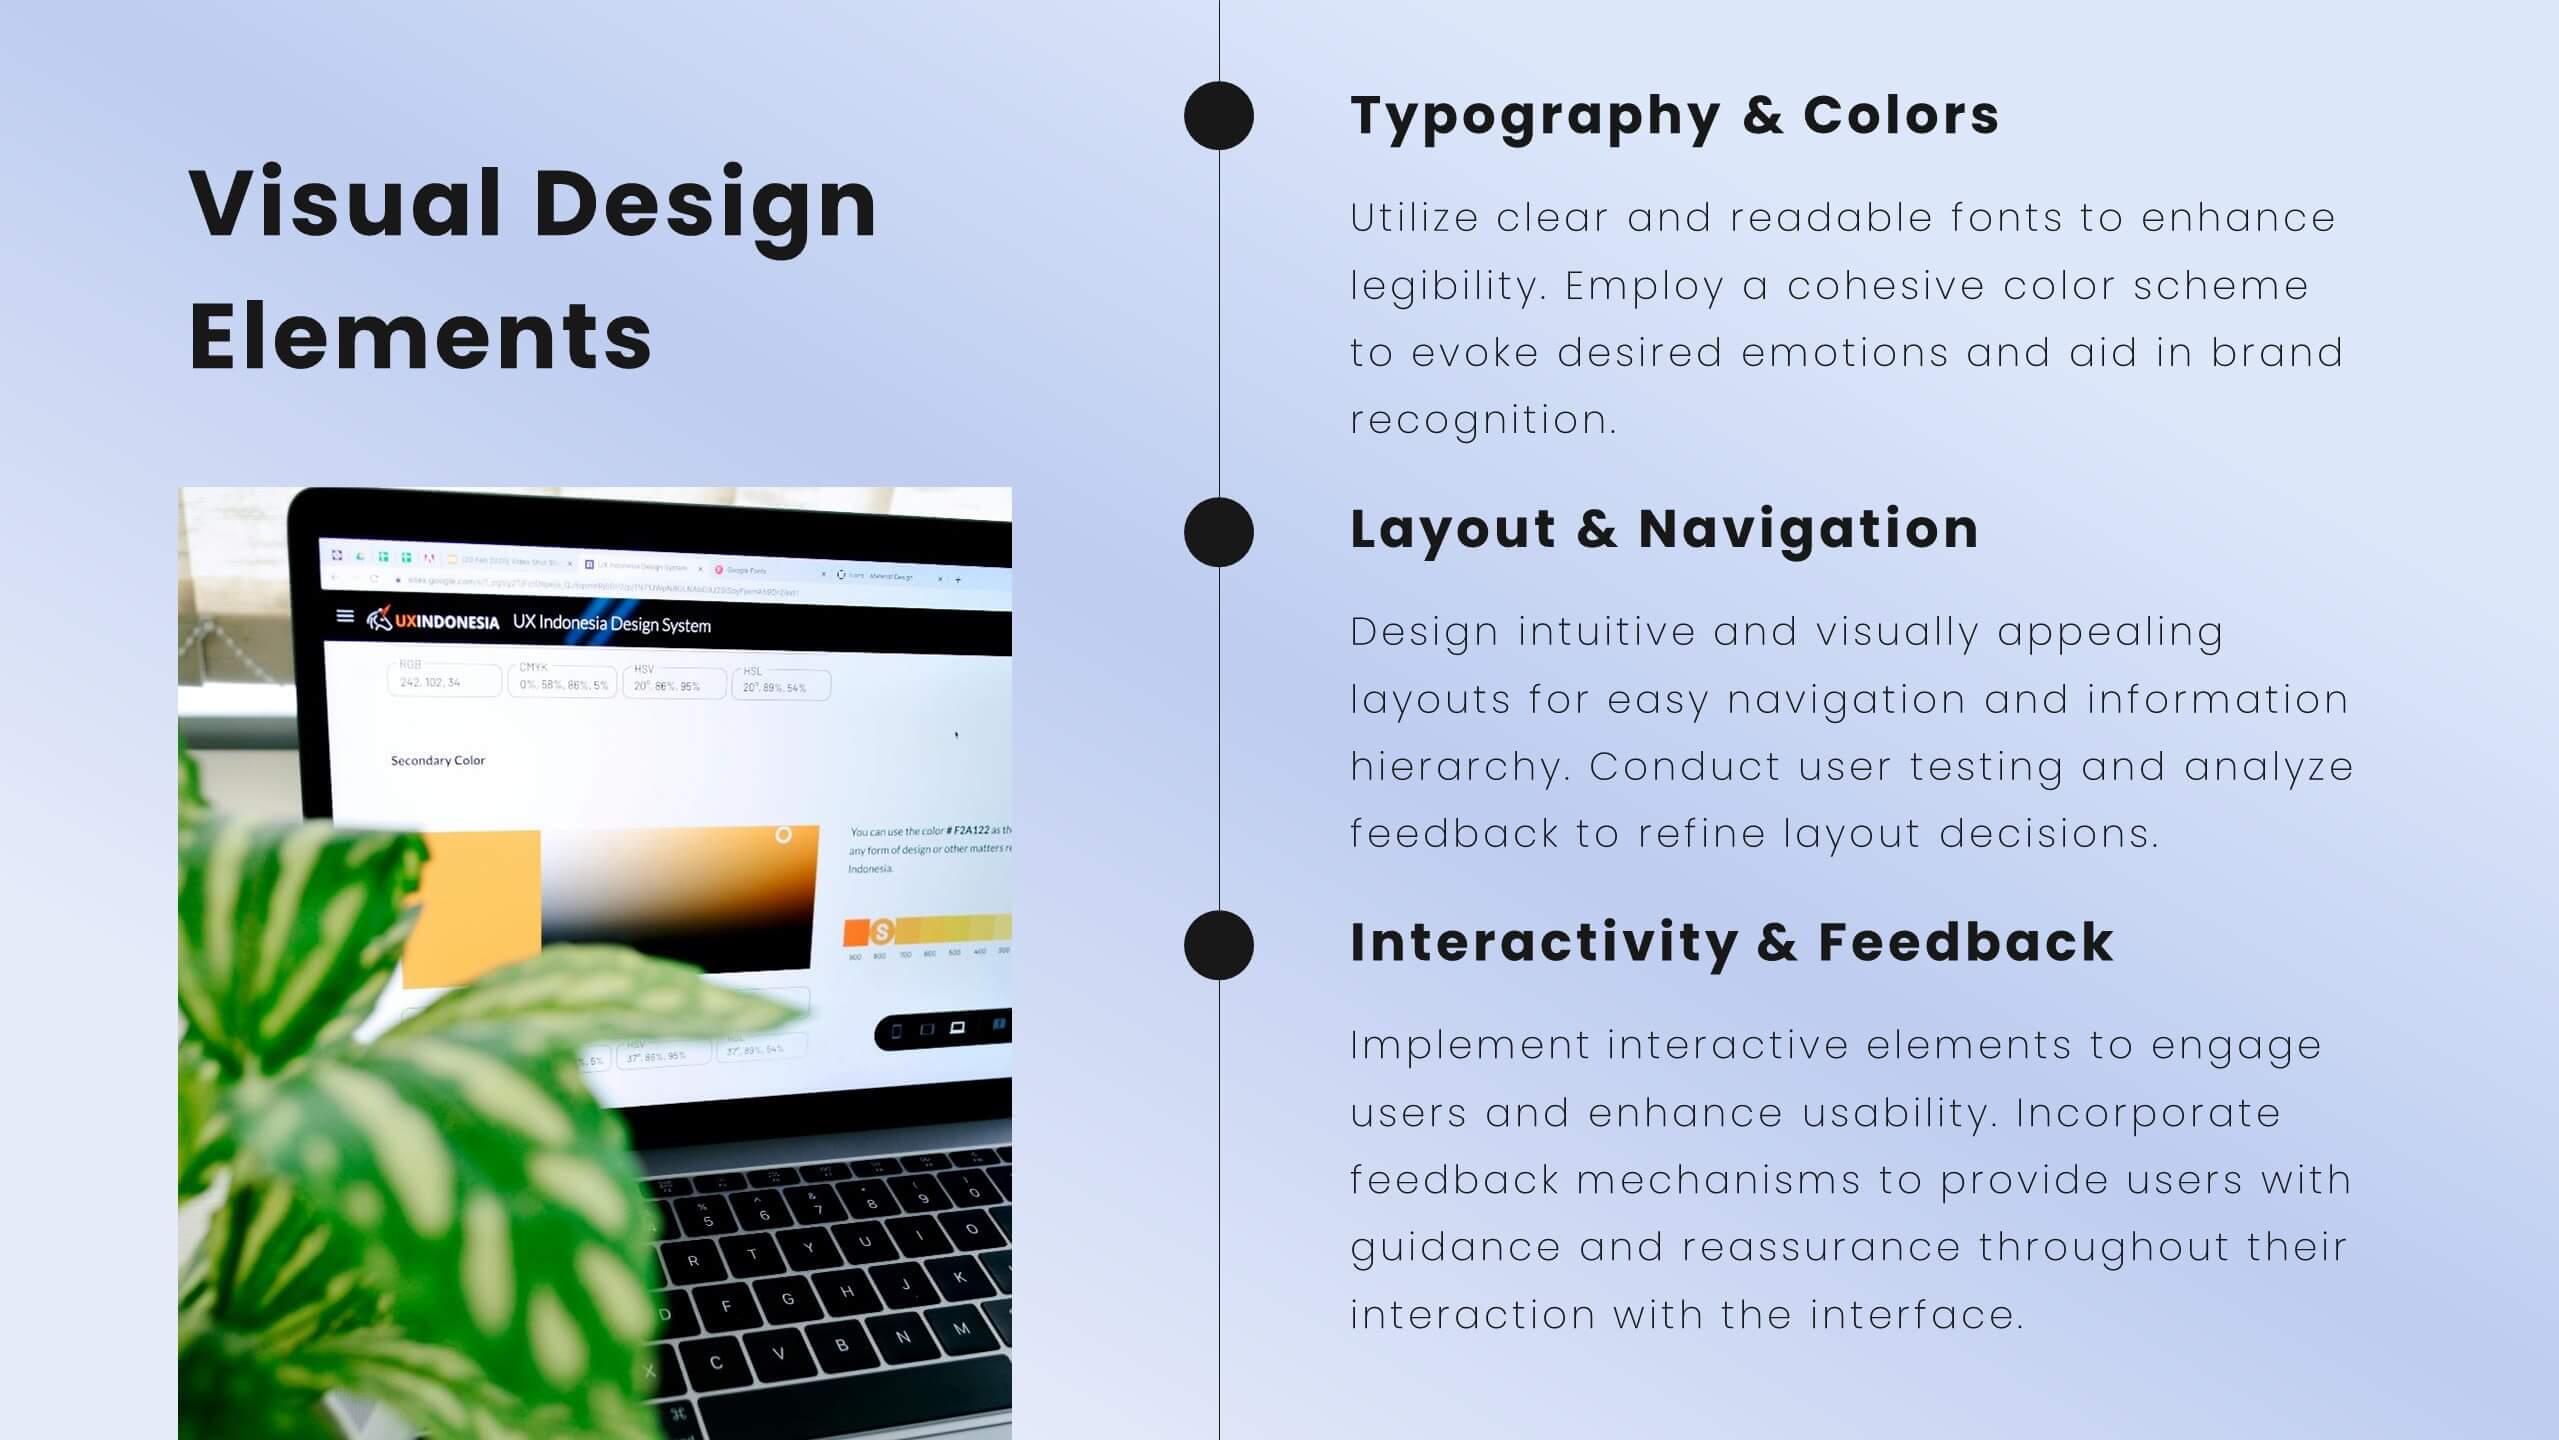
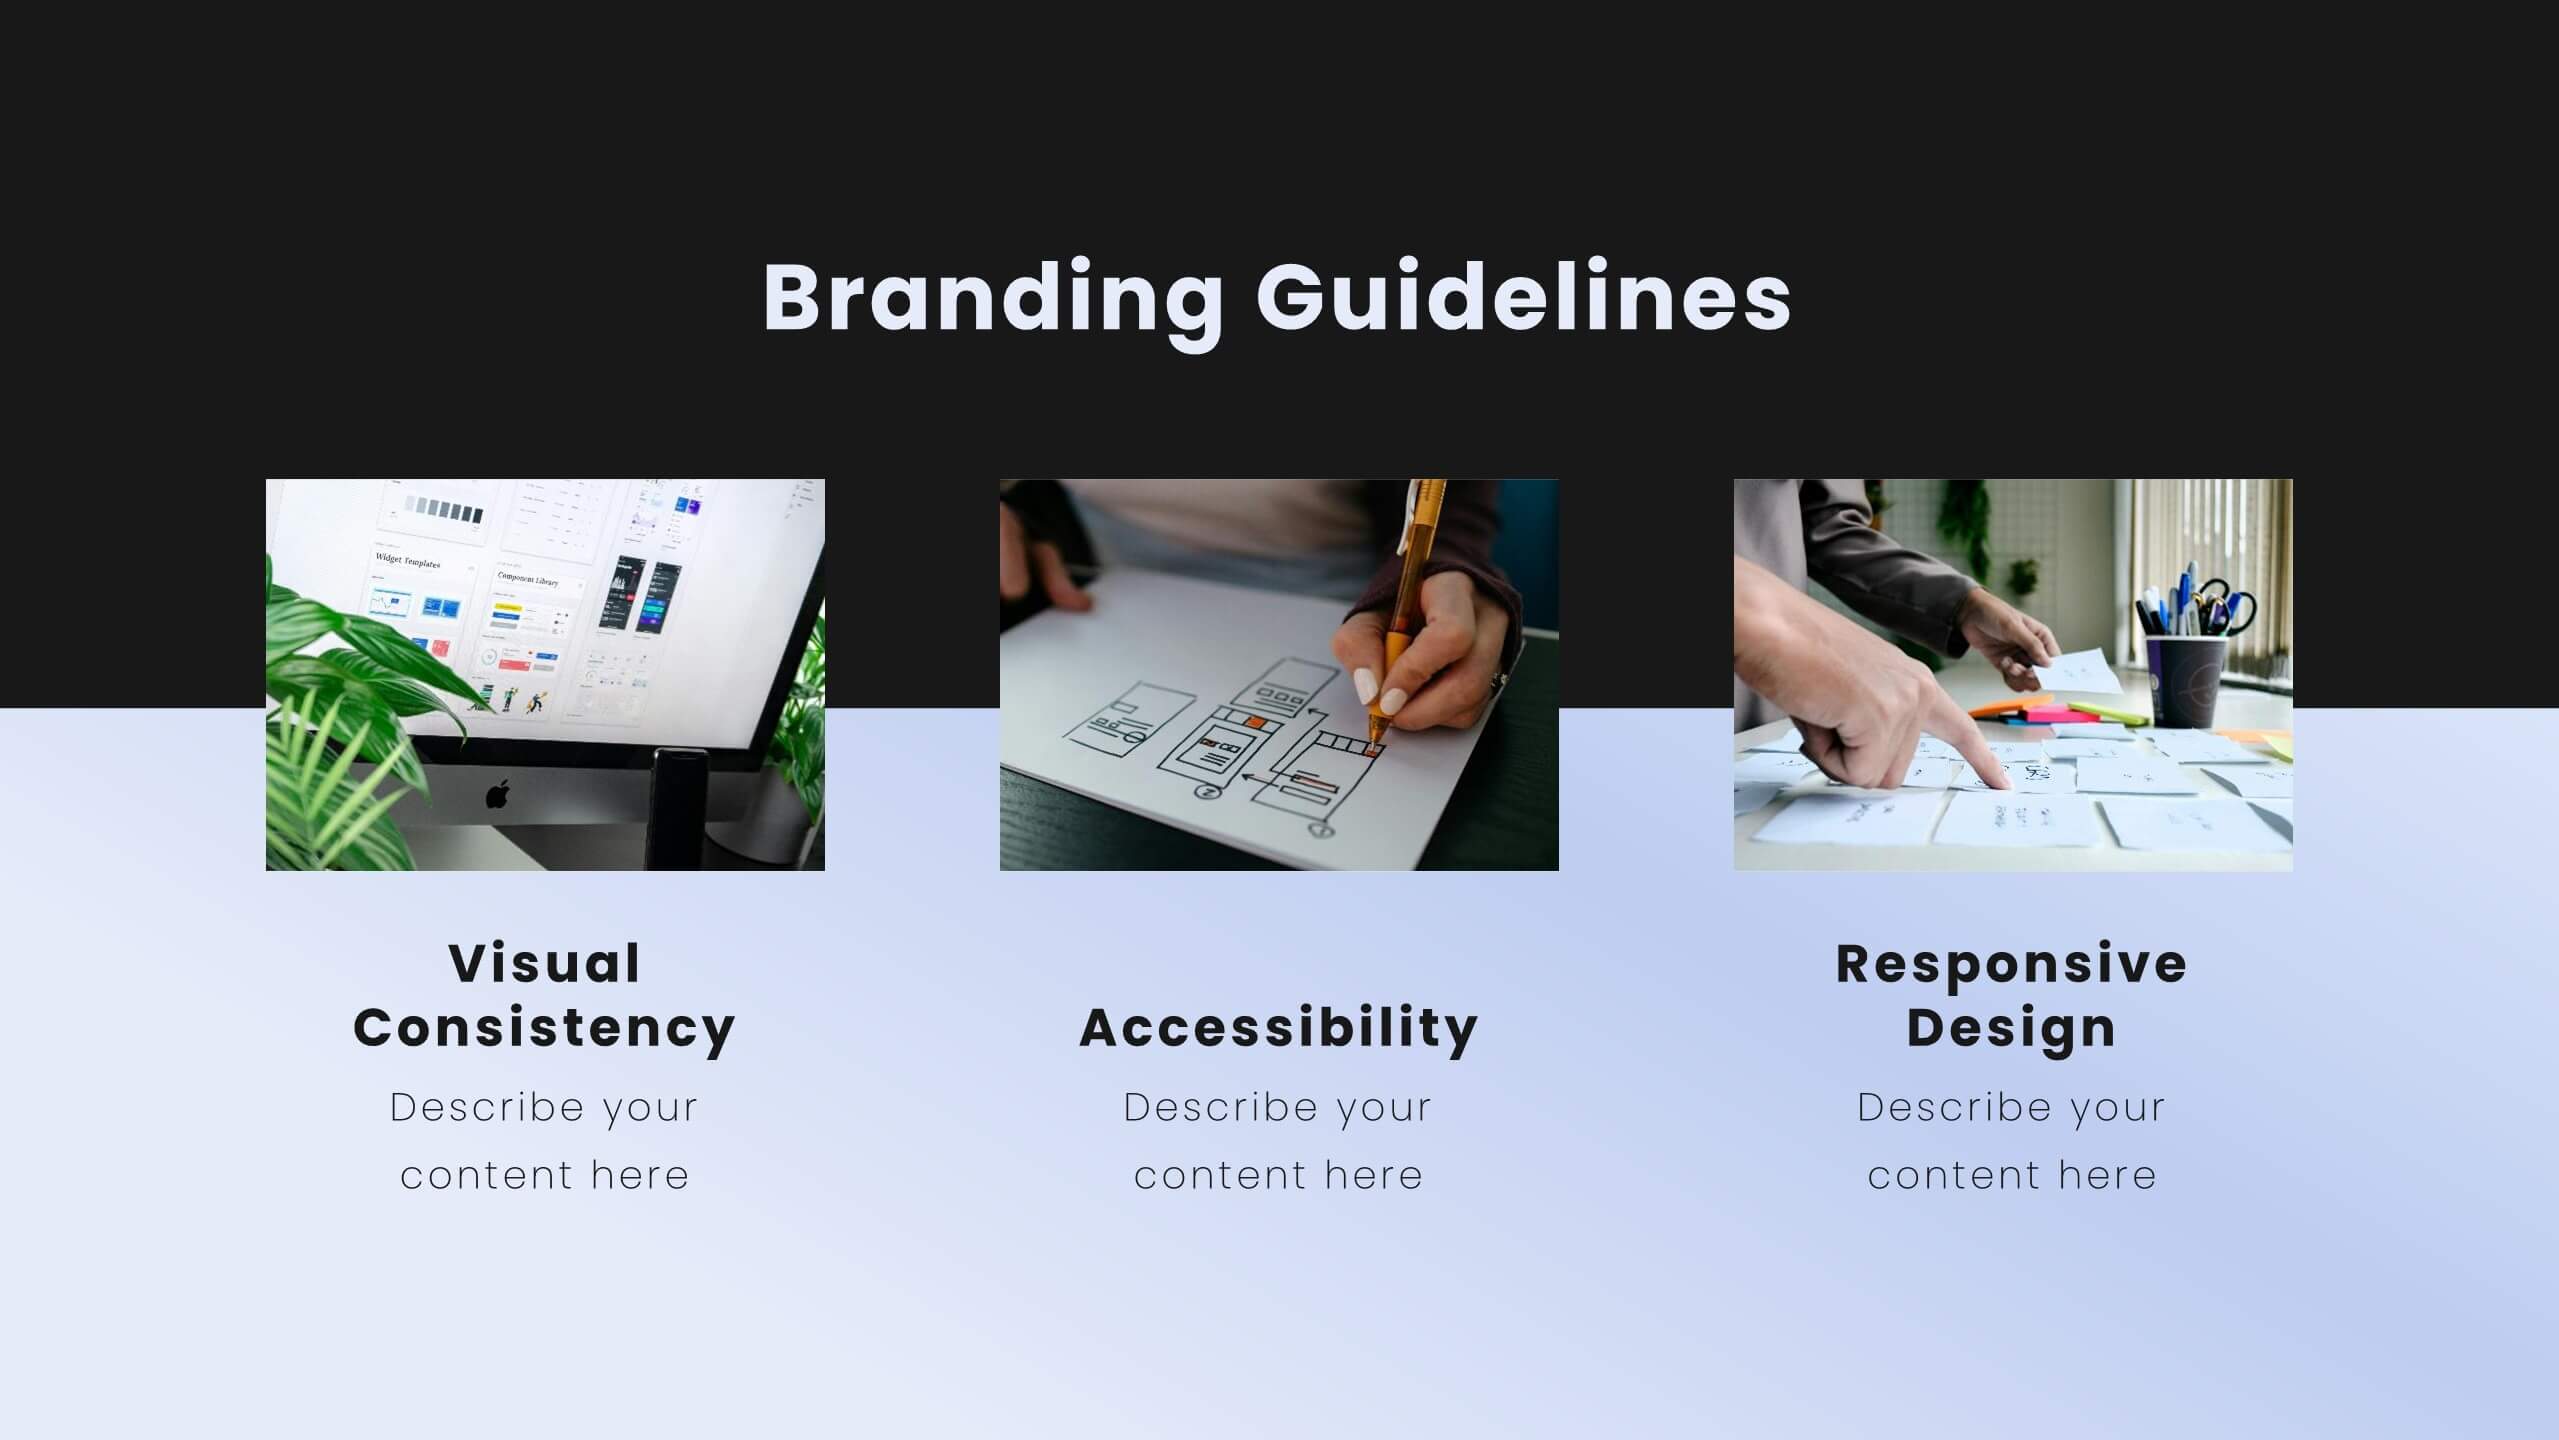
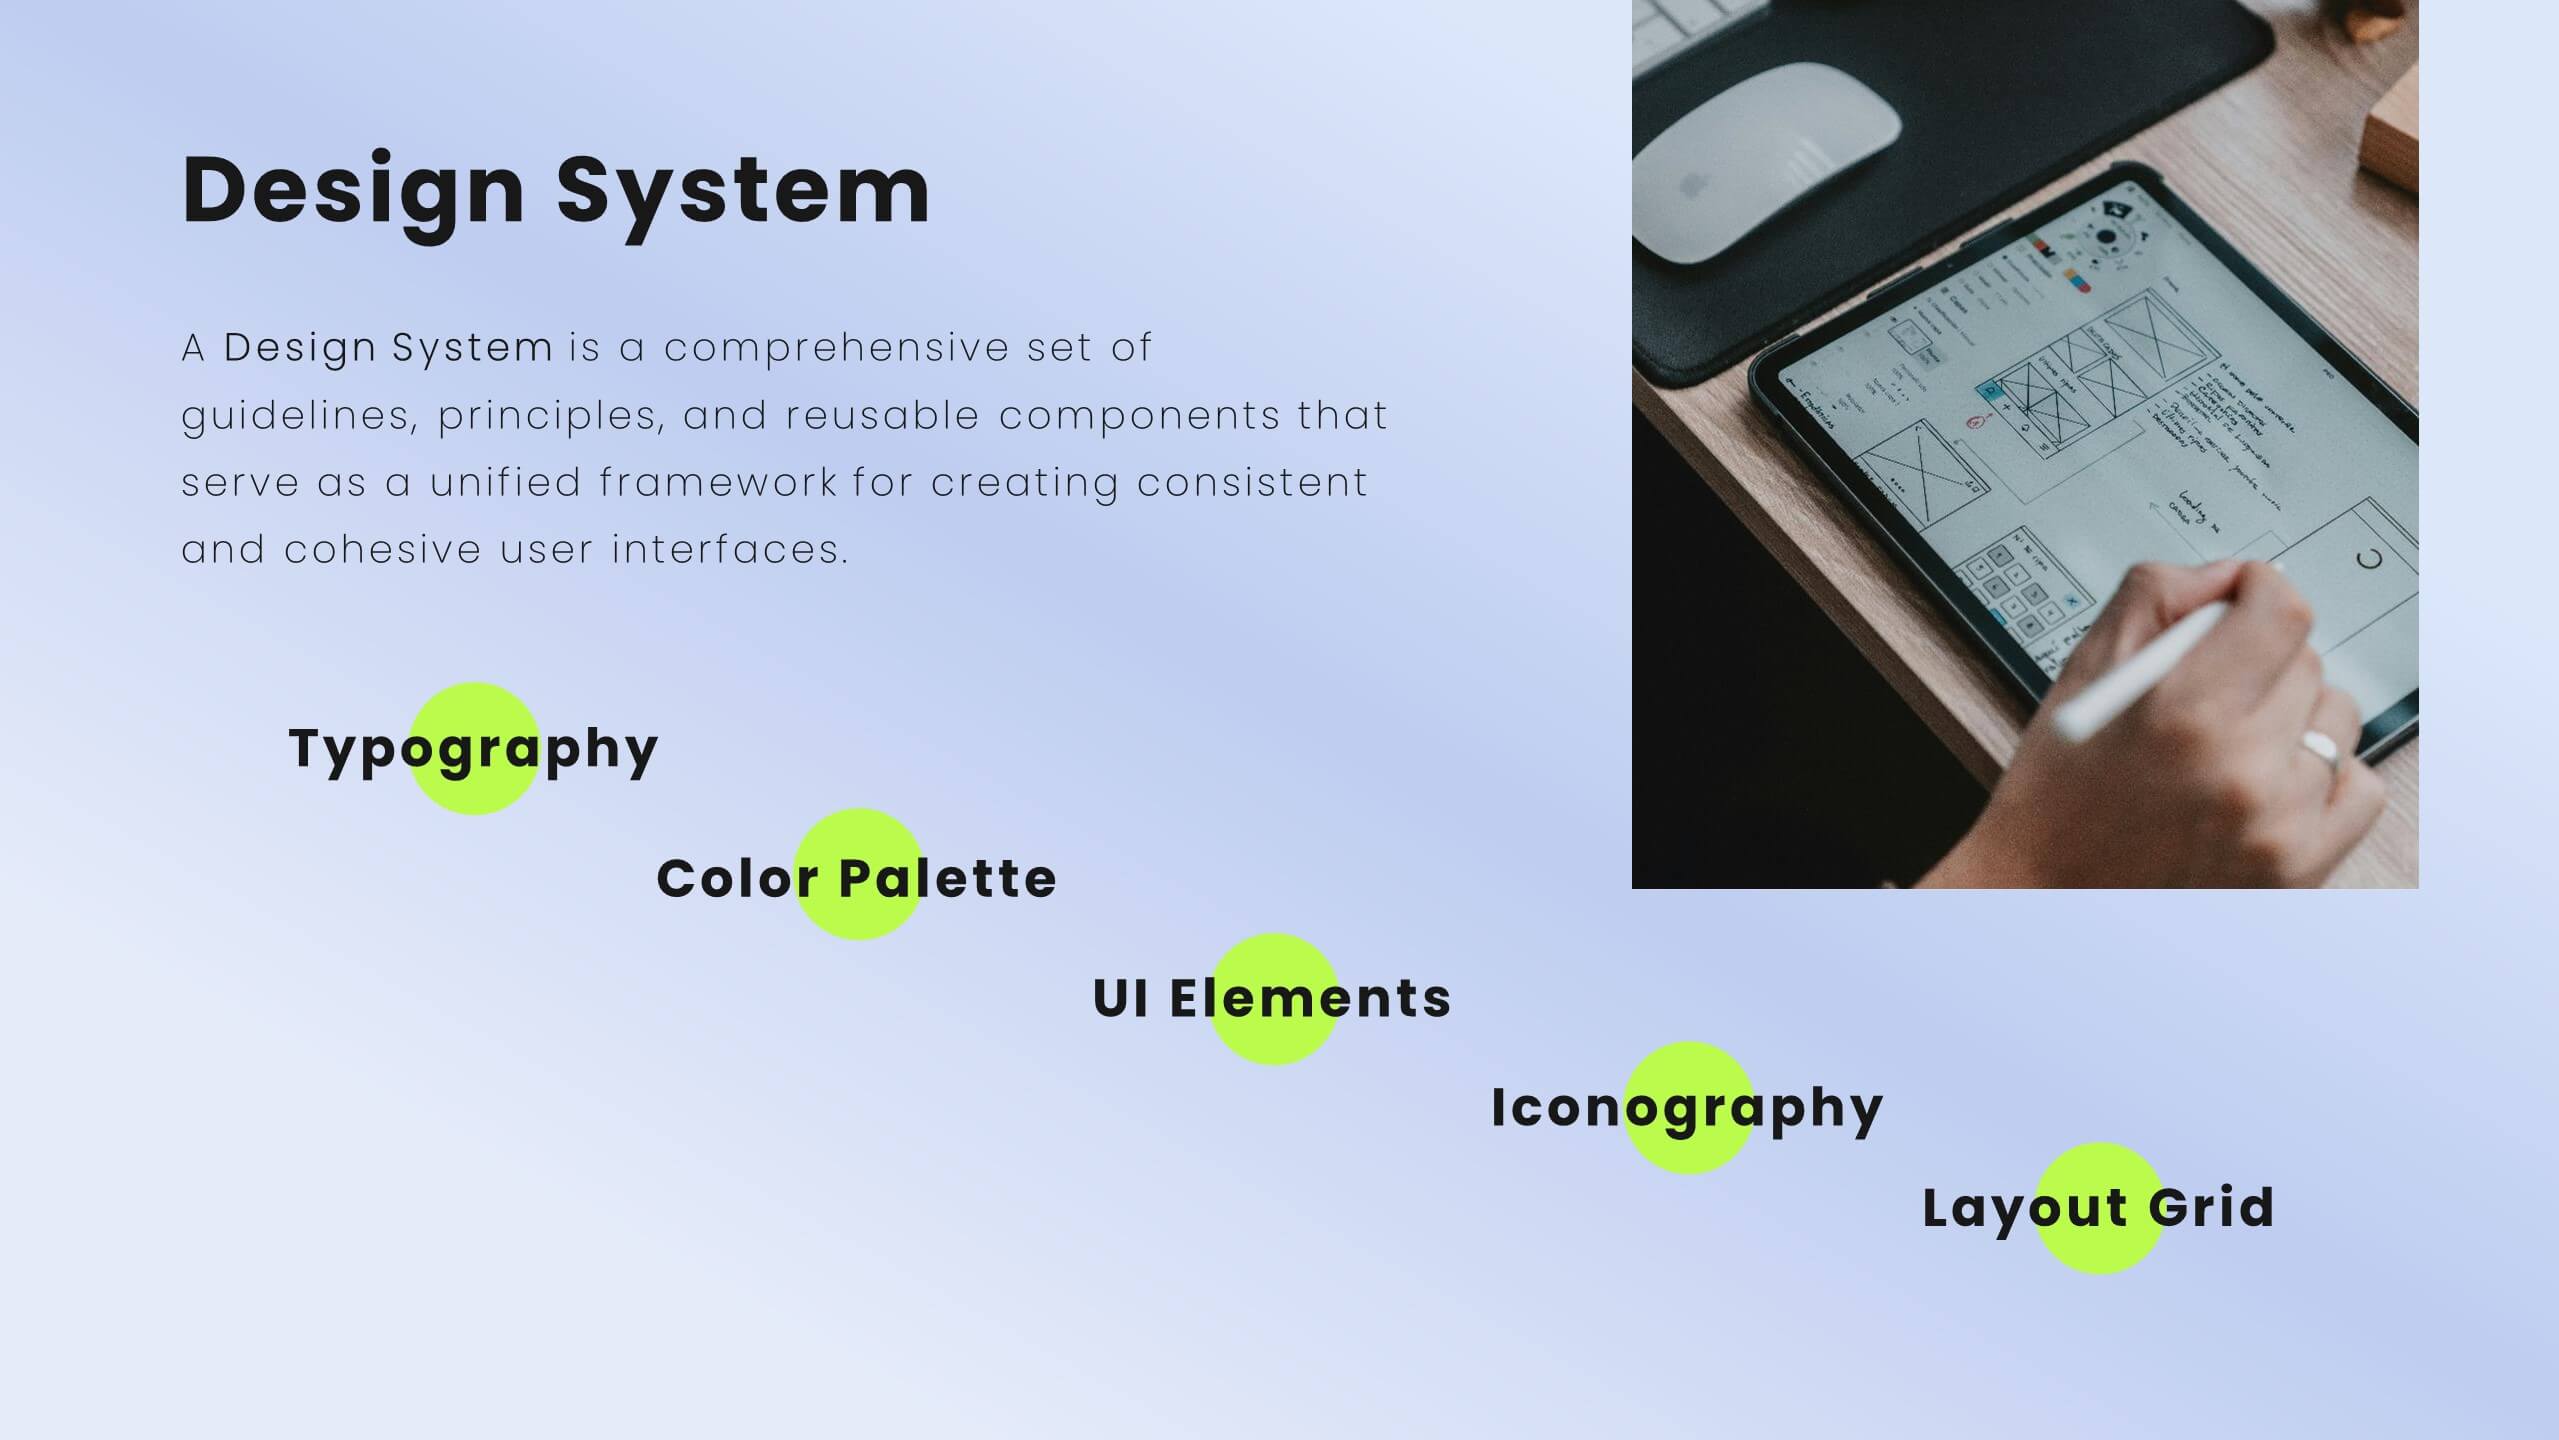
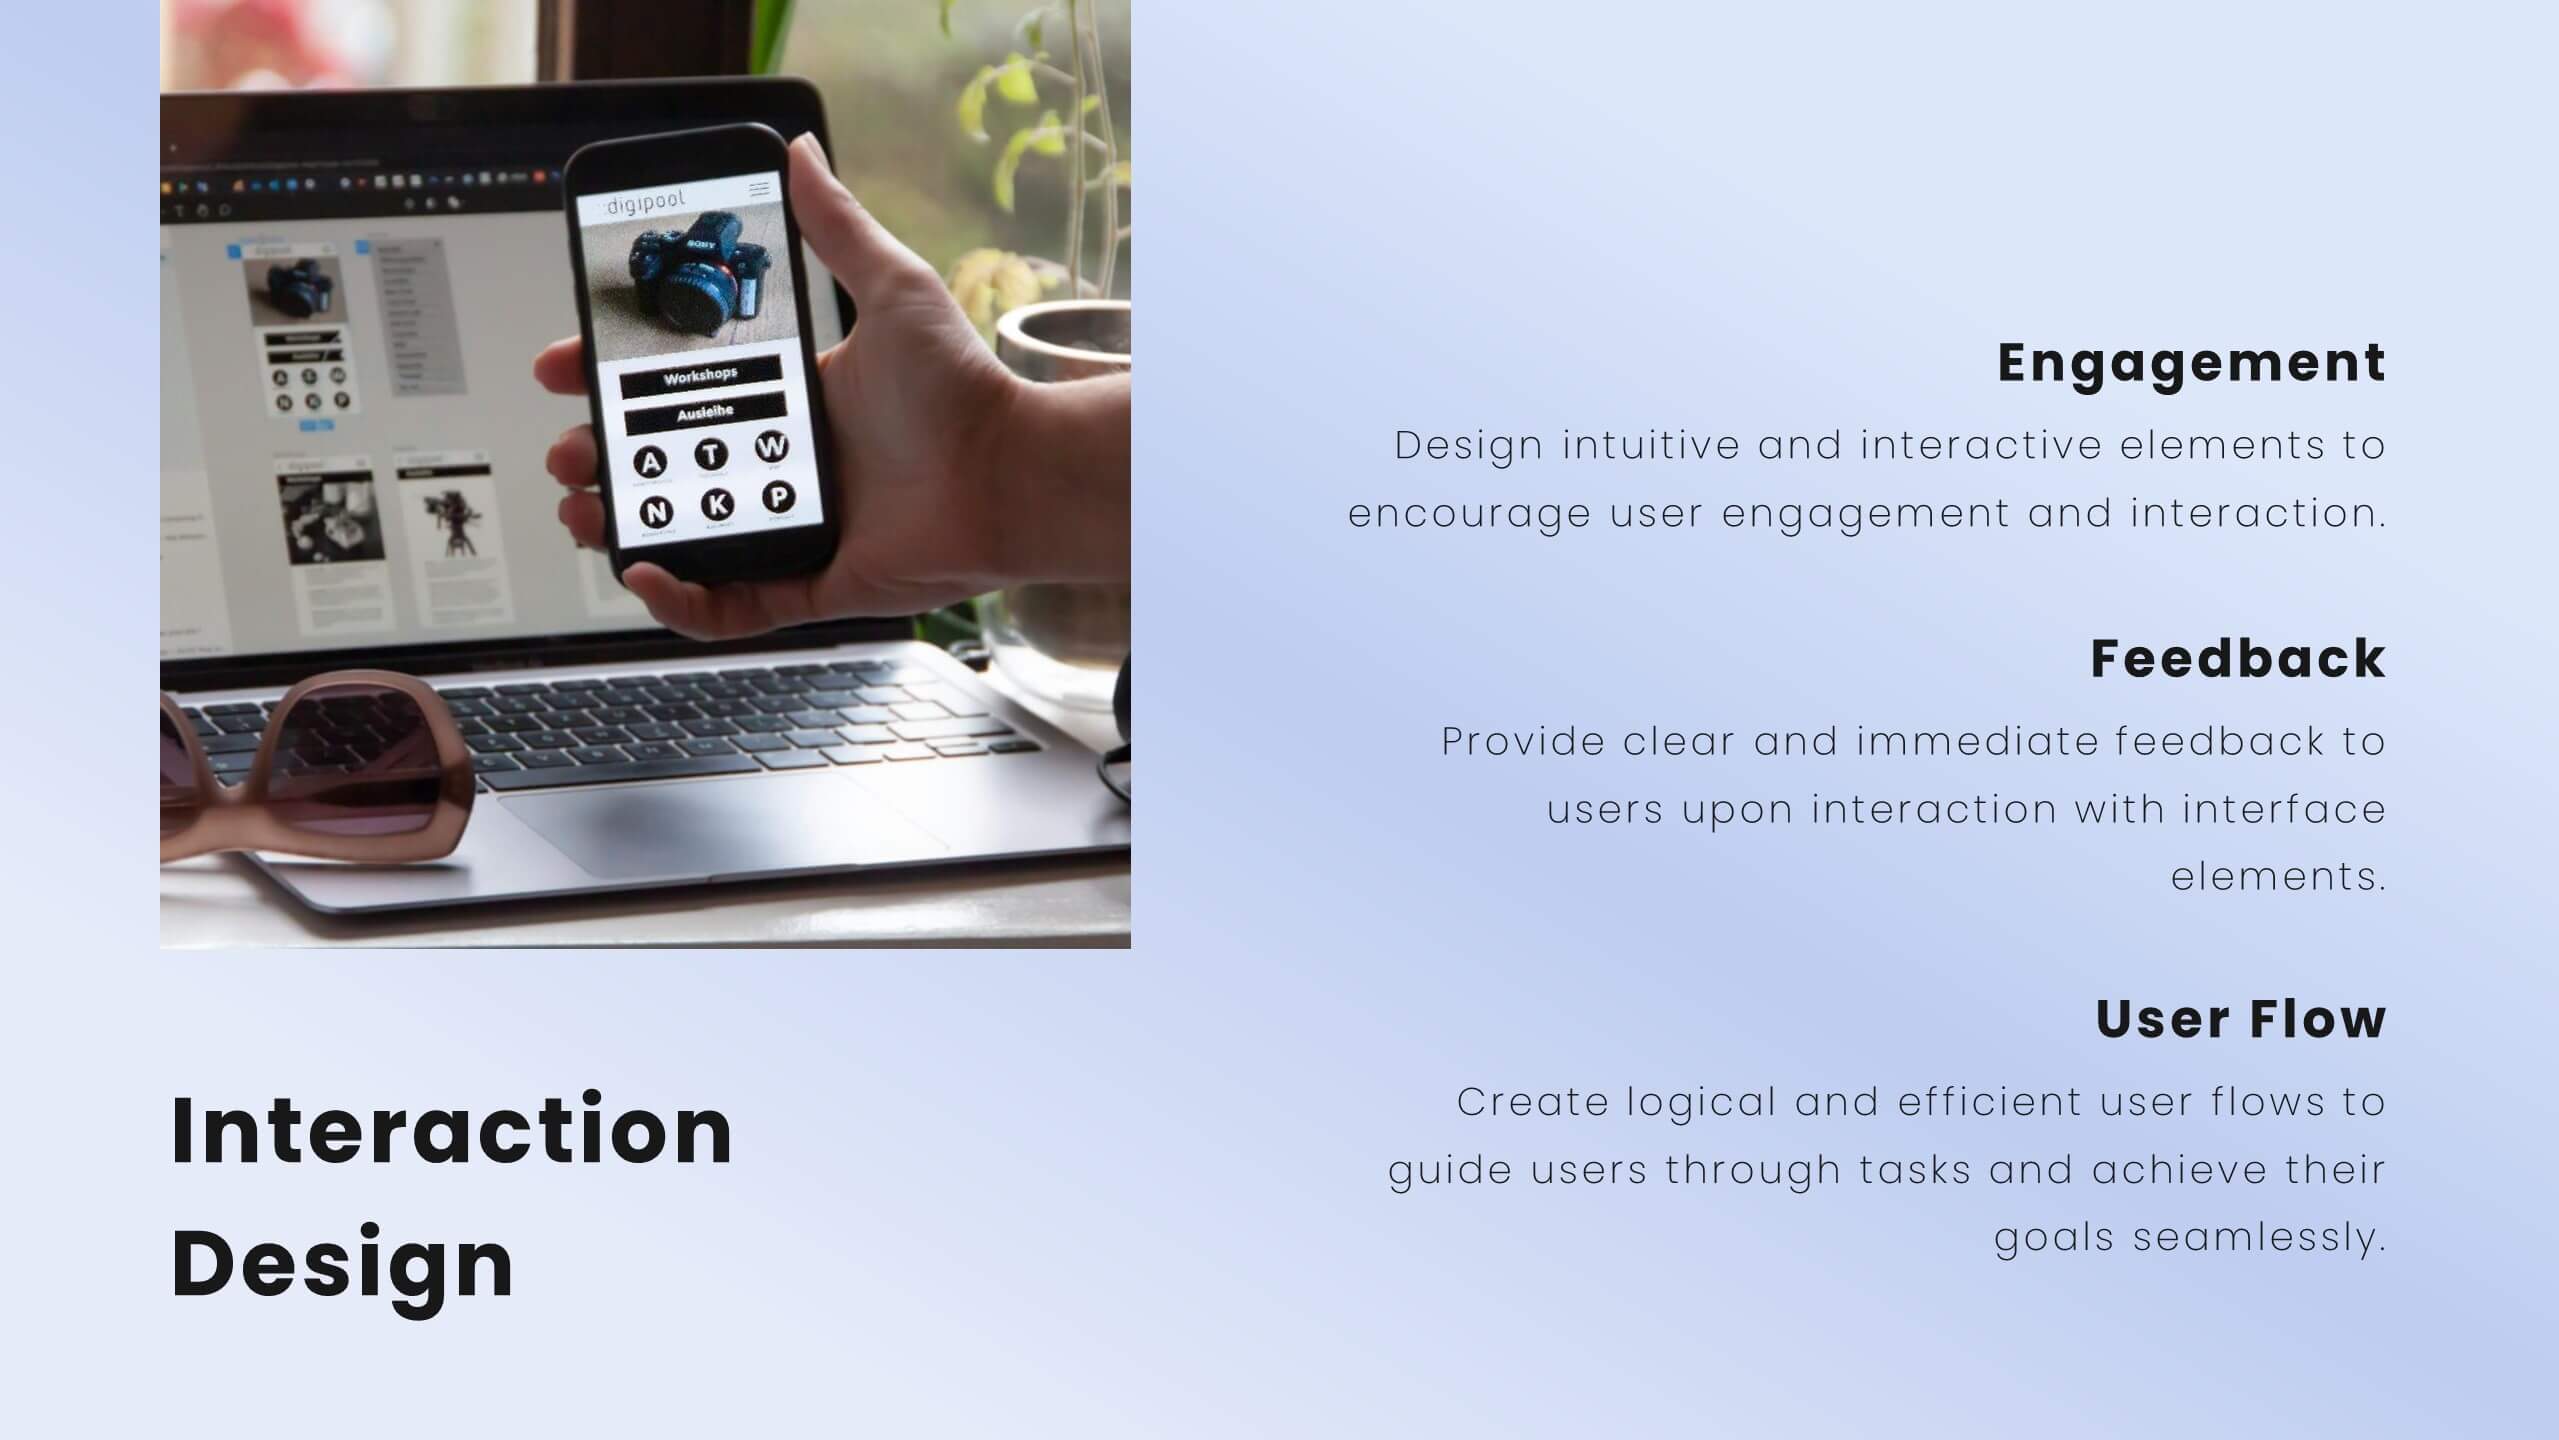
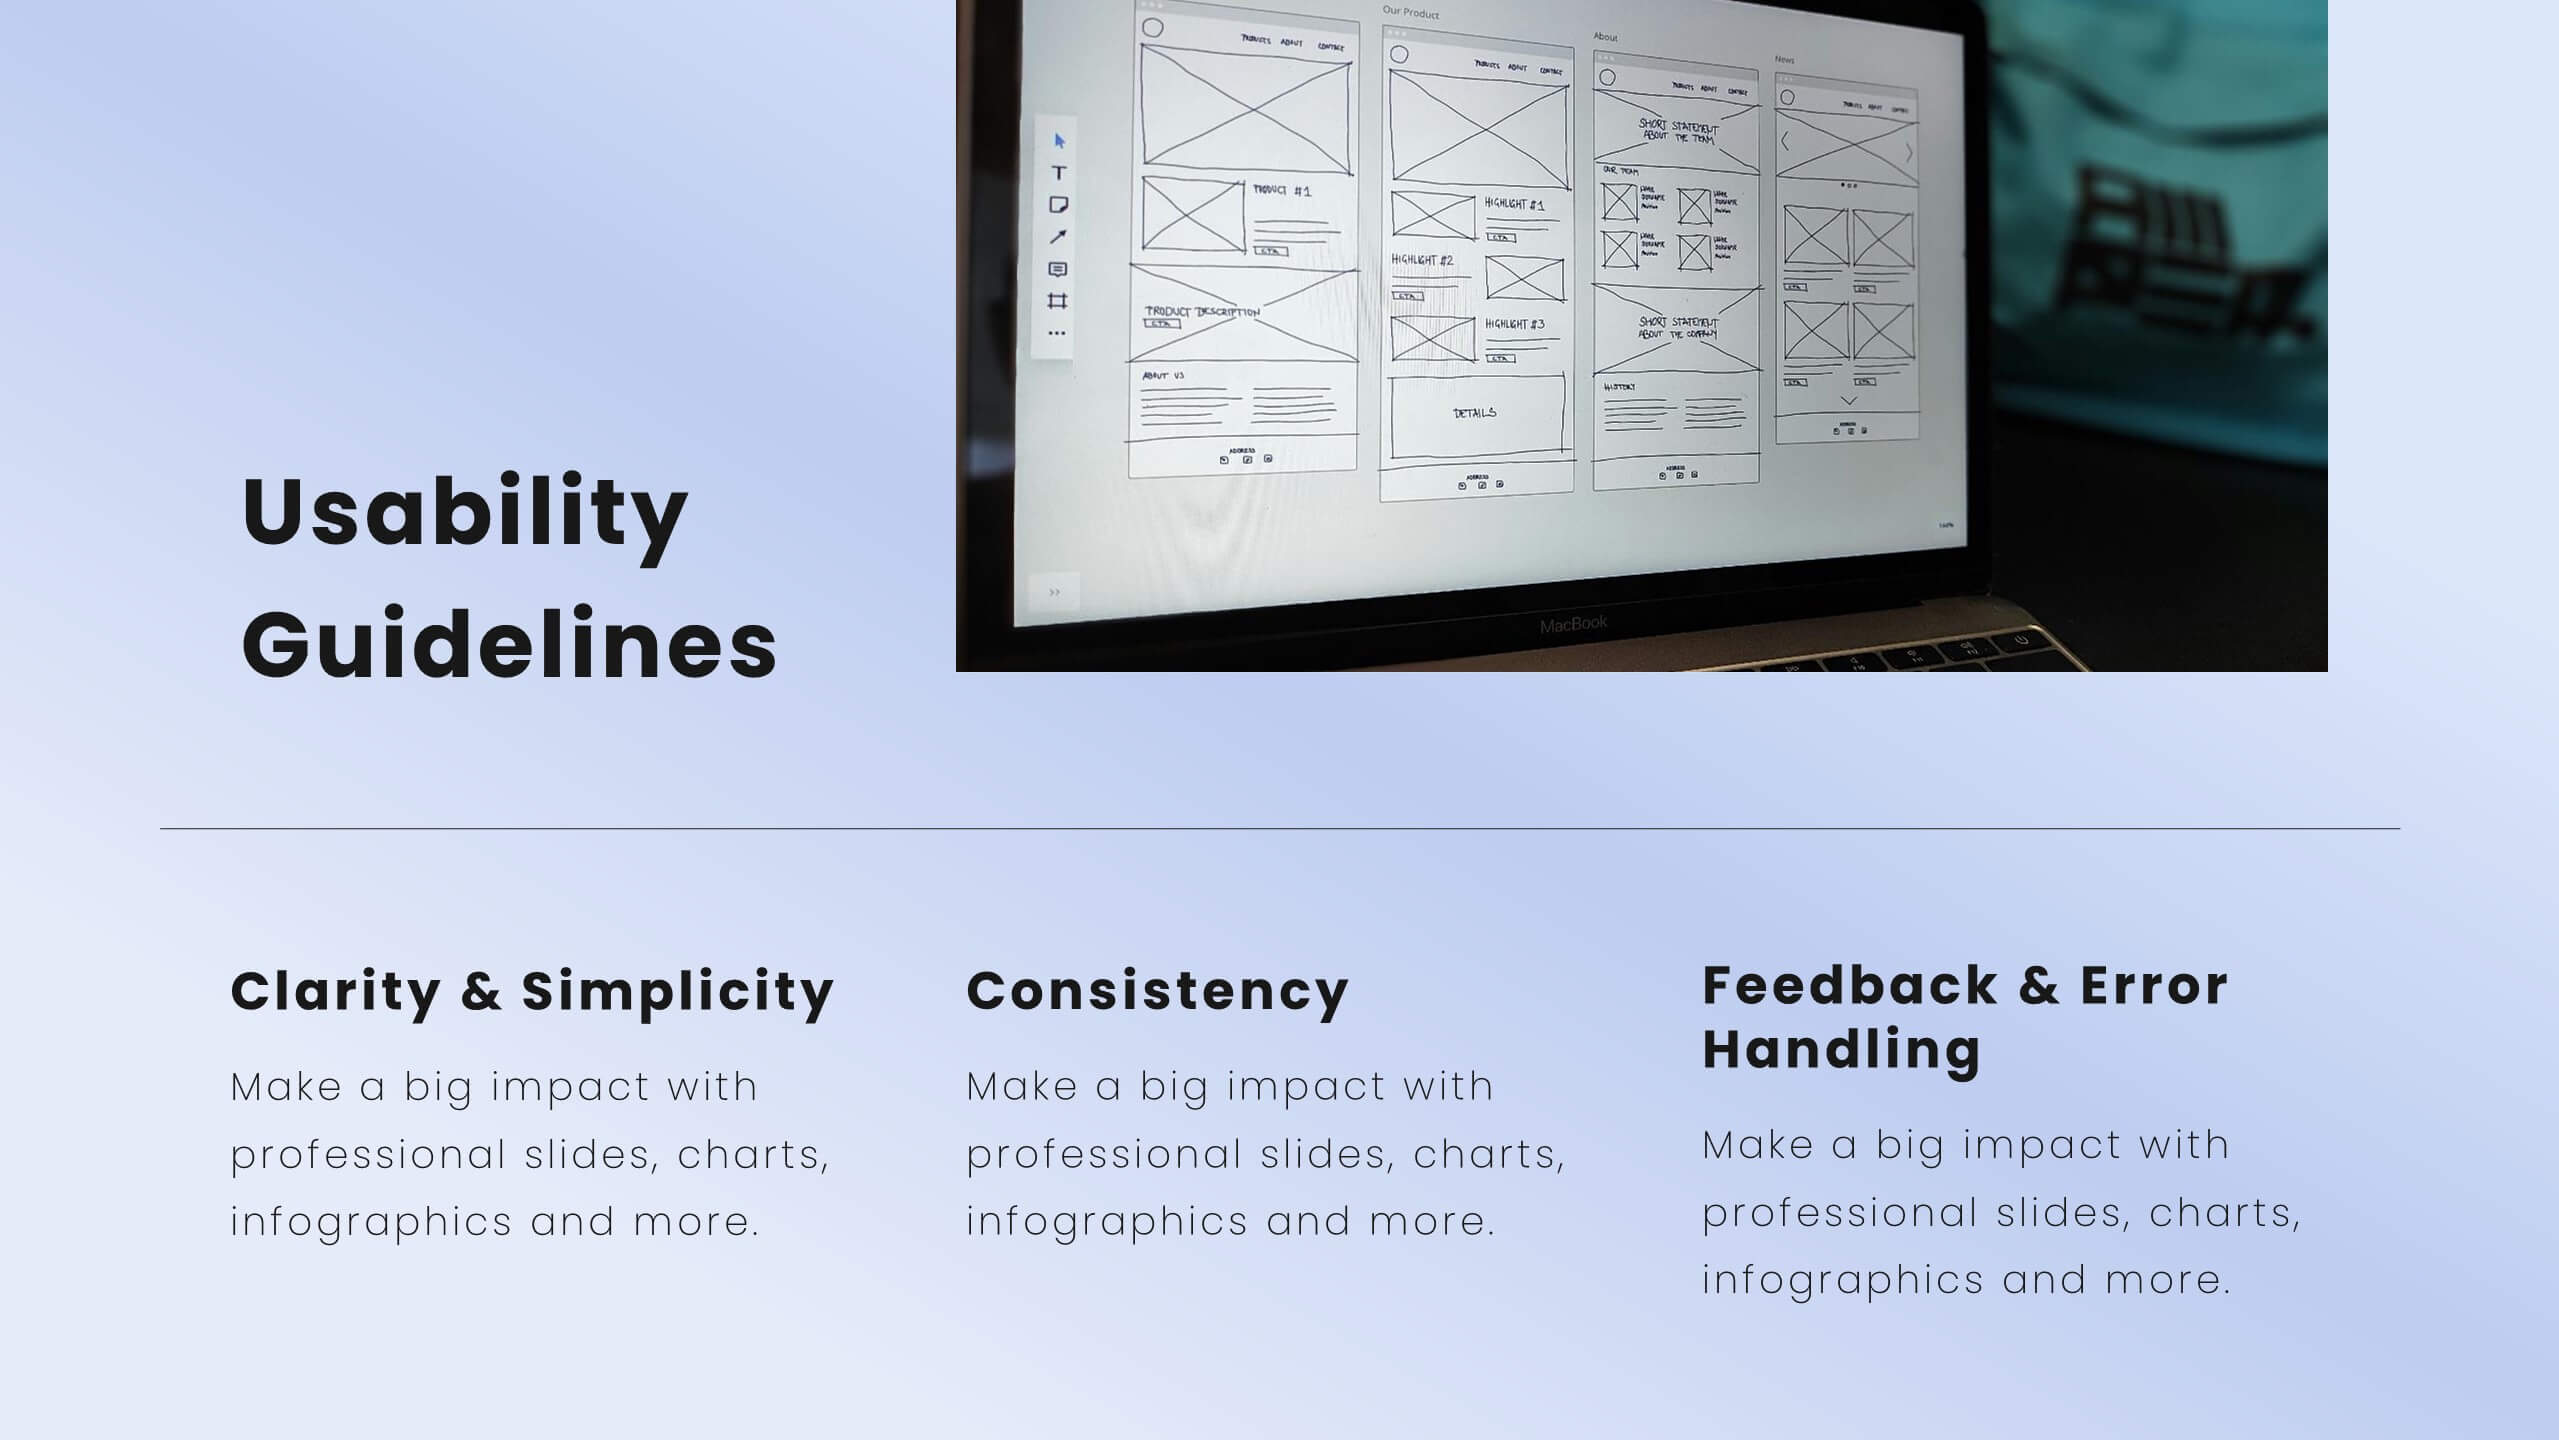
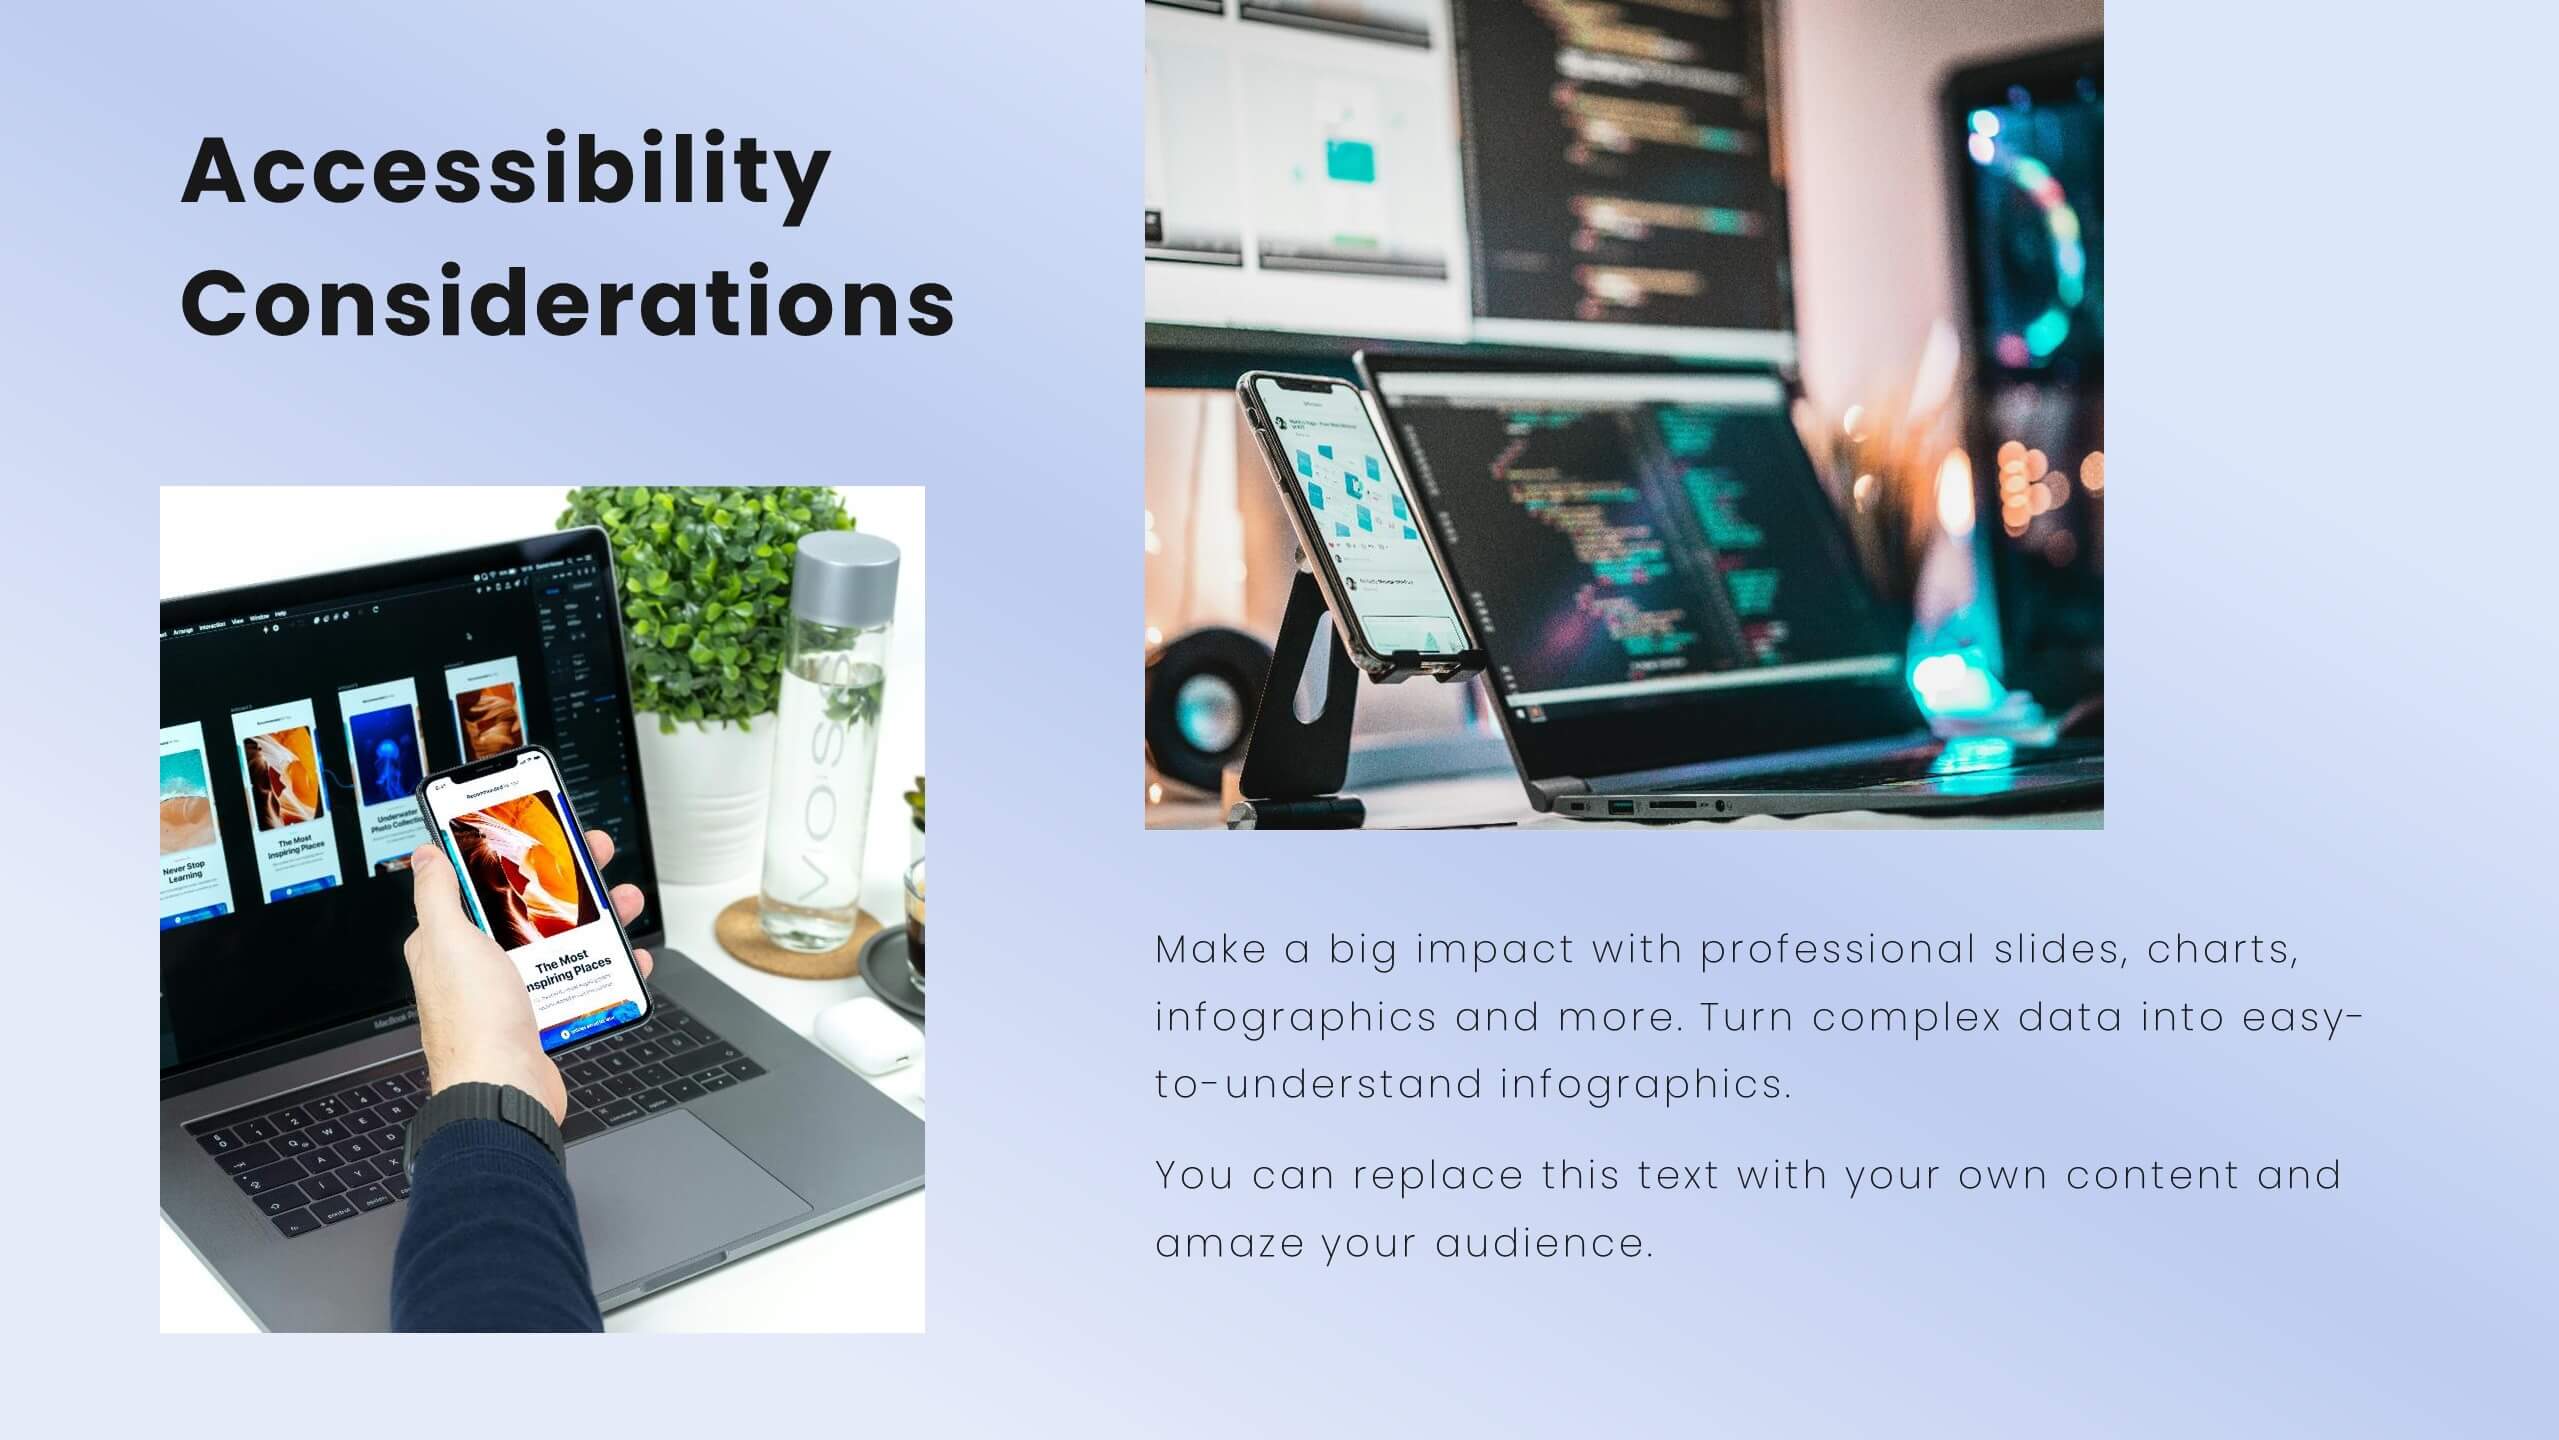
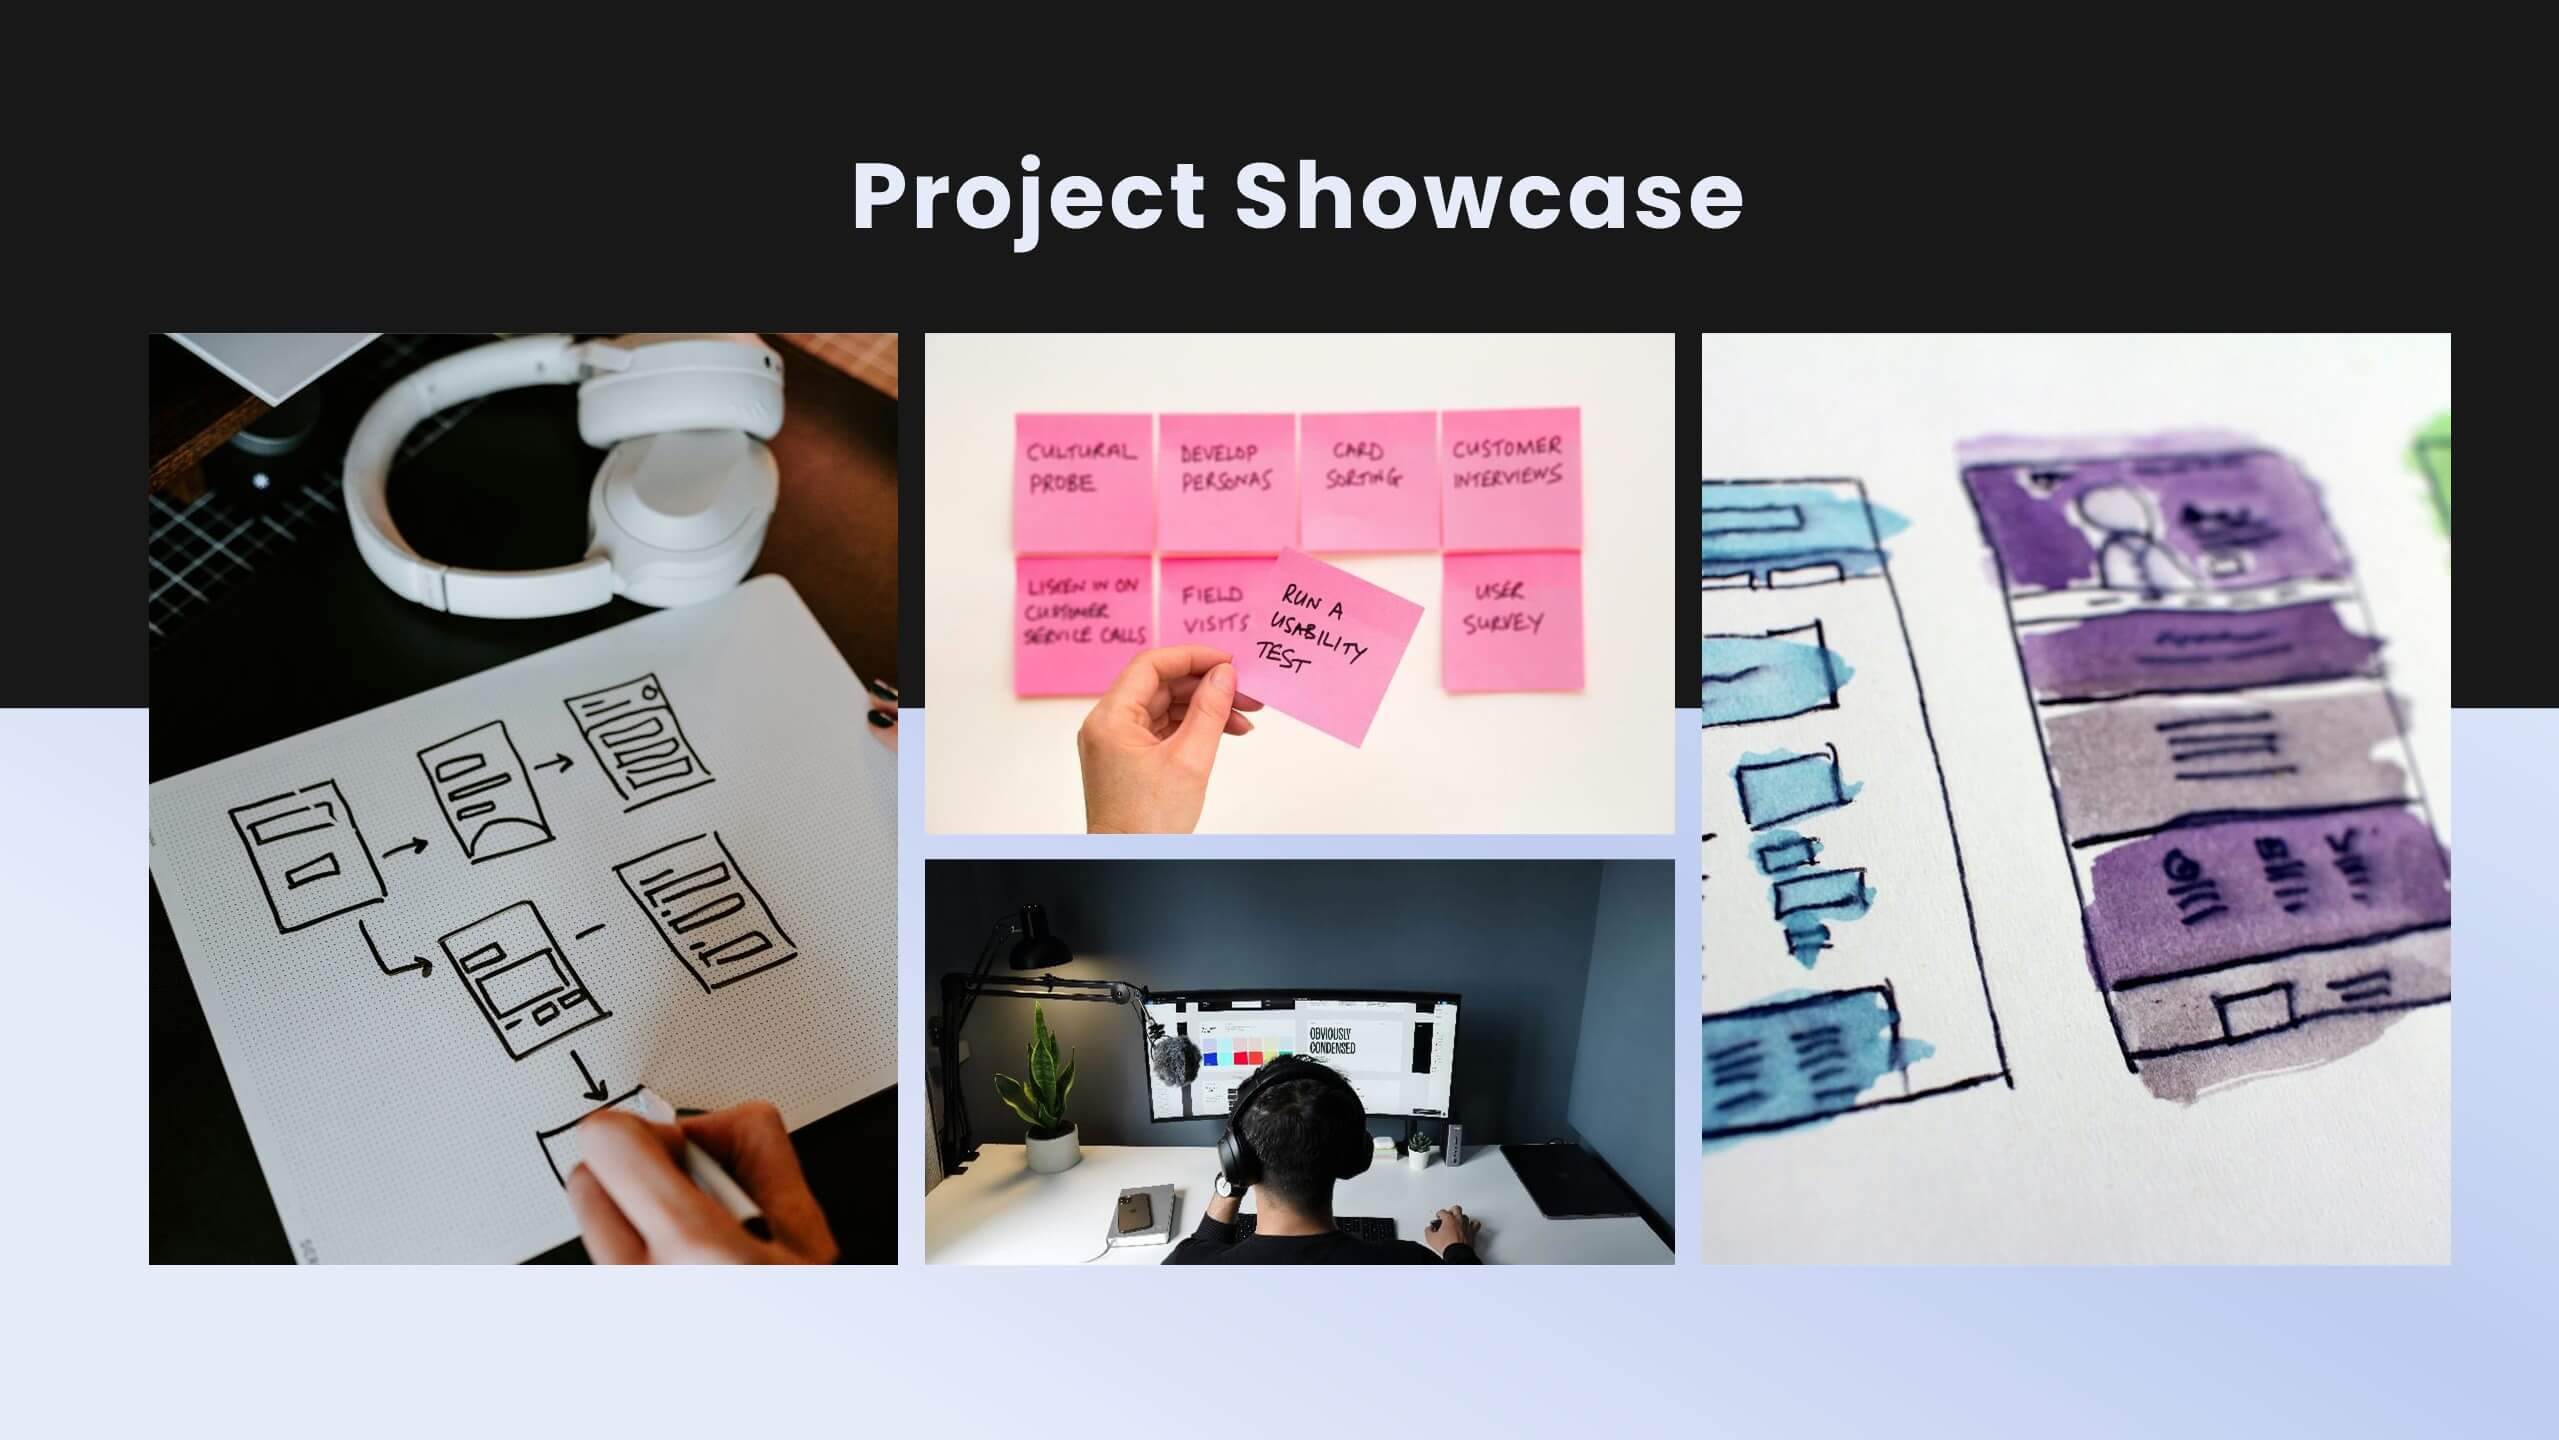
Jigsaw User Experience Proposal Presentation
Enhance user experience with this comprehensive UX proposal template! Perfect for outlining user research, personas, and design principles. Ideal for UX/UI designers aiming to present their strategies and solutions. Compatible with PowerPoint, Keynote, and Google Slides, this template ensures your UX proposals are clear, professional, and impactful. Create exceptional user experiences today!


22 diapositivas
Lucidia Market Research Presentation
Deliver insightful market research findings with this modern and structured template. It covers key areas such as data analysis, consumer insights, research methodologies, and future directions. Ideal for presenting to stakeholders or clients. Fully customizable for PowerPoint, Keynote, and Google Slides.