


Características


¿Tienes alguna pregunta?
Recomendar


7 diapositivas
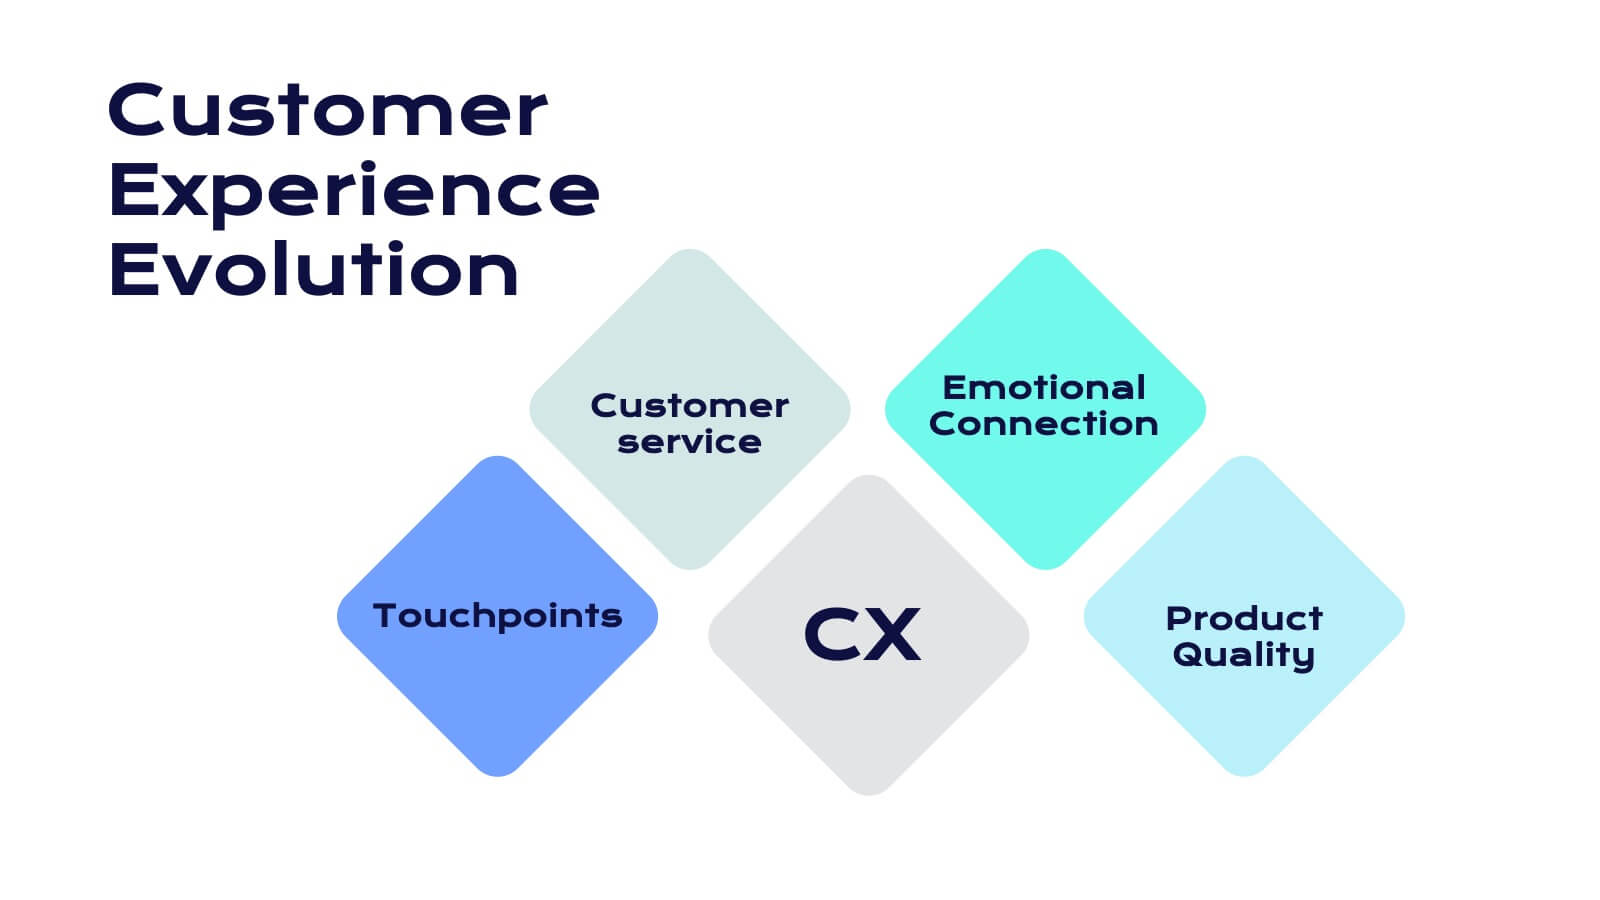
Customer Relationship Management
Strengthen client loyalty and drive growth with this organized CRM infographic. Perfect for presenting customer touchpoints, service strategies, and loyalty-building initiatives. Fully customizable in PowerPoint, Keynote, and Google Slides, this design ensures your CRM workflows are communicated with clarity and visual impact.


6 diapositivas
TAM SAM SOM Market Analysis
Take your market insights to the next level with a visual that simplifies complex data in seconds. This layered template helps you clearly communicate TAM, SAM, and SOM breakdowns—perfect for startups, product pitches, or strategic planning. Easily editable in PowerPoint, Keynote, and Google Slides for fast, polished presentations.


5 diapositivas
SEO Optimization Infographics
The goal of SEO optimization is to attract more organic traffic to a website by improving its search engine ranking for relevant keywords and phrases. These Infographics are visual representations that show the steps, techniques, and best practices for improving a website's ranking in search engine results pages. These allow you to provide a quick and easy-to-understand overview of SEO concepts and strategies, including keyword research, on-page optimization, link building, and technical SEO. These are valuable resources for anyone looking to improve their website's search engine ranking and increase organic traffic.


6 diapositivas
United States Coronavirus Map
A United States Coronavirus Map is a graphical representation that displays the spread of the coronavirus (COVID-19) across the United States. This infographic template may use different colors, shades, or symbols to indicate the severity of COVID-19 cases in different areas. Darker colors may represent higher case numbers, while lighter colors may represent lower case numbers. These maps are valuable tools to track the progression of the virus, identify hotspots, and make informed decisions related to public health. This can also help raise awareness about the importance of preventive measures and promote data-driven strategies to control the spread.


26 diapositivas
Doriyan Presentation Template
Doriyan is a beautiful, colorful, professional and descriptive presentation. This template has wonderful colors and graphics that are engaging and conveys the information to the audience. This template is suitable for all types of businesses especially those that are investors, realtors or other companies involved in investment advice. Charts, timelines and easy to edit text makes this template perfect for businesses seeking to introduce there business and services to make a great impression. Doriyan offers a way to boost your business. Present your information with this efficient template!


6 diapositivas
Next-Gen Wireless Solutions Overview Presentation
Give your wireless solutions pitch a sleek, professional edge with this futuristic globe-style layout. Perfect for tech-driven topics, this infographic highlights six key areas in a clear, visually engaging format. Fully customizable and easy to use in PowerPoint, Keynote, and Google Slides—ideal for product overviews, innovation briefings, or strategy updates.


8 diapositivas
Effective Team Building Model Presentation
Visualize your strategy for collaboration with the Effective Team Building Model Presentation. This layered block layout is perfect for illustrating step-by-step frameworks, progressive strategies, or hierarchical team development stages. Clean, modern, and color-coded for clarity, it's ideal for internal planning, training, or leadership presentations. Fully editable in PowerPoint, Keynote, Canva, and Google Slides.


4 diapositivas
Regional Economy Development in Oceania Map Presentation
Visualize development priorities across Oceania with this regional map template. Featuring three editable title blocks and icon-labeled highlights, it’s perfect for showcasing growth strategies, funding allocation, or policy focus areas. Fully compatible with PowerPoint, Keynote, and Google Slides for data-driven presentations in regional planning or economic development.


8 diapositivas
Organizational Hierarchy Tree Diagram Presentation
Streamline Your Organization! The Organizational Hierarchy Tree Diagram Presentation visualizes team structures, reporting relationships, and company workflows. Ideal for corporate presentations, HR planning, and decision-making, it features editable elements for seamless customization. Compatible with PowerPoint, Keynote, and Google Slides, ensuring professional clarity and impact in any business setting.


5 diapositivas
Business Overview and Highlights Summary
Summarize your company’s key milestones with this Business Overview and Highlights Summary slide. Featuring a clean layout with a bold briefcase visual and four spotlight areas, it’s ideal for showcasing achievements. Fully editable in PowerPoint, Keynote, and Google Slides.


6 diapositivas
Real Estate Classes Infographic
Real estate classes are educational programs or courses that provide individuals with the knowledge and skills needed to succeed in the real estate industry. This infographic template provides an overview of different types of real estate classes and what real estate is. This is designed to help individuals interested in the real estate industry understand the various educational opportunities available to them. Help your audience make informed decisions about their educational journey in the real estate field. Fully customizable and compatible with Powerpoint, Keynote, and Google Slides.


6 diapositivas
Business Decision Flow Model Presentation
Make smarter choices with this Business Decision Flow Model presentation. Clearly map out key decisions, steps, and potential outcomes using a structured, color-coded flow. Perfect for strategy reviews, team meetings, and executive briefings. Fully editable in Canva, PowerPoint, and Google Slides for seamless customization.


5 diapositivas
Supply Chain Management Plan Presentation
Streamline your presentation with a sleek and organized design built to illustrate process flow and logistics. Perfect for explaining production stages, delivery systems, or business operations, this visual layout brings clarity and structure to your message. Compatible with PowerPoint, Keynote, and Google Slides for effortless customization and use.


6 diapositivas
Leadership Program Infographic
A leadership program is a structured and intentional learning experience designed to develop and enhance leadership skills and qualities in individuals. This infographic template aims to provide a concise overview of the program's objectives, target audience, curriculum, and expected outcomes. This template includes icons, graphics, and color schemes that align with the organization's branding and make the infographic visually appealing. This infographic serves as an effective marketing tool to attract potential participants, showcase the value of the program, and communicate the positive outcomes of joining the leadership development journey.
5 diapositivas
Feedback Rating Smile Icons Presentation
Light up your presentation with a playful visual that turns audience feedback into clear, colorful insights. This slide helps you compare ratings, highlight sentiment patterns, and present review data in a friendly, memorable way. Perfect for surveys, reports, and performance reviews. Fully compatible with PowerPoint, Keynote, and Google Slides.


20 diapositivas
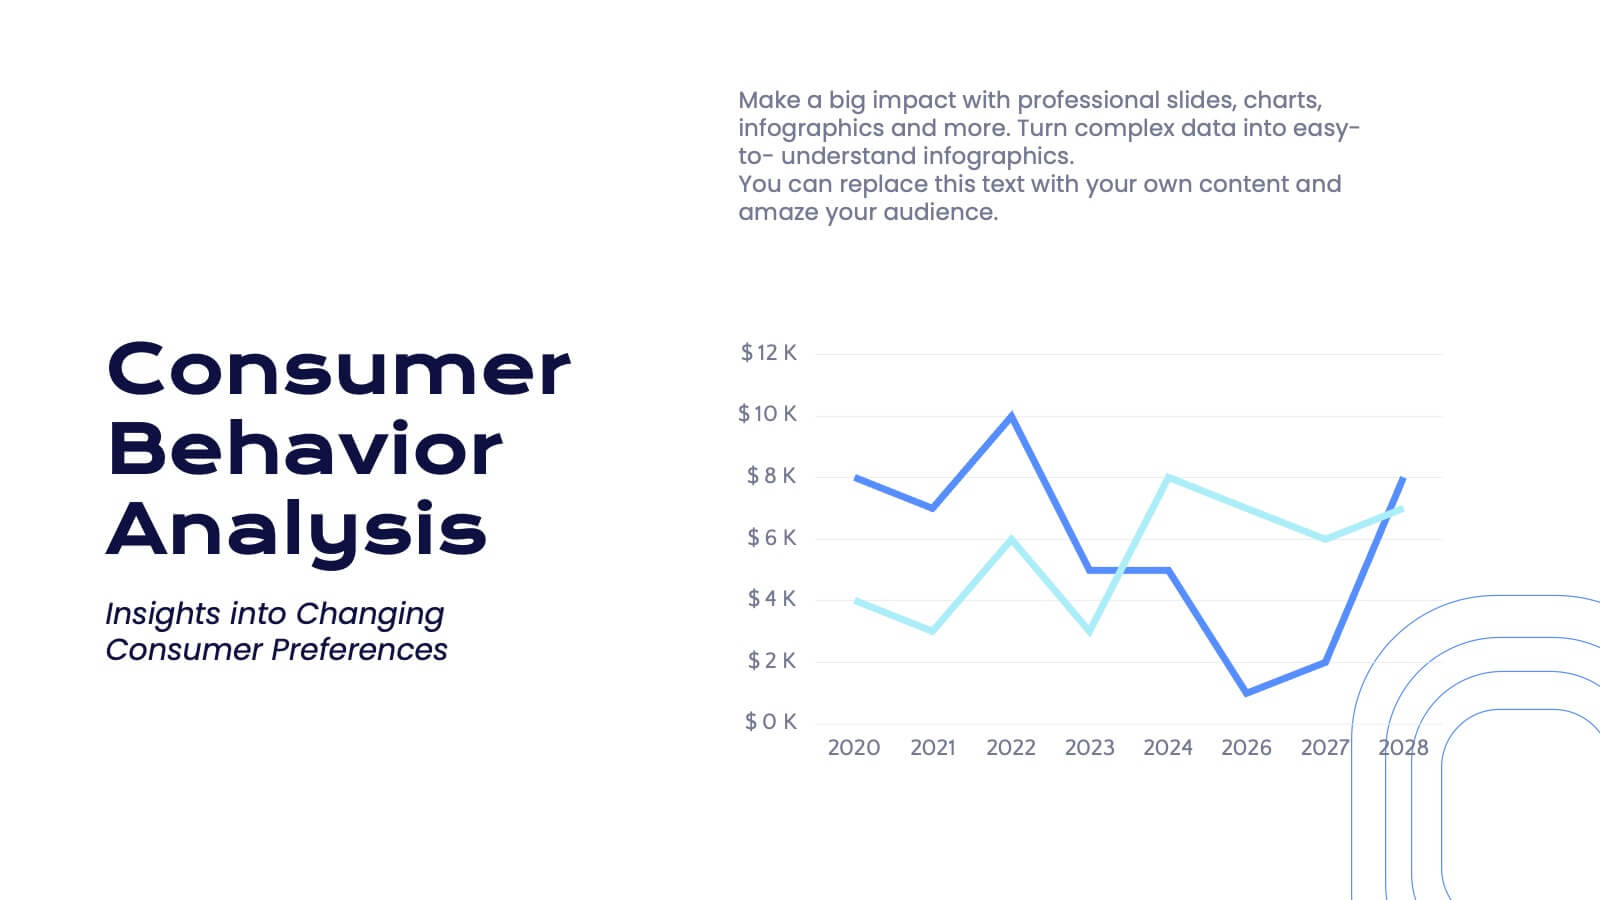
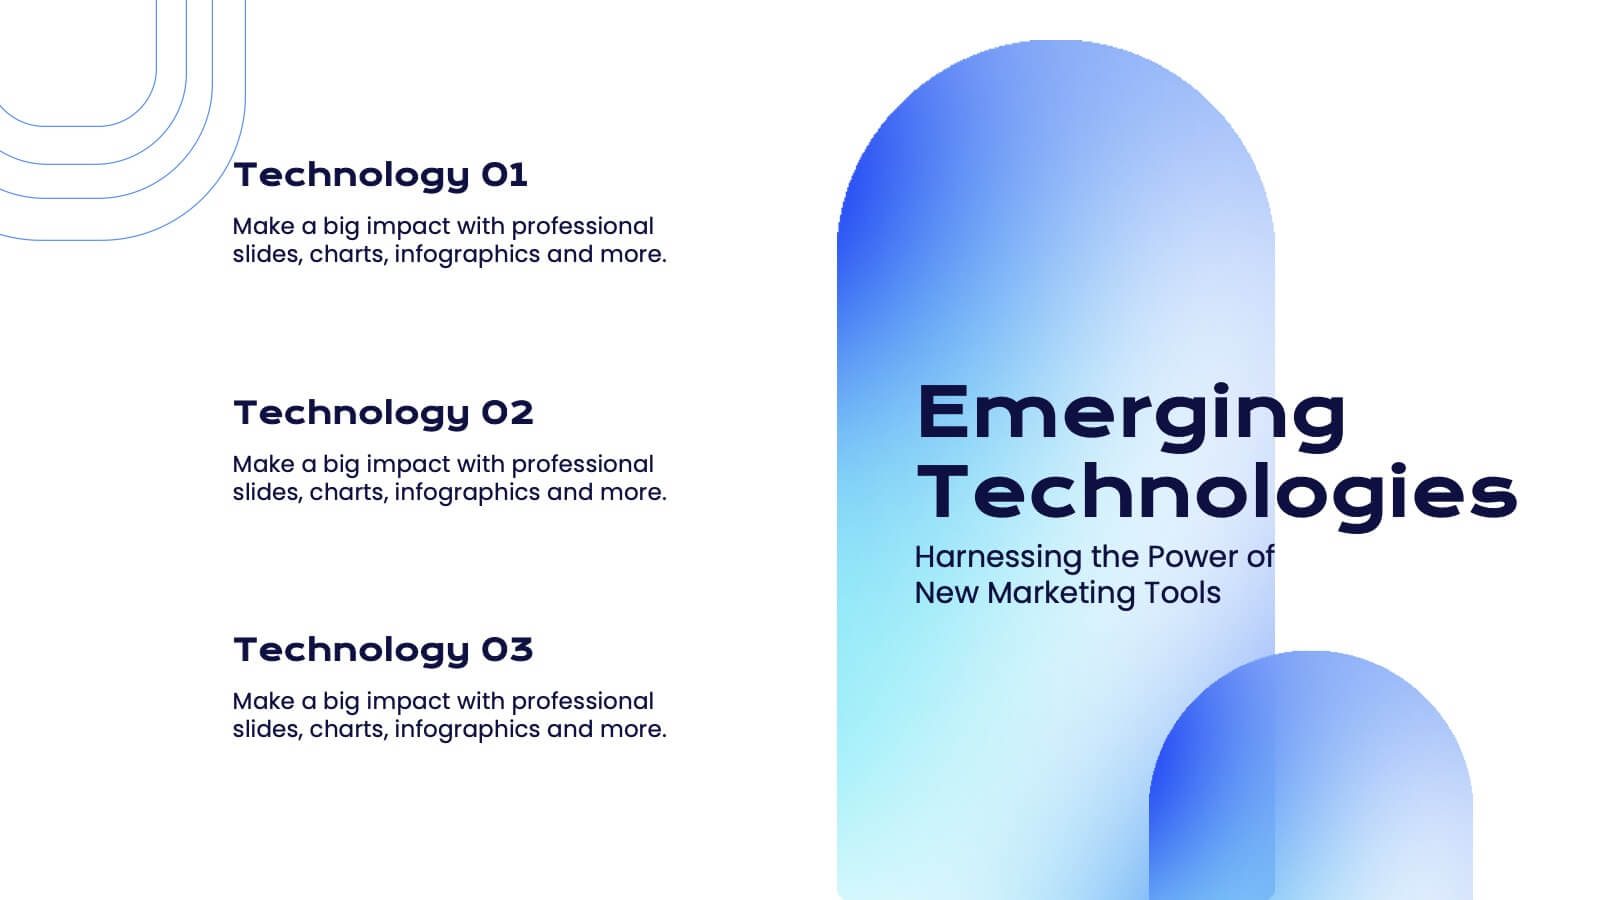
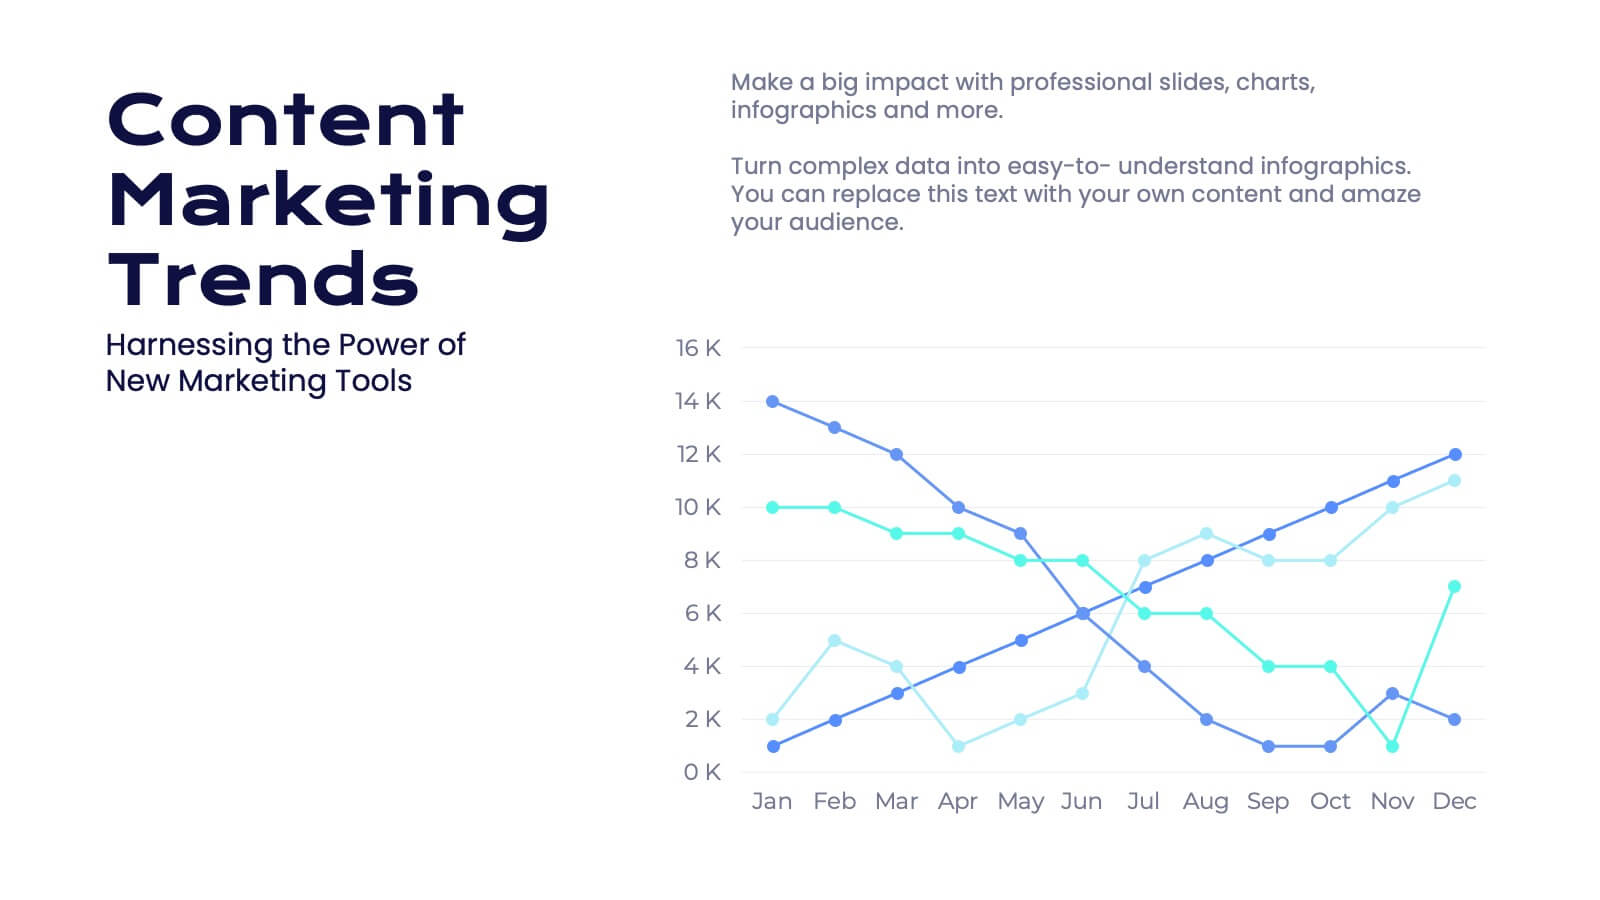
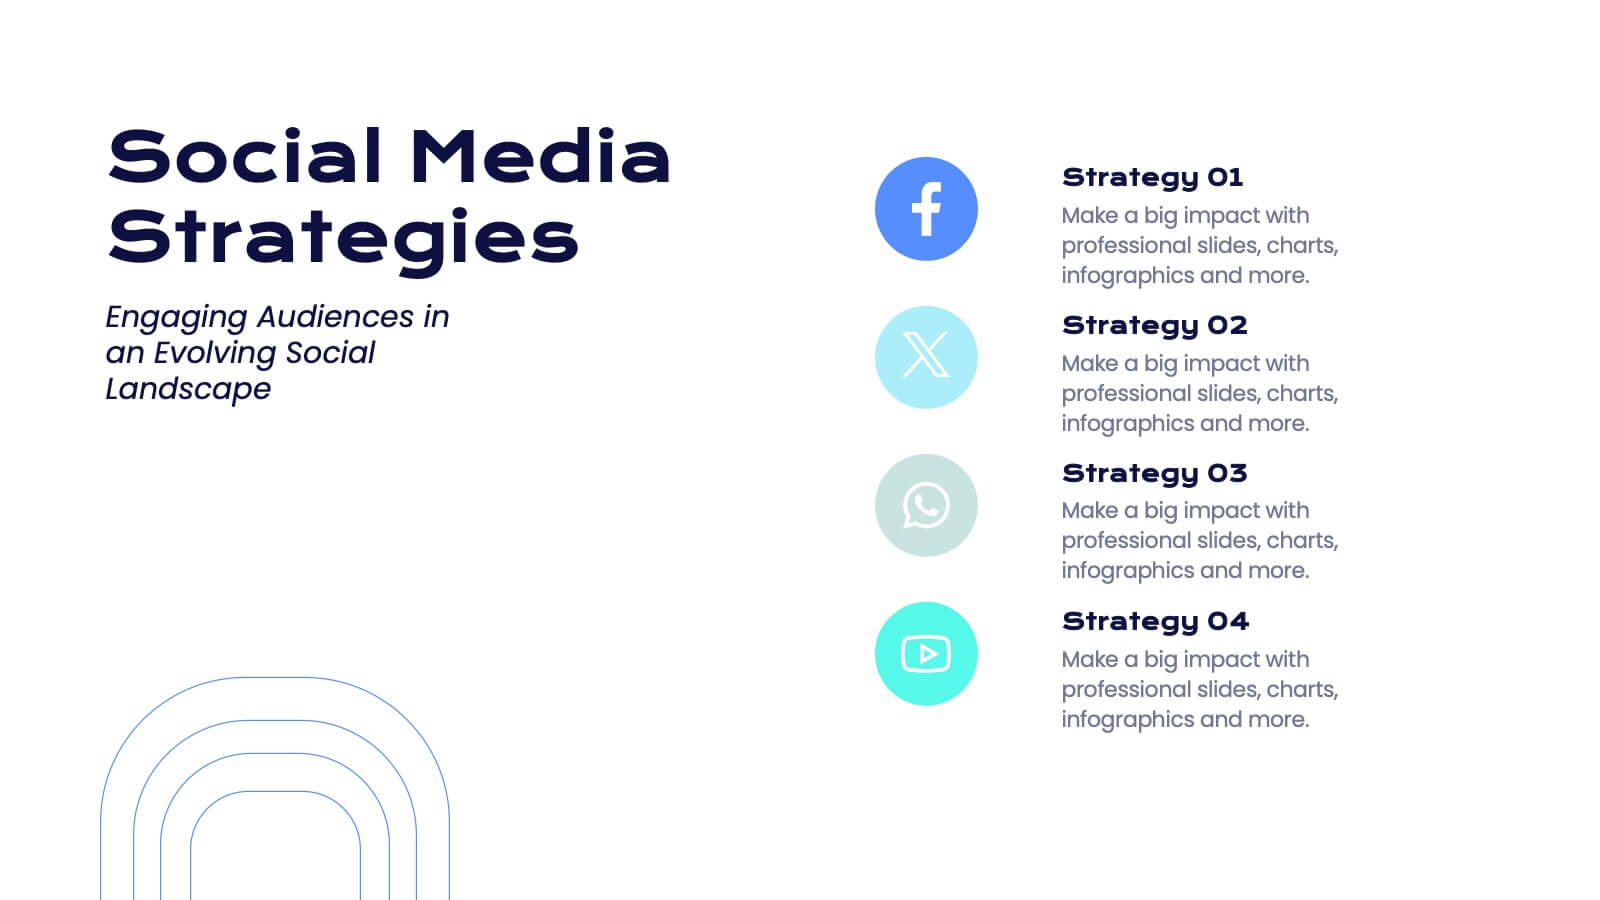
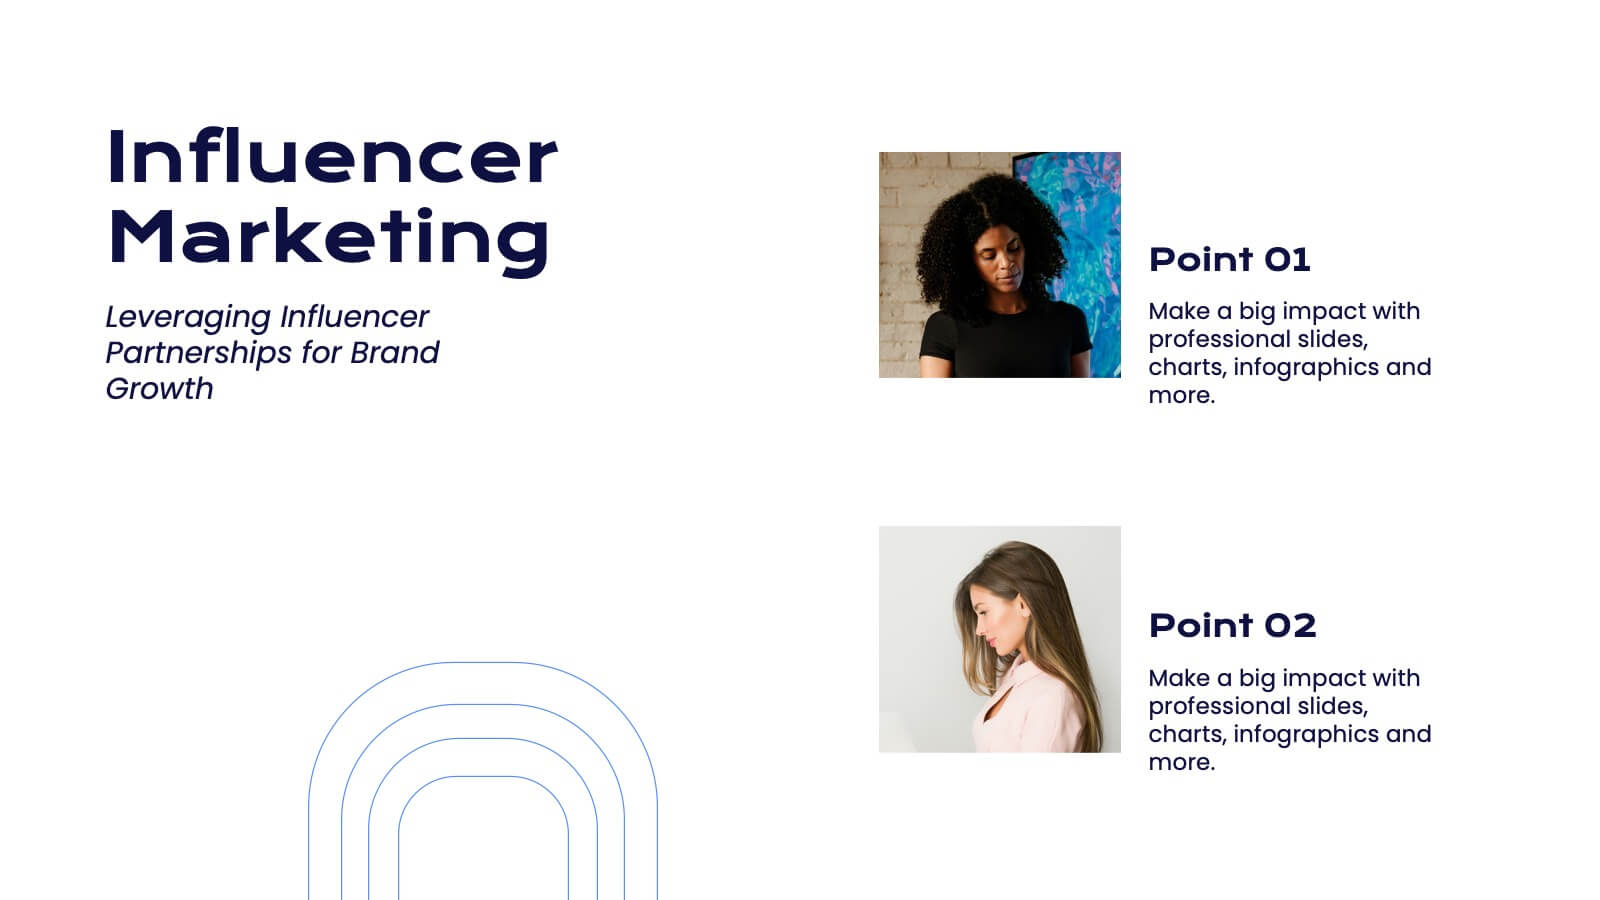
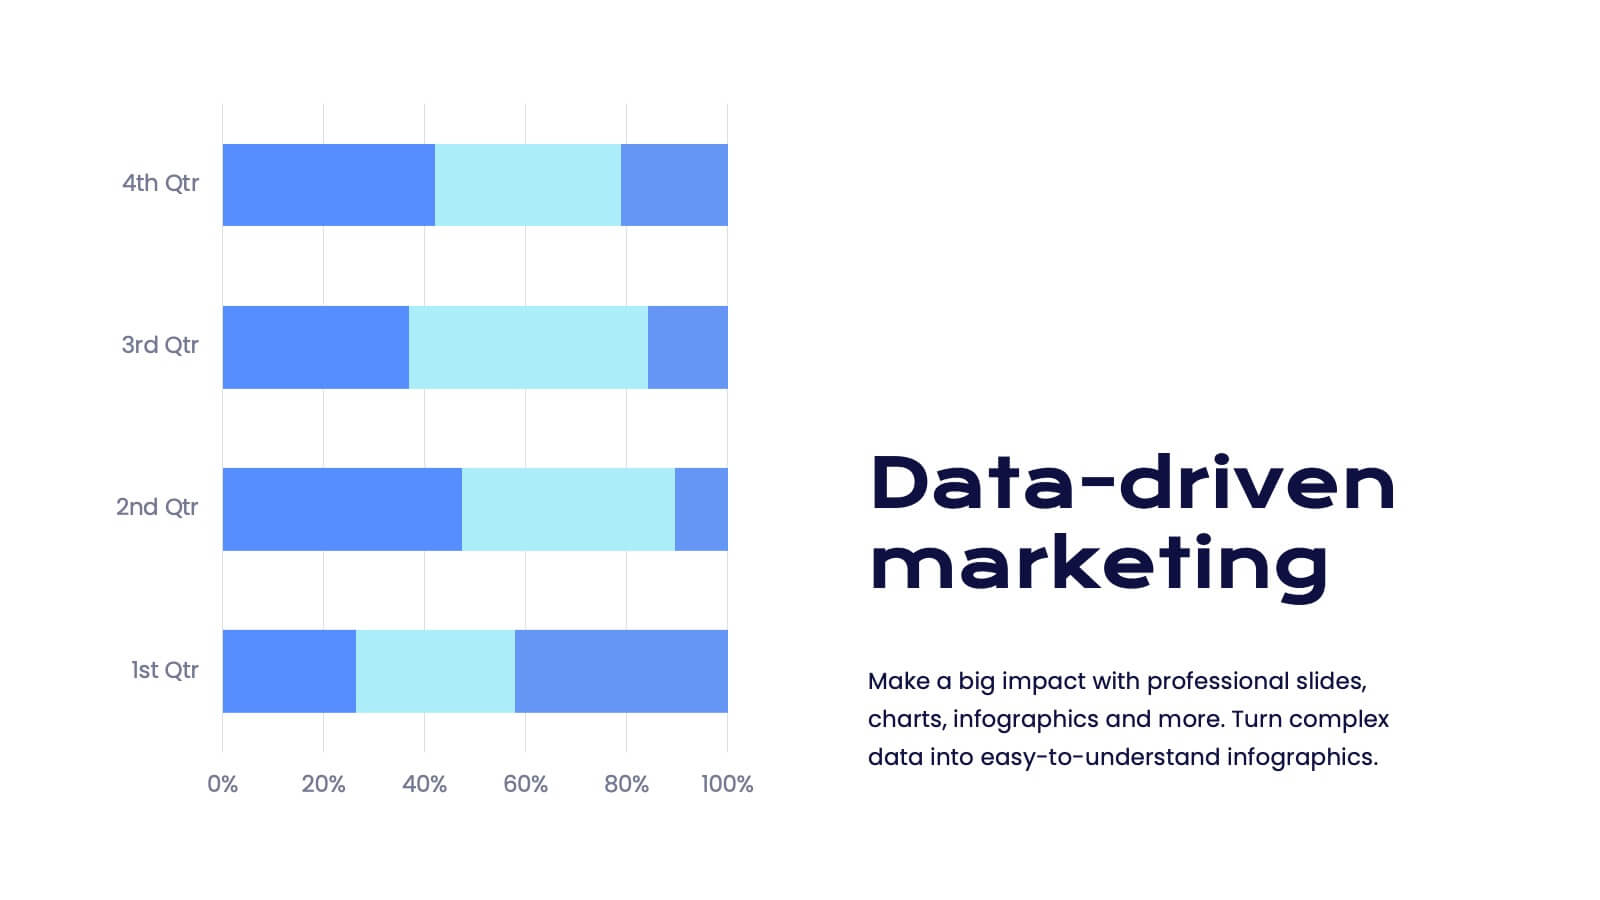
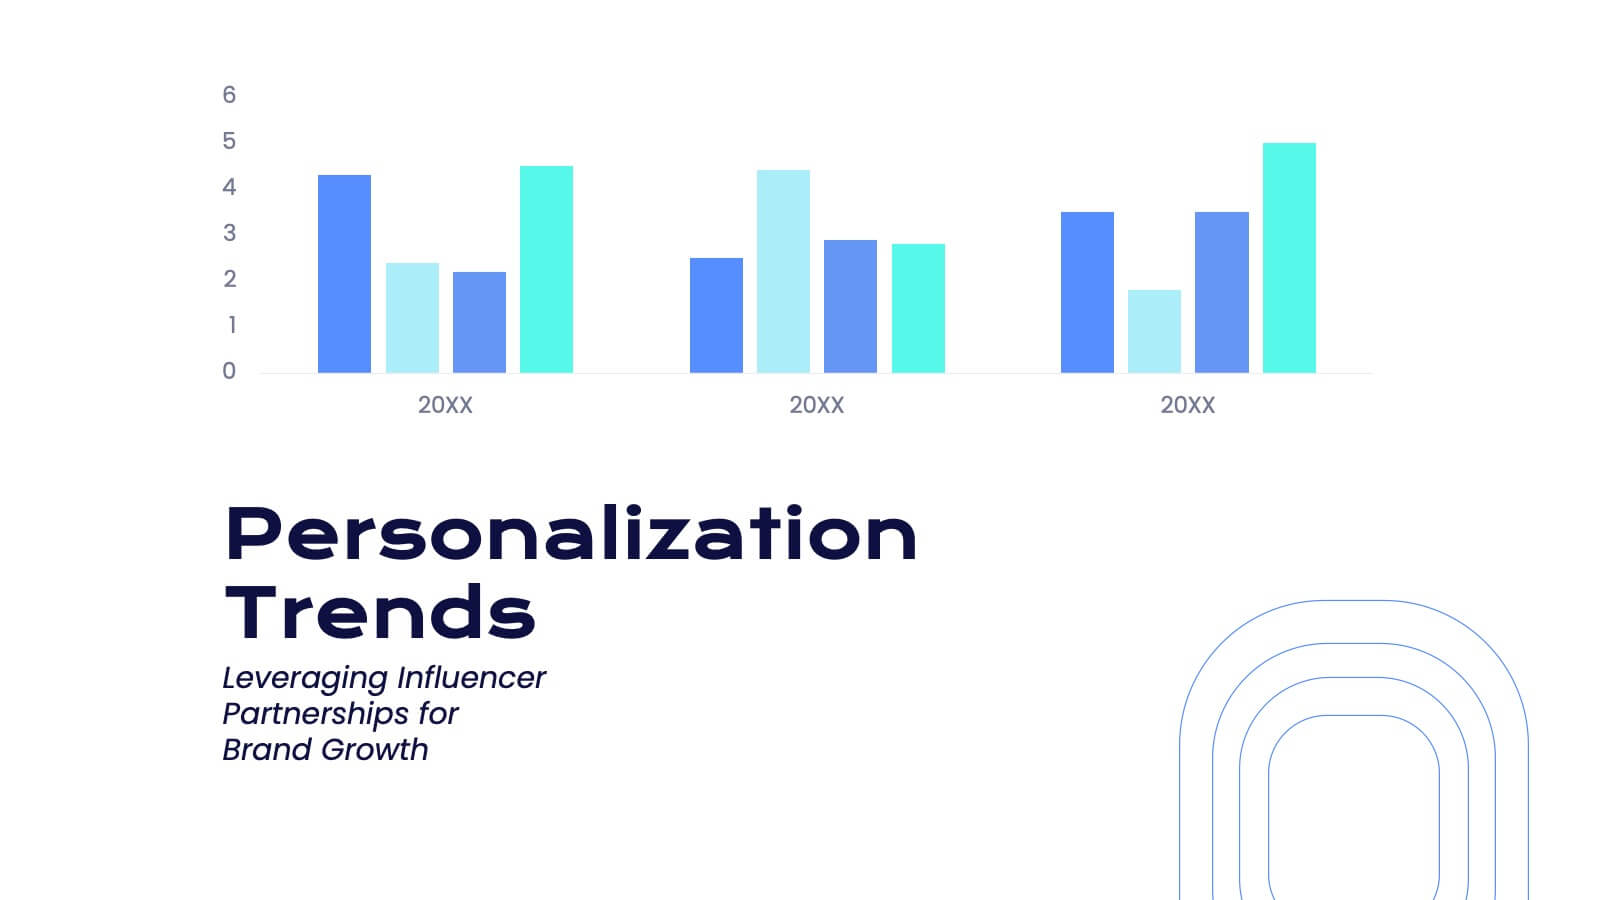
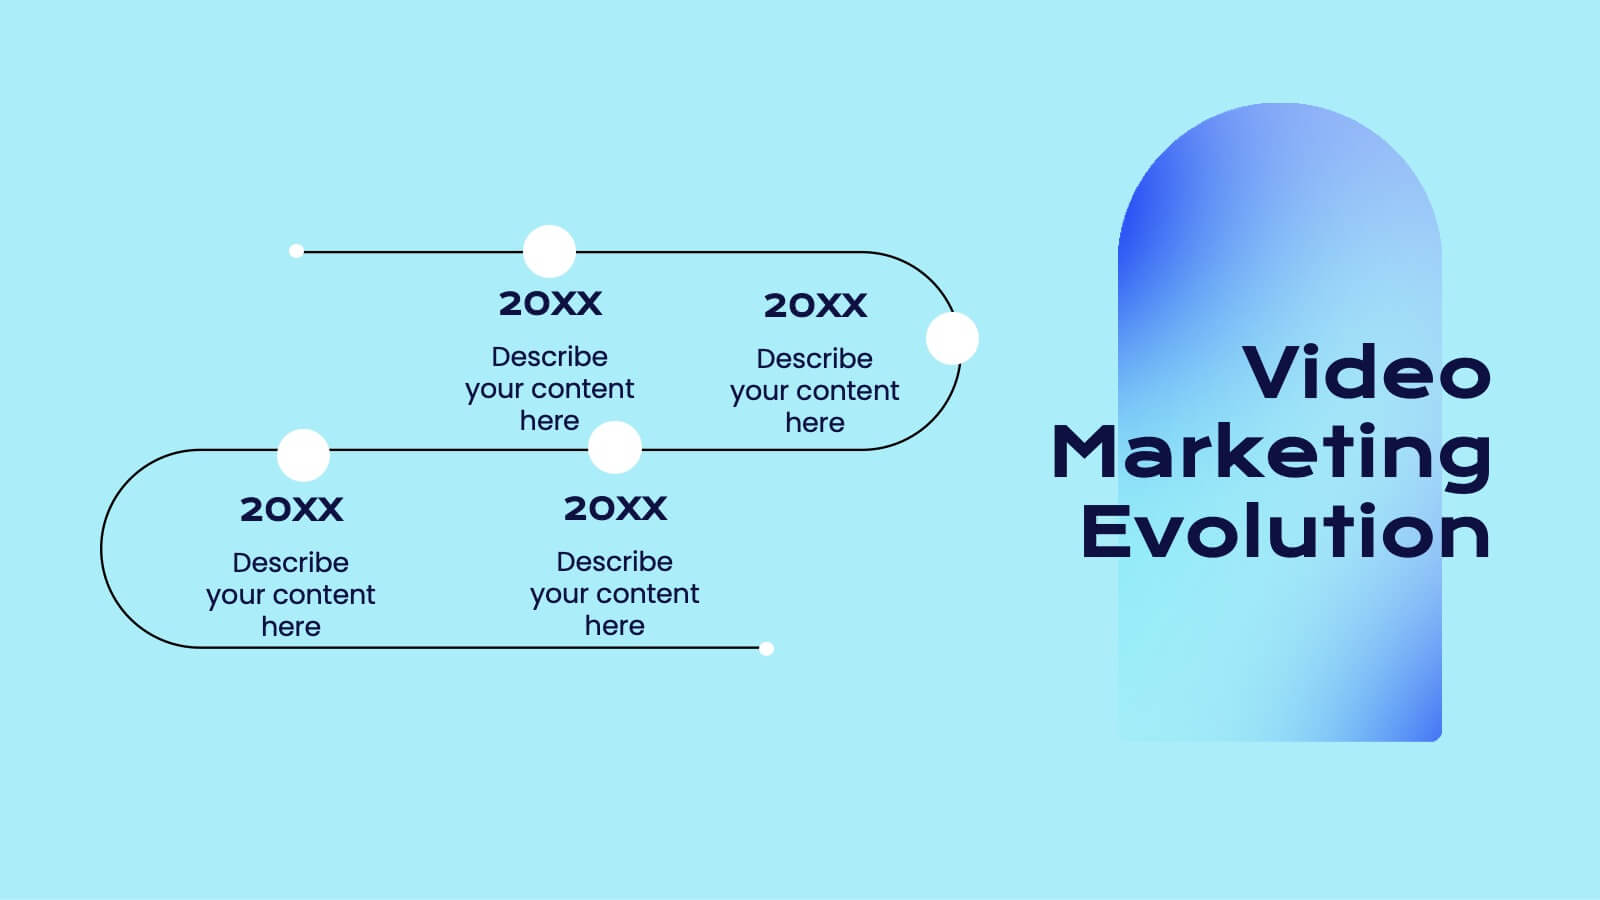
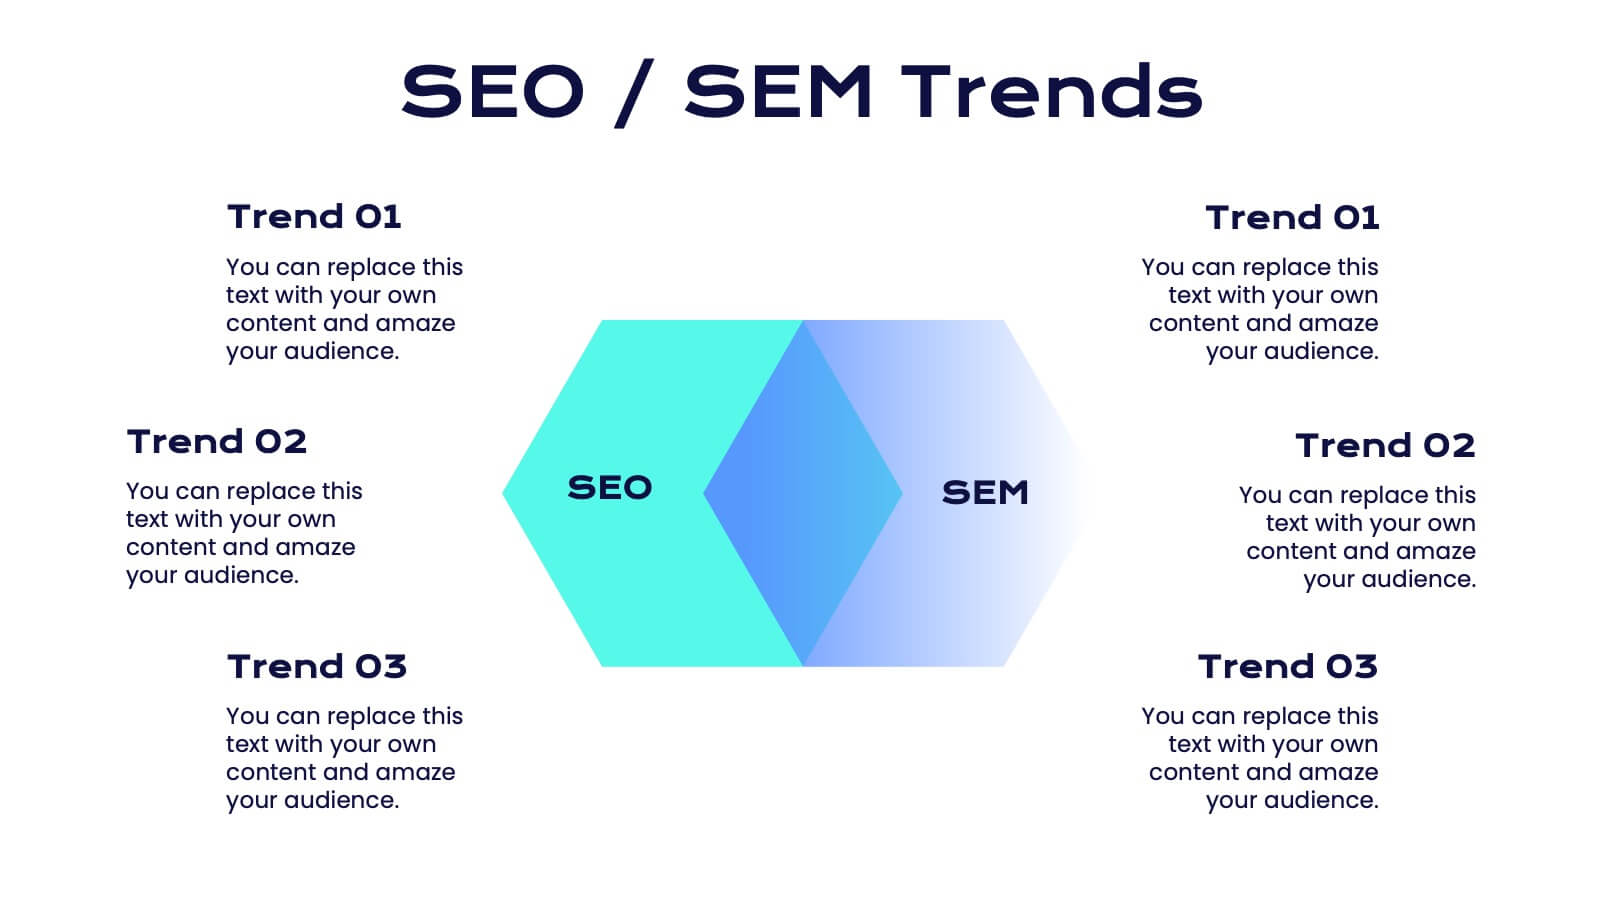
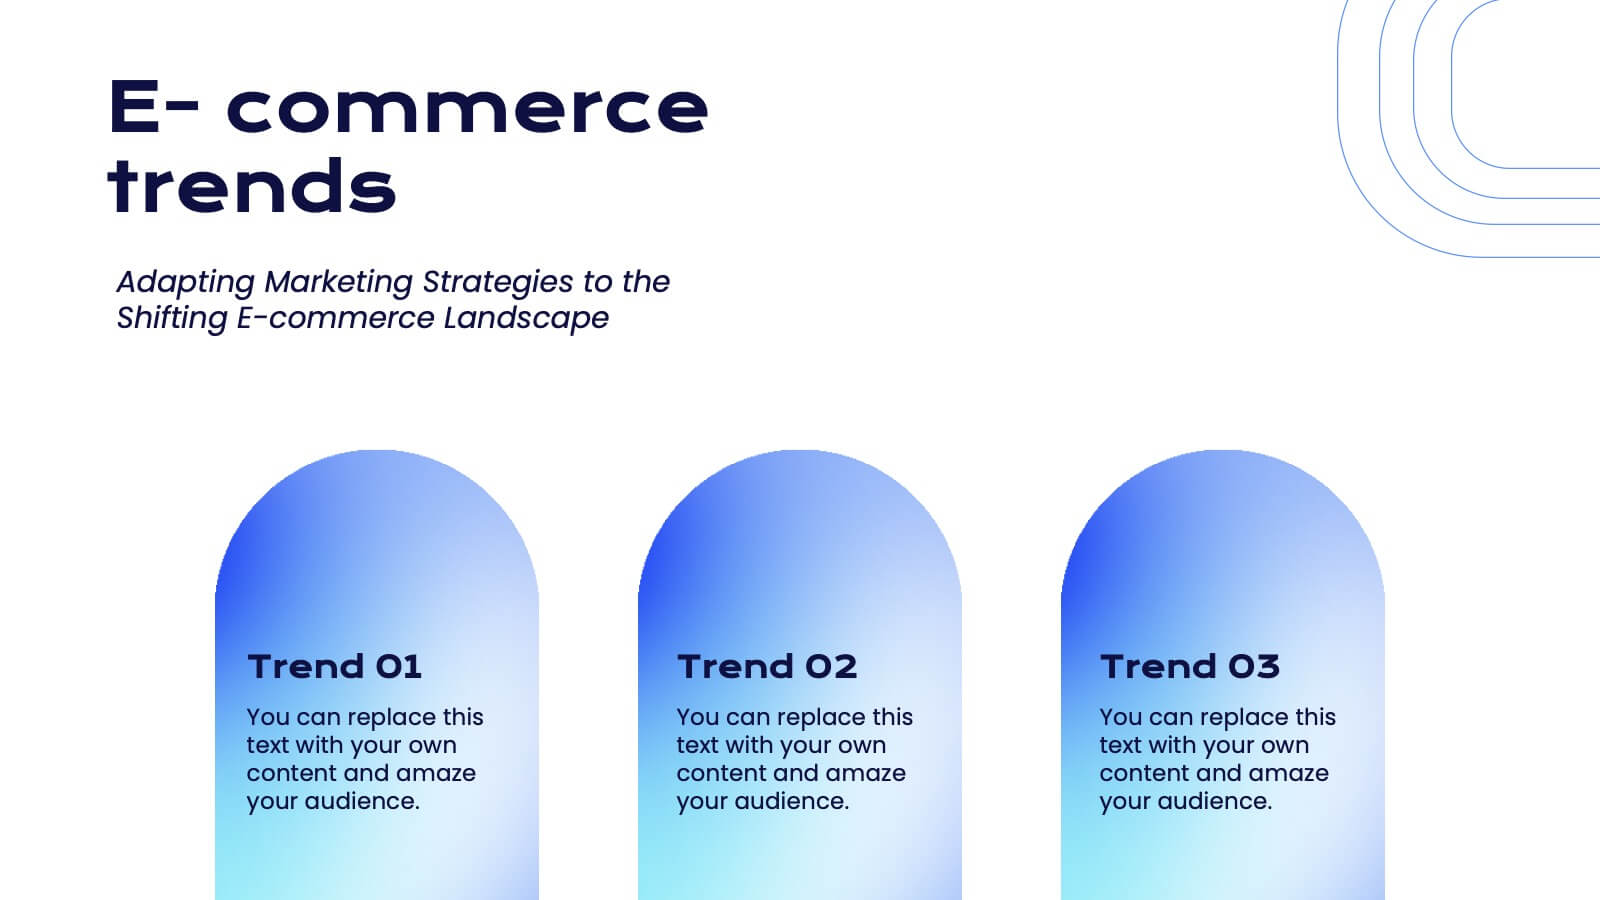
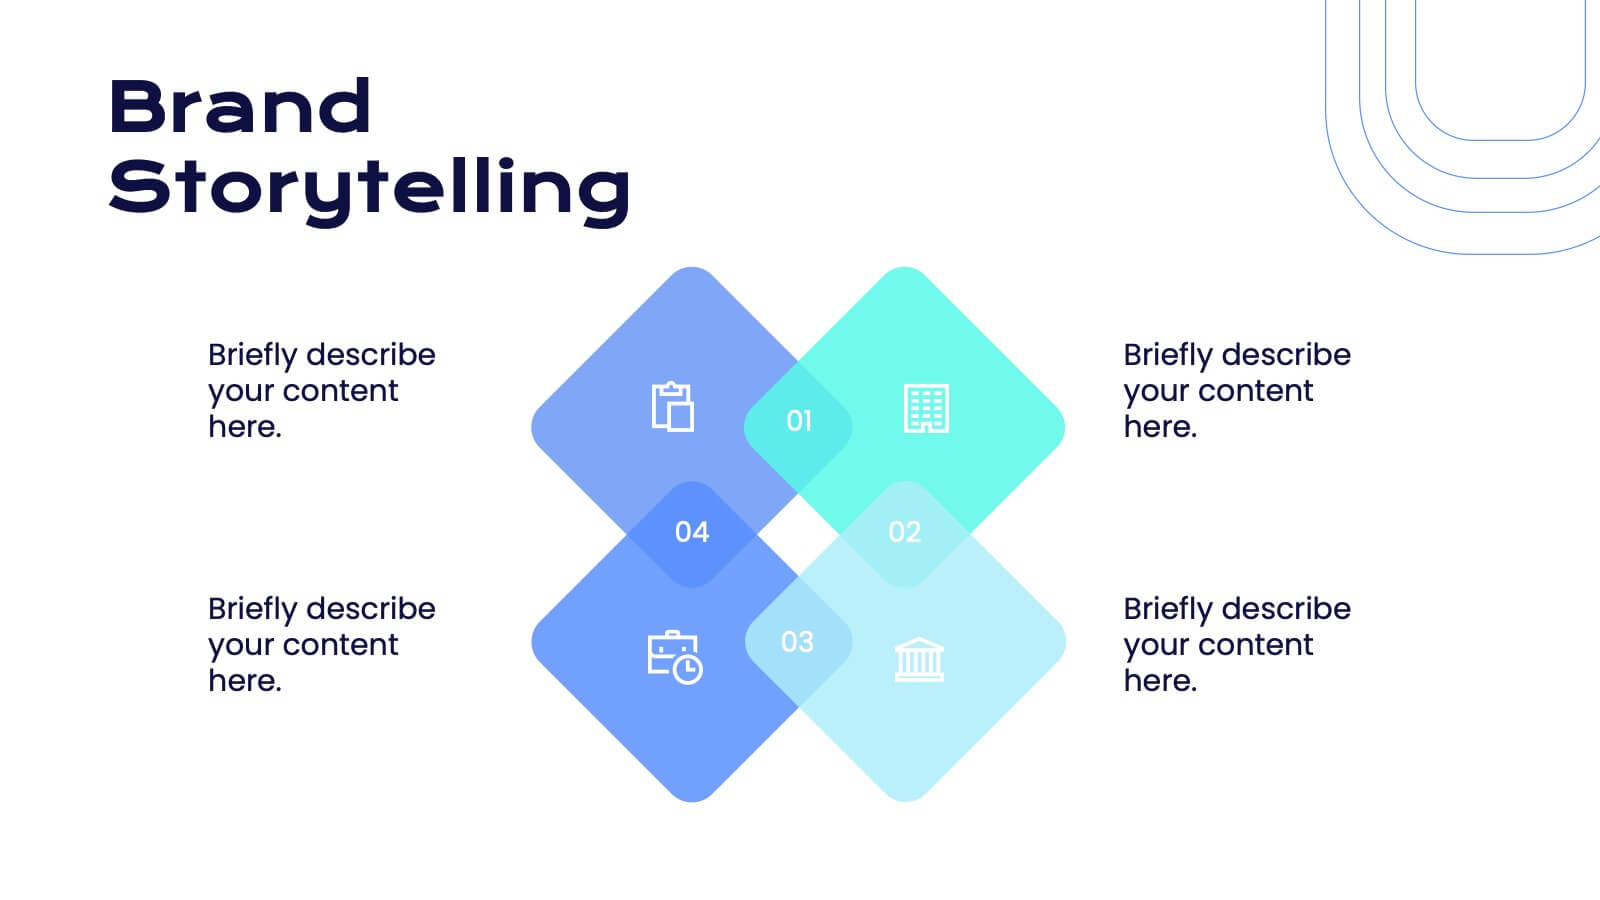
Faerie Digital Marketing Strategy Plan Presentation
Create a compelling marketing strategy with this sleek, modern template! It covers key topics like consumer behavior, social media strategies, and emerging trends. Perfect for showcasing insights in a clear, data-driven format. Fully customizable, it works seamlessly with PowerPoint, Keynote, and Google Slides for effective presentations.


4 diapositivas
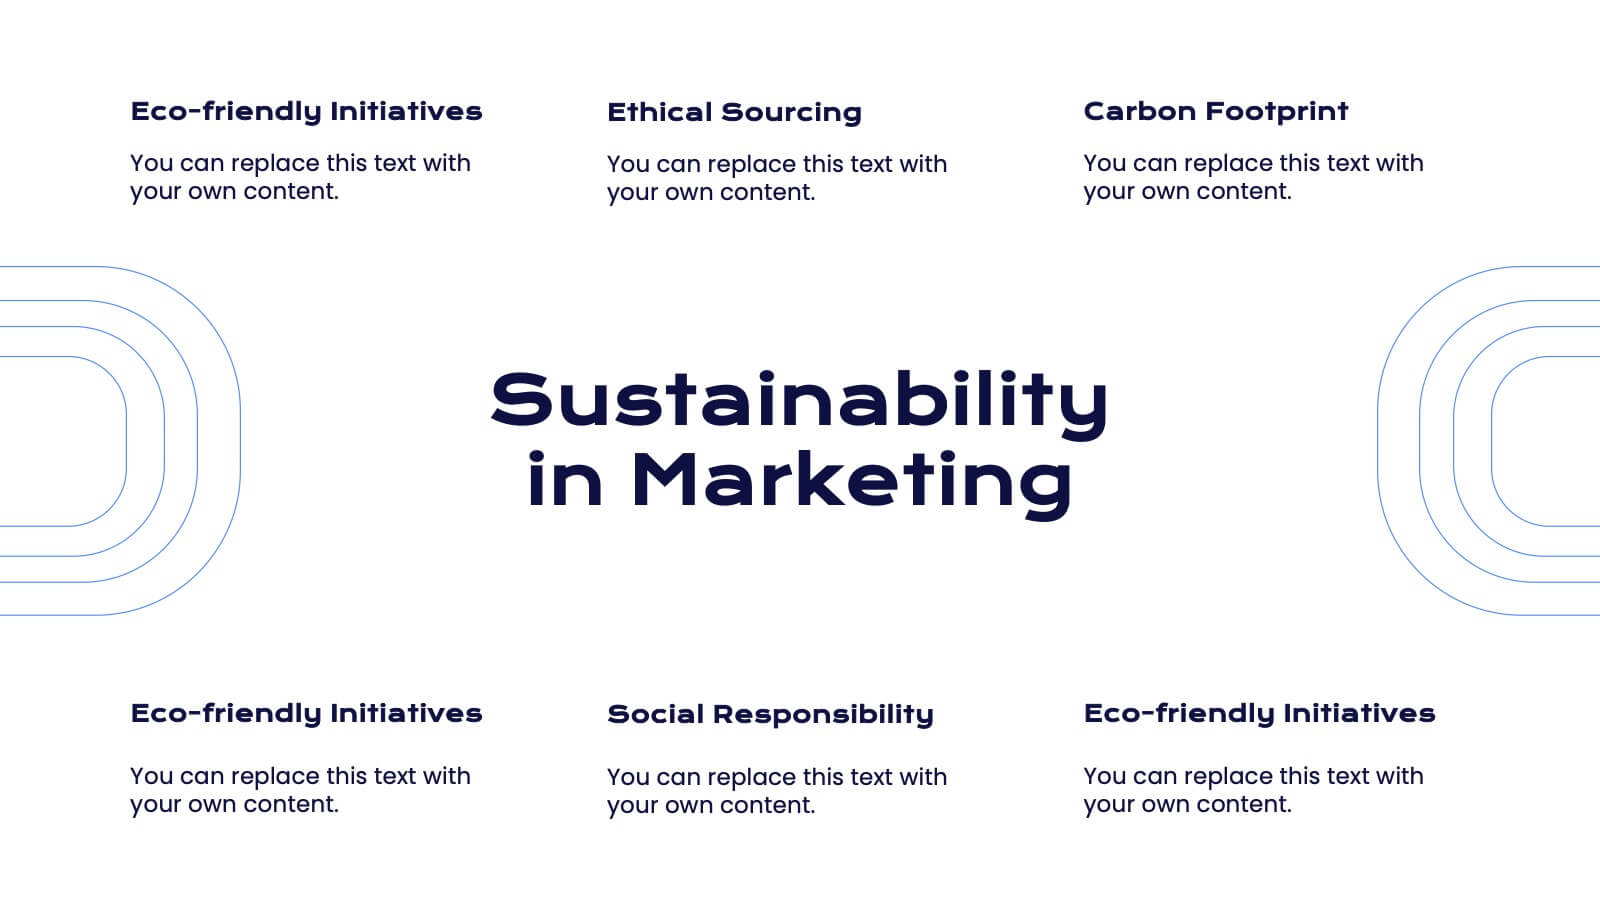
Green Initiative Report Deck Presentation
Show your sustainability story with a modern, eco-inspired presentation built to highlight green initiatives, progress reports, and environmental goals. Its clean layout makes data and insights easy to follow while maintaining a professional tone. Fully customizable and compatible with PowerPoint, Keynote, and Google Slides for effortless presentation design.