
Features
- 8 Unique slides
- Fully editable and easy to edit in Microsoft Powerpoint, Keynote and Google Slides
- 16:9 widescreen layout
- Clean and professional designs
- Export to JPG, PDF or send by email


Do you have any questions?
Recommend


4 slides
Cost Breakdown Table Presentation
Make your numbers speak with style using a clean, structured layout that simplifies pricing and cost analysis. This presentation is perfect for comparing plans, budgets, or expenses in a clear and visually engaging way. Fully editable and compatible with PowerPoint, Keynote, and Google Slides.


6 slides
Corporate Foundation and Pillars Presentation
Highlight your company's core principles with this visually impactful pillar-style slide. Designed to illustrate business frameworks, strategies, or guiding values, this layout helps communicate stability and growth. Fully customizable in PowerPoint, Keynote, and Google Slides for seamless brand alignment.


5 slides
Business Success Case Study Presentation
Showcase impactful results with the Business Success Case Study Presentation template. This structured layout highlights key milestones, challenges, and solutions in a visually engaging format, making it perfect for demonstrating business achievements and growth strategies. Fully editable and compatible with PowerPoint, Keynote, and Google Slides, it’s ideal for case studies, reports, and business reviews.


5 slides
Problem-Solving and Challenge Resolution Presentation
Solve problems efficiently with a structured approach using this Problem-Solving and Challenge Resolution template. Featuring a unique visual of connecting solutions like a plug and socket, this slide helps break down problems, present solutions, and demonstrate effective decision-making strategies. Ideal for brainstorming sessions, business strategy meetings, and risk management discussions, this template is fully customizable and compatible with PowerPoint, Keynote, and Google Slides.


4 slides
Goal-Oriented 30 60 90 Plan Outline Presentation
Make your first impression unforgettable with this bold, easy-to-follow layout that breaks down goals into manageable steps. A 30-60-90 plan helps teams and new hires align on expectations, outcomes, and milestones. Perfect for onboarding or strategic planning. Fully editable in PowerPoint, Keynote, and Google Slides for maximum compatibility.


20 slides
Fenrir Investor Pitch Presentation
Deliver a compelling and persuasive pitch with this sleek and professional investor pitch deck! It covers essential sections like problem and solution, market opportunity, business model, financials, and growth strategy to ensure your vision is clearly communicated. Ideal for startup fundraising or business presentations, this template is fully compatible with PowerPoint, Keynote, and Google Slides.


6 slides
Governance Structure Overview Presentation
A clear, polished flow of ideas makes this slide instantly engaging, guiding viewers through each essential component with ease. This presentation explains how an organization structures oversight, responsibilities, and decision-making to ensure accountability and performance. Clean icons and balanced spacing keep everything easy to follow. Fully compatible with PowerPoint, Keynote, and Google Slides.


7 slides
Mind Map Program Infographic Presentation
Mind Maps are appealing visuals that are easy to follow. Use our high quality template to create a mind map infographic that explains your concepts, or use it to highlight the benefits of your product in an educational way. Map out your ideas and create a visual that can be explored from many different directions. This template is suitable for both business and educational applications, so you can use it at work, school or as part of your portfolio. It’s easy to customize and compatible with PowerPoint, Keynote and Google Slides. Easily create a dynamic and engaging project in just minutes!


20 slides
Apex Content Marketing Pitch Deck Presentation
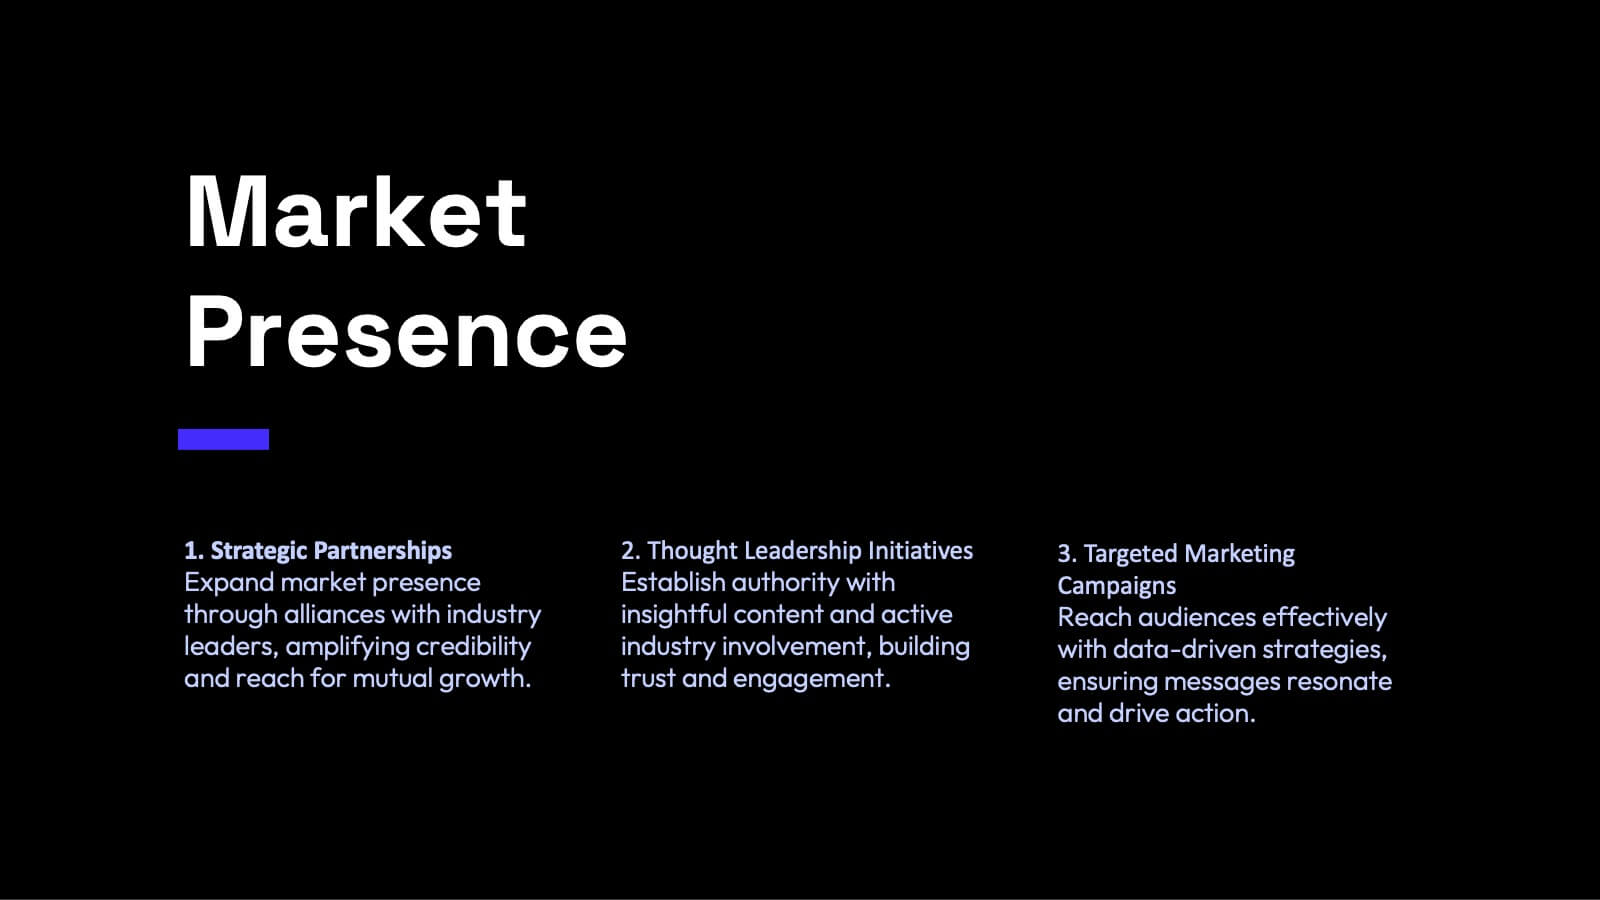
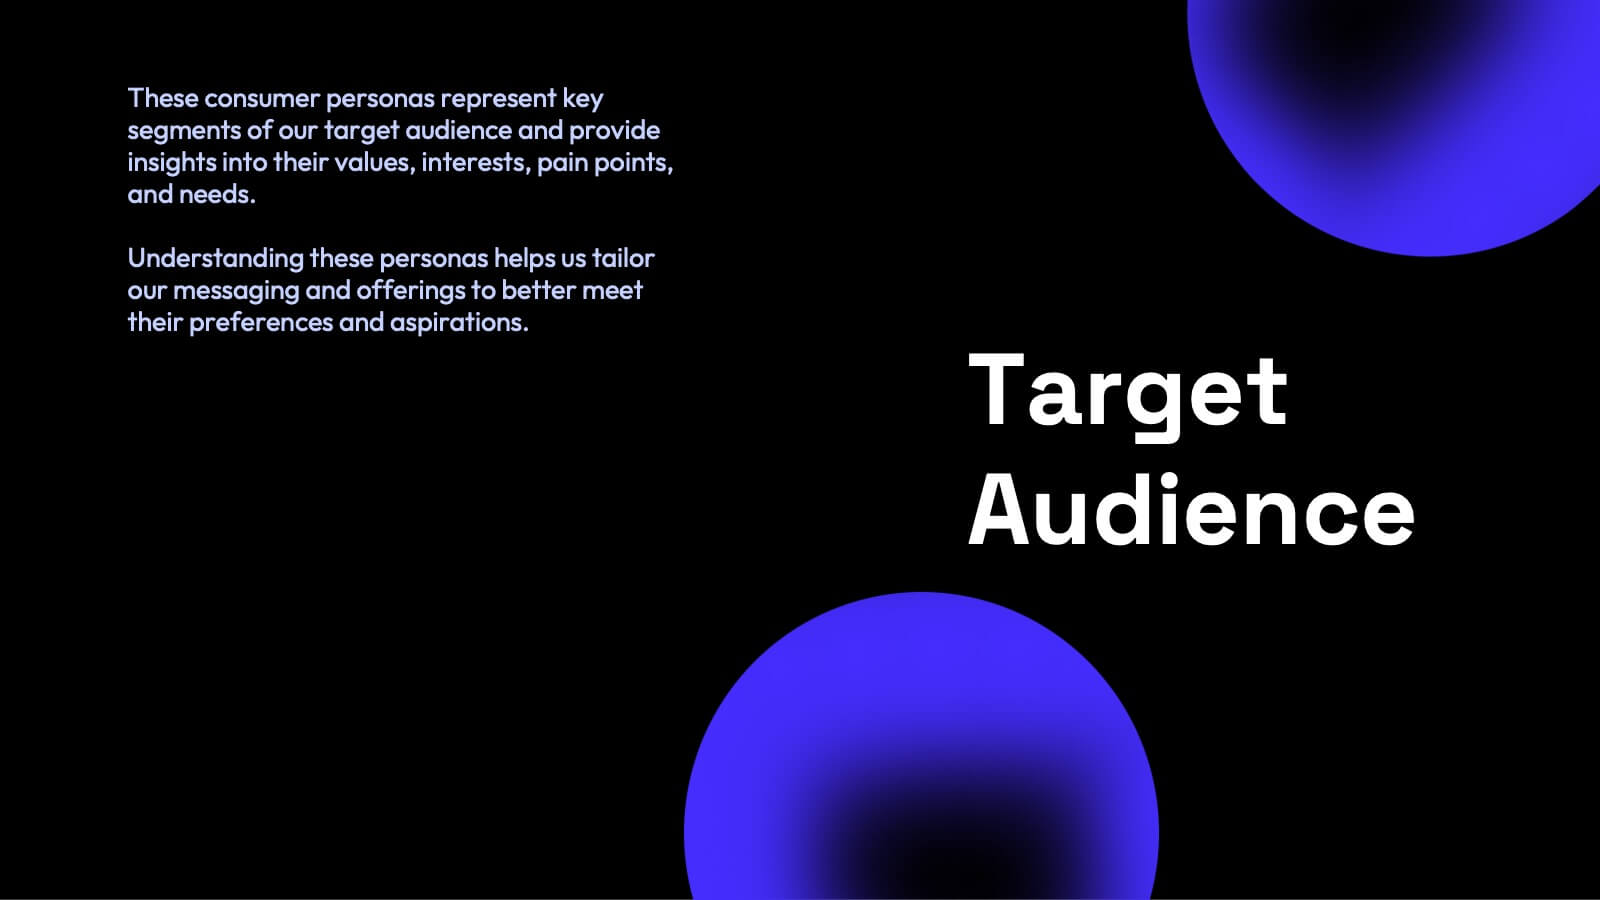
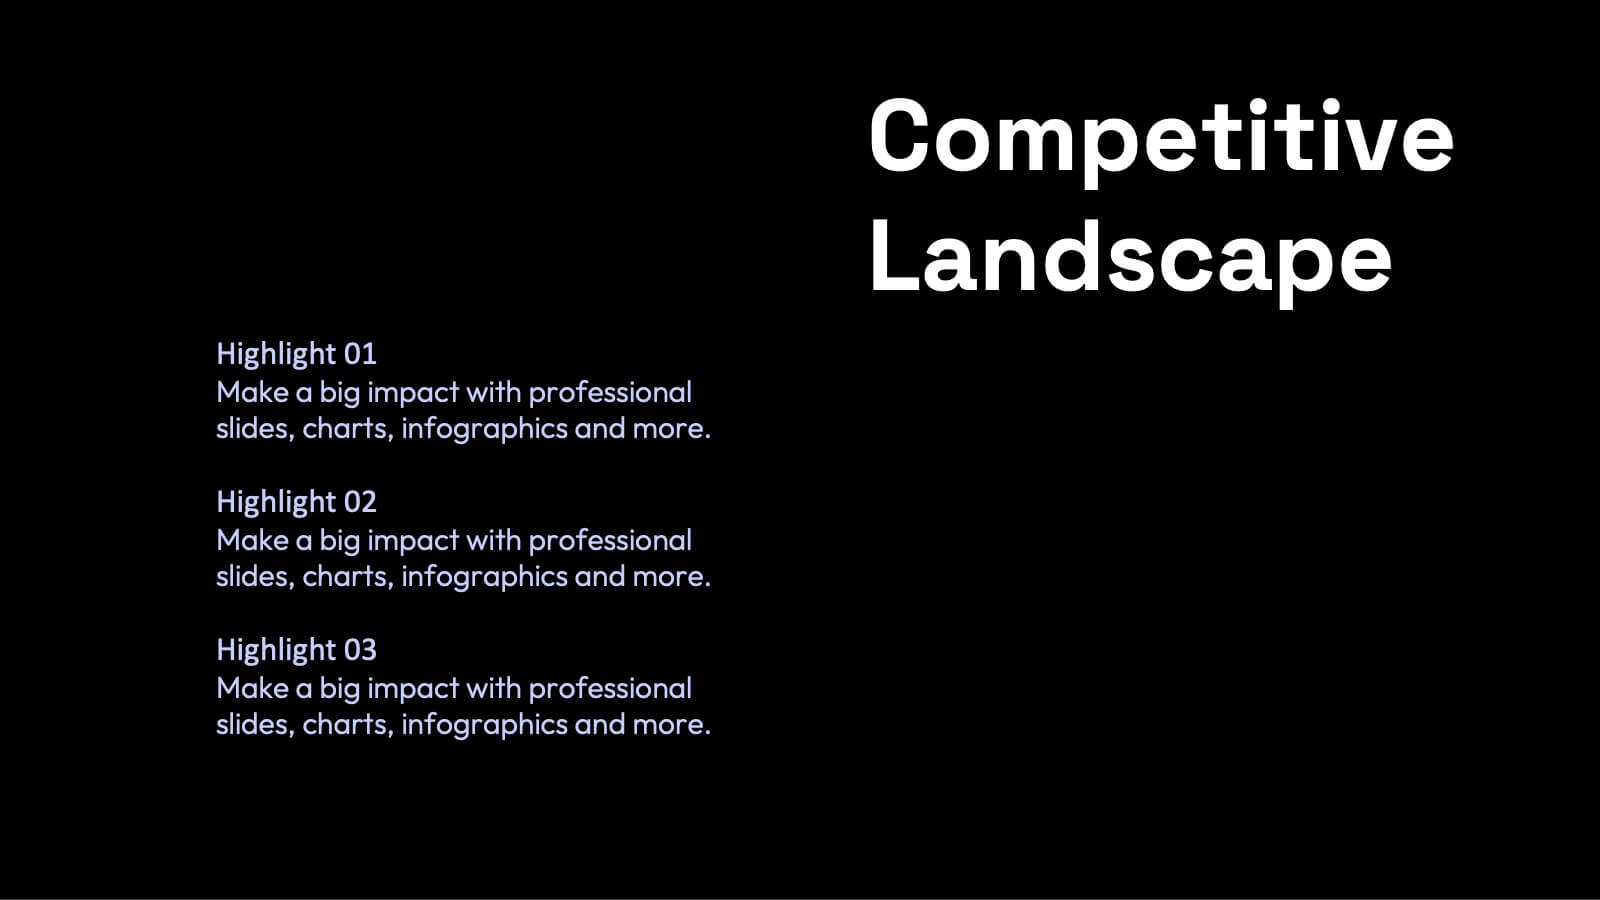
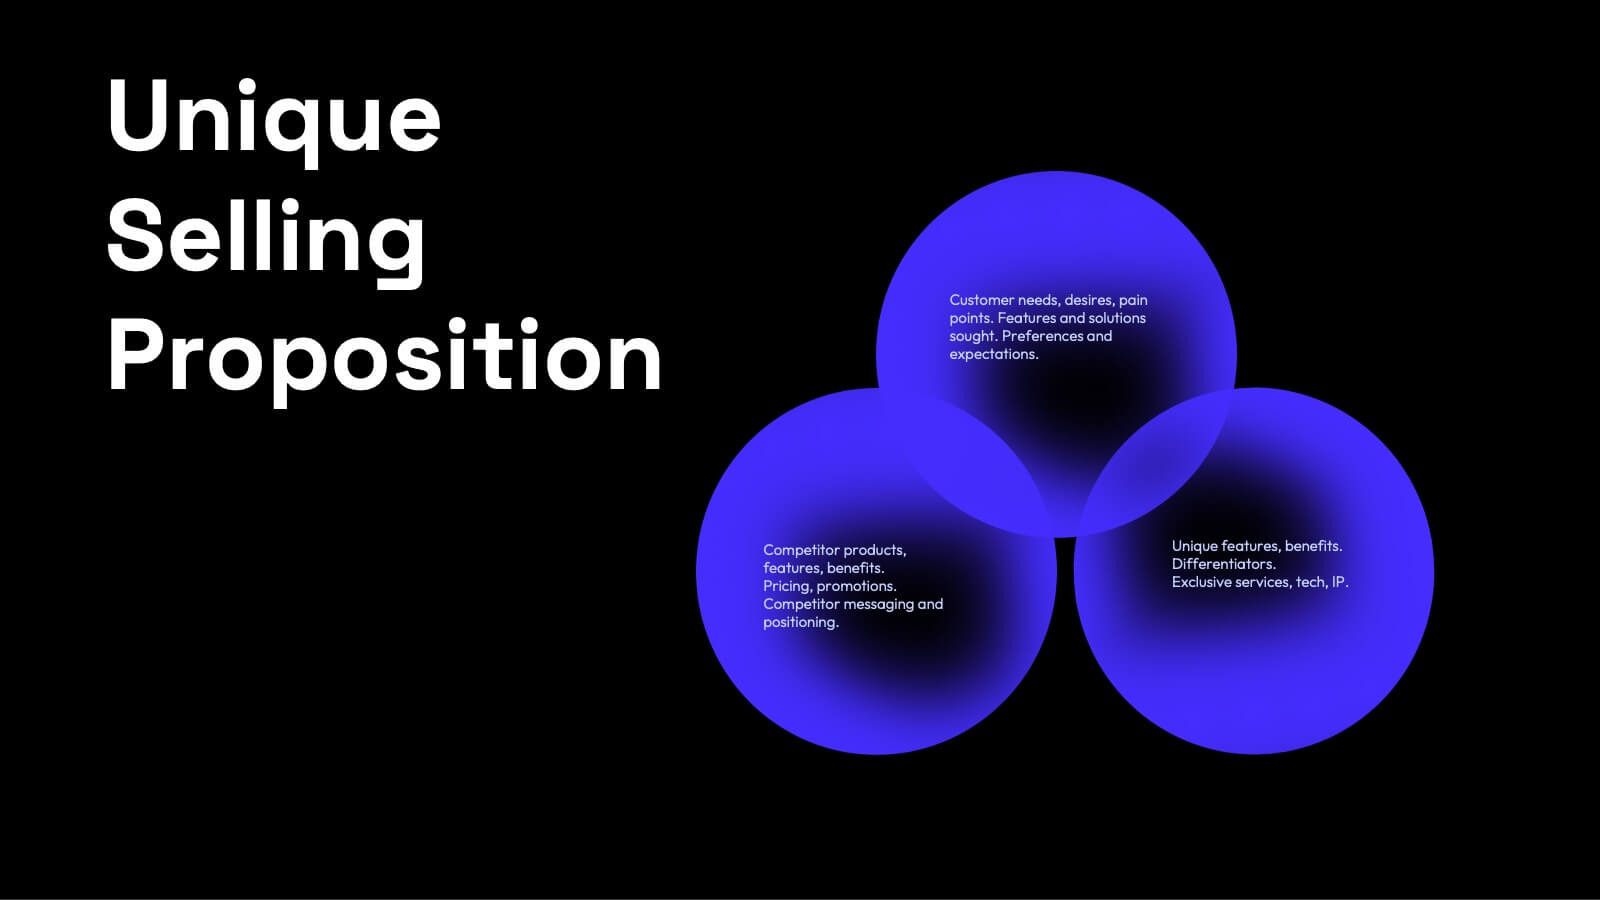
Ignite your marketing strategy with this captivating pitch deck! Perfect for showcasing content marketing plans, it features slides on company history, target audience, and unique selling propositions. Make a lasting impression with sleek, modern designs and compelling content. Compatible with PowerPoint, Keynote, and Google Slides for a smooth presentation experience on any platform.
6 slides
Key Project Milestone Tracker Presentation
Stay on top of project timelines with this clean and colorful milestone tracker. Ideal for Gantt-style overviews, this slide helps teams visualize progress across months for multiple tasks. Compatible with PowerPoint, Keynote, and Google Slides for seamless editing.


8 slides
Yearly Calendar Planning Presentation
The "Yearly Calendar Planning" presentation template is designed to help visualize task progress over a 12-month period. Each row represents a specific task, labeled as Task 01 through Task 04, with each month represented by a square. The color coding—orange for "Done", gray for "In Progress", red for "Revision", and yellow for "Hold On"—provides a clear visual status of each task's progress. This template is ideal for project managers and team leads who need to track and report on the status of multiple tasks over the course of a year, ensuring a comprehensive view of project timelines and milestones.


7 slides
Work From Home Benefits Infographic
The modern digital era has ushered in a revolution: the feasibility of working from home. Our work from home benefits infographic, crafted with a crisp white palette highlighted by shades of red and subtle black touches, dives deep into the multifaceted advantages of remote work. Whether it's the flexibility in hours, reduced commute stress, or the savings made, this template sheds light on every facet. This infographic template is perfect for professionals, team leaders, and organizations keen to adopt this model, its seamlessly compatible with PowerPoint, Keynote, and Google Slides.


6 slides
Historical Data Timeline Visualization
Showcase historical progression with clarity using the Historical Data Timeline Visualization. Designed for presenting chronological data points, this template combines circle elements with image icons and milestone labels—perfect for educational or historical presentations. Fully editable in Canva, PowerPoint, Keynote, and Google Slides for seamless customization.


7 slides
Tree Diagrams Infographics Presentation Template
Tree diagrams are visual diagrams of different outcomes that can result when you take a certain action. They can be used to depict the various possible outcomes of an event or problem, helping you understand your options and choose the best one for a given purpose. They can be used to show statistical probabilities, or general issues that result in many possible ways of moving forward. Use this template to create your own tree diagram, as a new business planning tool to develop goals and objectives. This tree diagram template can help you visualize any project, large or small.


6 slides
Big Data Solutions Infographics
Discover the power of Big Data Solutions with our customizable infographic template. This template is fully compatible with popular presentation software like PowerPoint, Keynote, and Google Slides, allowing you to easily customize it to illustrate and communicate various aspects of big data solutions. The Big Data Solutions infographic template offers a visually engaging platform to explain the principles, technologies, and benefits of harnessing big data for insights and decision-making. Whether you're a data professional, business leader, or simply interested in the world of big data, this template provides a user-friendly canvas to create informative presentations and educational materials. Deepen your understanding of Big Data Solutions with this SEO-optimized infographic template, thoughtfully designed for clarity and ease of use. Customize it to showcase data sources, analytics tools, data storage options, and the real-world applications of big data in various industries, ensuring that your audience gains valuable insights into this transformative field. Start crafting your personalized infographic today to explore the world of Big Data Solutions.


7 slides
Breast Cancer Awareness Infographic Presentation
A Breast Cancer Awareness infographic is a visual representation of important information related to breast cancer awareness, such as statistics, risk factors, prevention methods, screening guidelines, treatment options, and survivorship. The goal of this breast cancer awareness infographic is to educate people about breast cancer, increase awareness of the disease, and encourage early detection and treatment. This template has a pink theme and many helpful illustrations. It is fully editable and can be designed in various styles and formats, including graphs, illustrations, and photographs.


23 slides
Lexicon Startup Pitch Deck Template Presentation
The Startup Pitch Deck Presentation Template provides a modern and professional design with 23 fully customizable slides, ideal for startups seeking funding or presenting their business idea. Key sections include company overview, problem statement, solution, market opportunity, business model, and unique selling proposition (USP). It also covers competitive landscape, product features, financials, milestones, and funding requirements, ensuring a comprehensive pitch. The vibrant orange and gray color scheme adds energy and creativity to the presentation. Compatible with PowerPoint, Keynote, and Google Slides, this template is perfect for impactful startup pitches.