


Features
- 6 Unique slides
- Fully editable and easy to edit in Microsoft Powerpoint, Keynote and Google Slides
- 16:9 widescreen layout
- Clean and professional designs
- Export to JPG, PDF or send by email


Do you have any questions?
Recommend


5 slides
Investment and Money Growth Strategies Presentation
Illustrate investment strategies and financial growth with this visually engaging presentation slide. Featuring growing money plant icons on financial podiums, this template helps showcase financial plans, savings growth, and ROI projections effectively. Customizable with editable text, colors, and graphics, it’s perfect for financial advisors, business presentations, and investment reports. Fully compatible with PowerPoint, Keynote, and Google Slides for seamless integration.


5 slides
Agricultural Business Strategy
Showcase your farming goals and plans with this circular, step-based strategy slide. Perfect for presenting agricultural business models, market planning, or farm-to-market strategies. The layout uses clean icons and an engaging central farm illustration to enhance clarity. Fully editable in PowerPoint, Keynote, and Google Slides.


7 slides
Performance Improvement Infographics
A Performance Improvement infographic is a visual representation of the key elements of a plan to enhance the performance of an individual, team, or organization. The purpose of this template is to communicate the plan's objectives, strategies, and metrics in an informative and engaging way. This infographic contains graphs, and diagrams to illustrate key performance indicators and other measures of success. This performance template can help motivate and engage stakeholders, highlight the benefits of performance improvement, and facilitate communication and collaboration among team members.


6 slides
Cause-and-Effect Chain Using Fishbone Diagram Presentation
Break down complex issues step by step with the Cause-and-Effect Chain Using Fishbone Diagram Presentation. Ideal for project managers, analysts, or educators, this template helps you visually map out relationships between causes and outcomes. Fully editable in Canva, PowerPoint, and Google Slides for seamless integration into your workflow.


5 slides
Marketing Strategy Wheel Diagram Presentation
Visualize your marketing framework in a clear and engaging way with this Marketing Strategy Wheel Diagram. Designed to highlight key components like audience targeting, communication channels, and campaign goals, this circular format brings strategy to life. Fully customizable and compatible with PowerPoint, Keynote, and Google Slides. Ideal for marketers, agencies, and branding professionals.


7 slides
Customer Loyalty Program Infographic Presentation
Introducing our new customer loyalty program infographics template, the perfect tool for any business looking to boost customer engagement and loyalty! It's easy for you to create an engaging and effective presentation with these Infographics. With our template, you can add a touch of creativity to your presentation with a fun color scheme and infographic visuals with editable text. Whether you're presenting customer rewards or loyalty program benefits, our template will help you communicate your ideas in a clear and engaging way. So why wait? Start boosting your customer engagement and loyalty today with our amazing template!


6 slides
Vision to Execution Business Strategy Presentation
Bridge the gap between strategic vision and operational execution with this visual funnel-style template. Ideal for mapping high-level goals to tactical outcomes, this slide helps communicate transformation processes, business initiatives, or product strategies. Fully editable in PowerPoint, Keynote, or Google Slides for strategic planning, leadership sessions, or roadmap presentations.


5 slides
Feedback Collection Strategy Presentation
Engage your audience with a dynamic visual that simplifies how feedback is gathered and turned into meaningful action. This presentation helps illustrate communication loops, data flow, and process improvements with clarity and style. Fully editable and compatible with PowerPoint, Keynote, and Google Slides for seamless customization and professional delivery.


20 slides
Emerald Sales Forecast Presentation
Shine bright with this emerald-inspired presentation, perfect for sharing your sales forecast! Designed to showcase revenue projections, market trends, and sales strategies, this template keeps your data organized and visually impactful. Its vibrant, clean design ensures your forecast captures attention. Compatible with PowerPoint, Keynote, and Google Slides.


12 slides
Quarterly Status Report Presentation
Crafted for clarity and impact, the Quarterly Status Report presentation template efficiently summarizes a period's achievements and insights. The opening slide immediately captivates the audience, clearly setting the stage for a comprehensive review. Subsequent slides meticulously organize critical data points, from financial forecasts to project milestones, allowing for a granular examination of past performance. The report not only reflects on the quarter's outcomes but also offers a well-defined path forward, with strategic recommendations and a thoughtful action plan. Concluding on a note of gratitude, the template acknowledges the audience's time and consideration, while the final credits slide ensures due recognition of all informational sources used throughout the presentation.


7 slides
Annual Financial Report Infographic
This easy-to-use infographic template is crafted for a straightforward Annual Financial Report. Suitable for PowerPoint, Google Slides, and Keynote, it features diverse charts like bar graphs, pie charts, and tables for illustrating financial data such as sales growth, product earnings, and expenses. The professional blue and grey color palette is ideal for a corporate setting, while simple icons and clear spaces for text ensure information is digestible. This template is perfect for financial analysts and business managers who need to present complex fiscal data in a clear, visually appealing way.


5 slides
Institutional Historical Highlights Presentation
Present milestones with impact using this vertical bar layout designed to showcase historical achievements clearly. With icons, aligned titles, and color-coded steps, it’s perfect for timelines, growth overviews, or academic evolution. Fully editable in PowerPoint, Keynote, and Google Slides, it offers structured storytelling with a sleek, professional design.


8 slides
Marketing Plan and Audience Targeting Presentation
Visualize your audience segmentation strategy with the Marketing Plan and Audience Targeting Presentation. This bullseye diagram template highlights three key focus areas, making it ideal for showcasing market research, targeting tactics, or funnel stages. Fully editable in Canva, PowerPoint, Keynote, and Google Slides to match your branding and goals.


22 slides
Hercules Digital Marketing Strategy Plan Presentation
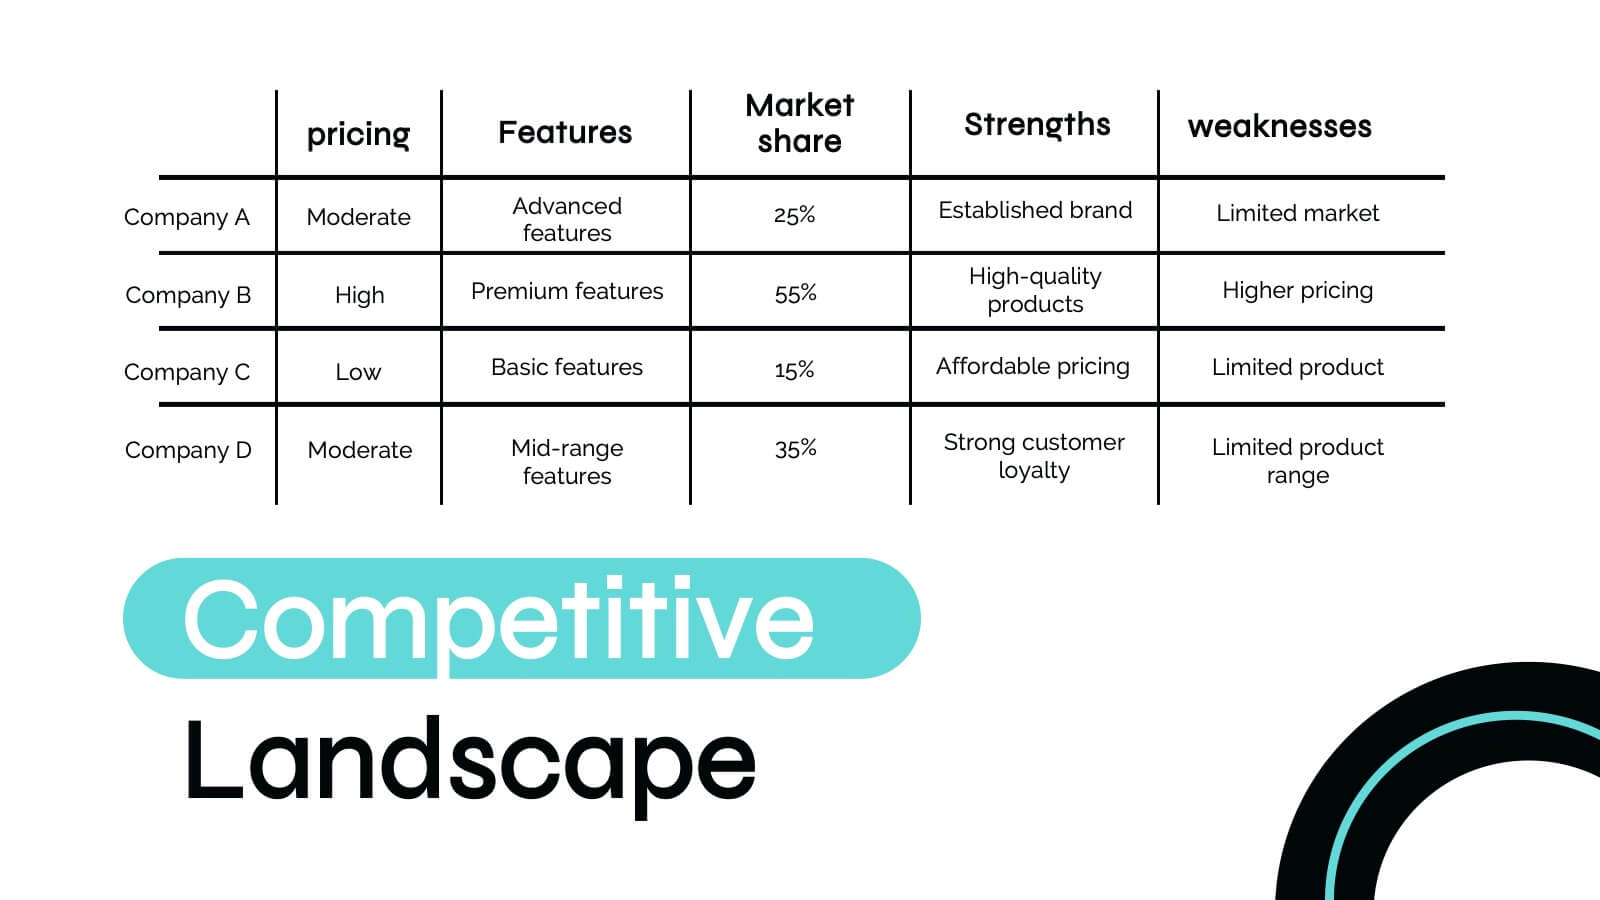
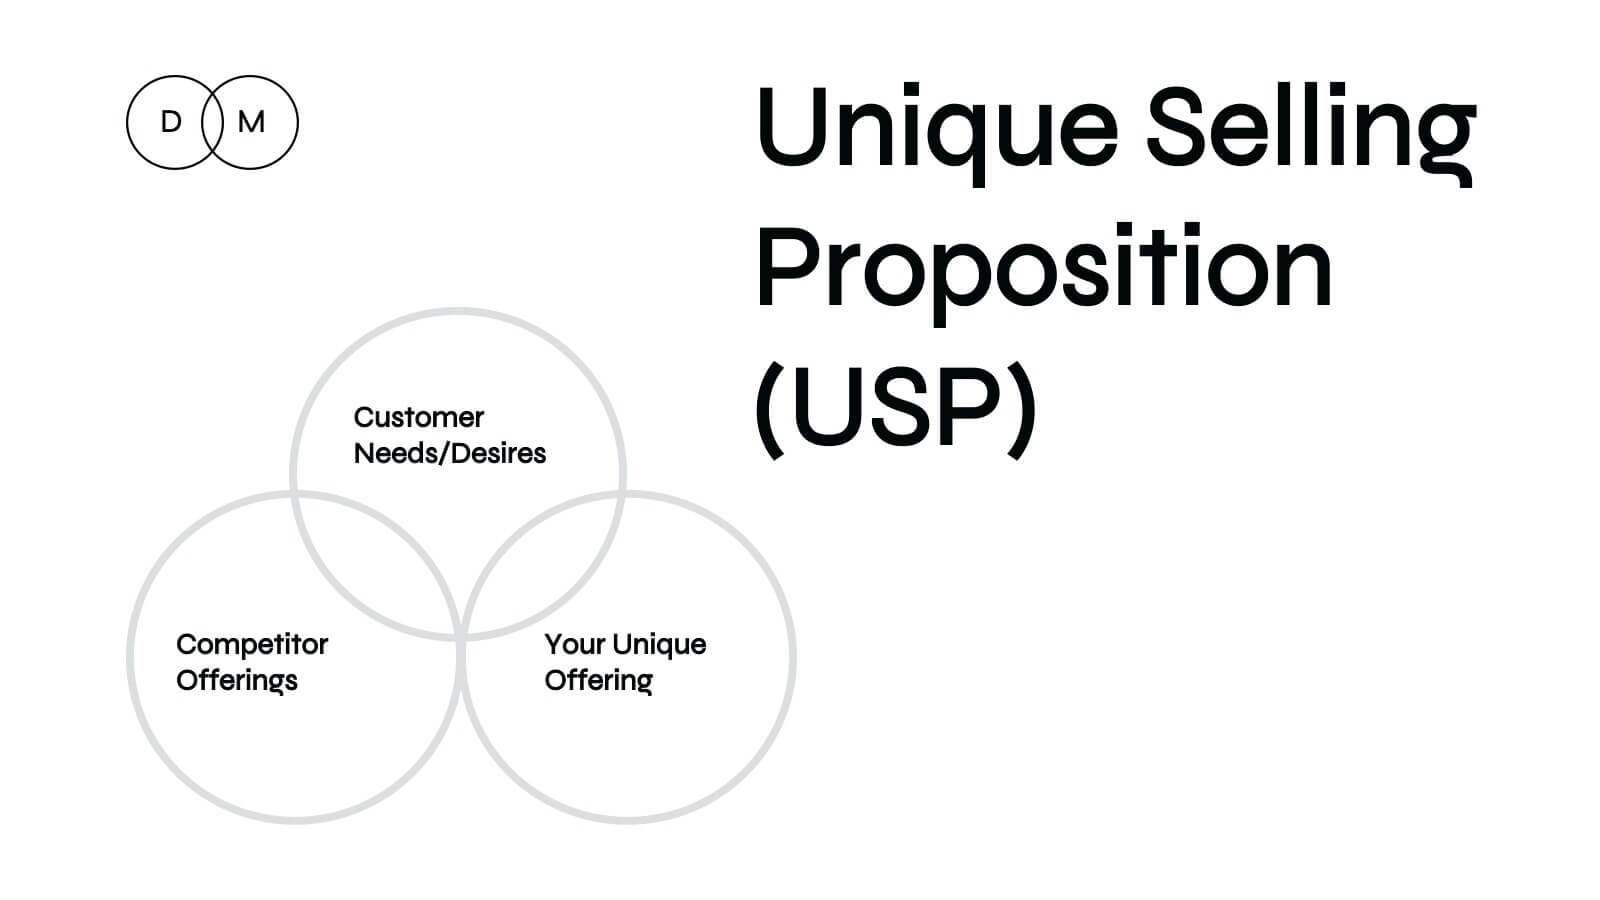
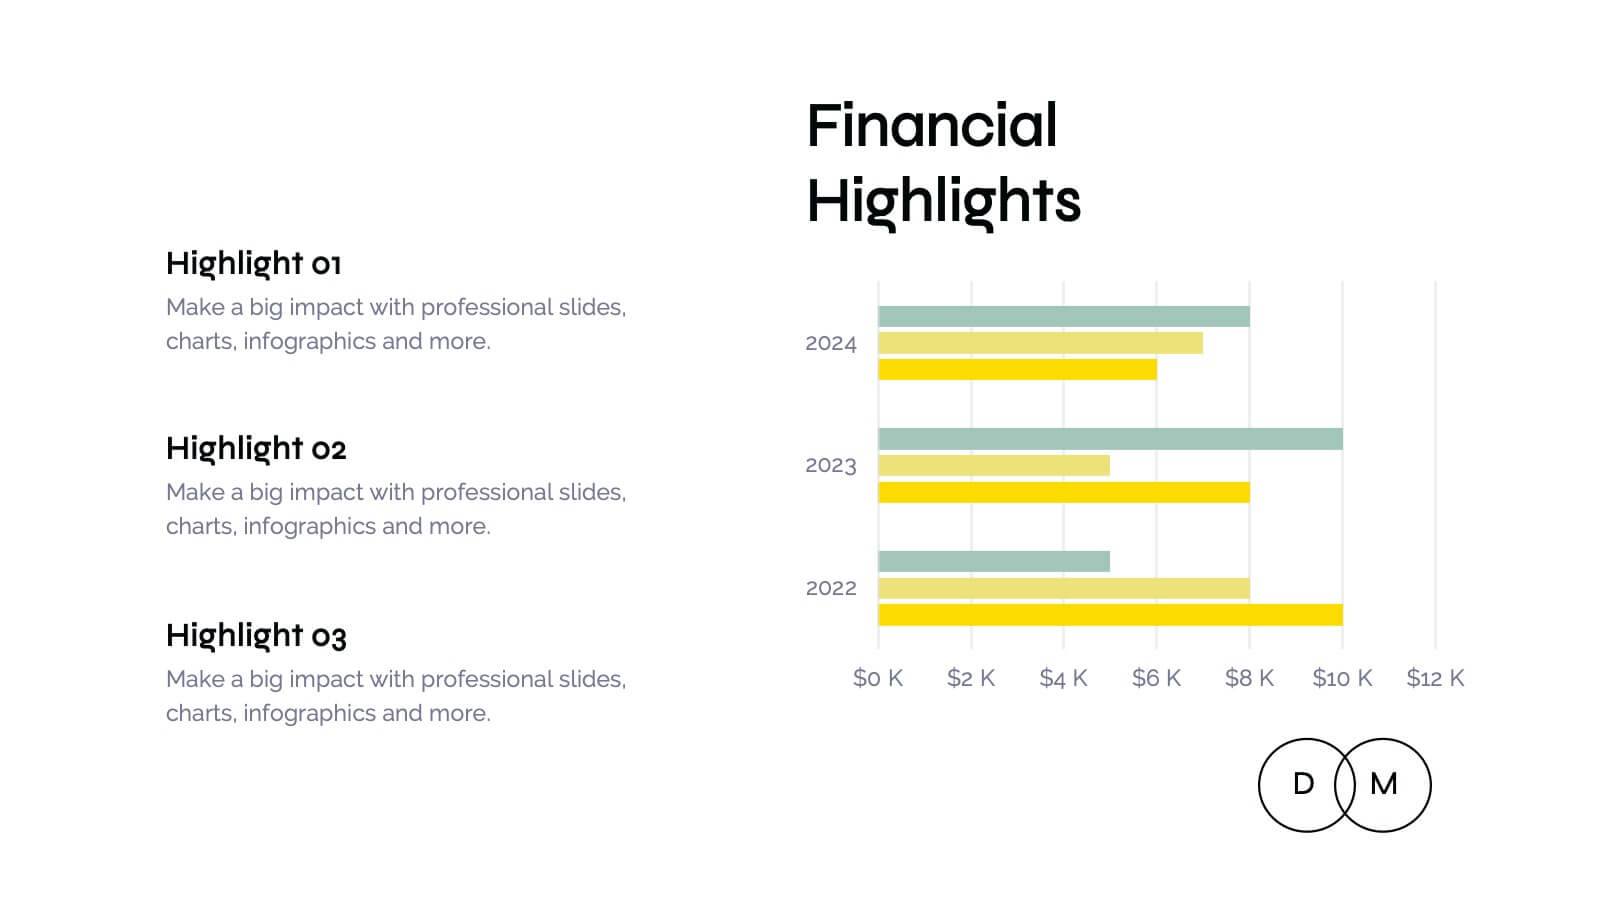
Ignite your next marketing presentation with this bold, dynamic template that showcases every key element of your marketing strategy! From company history and target audience insights to competitive landscape analysis, this design makes presenting your marketing message a breeze. Perfect for professionals, it’s fully compatible with PowerPoint, Keynote, and Google Slides for seamless usage across platforms.


6 slides
Weekly Task Schedule Presentation
Stay on top of your week with this clean and efficient layout designed to organize daily priorities and action plans. Perfect for tracking goals, meetings, or team deliverables, it keeps productivity front and center. Fully customizable and compatible with PowerPoint, Keynote, and Google Slides for easy professional presentation use.


6 slides
Measuring User Experience with Smile Ratings Presentation
Visualize customer sentiment with this Smile Rating UX slide. Featuring vertical smile meter graphics with corresponding percentages and descriptions, it’s ideal for product feedback, service evaluations, or usability reports. Clearly distinguish satisfaction levels across three stages or categories. Fully customizable in PowerPoint, Keynote, and Google Slides.


4 slides
Cost Analysis and Budget Overview Presentation
Break down financial details with clarity using the Cost Analysis and Budget Overview Presentation. This slide helps you present cost structures, budget allocations, and key financial metrics side by side using icons and visual data blocks. Perfect for reports, planning, or investment decks. Fully editable in PowerPoint, Google Slides, Keynote, and Canva.