


Features
- 4 Unique slides
- Fully editable and easy to edit in Microsoft Powerpoint, Keynote and Google Slides
- 16:9 widescreen layout
- Clean and professional designs
- Export to JPG, PDF or send by email


Do you have any questions?
Recommend


4 slides
Risk Assessment Matrix Presentation
Highlight and evaluate business uncertainties with this Risk Assessment Matrix Presentation. Featuring a clean grid layout and color-coded risk levels, this template allows you to map out potential risks by likelihood and impact. Use the customizable labels, percentages, and legend to make your analysis clear and actionable. Ideal for project managers, consultants, or strategy teams. Compatible with PowerPoint, Keynote, and Google Slides.


5 slides
Mental Health Counseling Infographics
Mental health counseling is a form of therapy that focuses on helping individuals improve their mental and emotional well-being. These infographic templates are designed to raise awareness about mental health counseling and its benefits. This aims to educate and inform individuals about the importance of seeking professional help for mental health concerns and highlights the various aspects of mental health counseling. Use these to present your next educational presentation on mental health or online platforms, this provides essential information and visual aids to encourage the benefits of seeking counseling.


20 slides
Oscillation Project Proposal Presentation
This project proposal template is designed to captivate your audience with a bold purple and yellow color scheme, adding a modern flair to your presentation. It includes comprehensive sections like company overview, objectives and goals, methodology, deliverables, and budget breakdown. Perfect for clearly communicating your project vision and strategy, this template streamlines your content while highlighting your professional approach. Compatible with PowerPoint, Keynote, and Google Slides, it provides versatility for seamless delivery across platforms.


7 slides
Sales Cycle Infographic
A sales cycle, refers to the series of stages or steps that a salesperson or a sales team follows to convert a prospective customer into a paying customer. This infographic template is a structured approach to lead a potential customer from the initial contact to making a purchase. Compatible with Powerpoint, Keynote, and Google Slides. This is an illustrative guide to the fundamental stages of the sales journey. Equip yourself with an understanding of how sales progress, from prospecting to closing the deal, enabling you to optimize your strategies and drive success in the dynamic world of sales.


6 slides
Project Scope and Deliverables Overview Presentation
Make your project presentations flow effortlessly with a clear, structured layout that highlights goals, milestones, and deliverables. Ideal for tracking progress and aligning teams, this professional design balances clarity and style. Fully compatible with PowerPoint, Keynote, and Google Slides for smooth editing and presentation flexibility.


7 slides
Circle Chart Infographic Presentation
This unique design incorporates both circular and star-shaped elements to convey information in charts. Whether your goal is to showcase market shares, highlight trends, or simply enhance your academic presentation, this infographic will help you achieve it. You can edit this template without any need of design skills or technical knowledge. This presentation includes 7 slides, chart shapes with colors and fonts, all fully customizable. This template is an excellent choice for presenting content on any topic, in a circular format. Simply put your data on the design, add a title, and you're done!


4 slides
Restaurant Menu Design Showcase Presentation
Showcase your food offerings with this stylish Restaurant Menu Design Template. Divided into clear sections—Menu, Drinks, and Desserts—it’s perfect for restaurants, cafés, or pop-up events. Fully editable in PowerPoint, Keynote, and Google Slides, this layout lets you present items cleanly with bold titles and organized structure for easy viewing.


6 slides
Stakeholder Management Analysis Infographics
Efficiently manage stakeholders with our Stakeholder Management Analysis infographic template. This template is fully compatible with popular presentation software like PowerPoint, Keynote, and Google Slides, allowing you to easily customize it to analyze and communicate your stakeholder management strategies. The Stakeholder Management Analysis infographic template offers a visually engaging platform to assess, categorize, and prioritize stakeholders based on their influence and interest in your projects or initiatives. Whether you're a project manager, business leader, or involved in stakeholder engagement, this template provides a user-friendly canvas to create informative presentations and reports on stakeholder management. Optimize your stakeholder relationships with this SEO-optimized Stakeholder Management Analysis infographic template, thoughtfully designed for clarity and ease of use. Customize it to showcase stakeholder mapping, engagement strategies, and communication plans, helping you ensure that your stakeholders' needs and expectations are met effectively. Start crafting your personalized infographic today to excel in stakeholder management.


23 slides
Supernova Business Plan Presentation
The Supernova Business Presentation template is a sleek, professional tool designed to elevate your corporate presentations. With a dark-themed aesthetic, it exudes sophistication and modernity, making it perfect for business meetings, project updates, and strategy sessions. The template covers essential aspects like team updates, key achievements, collaboration opportunities, performance metrics, and more, allowing you to deliver a comprehensive overview of your business operations. It's also ideal for discussing upcoming events, departmental goals, and company policies, providing a structured and impactful way to communicate with your team or stakeholders. The template is fully compatible with PowerPoint, Keynote, and Google Slides, ensuring easy customization and a seamless presentation experience across different platforms. Use the Supernova Business Presentation template to make a powerful impression with your next business presentation.


4 slides
Meeting Agenda Slide Presentation
Start your presentation with structure and clarity using this sleek, professional layout designed to outline key discussion points with style. Perfect for business meetings, workshops, or team updates, it keeps information clear and visually balanced. Fully compatible with PowerPoint, Keynote, and Google Slides for effortless editing and customization.


6 slides
Business Security Compliance Presentation
Visualize your security framework with this clear and modern infographic layout. This slide is ideal for presenting compliance steps, risk assessments, or regulatory requirements, featuring a shield-centered hub with 5 editable sections. Customize easily in PowerPoint, Keynote, or Google Slides.


28 slides
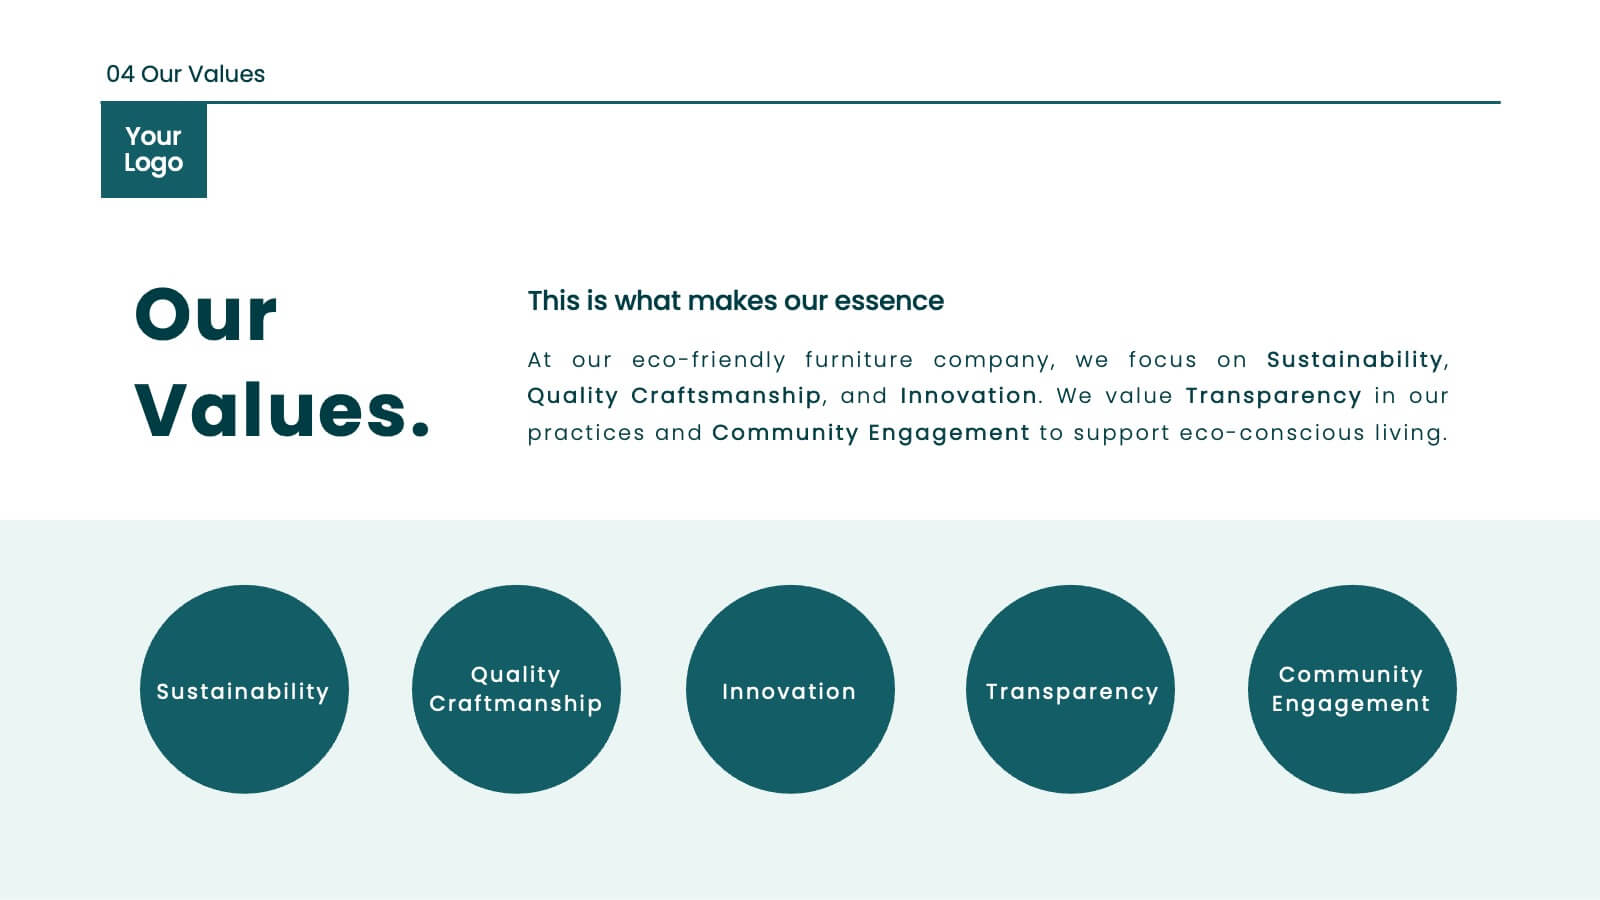
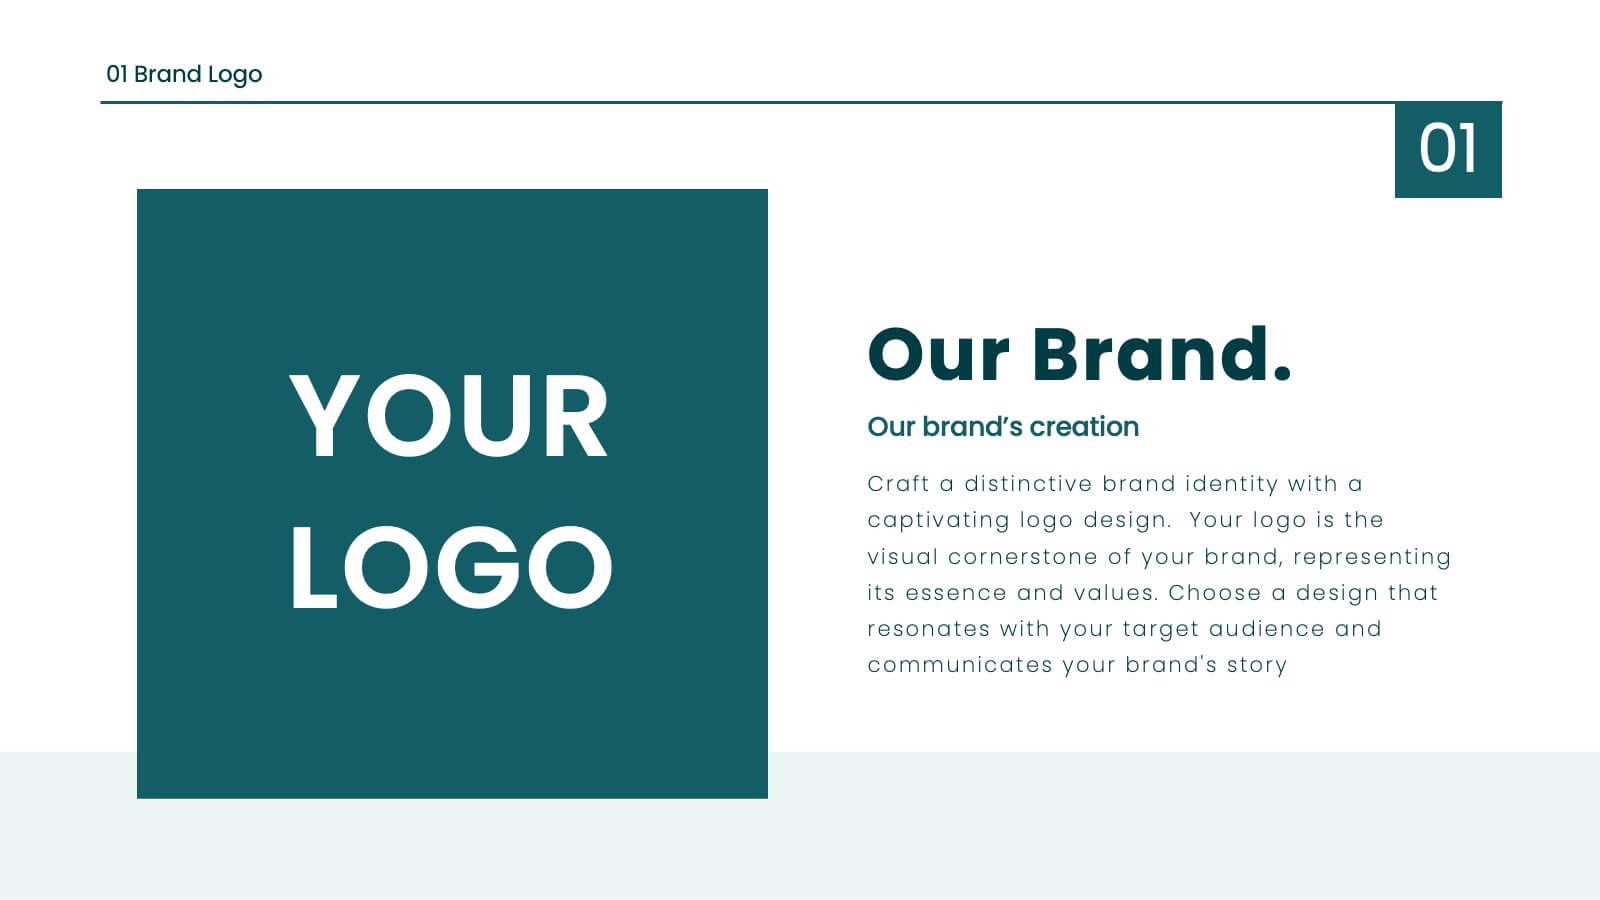
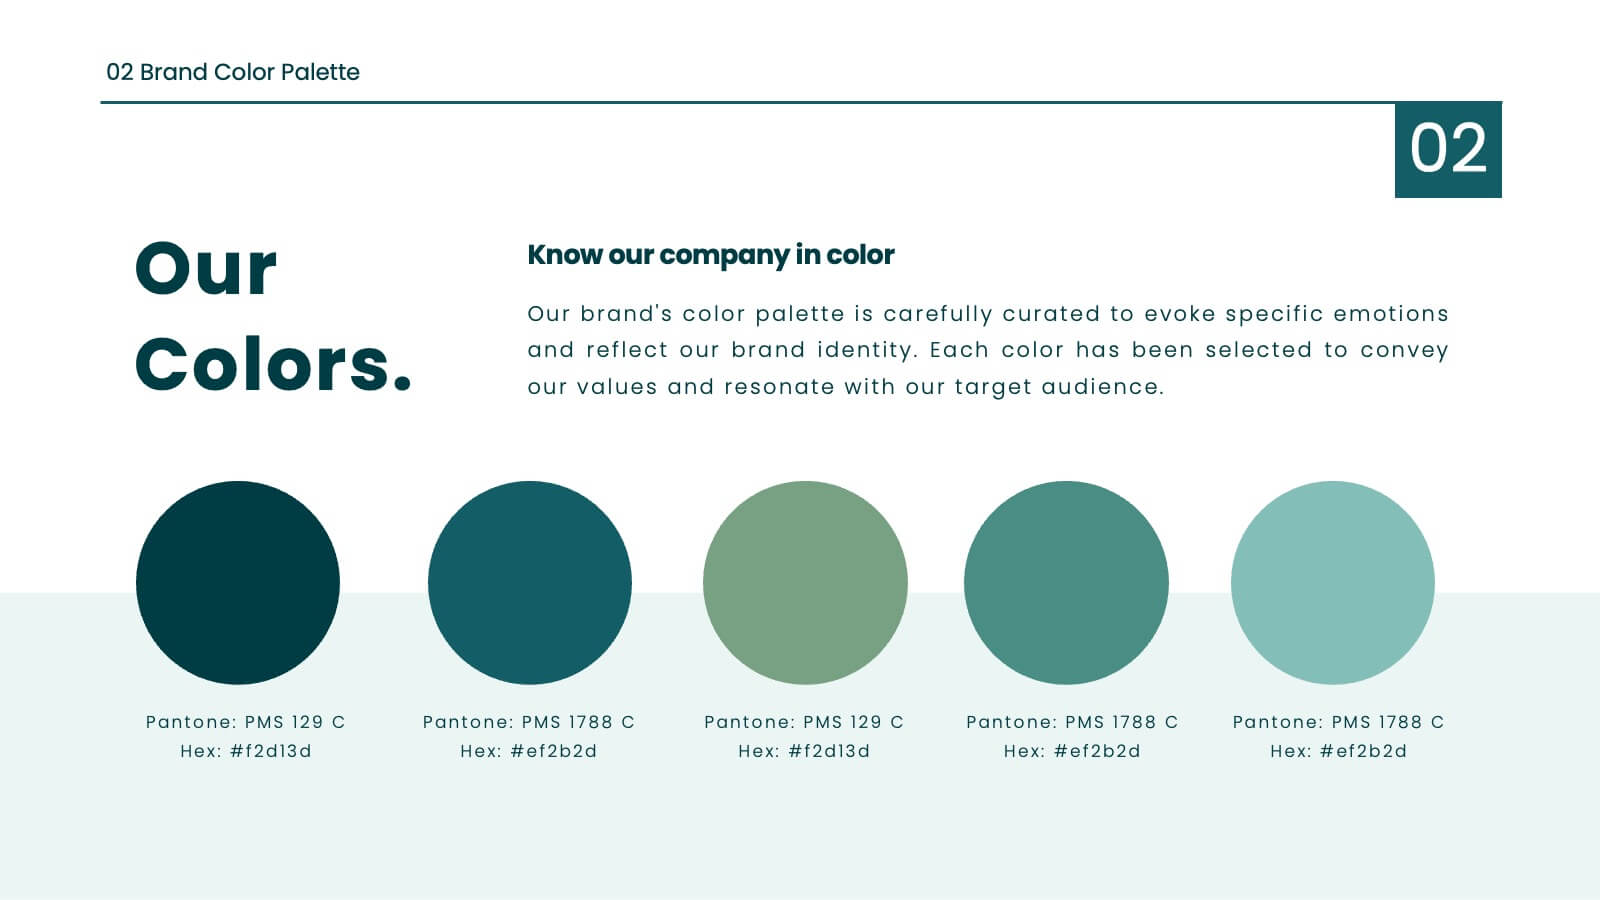
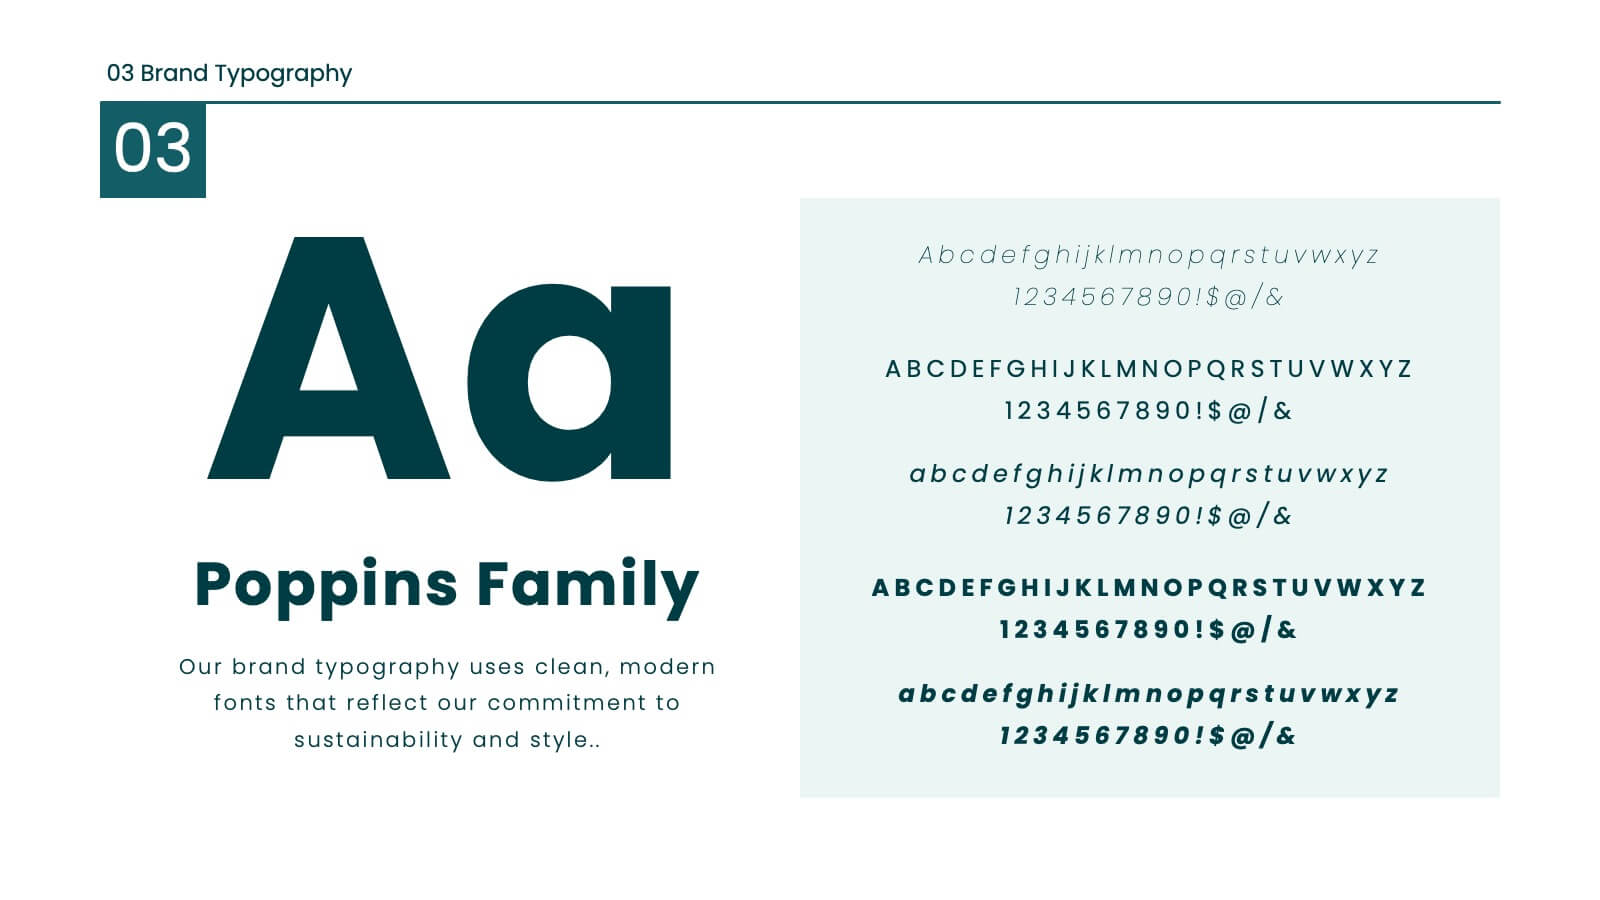
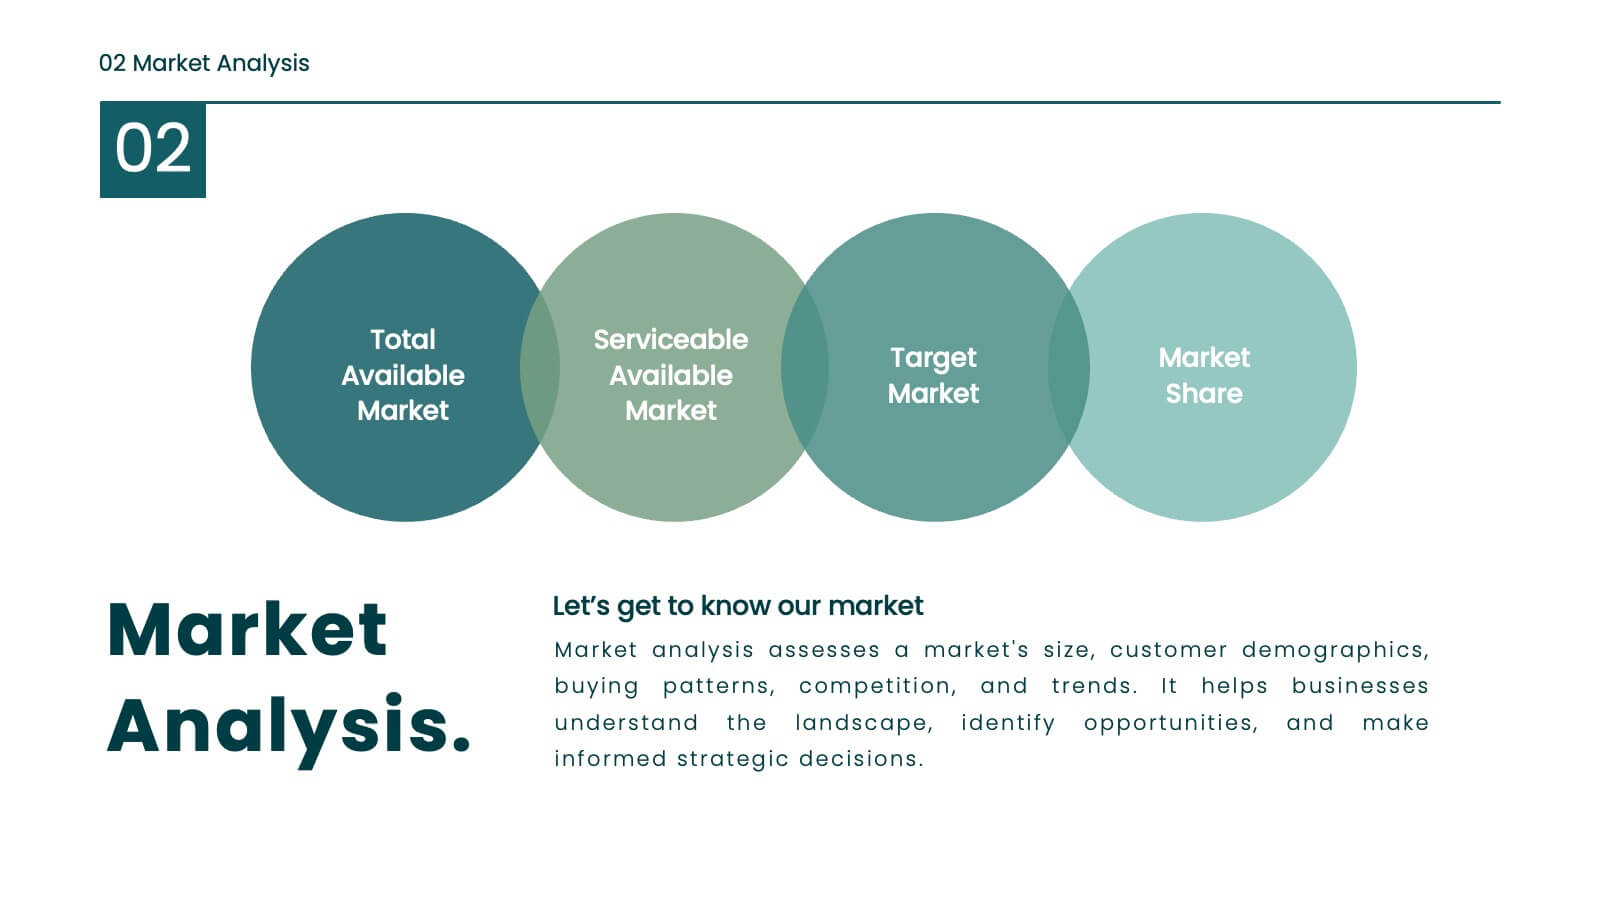
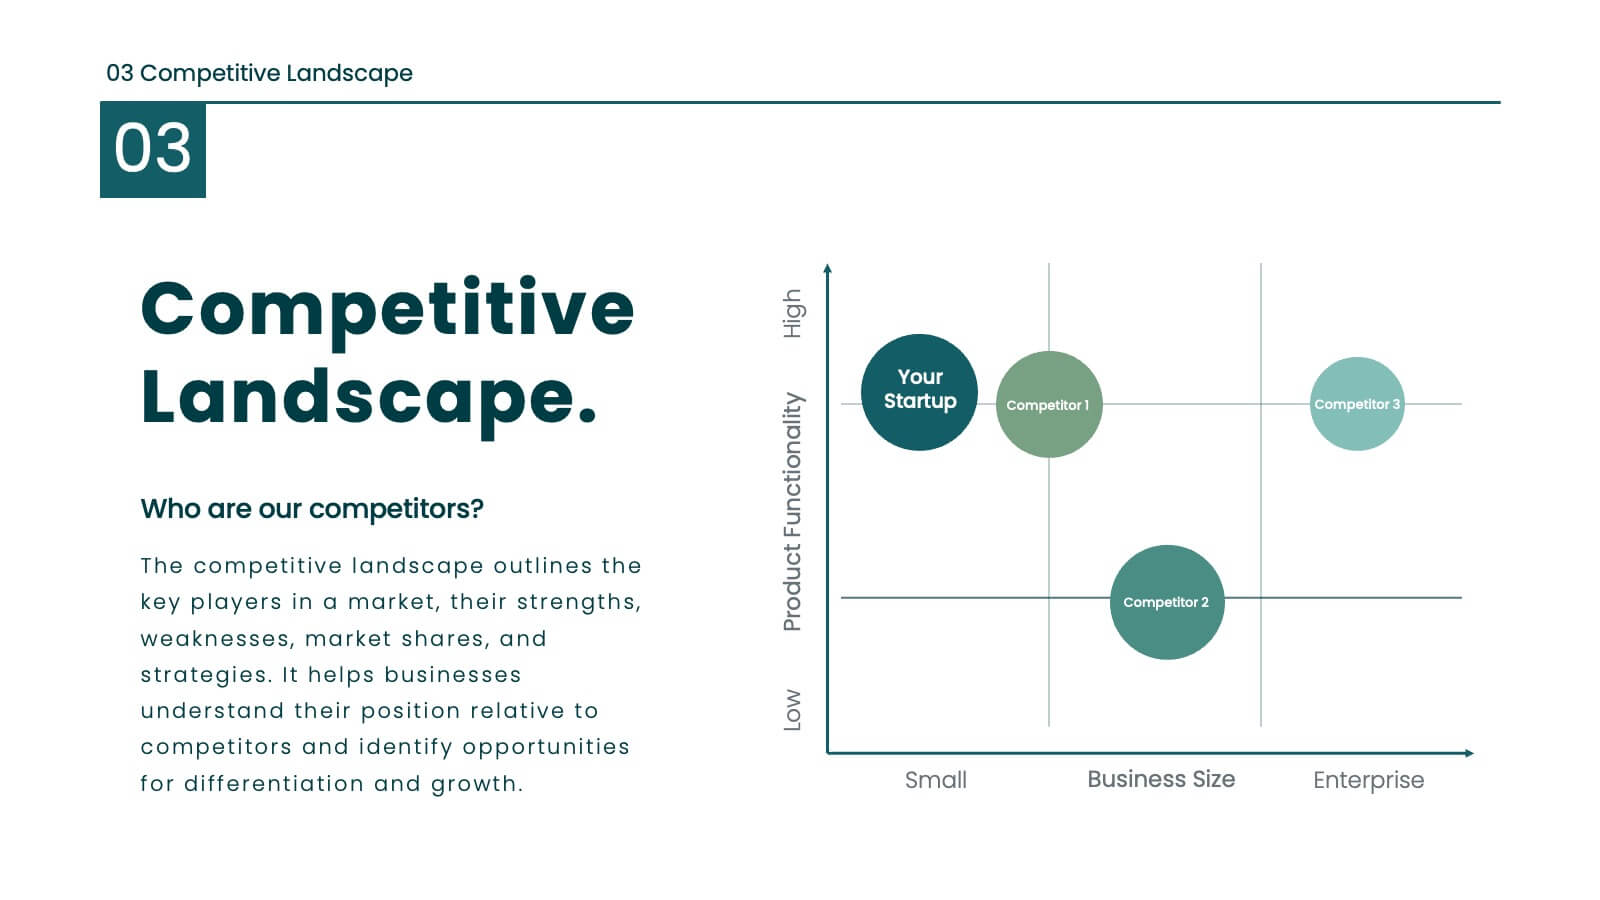
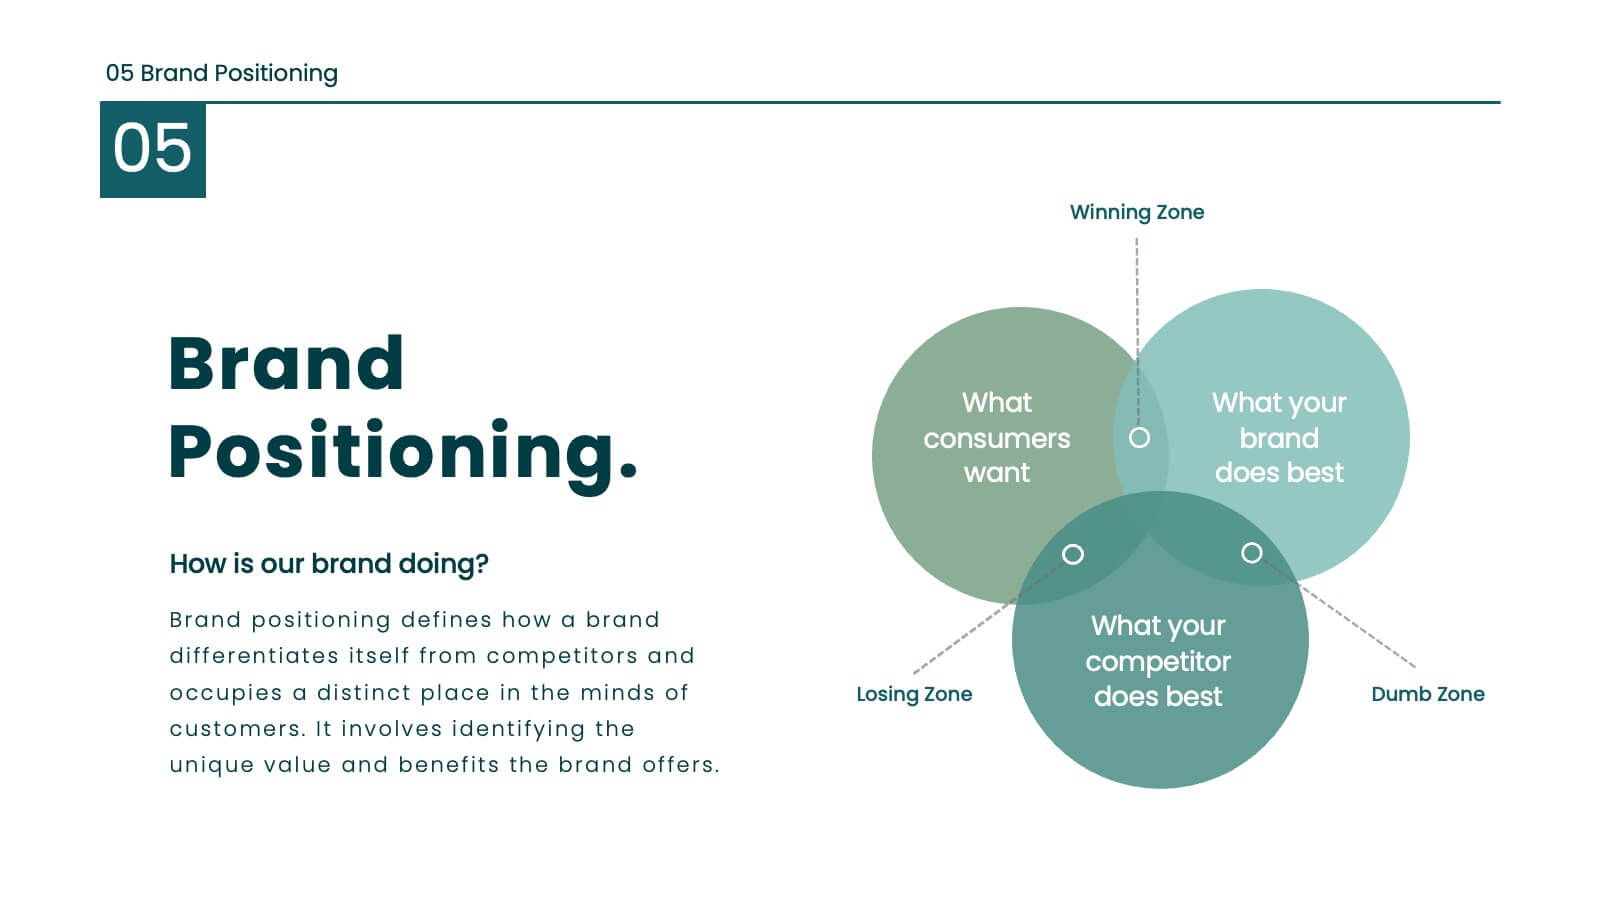
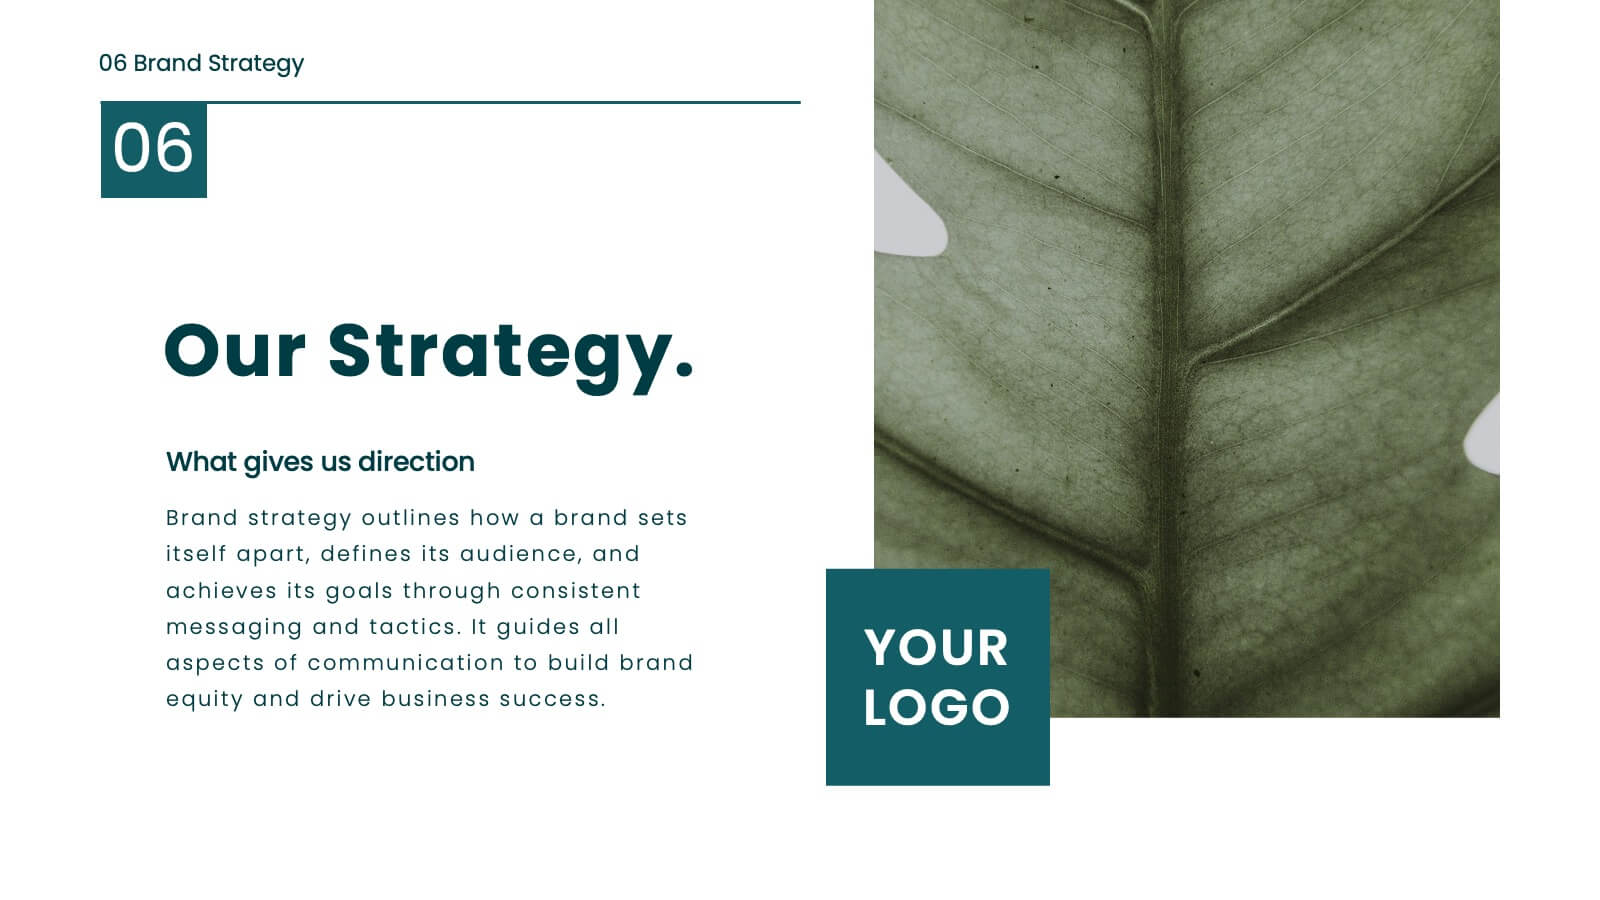
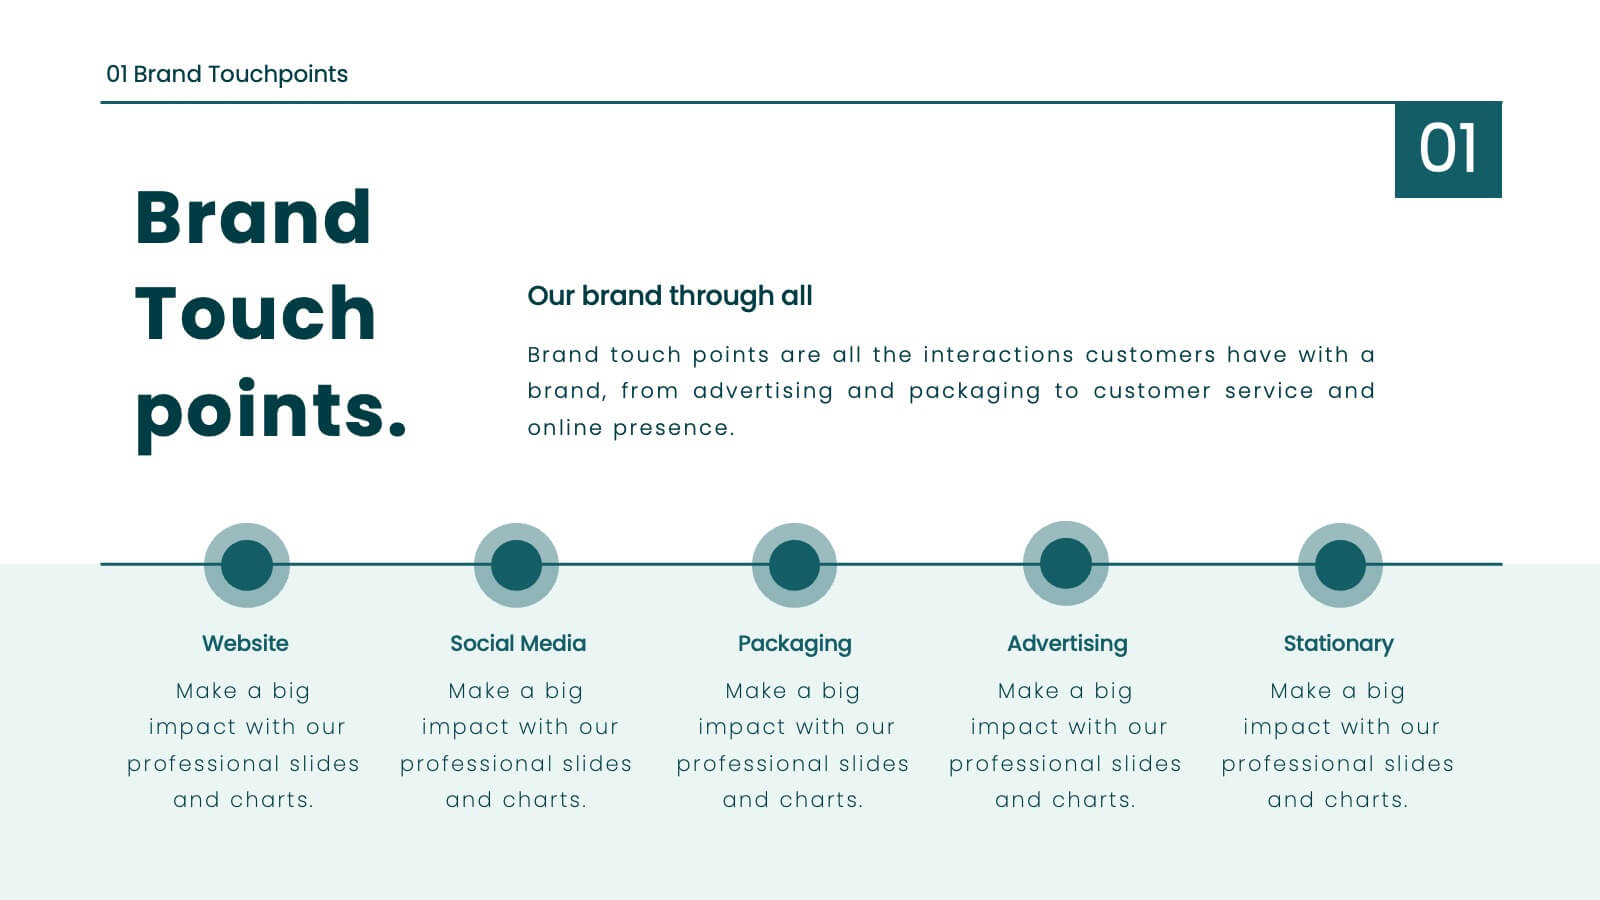
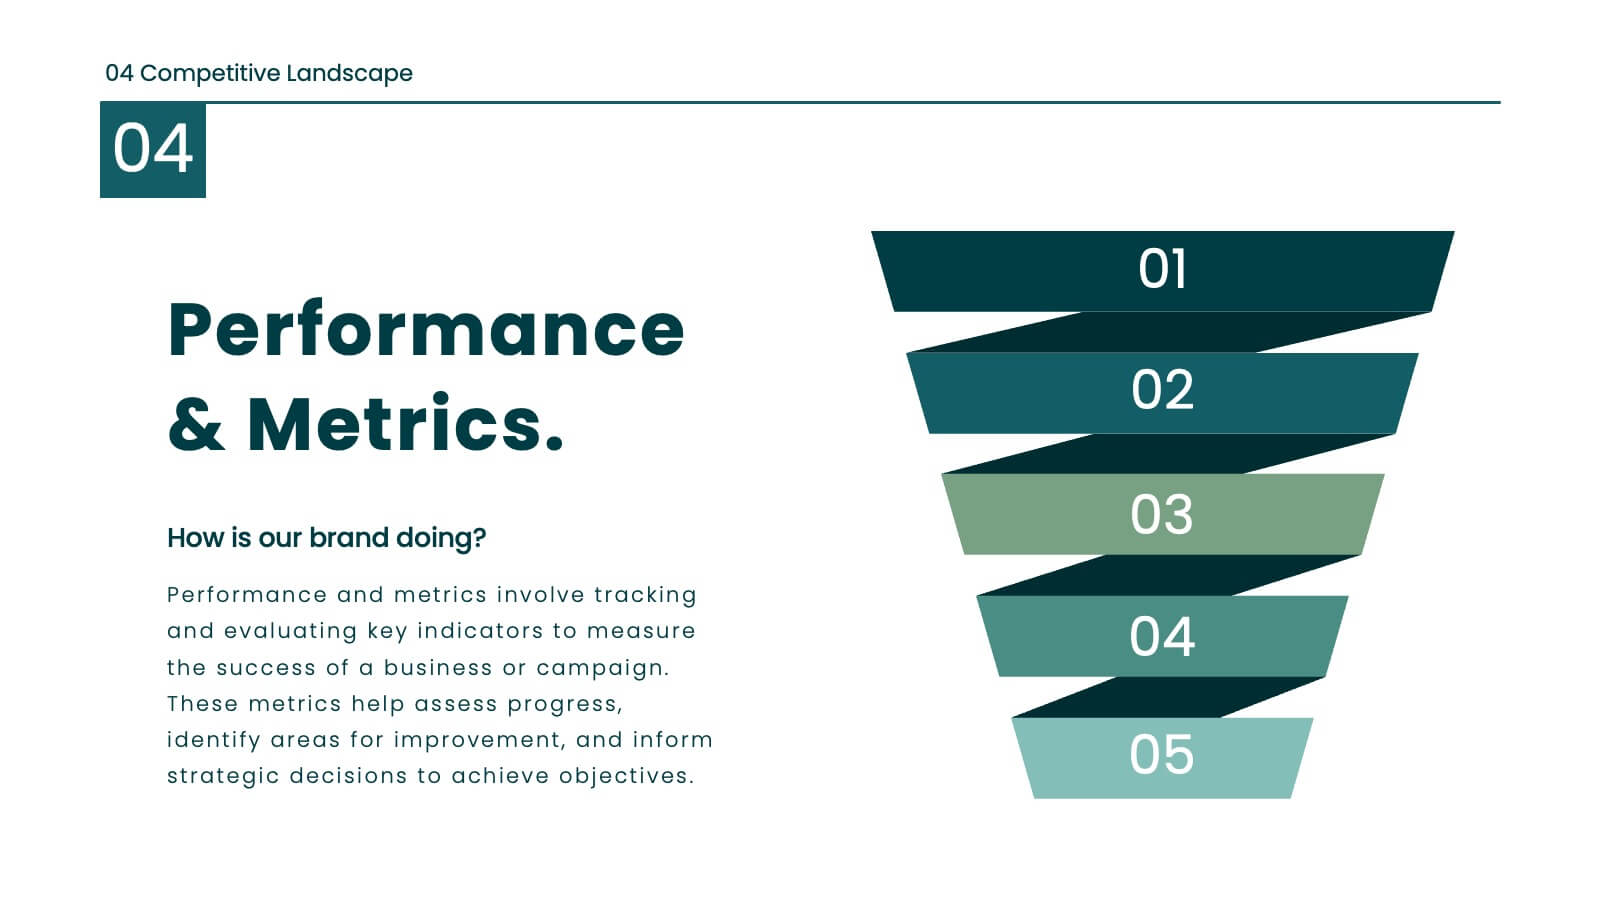
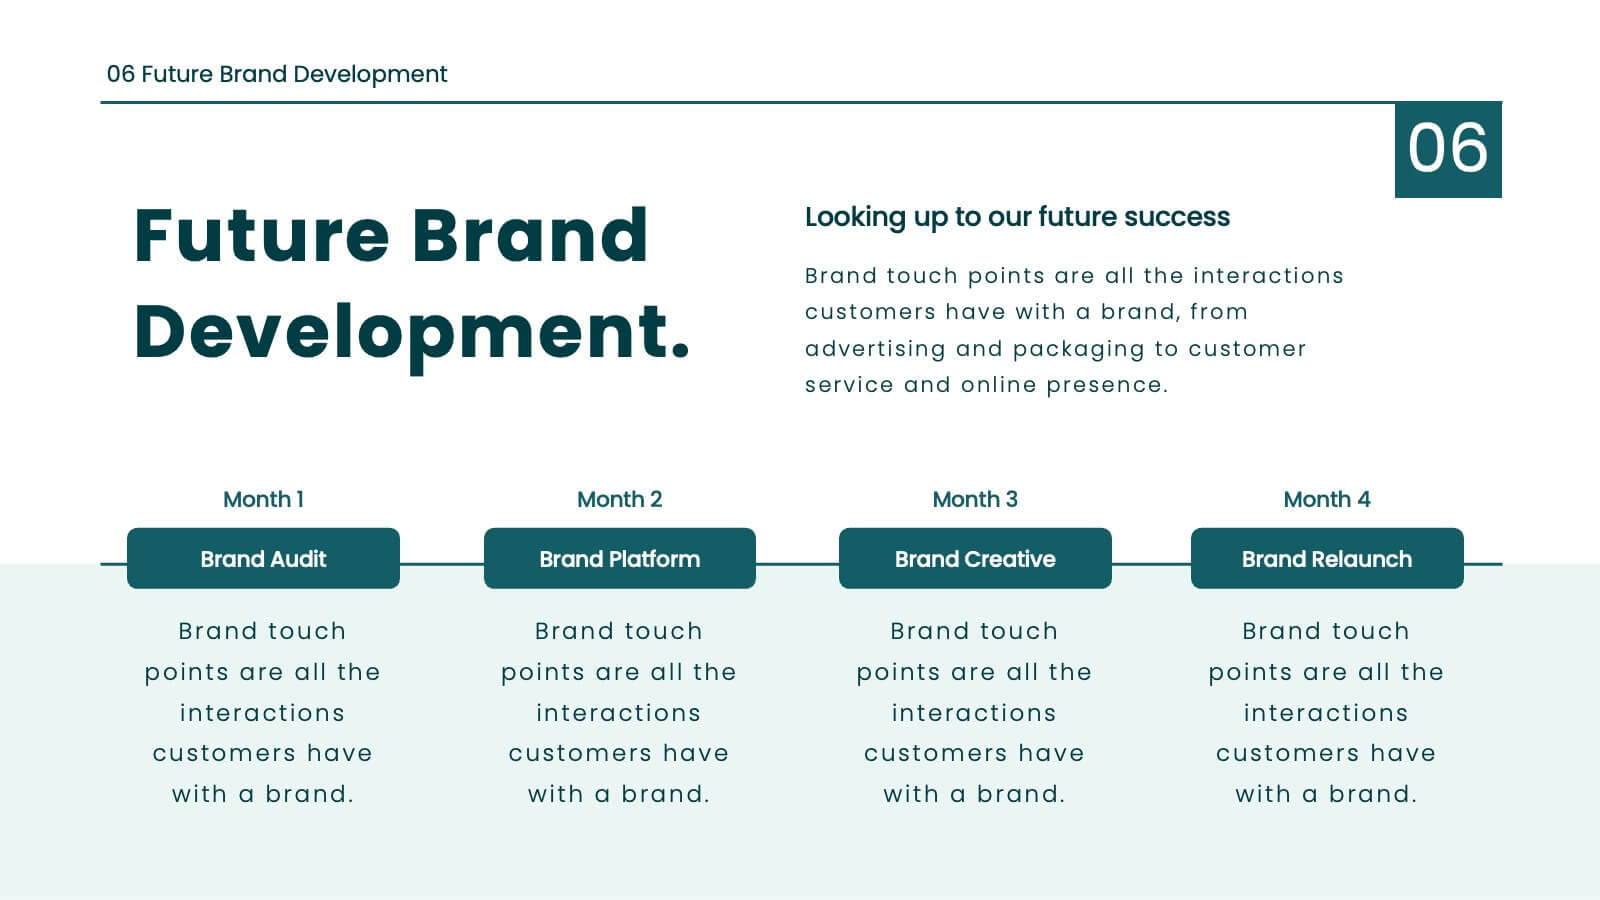
Juno Brand Guidelines Proposal Presentation
Define your brand's identity with this comprehensive, stylish presentation template. Perfect for detailing brand guidelines, vision, mission, and market analysis, it features a clean design with a professional layout. Highlight key elements like color palettes, typography, and unique selling propositions to ensure consistency and clarity. Compatible with PowerPoint, Keynote, and Google Slides, it’s ideal for any platform.


5 slides
Product Launch Pitch Deck Presentation
Launch your product with impact using this Product Launch Pitch Deck template. Designed to outline key strategies, market positioning, and product benefits, this template helps you deliver a compelling presentation. Engage stakeholders with clear, structured visuals. Fully compatible with PowerPoint, Keynote, and Google Slides for seamless customization.


8 slides
Blue Ocean Strategy Business Model Presentation
Chart unexplored market territories with our Blue Ocean Strategy Business Model template! This dynamic presentation tool, designed to simplify complex business strategies, illustrates the pivotal elements of cost reduction and value innovation to unlock new buyer value. Compatible with PowerPoint, Keynote, and Google Slides, it's ideal for strategists aiming to create uncontested market spaces and make competition irrelevant. Perfect for workshops, business meetings, or strategy sessions.


23 slides
Quest Corporate Strategy Proposal Presentation
Unlock success with this powerful corporate strategy template! Detail strategic objectives, market trends, and growth opportunities. Ideal for business leaders aiming to drive growth. Compatible with PowerPoint, Keynote, and Google Slides, this template ensures your strategy is clear, professional, and compelling. Make your vision a reality with impactful presentations.


7 slides
South America Political Map Infographic
Dive into the vibrant landscapes of South America with our detailed map infographic. Infused with the pure essence of white, the depth of blue, and the vivacity of green, our template beautifully mirrors South America's diverse topography and culture. Enhanced with spot-on infographics, representative icons, and country-centric image placeholders, it offers a panoramic view of this dynamic continent. Seamlessly constructed for Powerpoint, Keynote, or Google Slides. An indispensable asset for educators, travelers, geographers, or businesses eyeing the South American market. Venture with clarity; let every slide be an exploration of South America's wonders.


12 slides
Business Strategy with 7S Model Presentation
Streamline your strategic discussions with our Business Strategy with 7S Model presentation template, crafted for professionals who demand precision and clarity. Each slide methodically details the seven interrelated elements—Structure, Strategy, Systems, Skills, Staff, Style, and Shared Values—ensuring a comprehensive analysis of your organization's alignment. This versatile template enhances your presentations in PowerPoint, Keynote, and Google Slides, providing a visually engaging way to explore complex business strategies and foster insightful conversations.