


Features
- 5 Unique slides
- Fully editable and easy to edit in Microsoft Powerpoint, Keynote and Google Slides
- 16:9 widescreen layout
- Clean and professional designs
- Export to JPG, PDF or send by email


Do you have any questions?
Recommend


20 slides
Cinderbark Product Launch Pitch Deck Presentation
Showcase your product launch with a sleek, modern, and professional pitch deck template. This design empowers you to captivate stakeholders by clearly presenting your problem statement, unique solutions, and market opportunity. Effectively highlight your target audience, revenue model, and competitive landscape to demonstrate market viability. Create impact with visuals detailing your sales strategy, growth projections, and financial summary, ensuring transparency and confidence in your business plan. Timeline and milestone slides keep the focus on key achievements and future goals, while team introduction pages establish credibility and expertise. Fully customizable and compatible with PowerPoint, Google Slides, and Keynote, this template is ideal for startups, entrepreneurs, and product managers aiming for a polished and compelling presentation. Tailor it to your needs and deliver your vision with clarity and style.


6 slides
Weekly Gantt Schedule Management
Plan smarter, work smoother with the Weekly Gantt Schedule Management Presentation. This clean and structured timeline slide helps you map out tasks across the week, ideal for managing team workloads, tracking progress, and aligning project deadlines. Fully editable in PowerPoint, Keynote, and Google Slides to match your workflow.


7 slides
Company Mission Infographic
The templates presented are tailored to elucidate the company's mission, blending aesthetic appeal with functional design to communicate core values and strategic objectives effectively. These slides are ideal for businesses looking to articulate their mission clearly and compellingly, ensuring alignment across all levels of the organization. Each slide in the collection is designed with precision, incorporating elements that highlight key aspects of the company’s ethos without overwhelming the viewer. The use of clean lines, minimalistic design, and coordinated color palettes emphasizes clarity and professionalism, making each slide both engaging and informative. These templates serve multiple purposes; they are perfect for enhancing corporate presentations, annual meetings, and strategic workshops. They help in broadcasting the foundational goals and the mission to new hires, potential investors, and external stakeholders. By presenting the mission in a visually cohesive and structured manner, these slides foster a unified understanding of what the company stands for. Customizable features allow these templates to be adapted to match specific branding requirements, making them a versatile tool in the corporate communication arsenal. They are not just slides but strategic tools that reinforce the company’s identity and commitment to its goals, serving as a cornerstone for building corporate identity and culture.


4 slides
Green Initiatives & Climate Strategy Presentation
Highlight your sustainability roadmap with the Green Initiatives & Climate Strategy Presentation. Designed with a quadrant tree layout, this slide communicates four key environmental focus areas. Ideal for eco-friendly proposals, CSR updates, or climate reports. Fully customizable in PowerPoint, Keynote, and Google Slides—perfect for green strategies, goals, or impact summaries.


5 slides
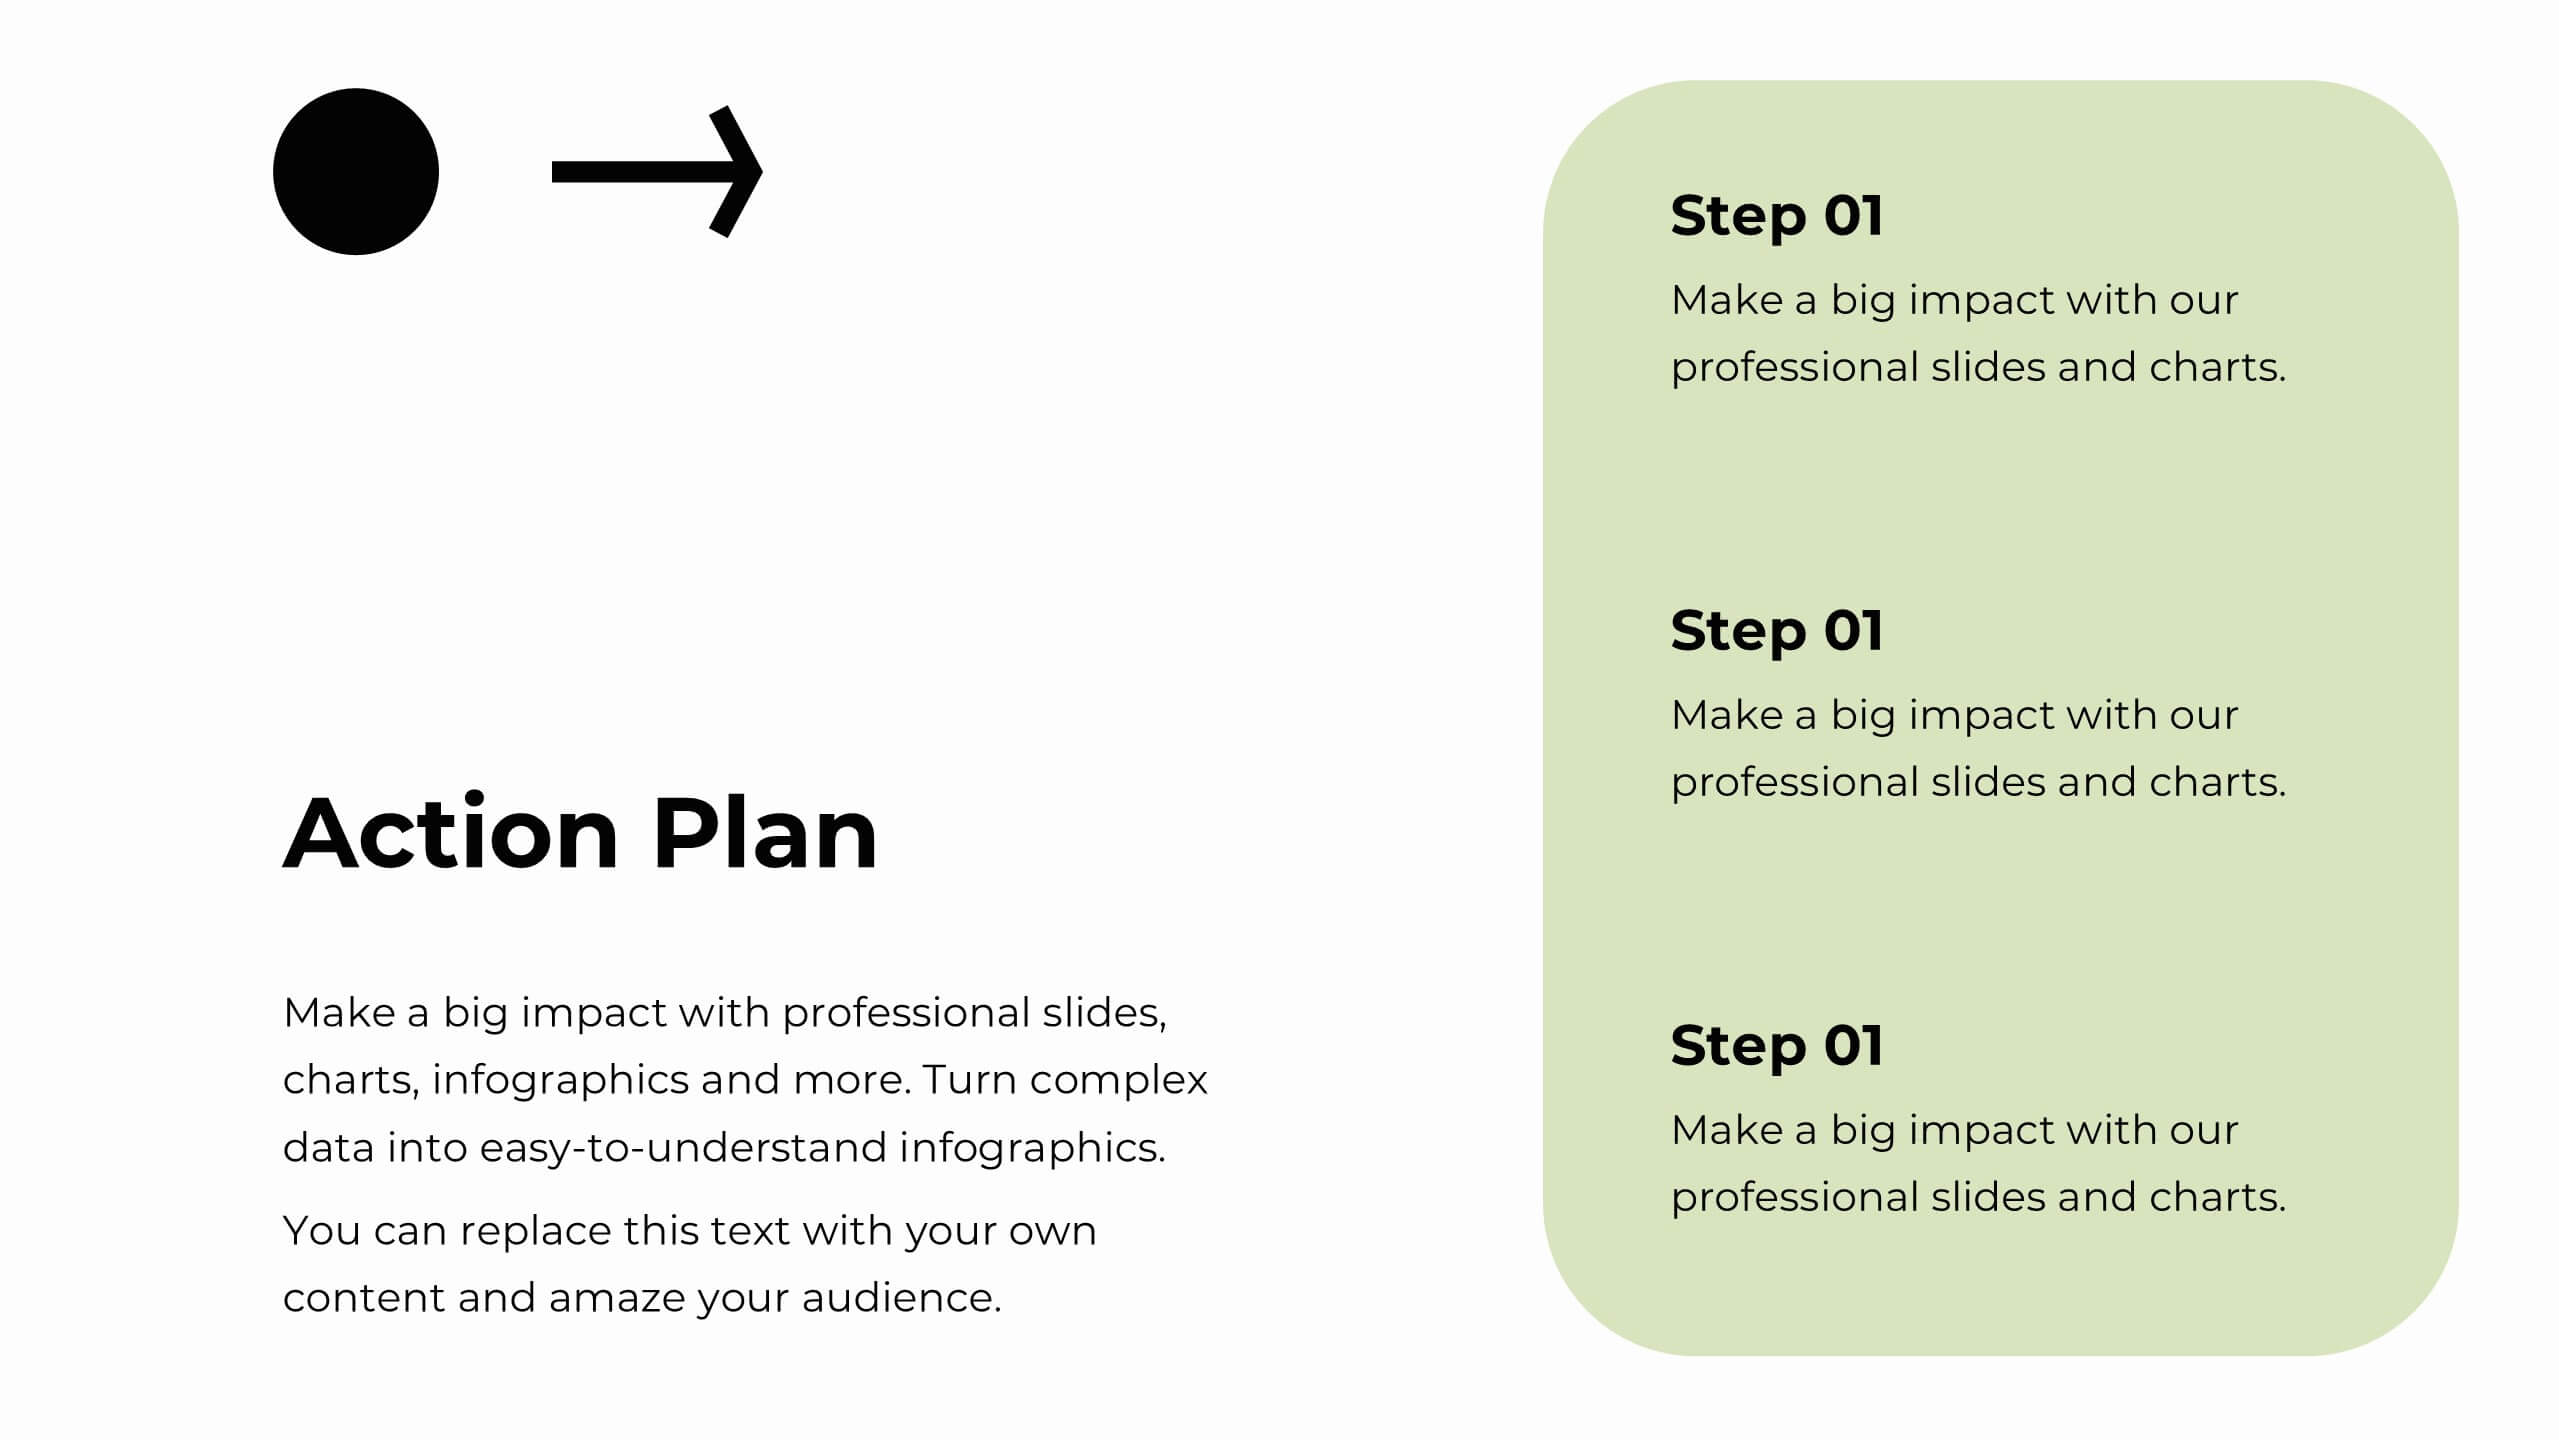
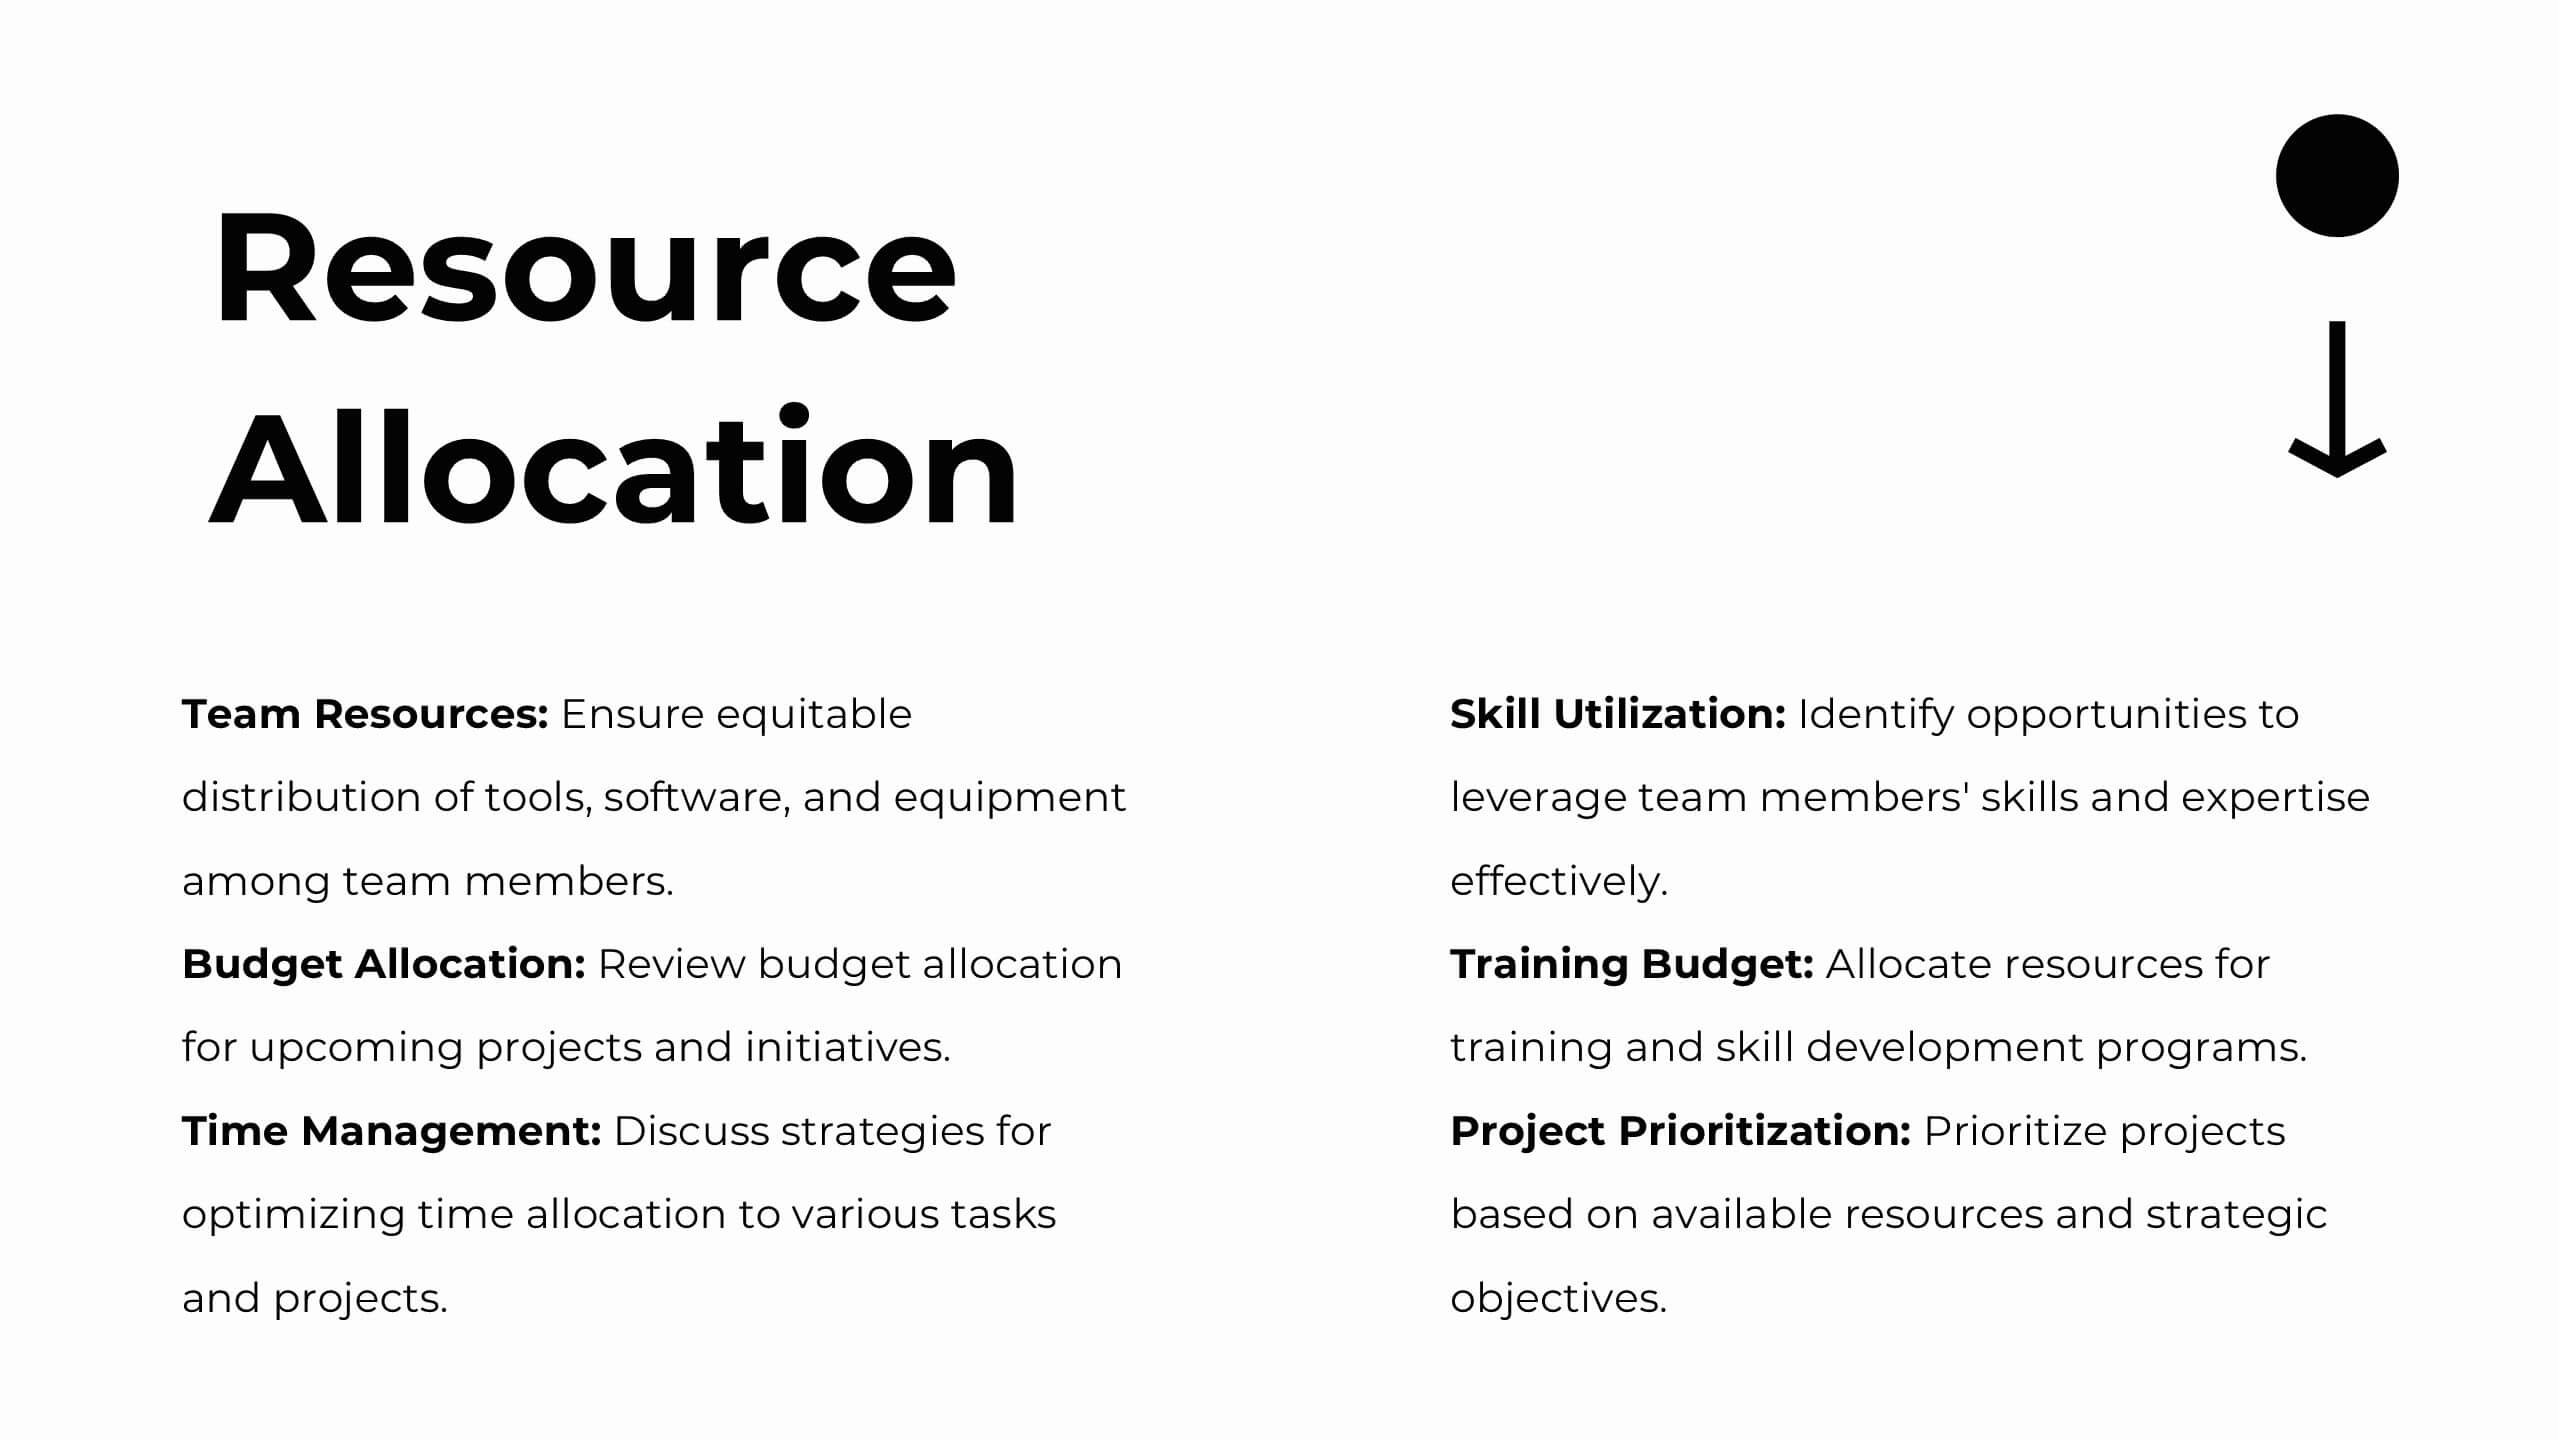
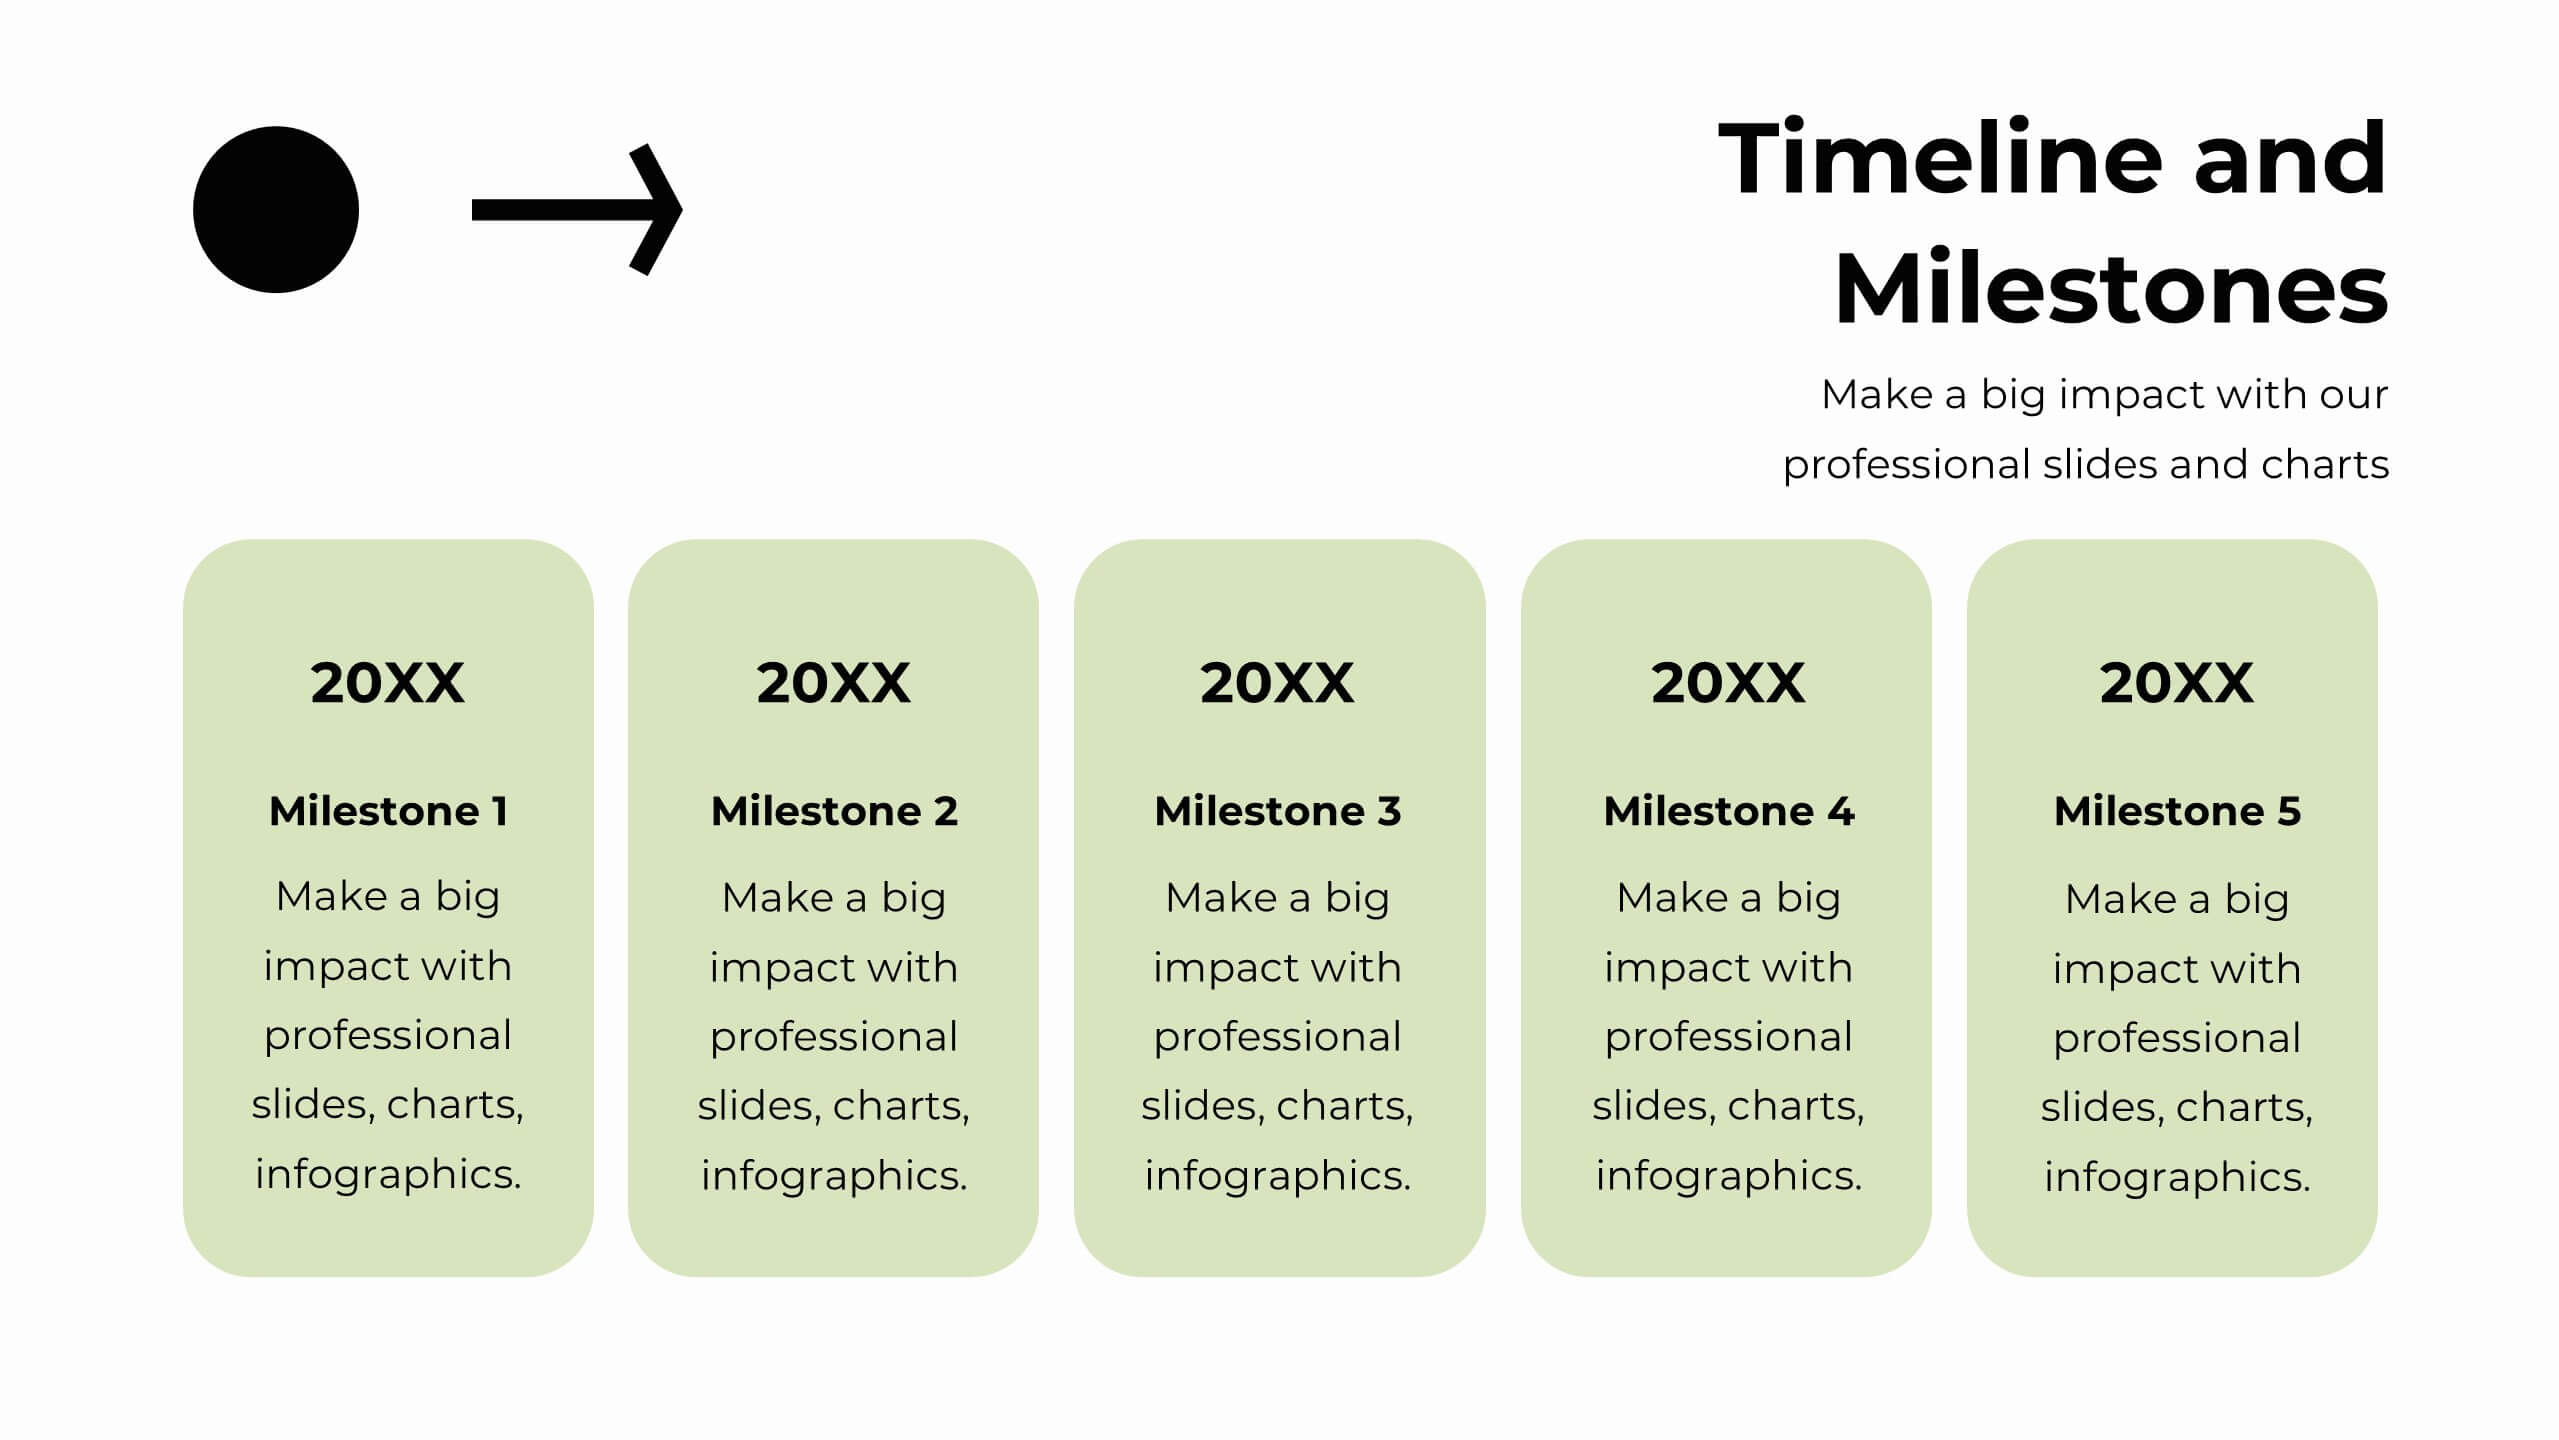
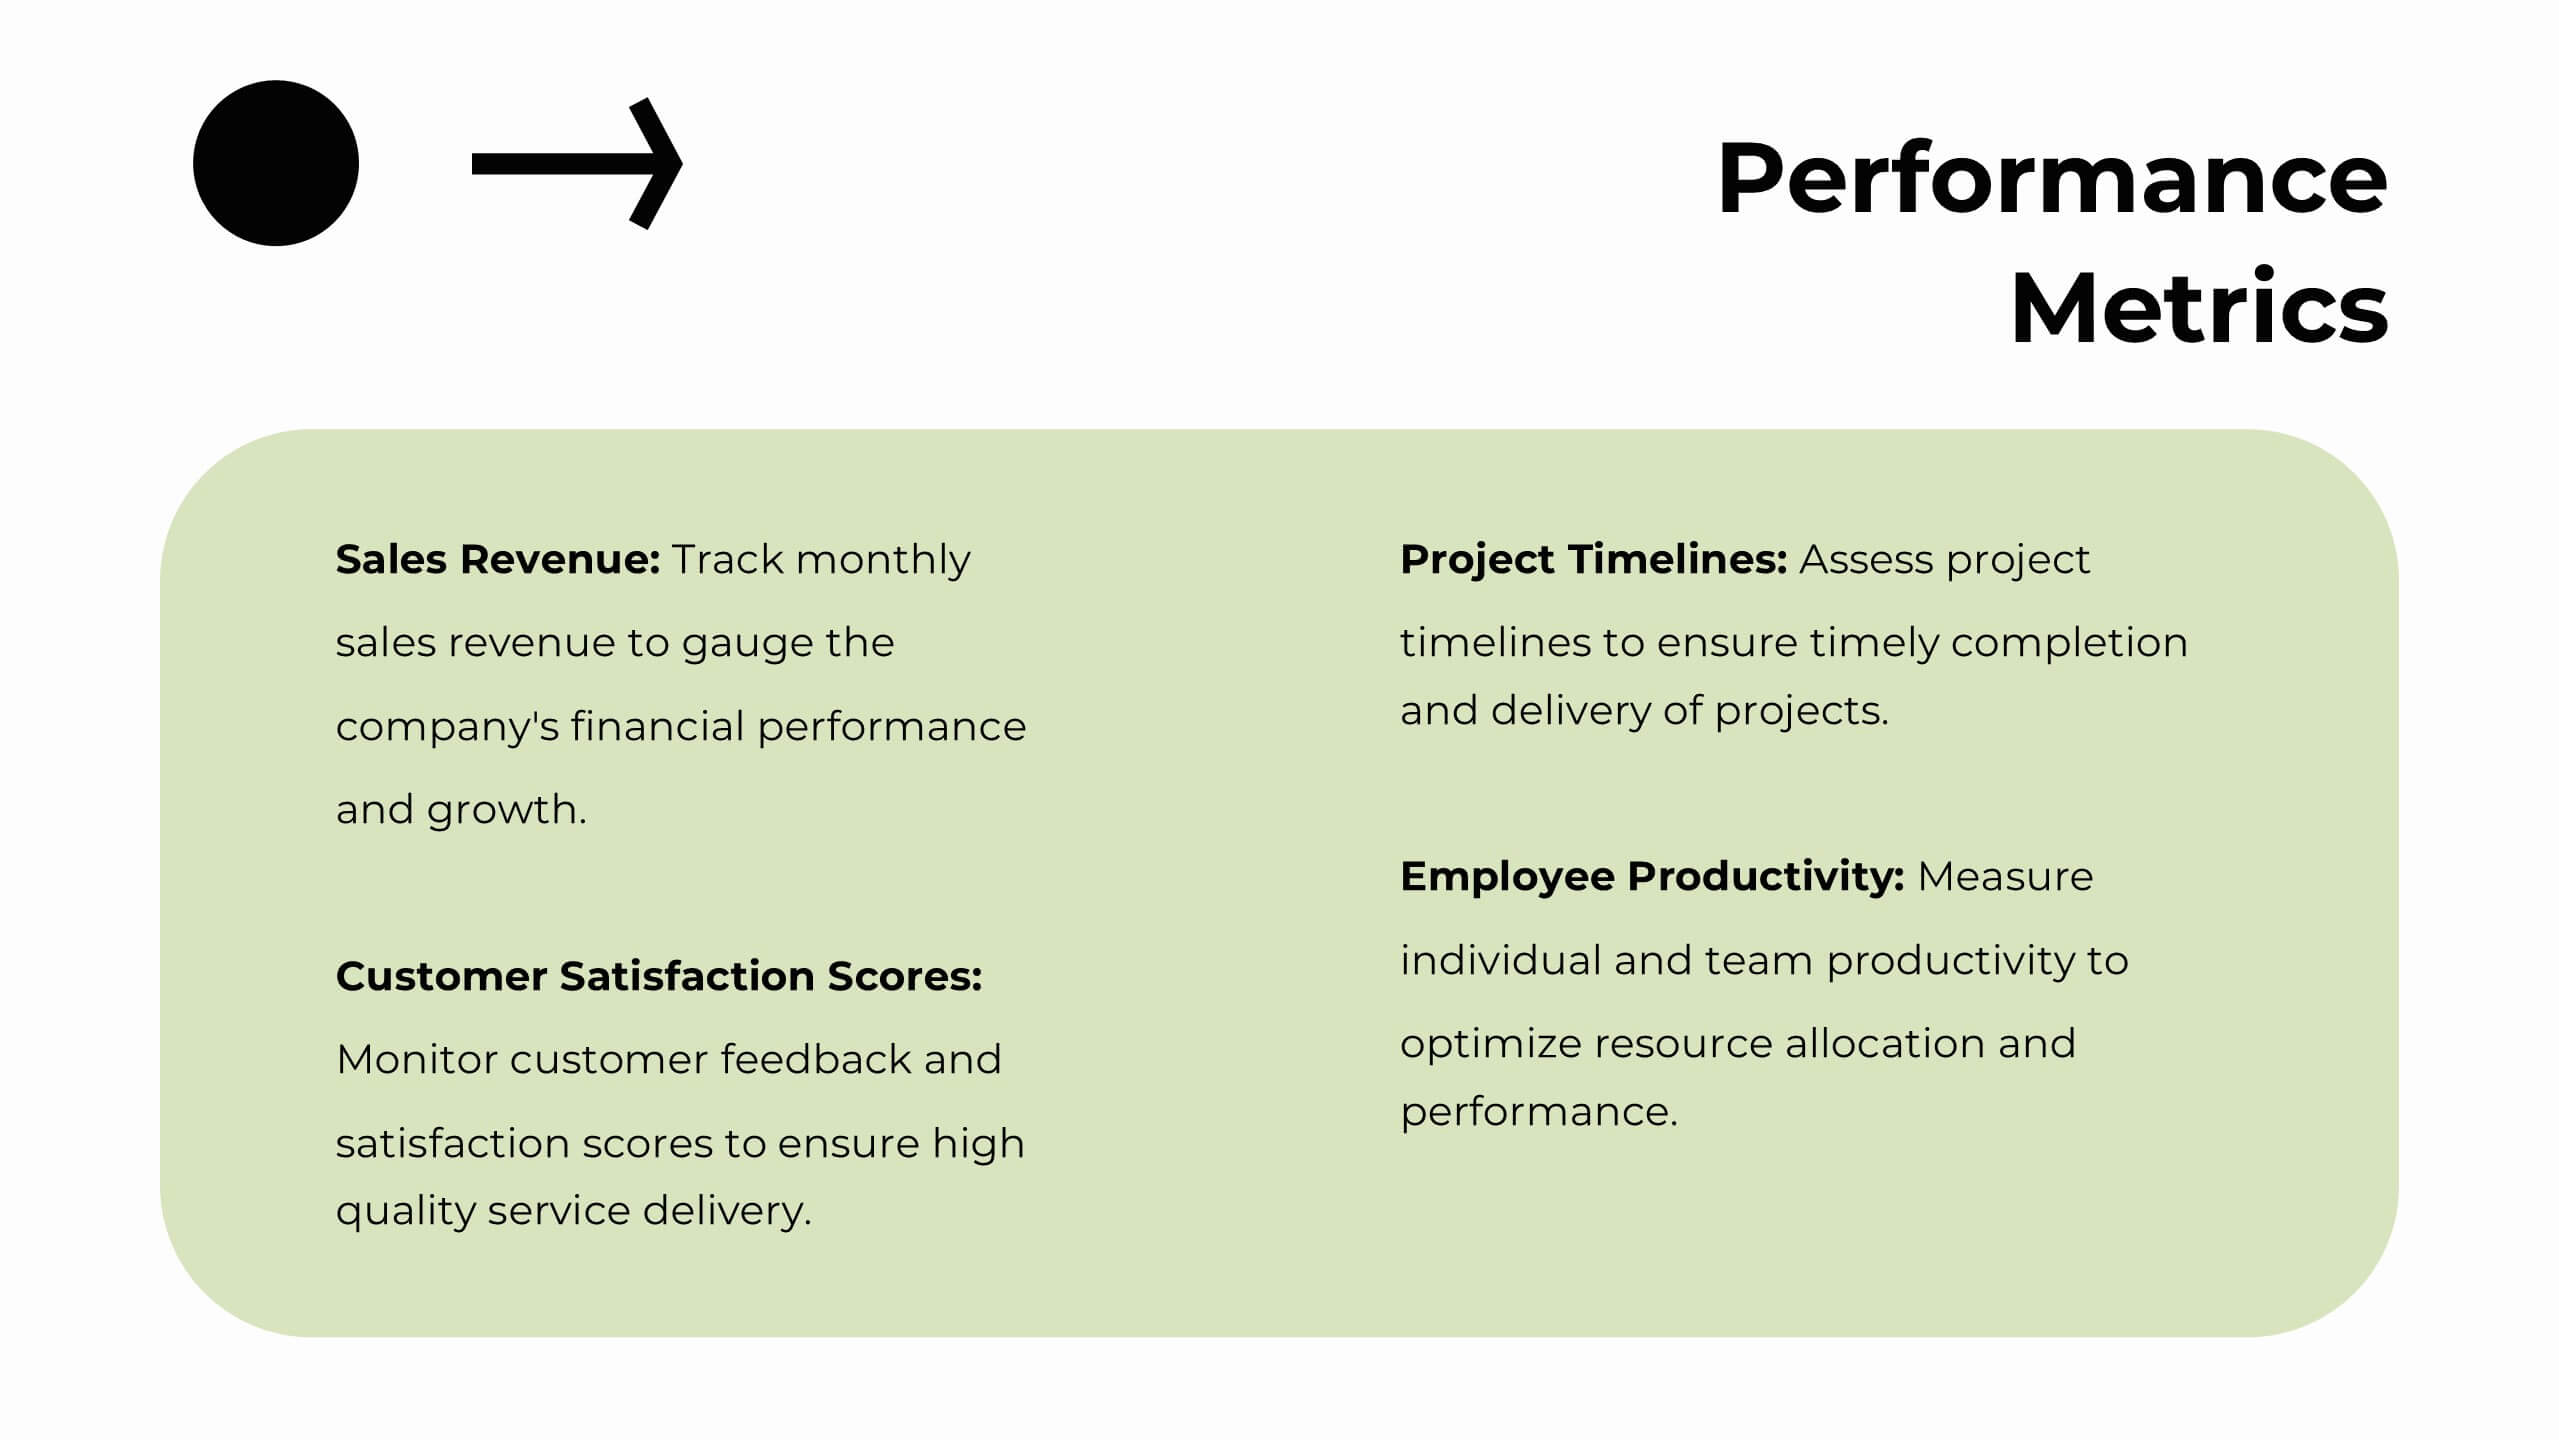
Strategic Objectives and Goals Presentation
Bring your strategy to life with a clear, forward-moving layout that makes every milestone feel achievable. This presentation guides audiences through key objectives, breakthrough goals, and measurable progress, helping teams stay aligned and inspired. Fully editable and easy to adapt, it works seamlessly with PowerPoint, Keynote, and Google Slides.


6 slides
Sales Team Infographic
The series presented showcases various slide templates tailored for enhancing sales team strategies and communication. Each slide is crafted to assist sales professionals in detailing team structures, sales goals, performance metrics, and strategic initiatives effectively. Utilizing vibrant color blocks and streamlined design elements, these templates make complex sales data approachable and engaging, facilitating clear and impactful presentations. The collection is designed with adaptability in mind, incorporating elements that can be easily customized to fit different team needs and company branding. These include comparative layouts for benchmarking, timeline formats for showcasing sales cycles, and diagrammatic representations for visualizing sales processes and results. Perfect for internal meetings, sales training sessions, and stakeholder presentations, these templates serve as essential tools for sales leaders to convey their team’s progress, celebrate wins, and strategize for future sales endeavors.


7 slides
Education Infographic Presentation Template
An education infographic is a visual representation of information related to education. It is used to present information in a clear, concise and easy-to-understand manner. It can be used to show statistics, facts, or data on a variety of educational topics such as student enrollment, graduation rates, test scores, and more. This template has bright and colorful photo designs that make it fun to use and easy to read. You can add your own pictures and customize the colors to make it look just the way you want. This template has many charts and graphs you can use to show all kinds of information.


5 slides
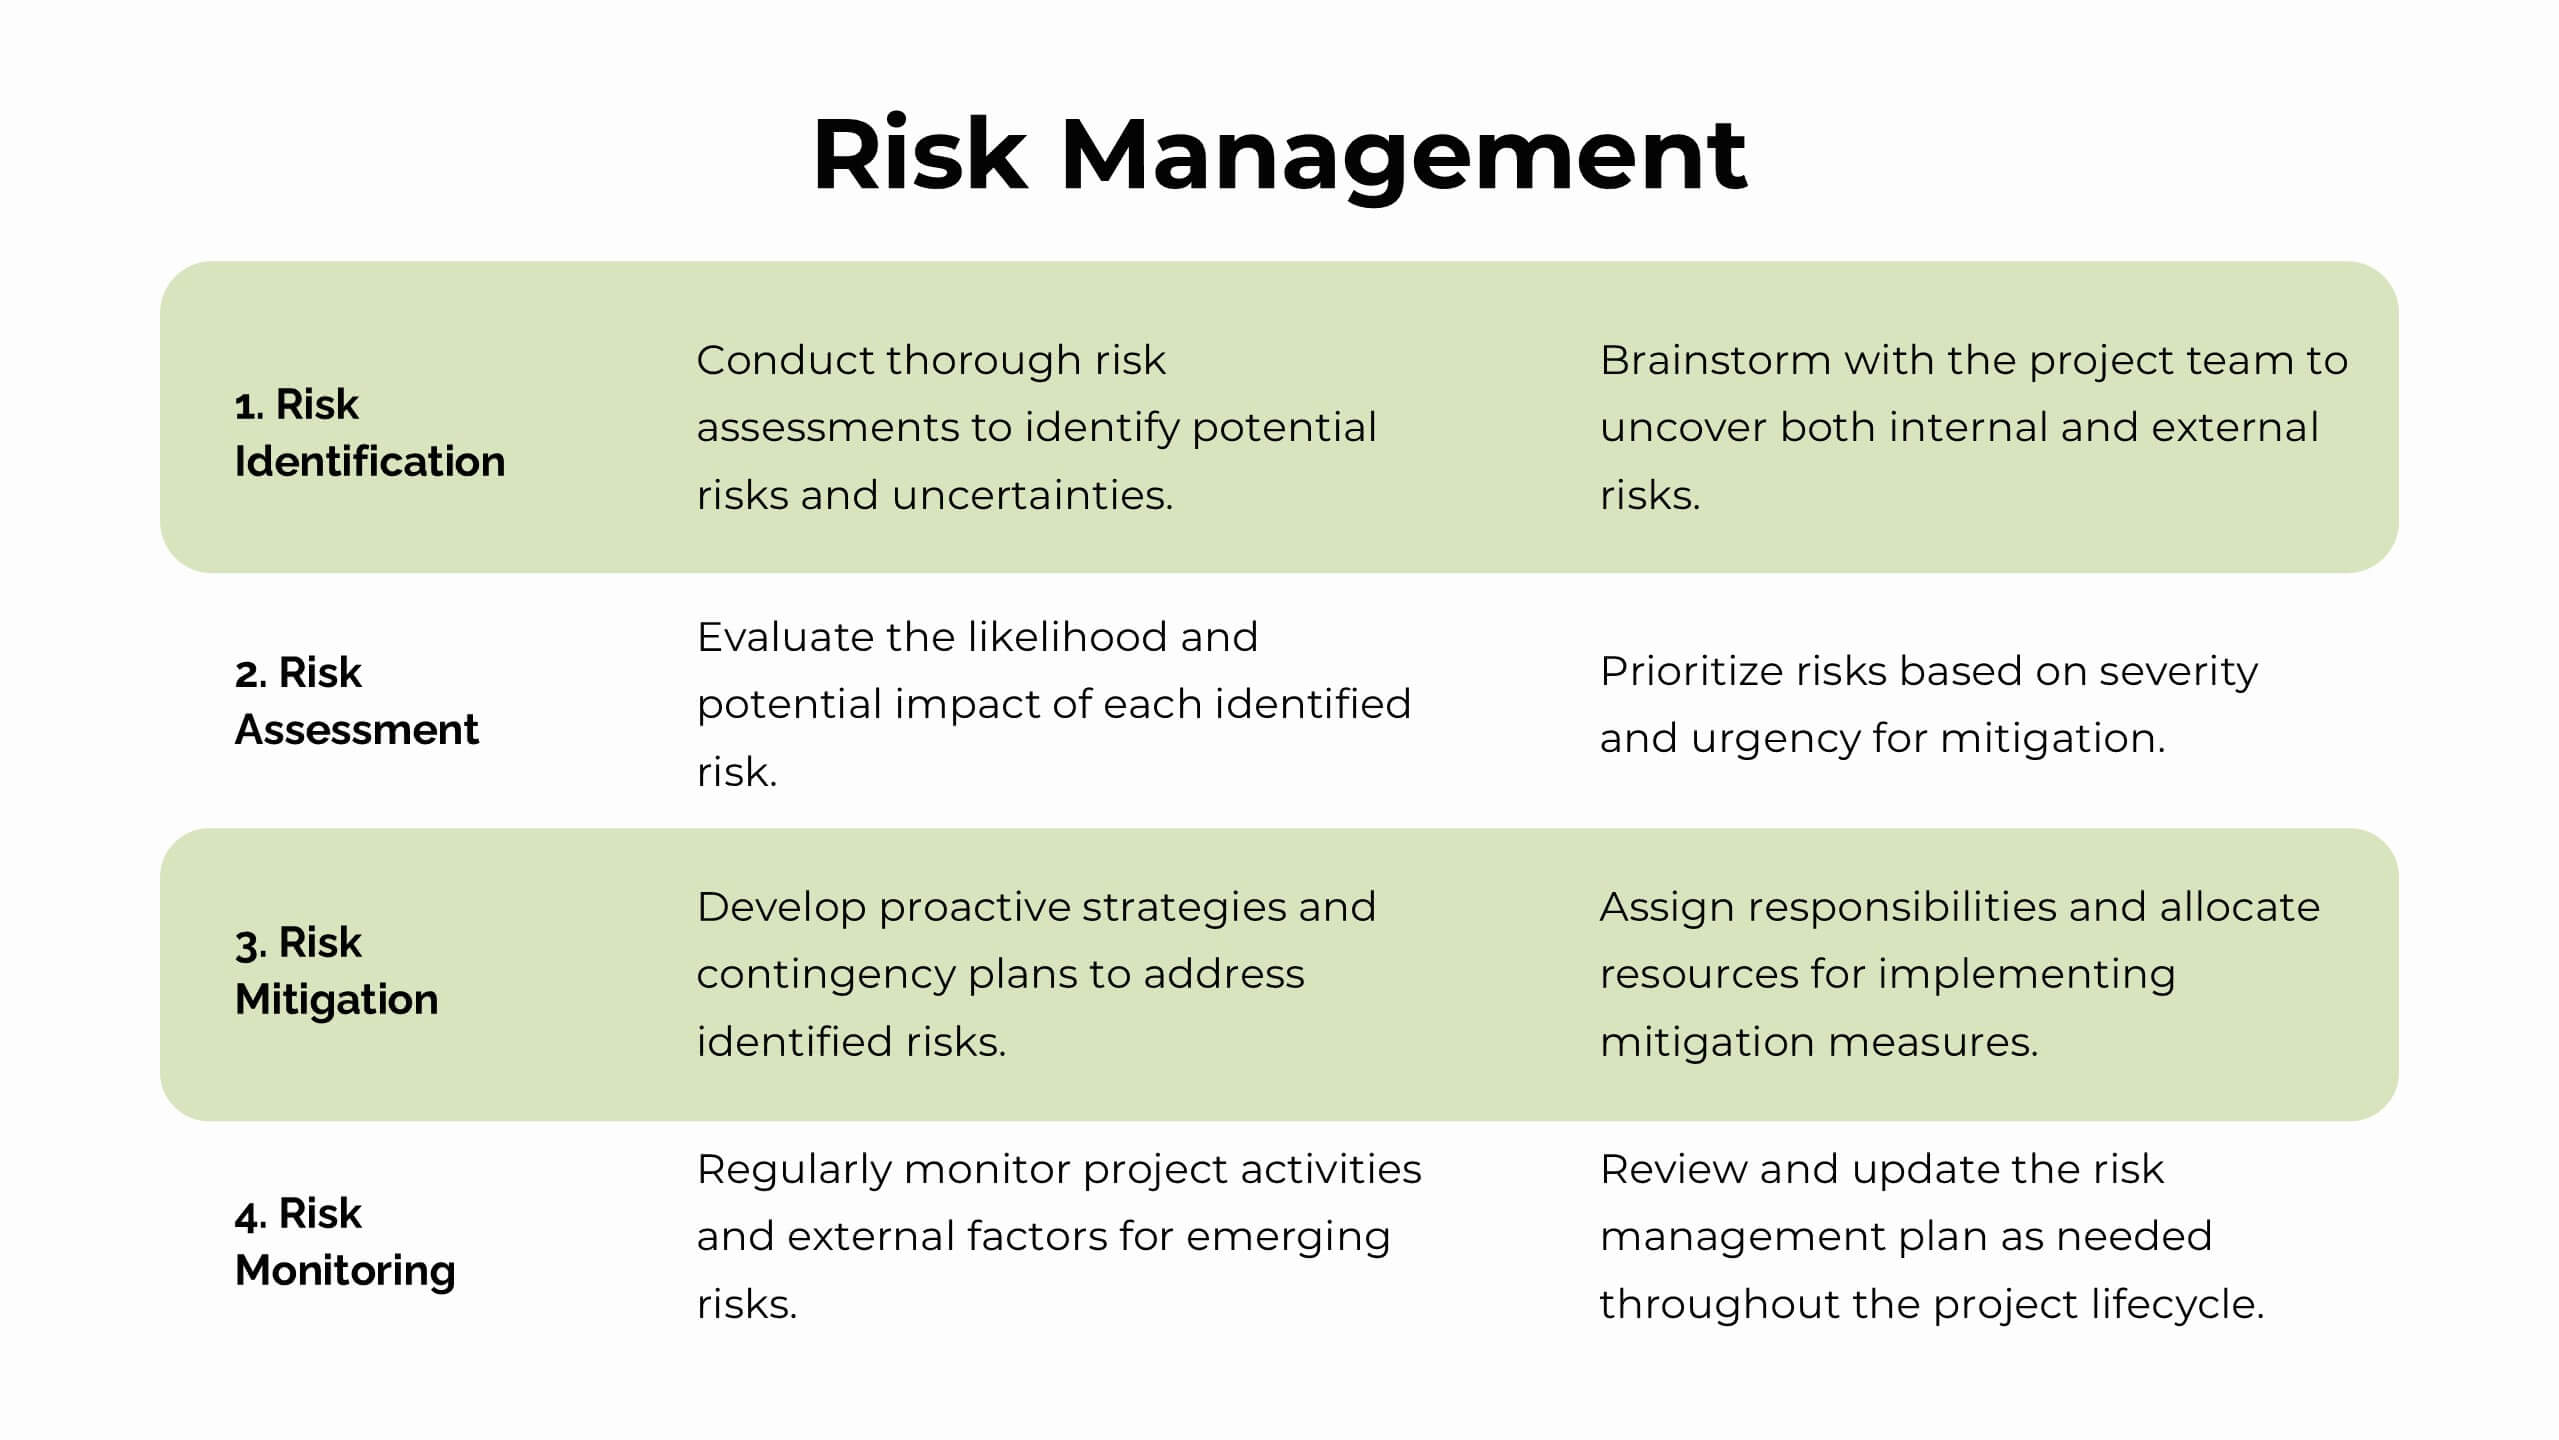
Risk Detection Techniques Presentation
Spot potential risks before they escalate with this step-by-step risk detection visual. Featuring ascending block elements and a dynamic layout, this template is ideal for illustrating detection stages or evaluation metrics. Fully editable in PowerPoint, Keynote, and Google Slides—perfect for risk management, audit reports, or compliance presentations.


6 slides
Organizational Change Management Strategy Presentation
Navigate organizational change effectively with this dynamic and structured presentation slide. Featuring a puzzle-piece design, this template visually represents the interconnected steps of change management. Ideal for business leaders, HR professionals, and consultants, it helps illustrate transition processes, strategic adjustments, and team alignment. Fully editable, allowing you to customize text, colors, and layout to fit your business needs. Compatible with PowerPoint, Keynote, and Google Slides for effortless use.


21 slides
Galactic Strategic Planning Report Presentation
Launch your strategic vision into the stars with this captivating Galactic-themed presentation template! Ideal for presenting a strategic planning report, it allows you to outline goals, action plans, and performance metrics with a sleek, cosmic design that captures attention. Compatible with PowerPoint, Keynote, and Google Slides for easy, seamless customization.


10 slides
Adapting to Business Transformation Presentation
Guide your audience through change with this dynamic, step-by-step layout tailored for showcasing transformation journeys. The slide features a curved flow design with five customizable stages, perfect for visualizing digital shifts, organizational restructuring, or innovation roadmaps. Best for corporate strategists, consultants, and change managers. Fully editable in PowerPoint, Keynote, and Google Slides.
23 slides
Zirconium Strategic Planning Report Presentation
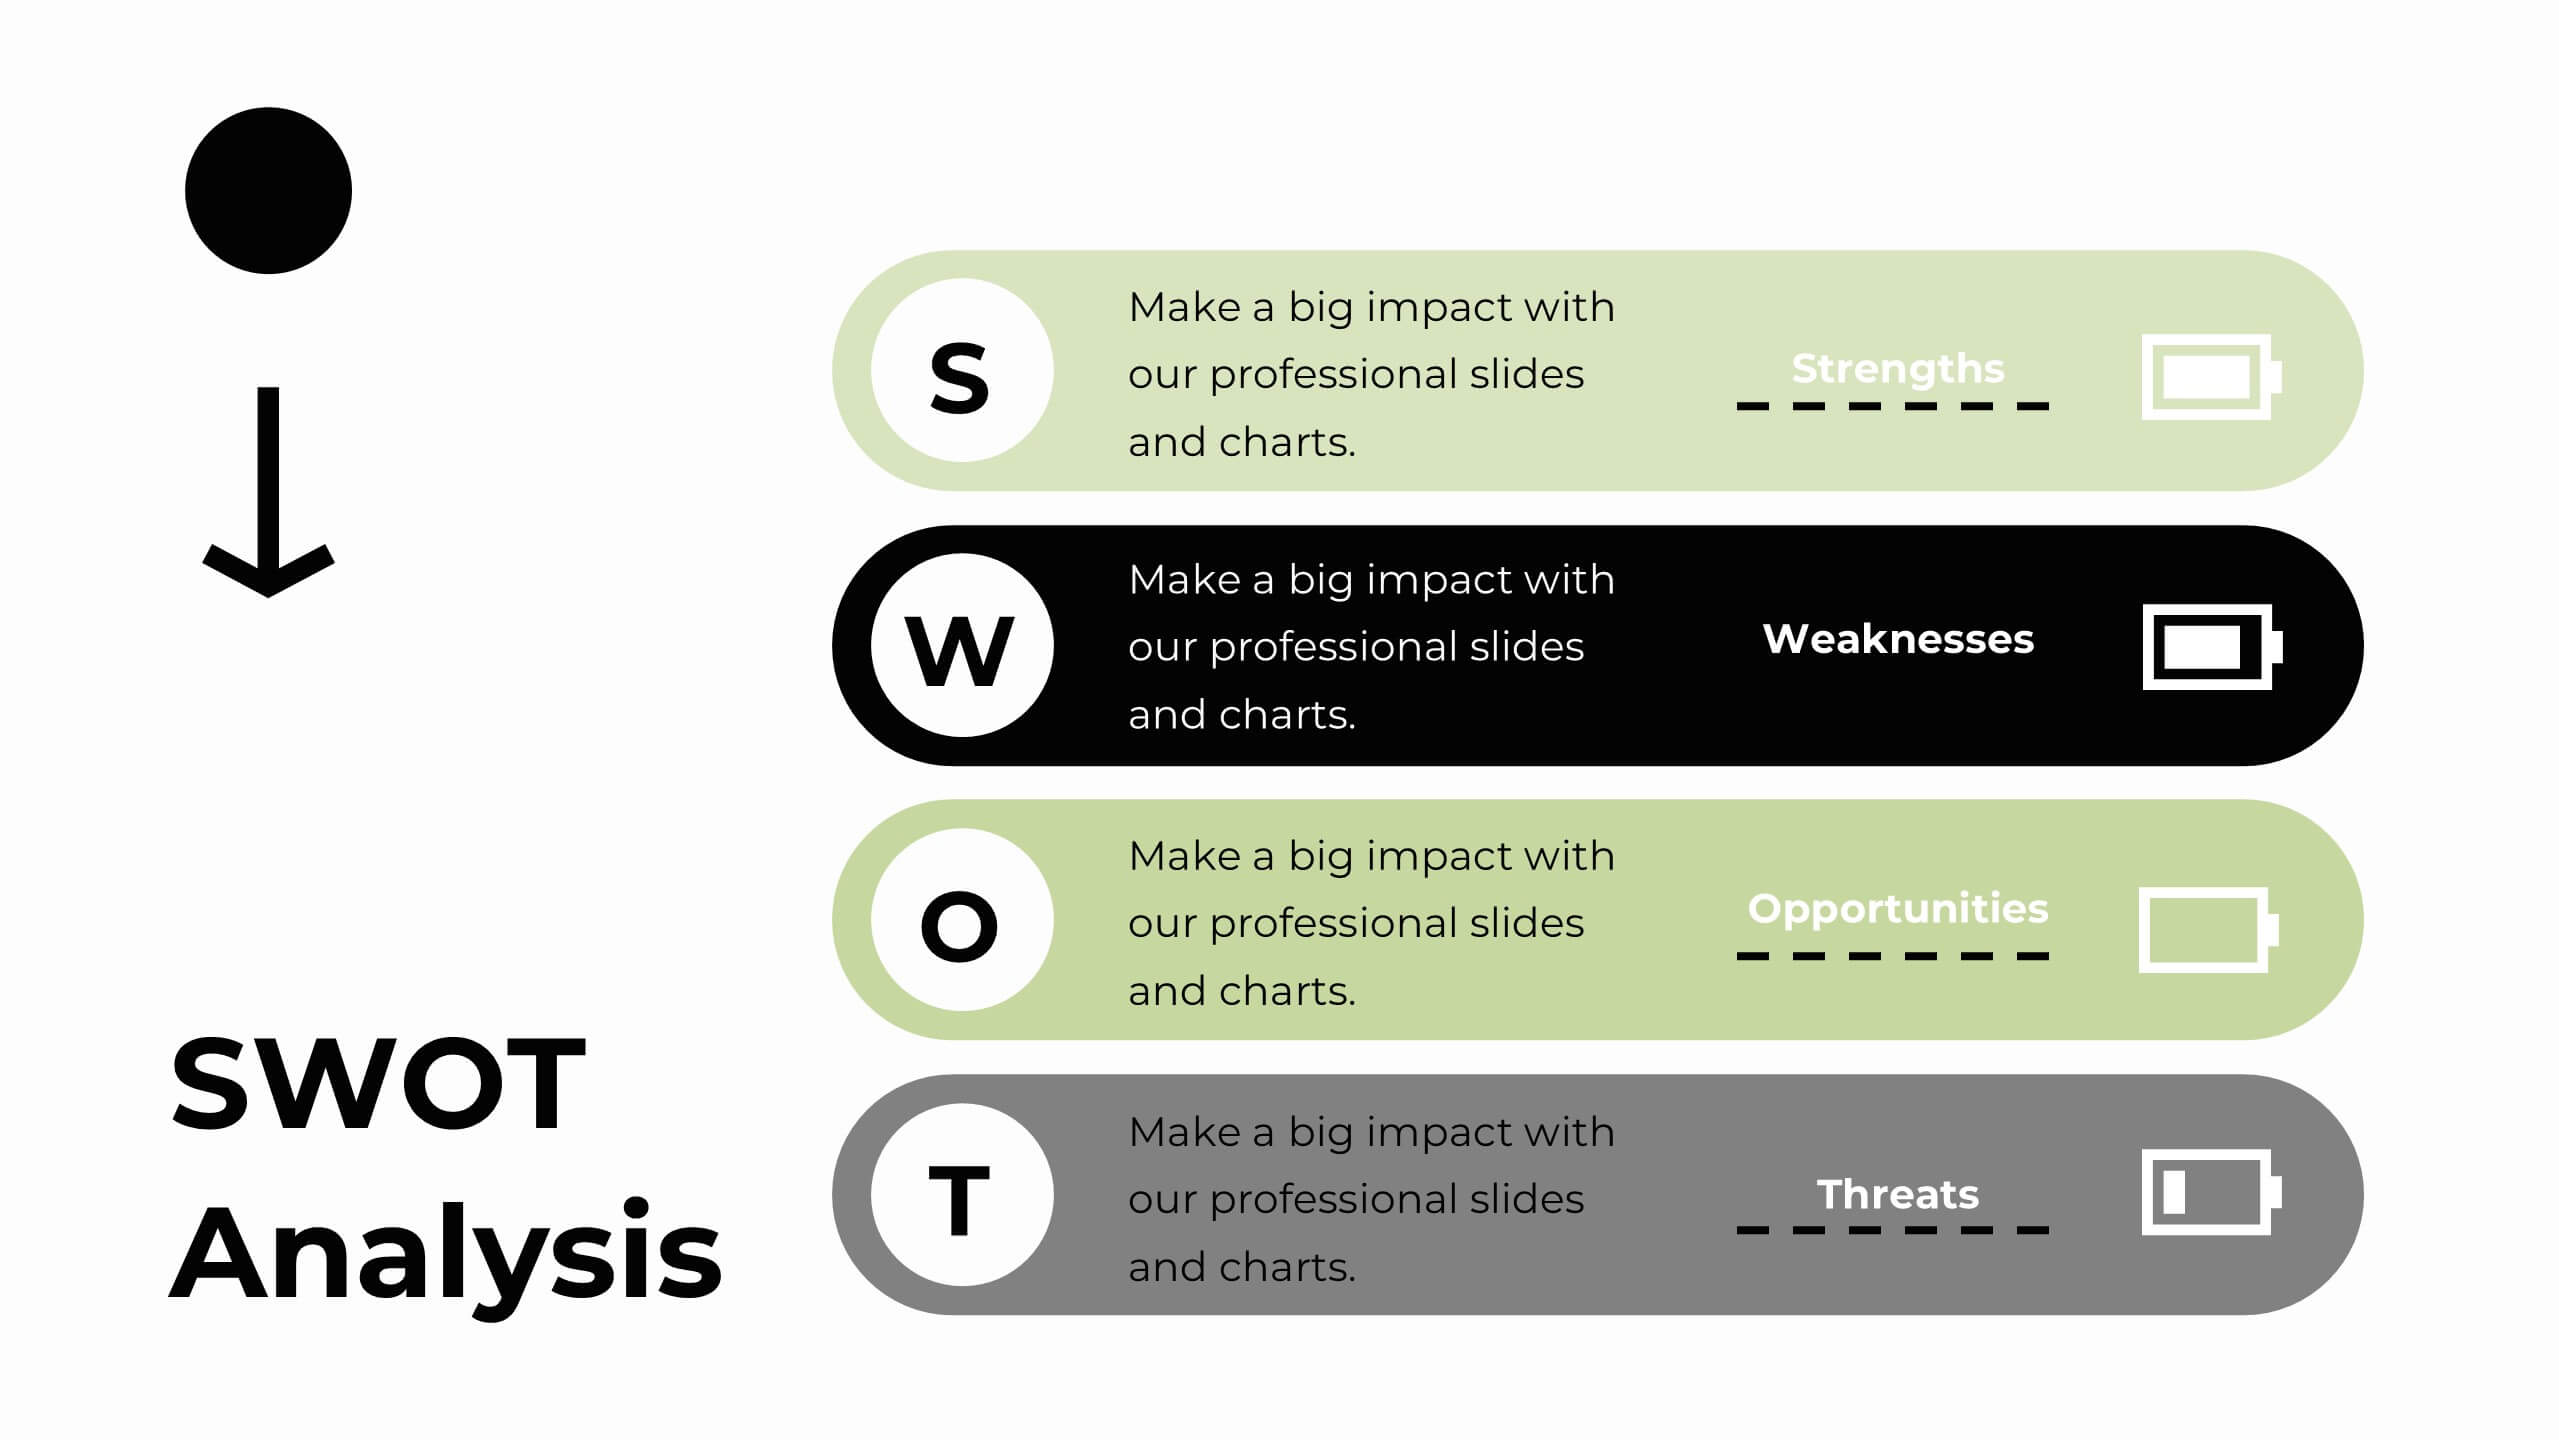
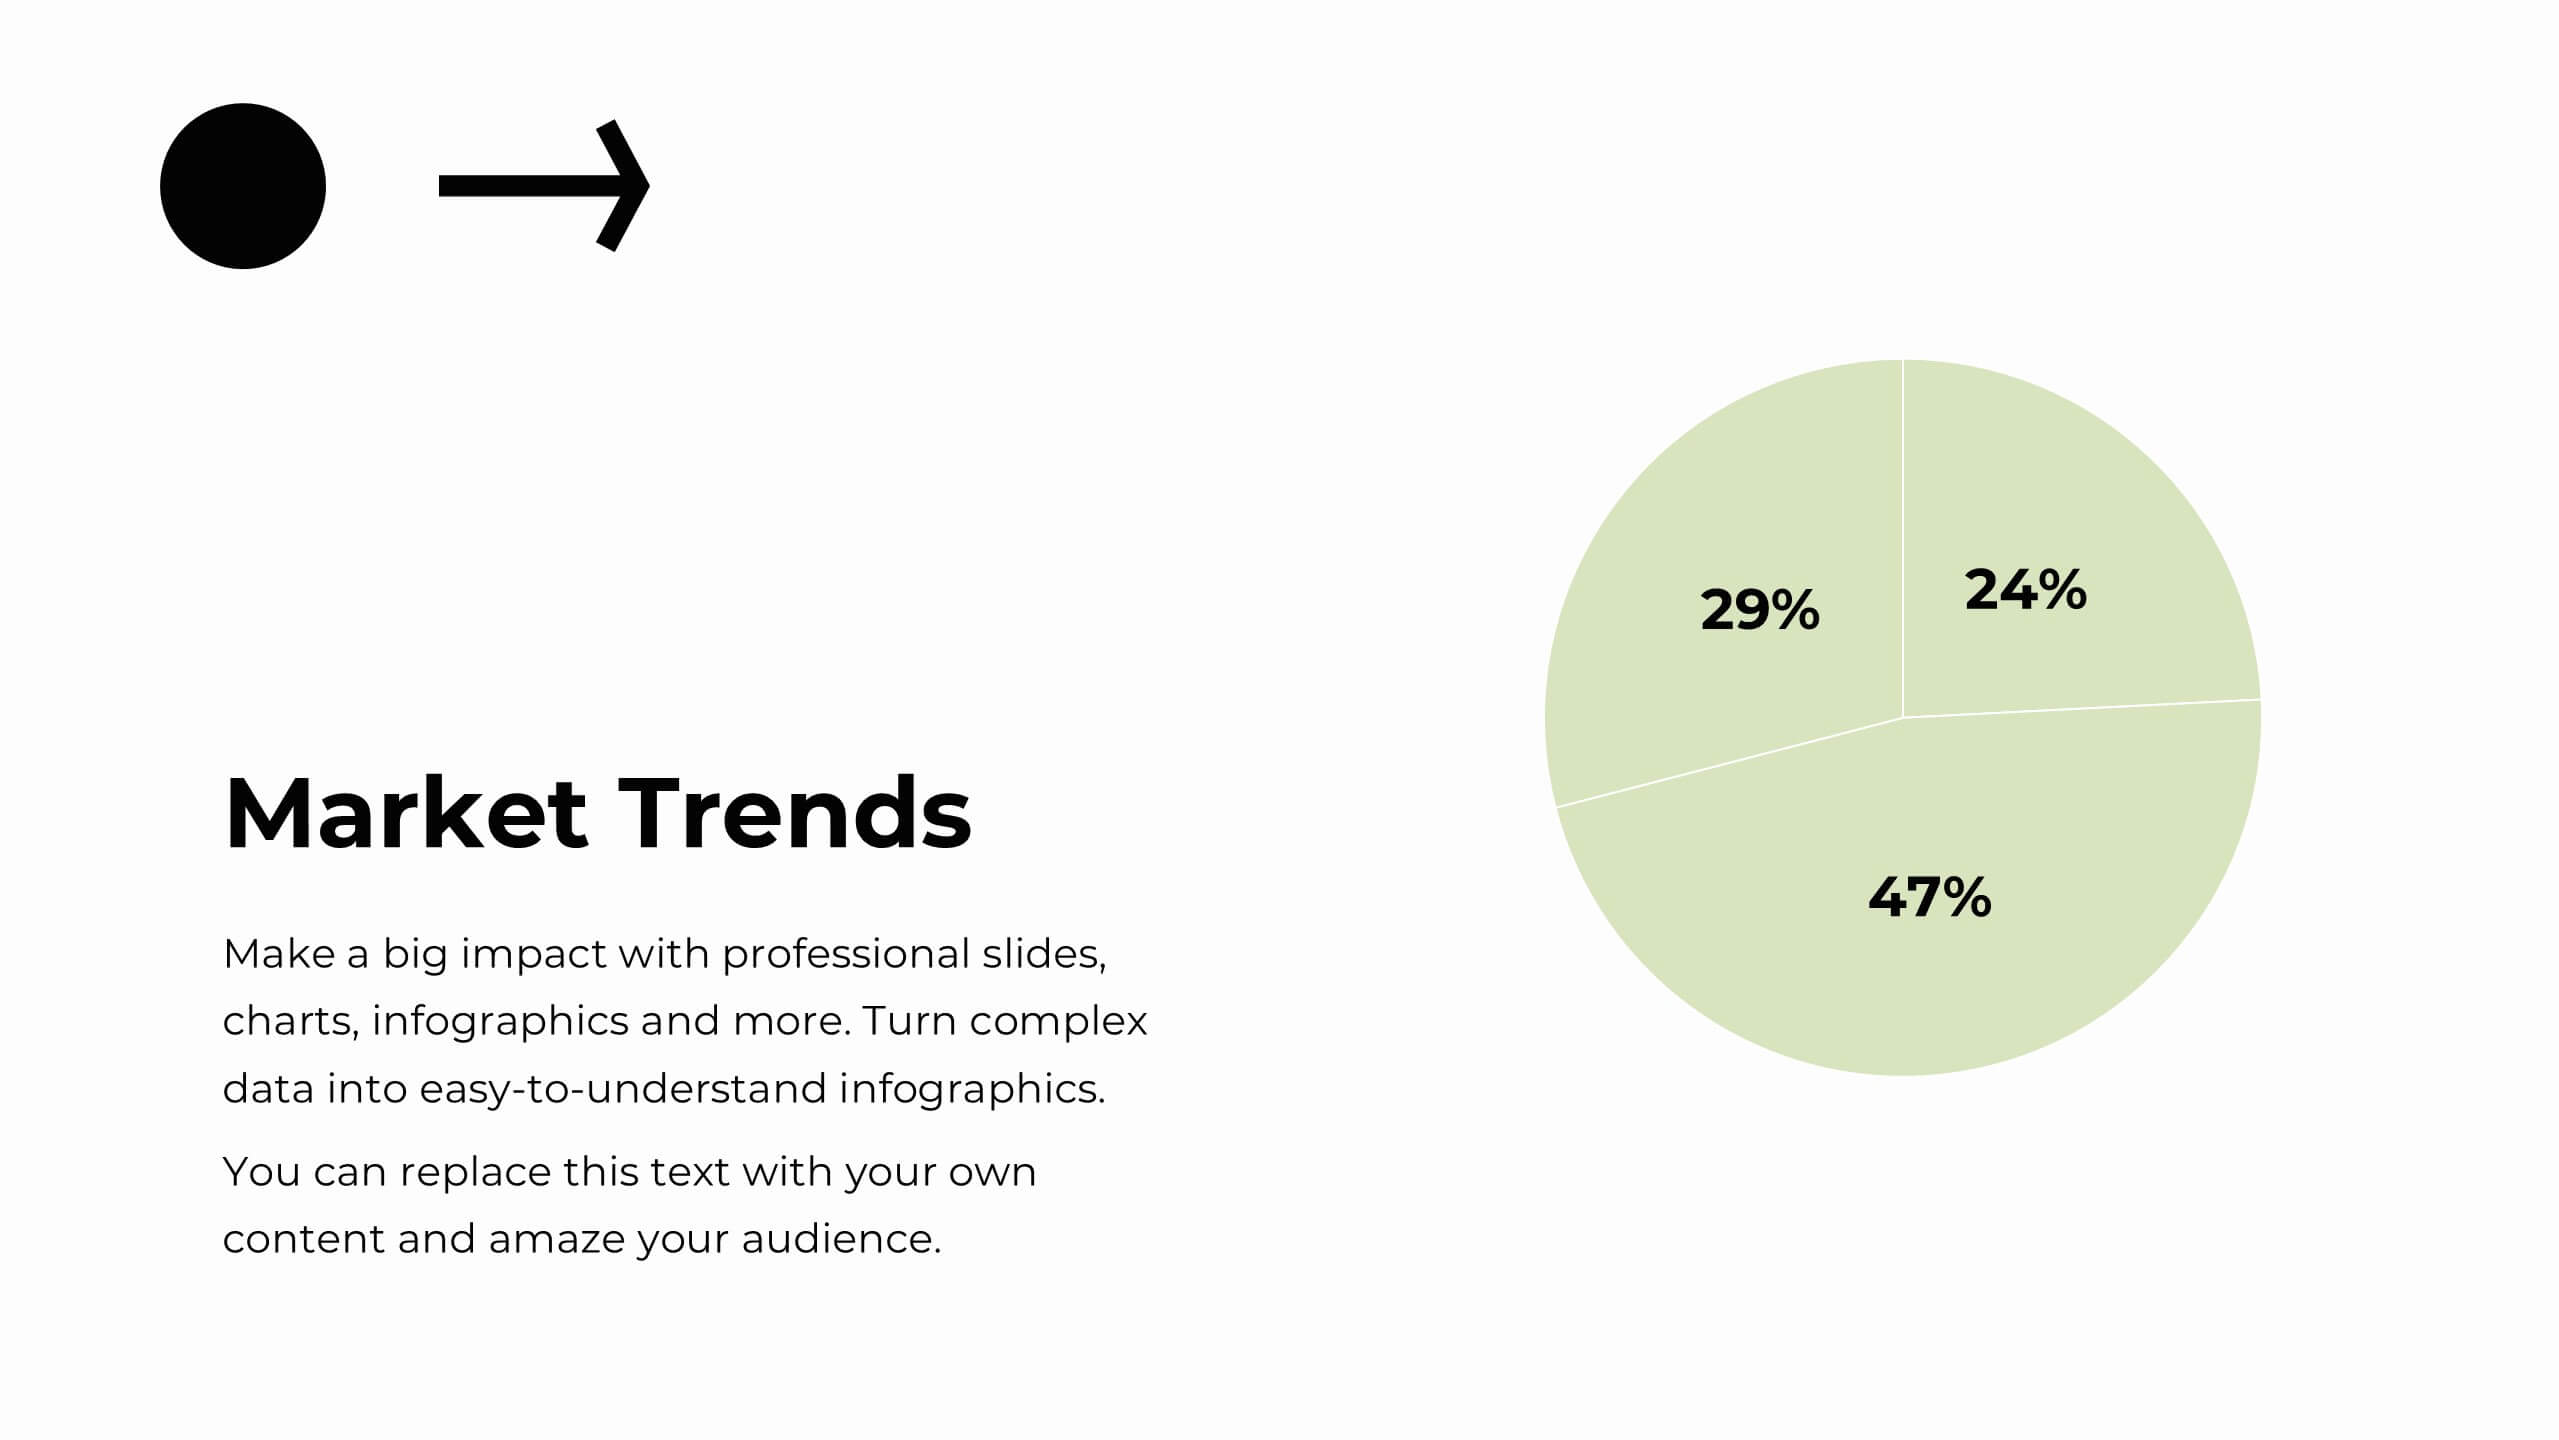
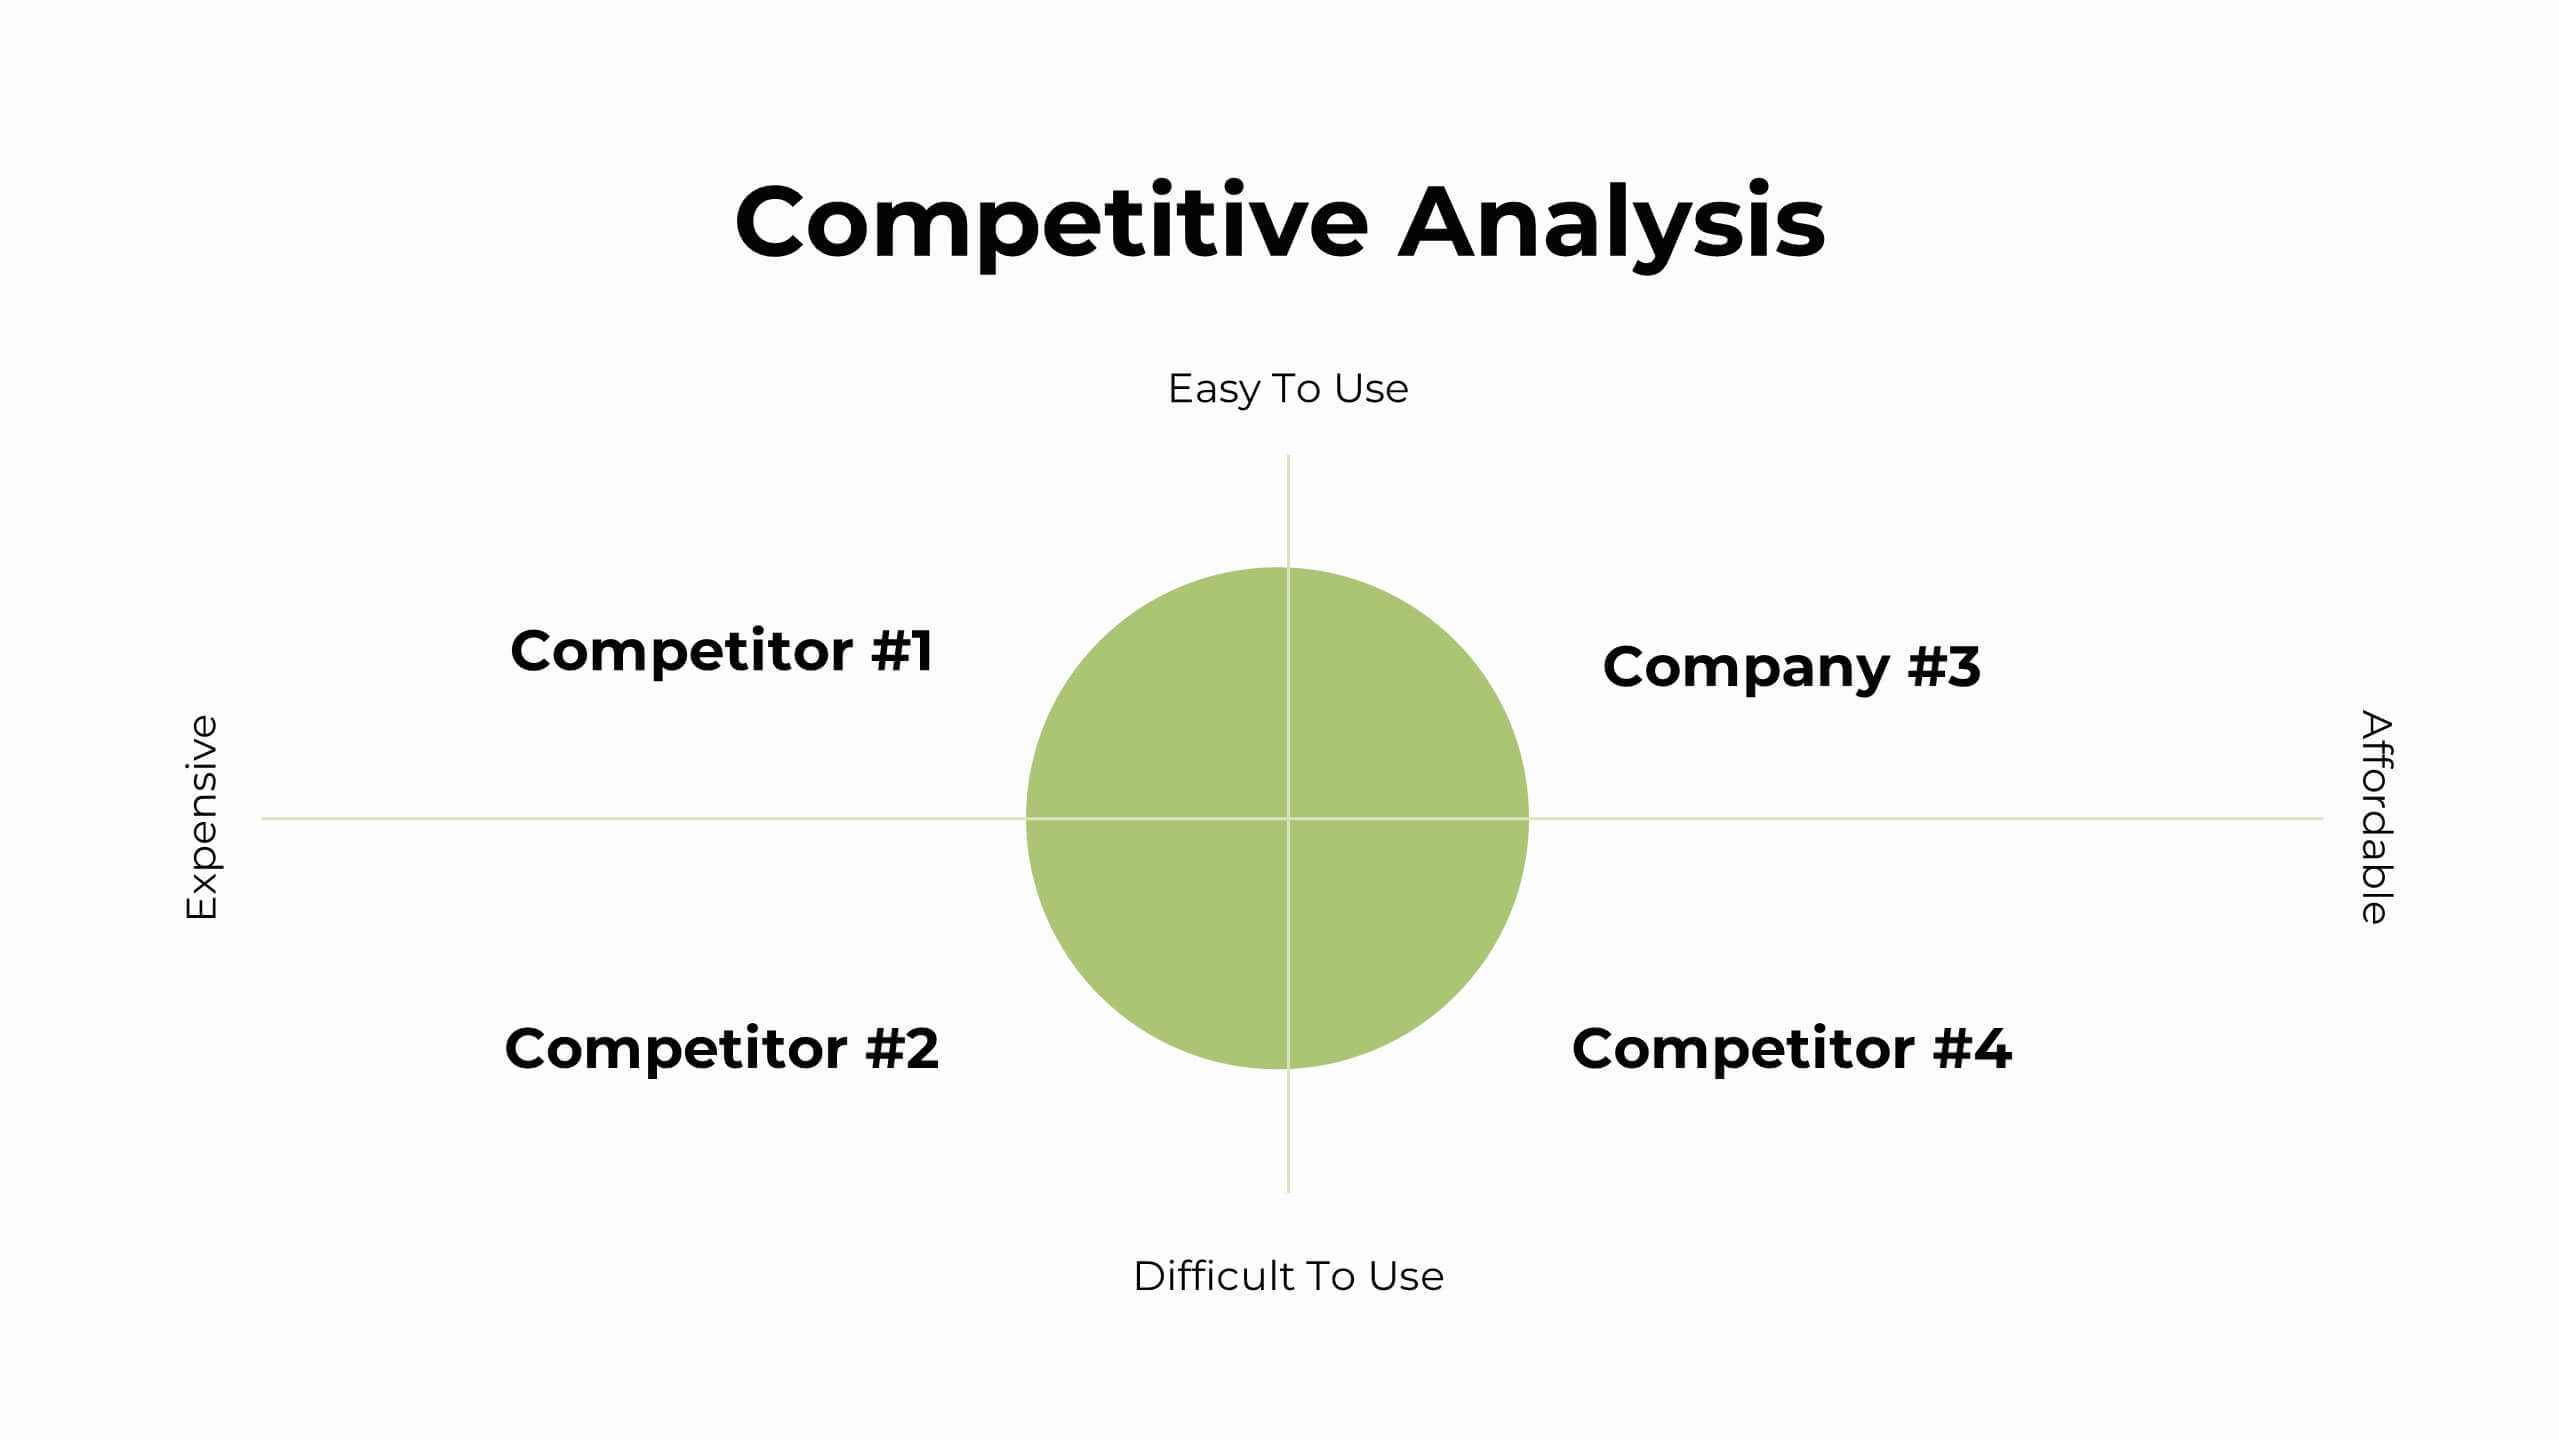
Plan and present your strategies with precision using this comprehensive strategic planning report template! Designed for clear communication of goals, market trends, SWOT analysis, and growth opportunities, it’s perfect for aligning team objectives and driving success. Fully customizable and compatible with PowerPoint, Keynote, and Google Slides, this template is ideal for strategic initiatives and performance reviews.


21 slides
Apollo Sales Pitch Deck Template Presentation
Create an impressive sales pitch with this sophisticated template. Highlight your company overview, problem statement, solutions, and market opportunities. Showcase your unique selling proposition and marketing strategy. Ideal for PowerPoint, Keynote, and Google Slides.


6 slides
Innovation Pipeline and Idea Execution
Streamline your innovation process with the Innovation Pipeline and Idea Execution Presentation. This clean, layered funnel layout is ideal for visualizing each stage from idea generation to implementation. Perfect for R&D teams, product managers, or corporate strategists, this slide is fully editable in PowerPoint, Keynote, and Google Slides.


6 slides
Harvey Ball Assessment Infographics
Evaluate performance or satisfaction with our Harvey Ball Assessment infographic template. This template is fully compatible with popular presentation software like PowerPoint, Keynote, and Google Slides, allowing you to easily customize it to represent and communicate assessment results using Harvey Balls. The Harvey Ball Assessment infographic template offers a visually engaging platform to visually depict evaluations, ratings, or levels of satisfaction using Harvey Balls. Whether you're a manager, HR professional, or evaluator, this template provides a user-friendly canvas to create informative presentations and reports to convey assessment outcomes effectively. Enhance your assessment reporting with this SEO-optimized Harvey Ball Assessment infographic template, thoughtfully designed for clarity and ease of use. Customize it to showcase assessment data, ratings, and scores, making it a valuable tool for sharing performance or satisfaction levels with your audience. Start crafting your personalized infographic today to communicate your assessment results efficiently.


6 slides
Real Estate Property Market Overview Presentation
Present key property market insights using this structured, easy-to-follow layout. The slide features six labeled sections flanking a central house graphic—ideal for highlighting data points, regional comparisons, or investment factors. Fully customizable in Canva, PowerPoint, and Google Slides, making it perfect for real estate reports, pitches, or client presentations.


6 slides
Business Milestone Roadmap
Visualize key achievements and future goals with this dynamic Business Milestone Roadmap. Perfect for project planning, annual reviews, or startup timelines, this layout walks through five key years or phases with clear markers and icons. Fully editable in PowerPoint, Keynote, and Google Slides.