


Features
- 4 Unique slides
- Fully editable and easy to edit in Microsoft Powerpoint, Keynote and Google Slides
- 16:9 widescreen layout
- Clean and professional designs
- Export to JPG, PDF or send by email


Do you have any questions?
Recommend


5 slides
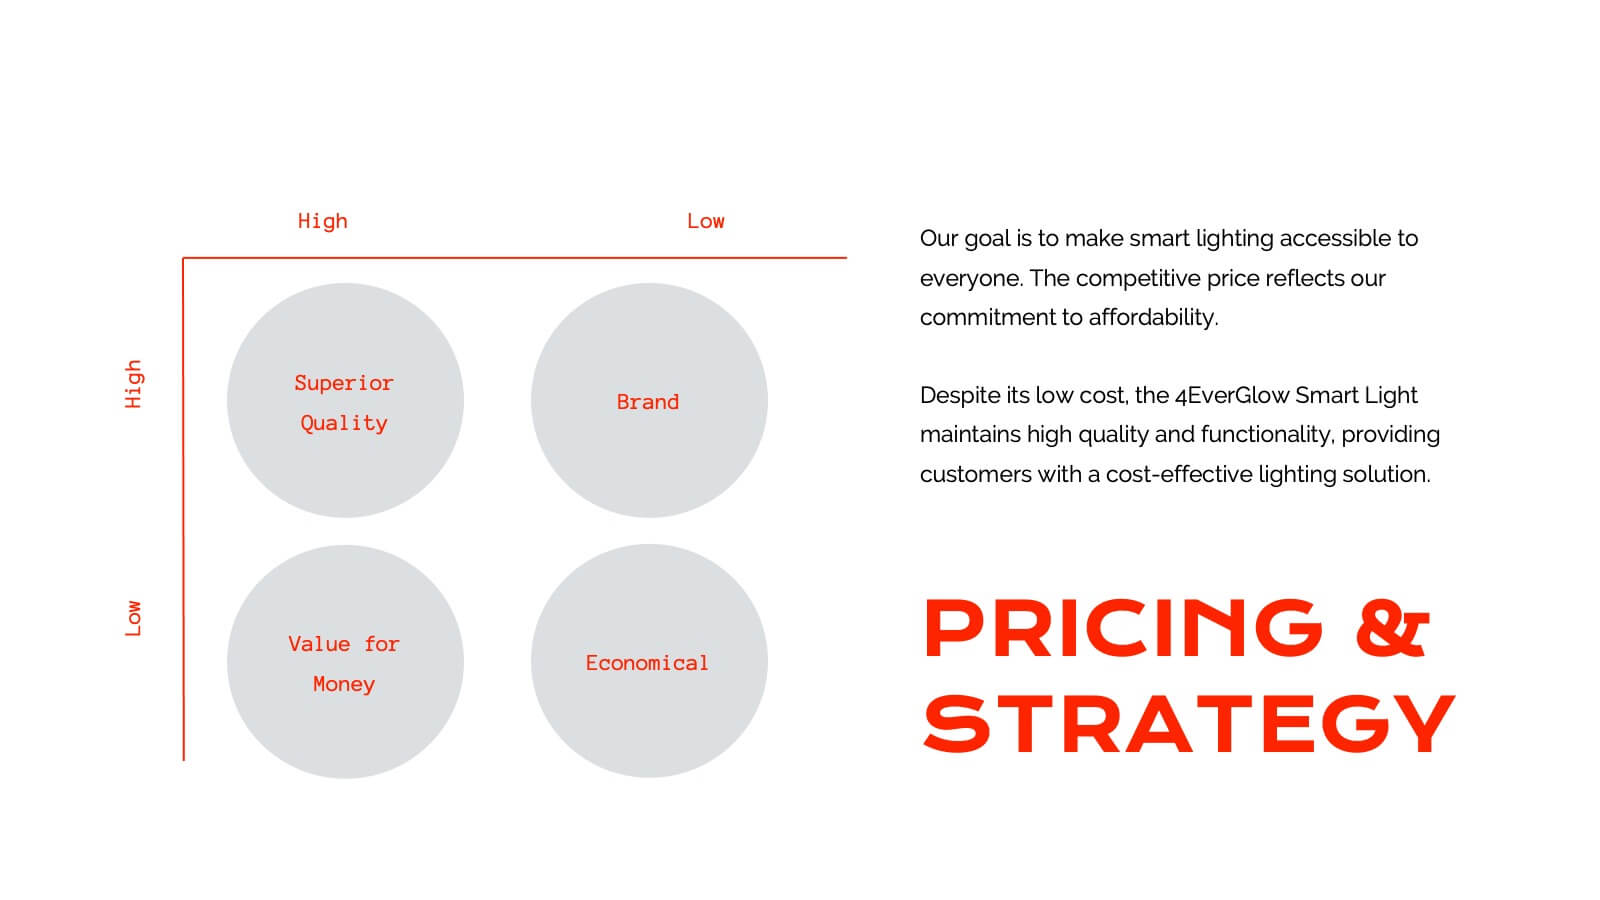
Business Matrix Model Presentation
Clearly define your strategy with this Business Matrix Model Presentation. This slide visualizes four key segments in a grid layout, perfect for mapping business priorities, comparing performance, or identifying growth opportunities. Each quadrant is color-coded and labeled, making it easy to explain complex concepts. Ideal for business planning, SWOT analysis, or strategy workshops. Fully editable in PowerPoint, Keynote, and Google Slides.


4 slides
Market Research Survey Insights Presentation
Showcase key data from your latest research with this bold, megaphone-themed survey slide. Ideal for presenting percentages and key findings side-by-side, this layout draws attention to market trends, consumer feedback, or audience segmentation. Fully editable in PowerPoint, Keynote, and Google Slides.


5 slides
Fitness Program Infographics
A fitness program is a structured plan designed to improve and maintain physical health and well-being. These vertical infographics outline the key elements and benefits of a fitness program. This template is ideal for gyms, personal trainers, and fitness enthusiasts looking to educate and inspire others to adopt a healthy and active lifestyle. The infographics offer space to include customizable workout plans tailored to different fitness levels, such as weight loss, muscle gain, or overall fitness improvement. Helpful nutrition tips are incorporated to complement the fitness program, emphasizing the importance of achieving fitness goals.


5 slides
Corporate Teamwork Presentation
The "Corporate Teamwork" presentation template visually captures the interconnectivity of team roles and tasks. Each slide features a circular flow diagram with icons representing different aspects of business teamwork. The dynamic arrangement of the icons around the central circle helps illustrate the cyclical nature of team processes and collaboration. This template allows for customization with text and color coding, making it easy to adapt to specific corporate environments or team structures. It's a great tool for presentations aimed at enhancing teamwork strategies or demonstrating the flow of tasks within team settings.


5 slides
Strategic Framework Slide Presentation
Turn your strategy into a story that flows with clarity and precision using this clean, timeline-based presentation design. Ideal for illustrating project phases, corporate planning, or growth roadmaps, it keeps information structured and engaging. Fully editable and compatible with PowerPoint, Keynote, and Google Slides for seamless customization.


4 slides
Visual Relationships in Venn Format Presentation
Highlight similarities and differences between two or more ideas using this clean, two-circle Venn diagram layout. Ideal for comparing concepts, teams, or strategies. Customize icons, text, and color themes effortlessly. Compatible with PowerPoint, Keynote, and Google Slides—perfect for business meetings, educational content, and marketing comparisons.


8 slides
Europe Market Trends with Europe Map Presentation
Showcase key market insights with this Europe-focused presentation. Highlight regional trends using data-driven visuals, including percentage indicators and color-coded country comparisons. Ideal for marketing reports, business expansion plans, or performance reviews. Fully editable and compatible with PowerPoint, Keynote, and Google Slides for seamless customization across platforms.


6 slides
Executive Summary Marketing Infographic
An executive summary is a concise overview of a longer document, report, or proposal, designed to provide readers with a quick understanding of the main points and key takeaways. This infographic template provides a concise and visually appealing overview of a marketing plan, campaign, or strategy. This condenses key information into a format that is easy to understand and presents the most important highlights for decision-makers. This template is a valuable tool to quickly convey the main points and benefits of a document, allowing readers to make informed decisions about whether to delve deeper into the details.


7 slides
Compliance Gap Analysis Infographic
Navigate the complexities of organizational compliance with our compliance gap analysis infographic. Using a vibrant palette of orange, white, and green, this infographic elucidates the differences between current compliance practices and desired standards. Specifically designed for business analysts, compliance officers, and risk managers, this template is an invaluable tool to identify, analyze, and bridge compliance-related gaps. With its fun yet informative style, communicating these insights becomes more engaging and understandable. This infographic is ready for integration with PowerPoint, Keynote, and Google Slides, ensuring smooth presentations across various platforms.


5 slides
Experience-Based Smile Scorecard Presentation
Measure sentiment with ease using this Experience-Based Smile Scorecard slide. Designed with a vertical battery-style layout, each tier represents a distinct emotional level—from dissatisfied to happy. Ideal for visualizing user experiences, customer feedback, or service quality. Fully editable and compatible with PowerPoint, Canva, and Google Slides.


24 slides
Djinn Brand Identity Presentation
Unleash the power of your brand with this sleek and modern presentation template! From brand identity components to target audience personas, this template covers everything you need to craft a cohesive and compelling brand strategy. Whether showcasing brand guidelines or success stories, it’s designed for maximum clarity and impact. Compatible with PowerPoint, Keynote, and Google Slides for effortless presentations.


5 slides
Customer Relationship Strategy Presentation
Refine your approach to customer interactions with the "Customer Relationship Strategy" presentation templates. Perfect for delineating clear, actionable strategies to enhance client engagement and satisfaction, these templates are a must-have for businesses focused on building lasting customer relationships. Compatible with PowerPoint, Keynote, and Google Slides, they provide the tools to effectively communicate your customer relationship policies and goals.


5 slides
Brainstorming Session Diagram Presentation
Spark creativity and structure your next idea session with the Brainstorming Session Diagram Presentation. Featuring a central brain icon and four labeled input areas, this layout makes it easy to visualize and organize group contributions. Fully editable in PowerPoint, Canva, and Google Slides for seamless collaboration and customization.


5 slides
Performance Progress and Achievements Presentation
Showcase your team’s accomplishments and growth over time with this visually engaging bar chart layout. Each performance level is color-coded for clarity and paired with space for concise descriptions. Ideal for reporting KPIs, quarterly wins, or business milestones. Fully customizable in PowerPoint, Keynote, and Google Slides.


7 slides
Venn Diagram Statistics Infographic Presentation
Venn diagrams are important because they show relationships between two or more ideas. The circles—either filled in with color or left empty—create a picture of how things relate to one another, while arrows show which things are overlapping. This template is easy to use and has a cool green color scheme that is easy on the eyes. It has a customizable layout to make your presentation unique! With this template, you can create awesome Venn Diagrams that will help you compare and contrast information in a way that is easy to understand. This is perfect for school projects or even work presentations.


21 slides
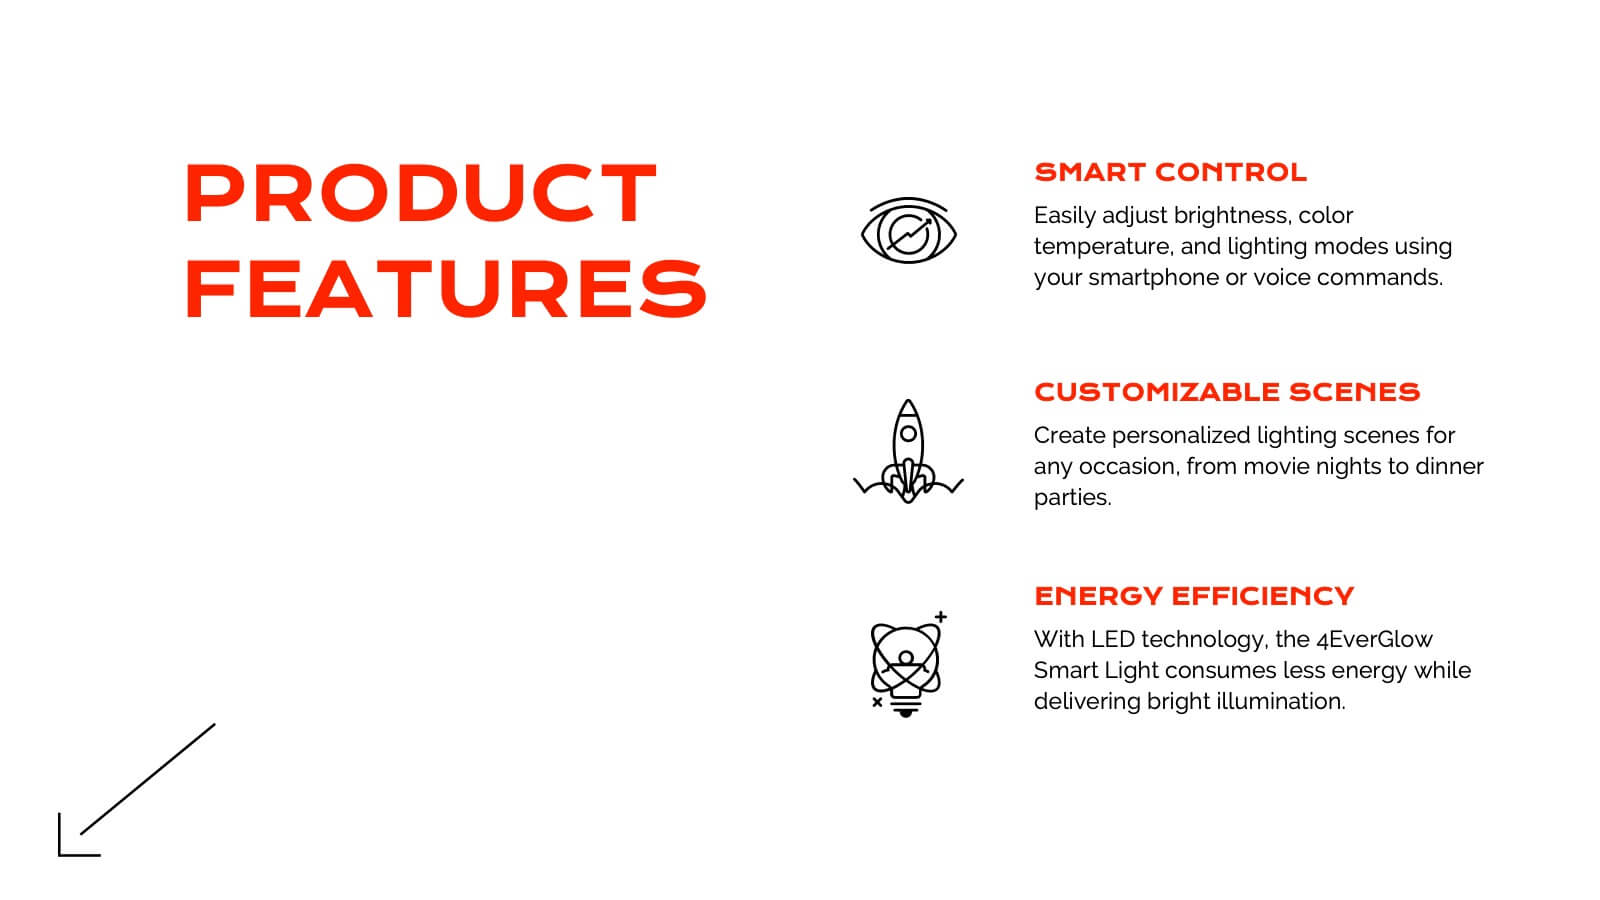
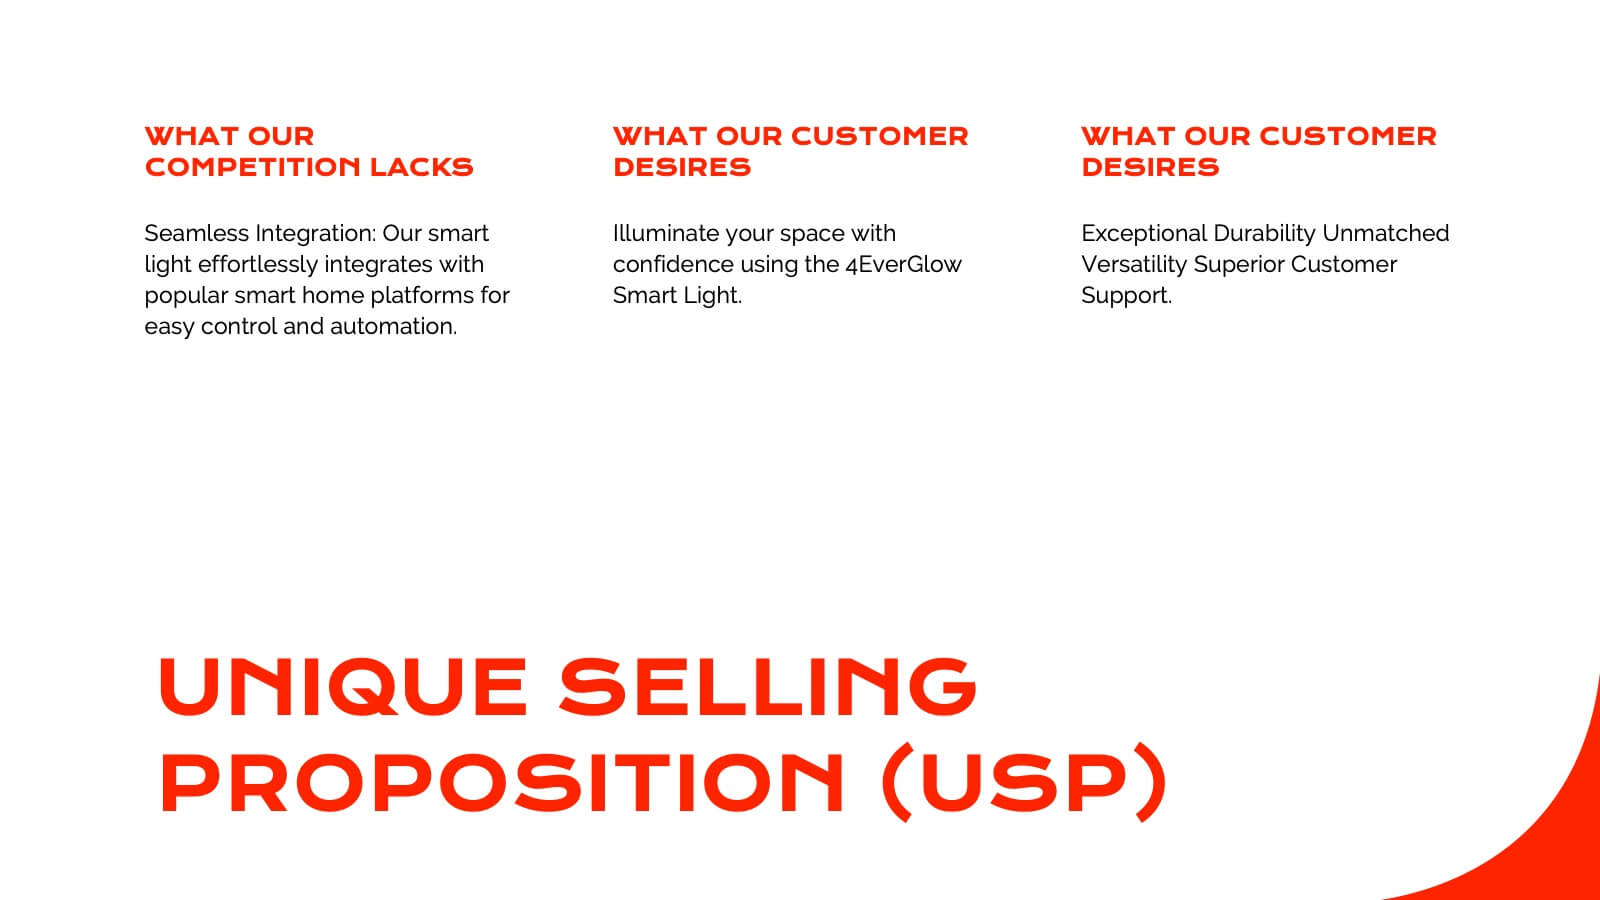
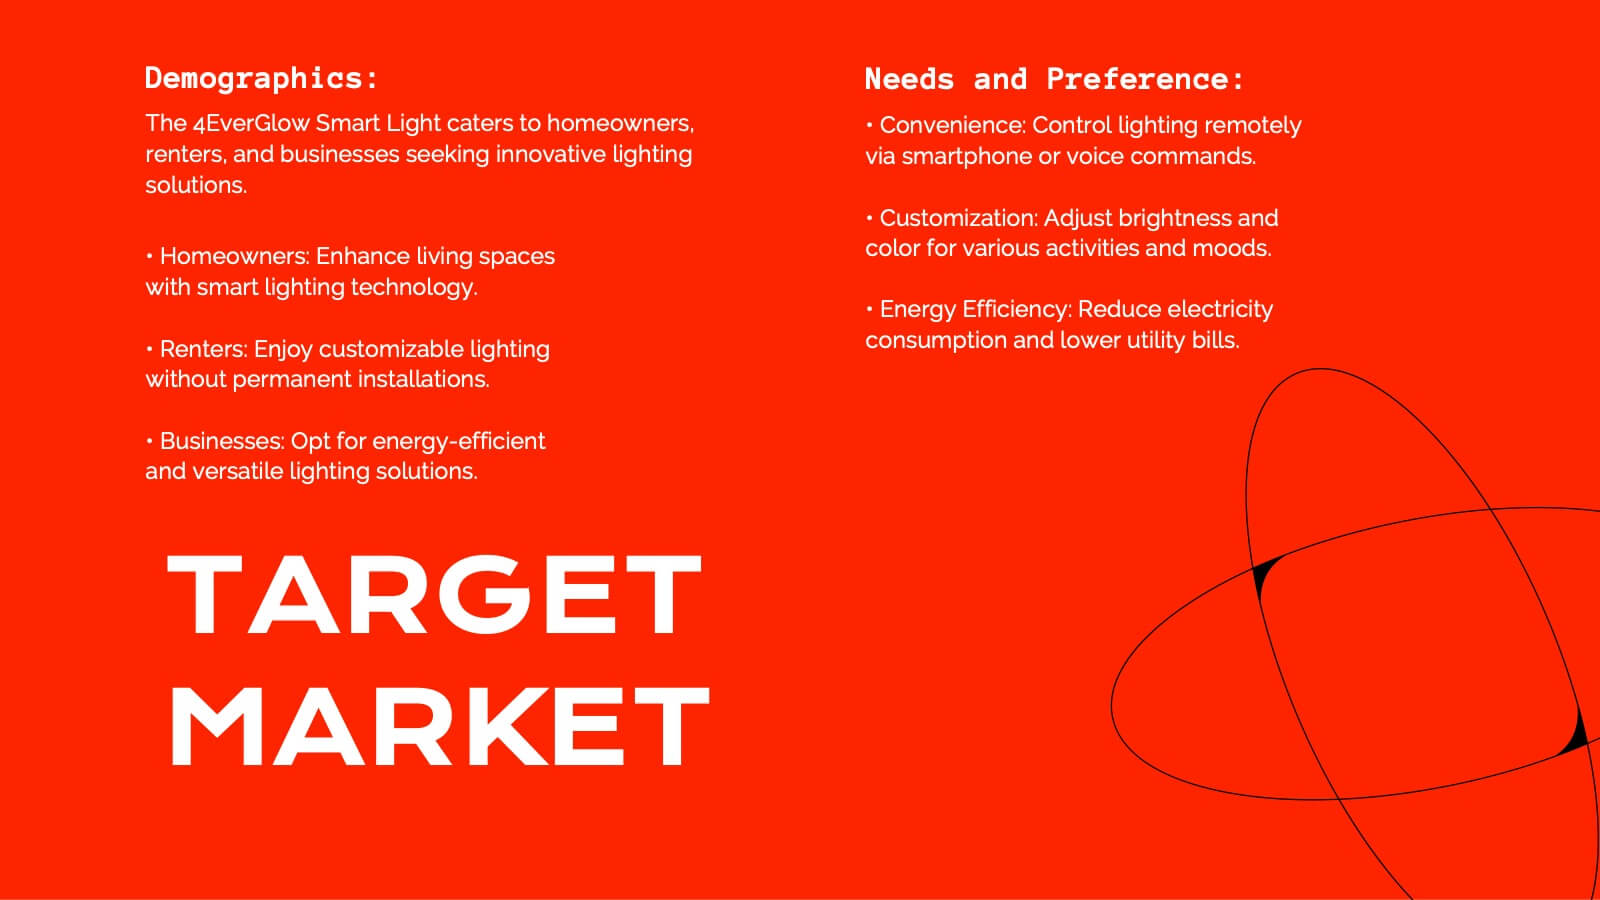
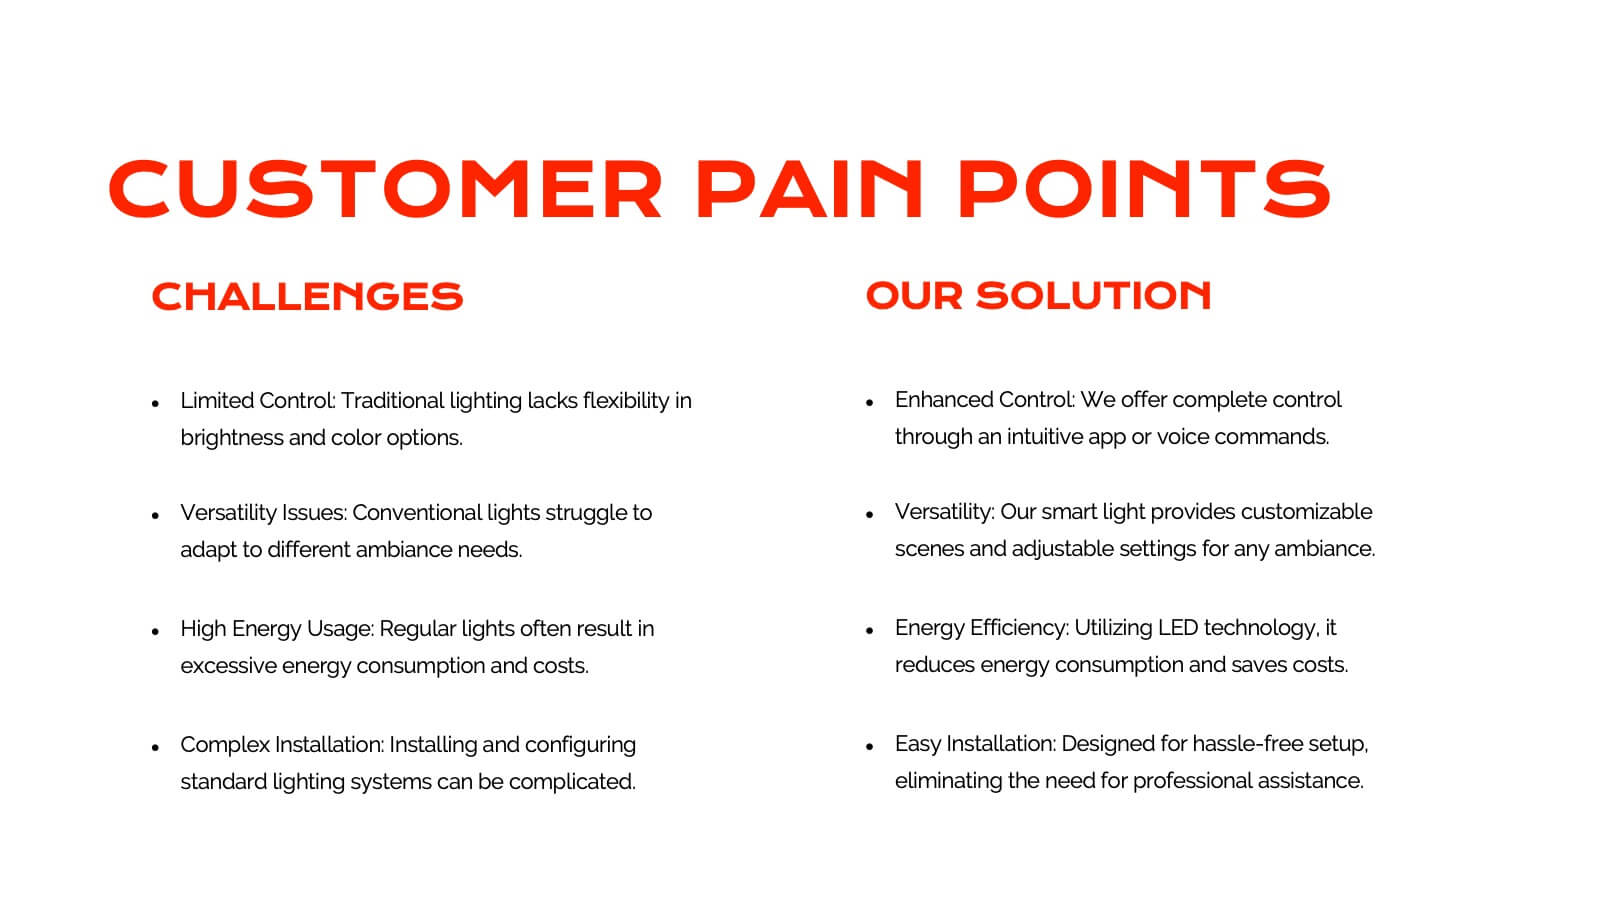
Juventas Product Roadmap Presentation
Get ready to dazzle your audience with a visually striking presentation that takes them through the entire product journey! This template covers essential areas such as product features, target market analysis, and competitive positioning. With its sleek, modern design, it's perfect for capturing attention and delivering clear information. Compatible with PowerPoint, Keynote, and Google Slides for effortless use across platforms.


8 slides
Data Analytics Dashboard Slide Presentation
Turn raw data into visual insights with this clean and modern layout designed to simplify analytics reporting. Perfect for tracking performance metrics, KPIs, and progress updates, it helps make numbers easy to understand at a glance. Fully customizable and compatible with PowerPoint, Keynote, and Google Slides for effortless editing.