


Features
- 6 Unique slides
- Fully editable and easy to edit in Microsoft Powerpoint, Keynote and Google Slides
- 16:9 widescreen layout
- Clean and professional designs
- Export to JPG, PDF or send by email


Do you have any questions?
Recommend


7 slides
Artificial Intelligence Uses Infographic
Artificial Intelligence (AI) is no longer just a concept of sci-fi narratives but an integral part of our daily lives. Our compelling infographic, set against a clean white backdrop with contrasting hues of blue, provides a captivating look into the myriad uses of AI. From healthcare innovations to smart home solutions, our visually engaging template breaks down complex AI applications into digestible information bites. Ideal for educators, tech enthusiasts, and businesses, it's a versatile tool designed for multiple presentation platforms, including PowerPoint, Keynote, and Google Slides.


4 slides
Learning Plan Presentation
Kick off your lesson planning with a bright, organized layout that makes learning goals feel simple, structured, and easy to follow. This presentation helps outline steps, milestones, and study priorities in a clear visual format that keeps students or teams on track. Fully compatible with PowerPoint, Keynote, and Google Slides.


6 slides
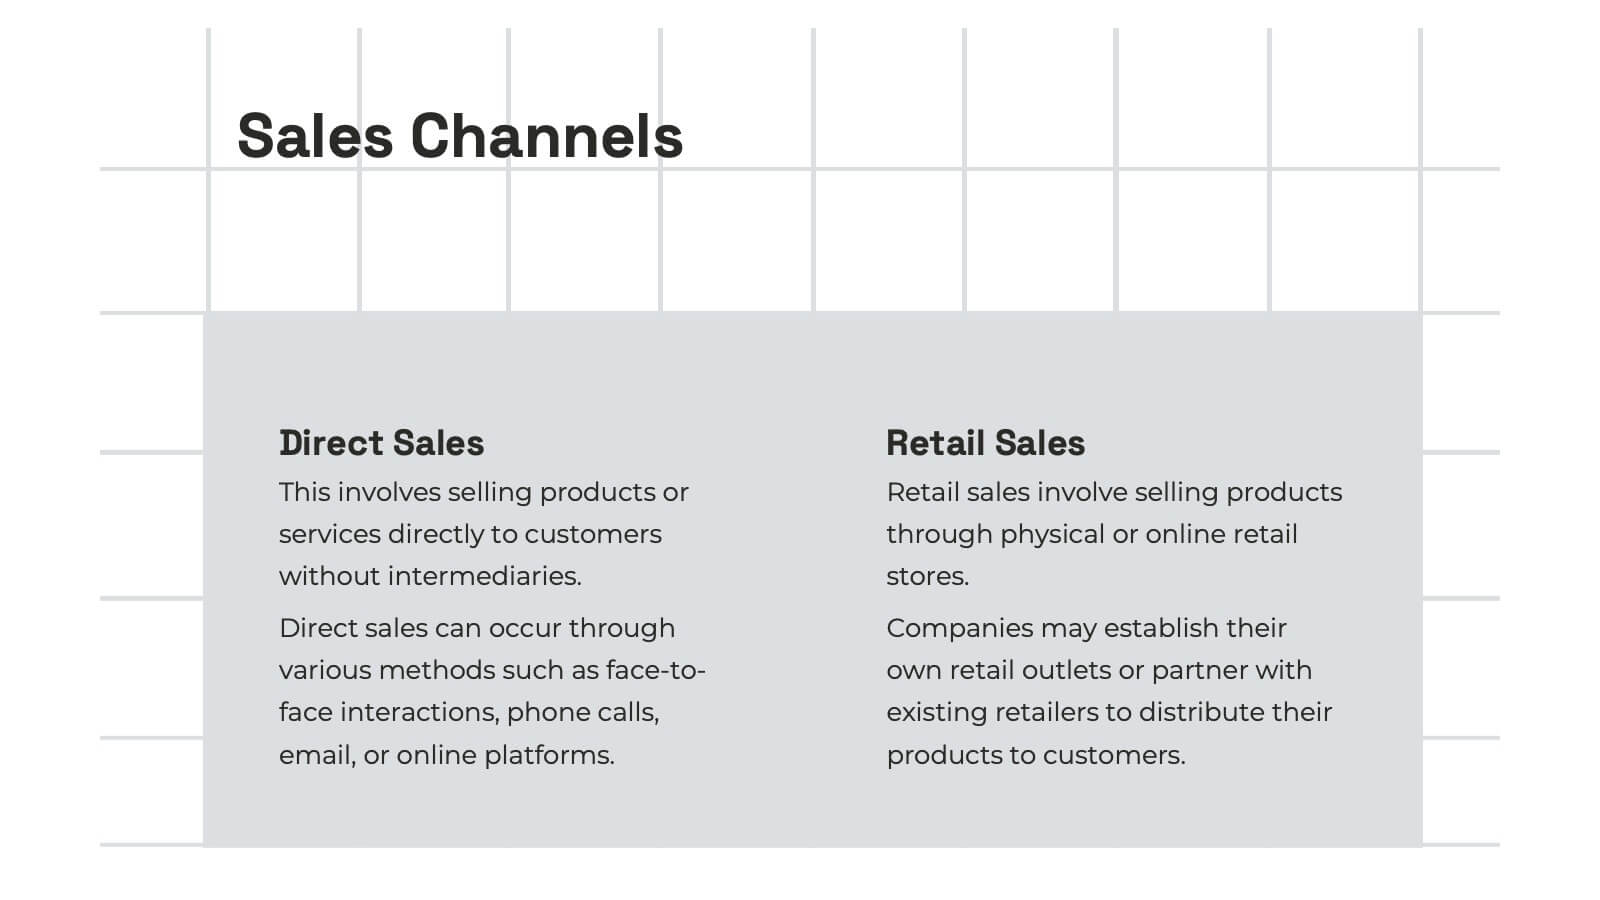
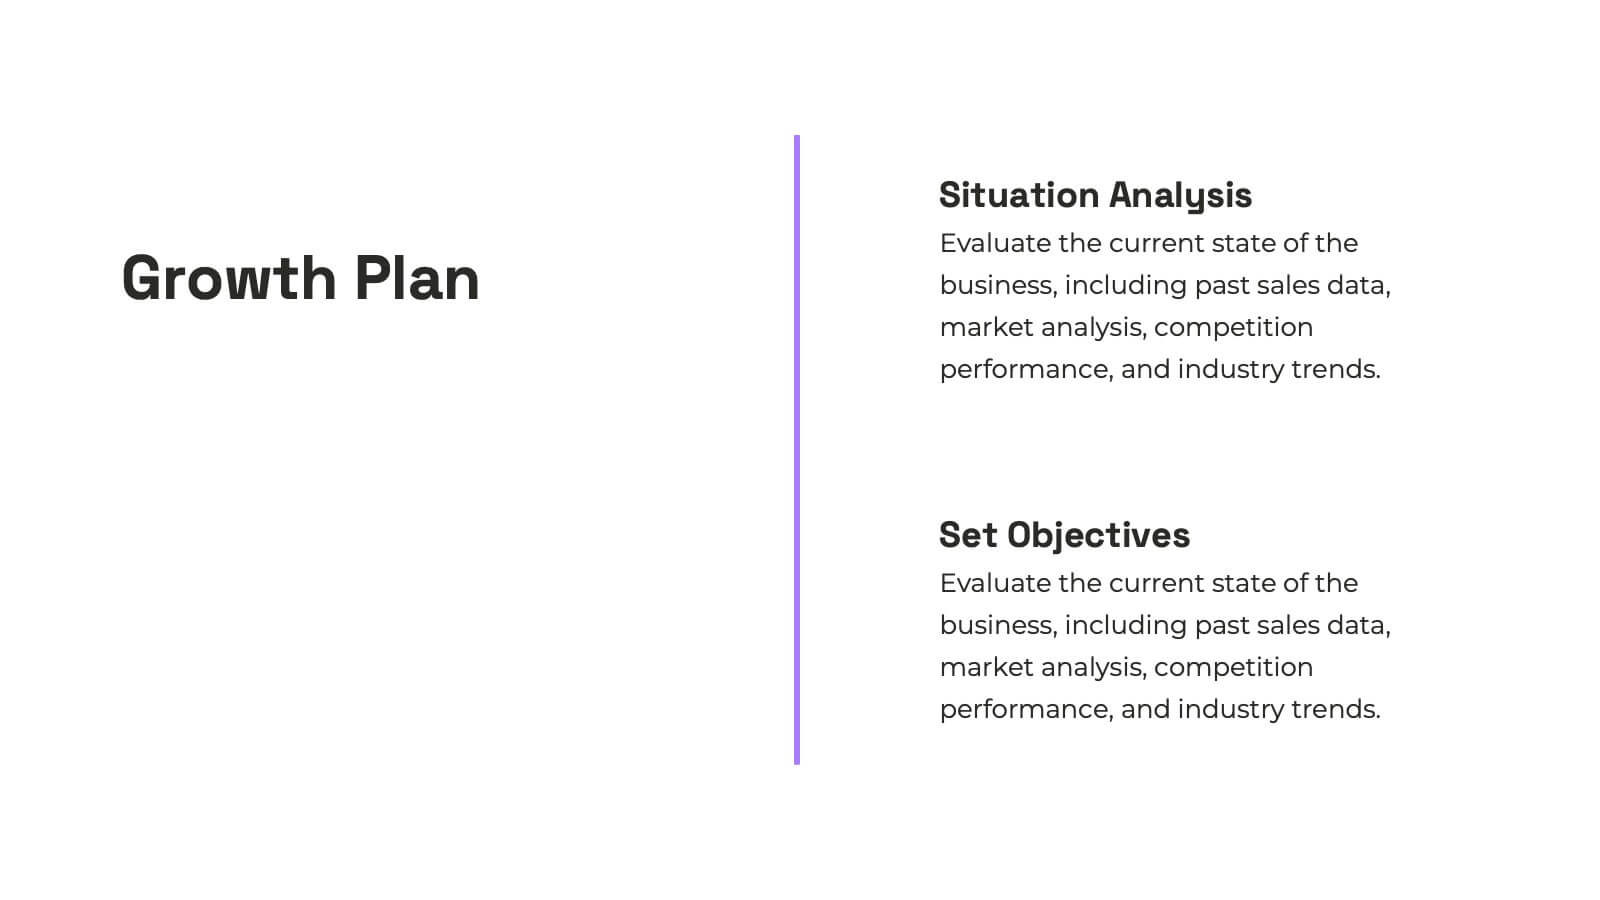
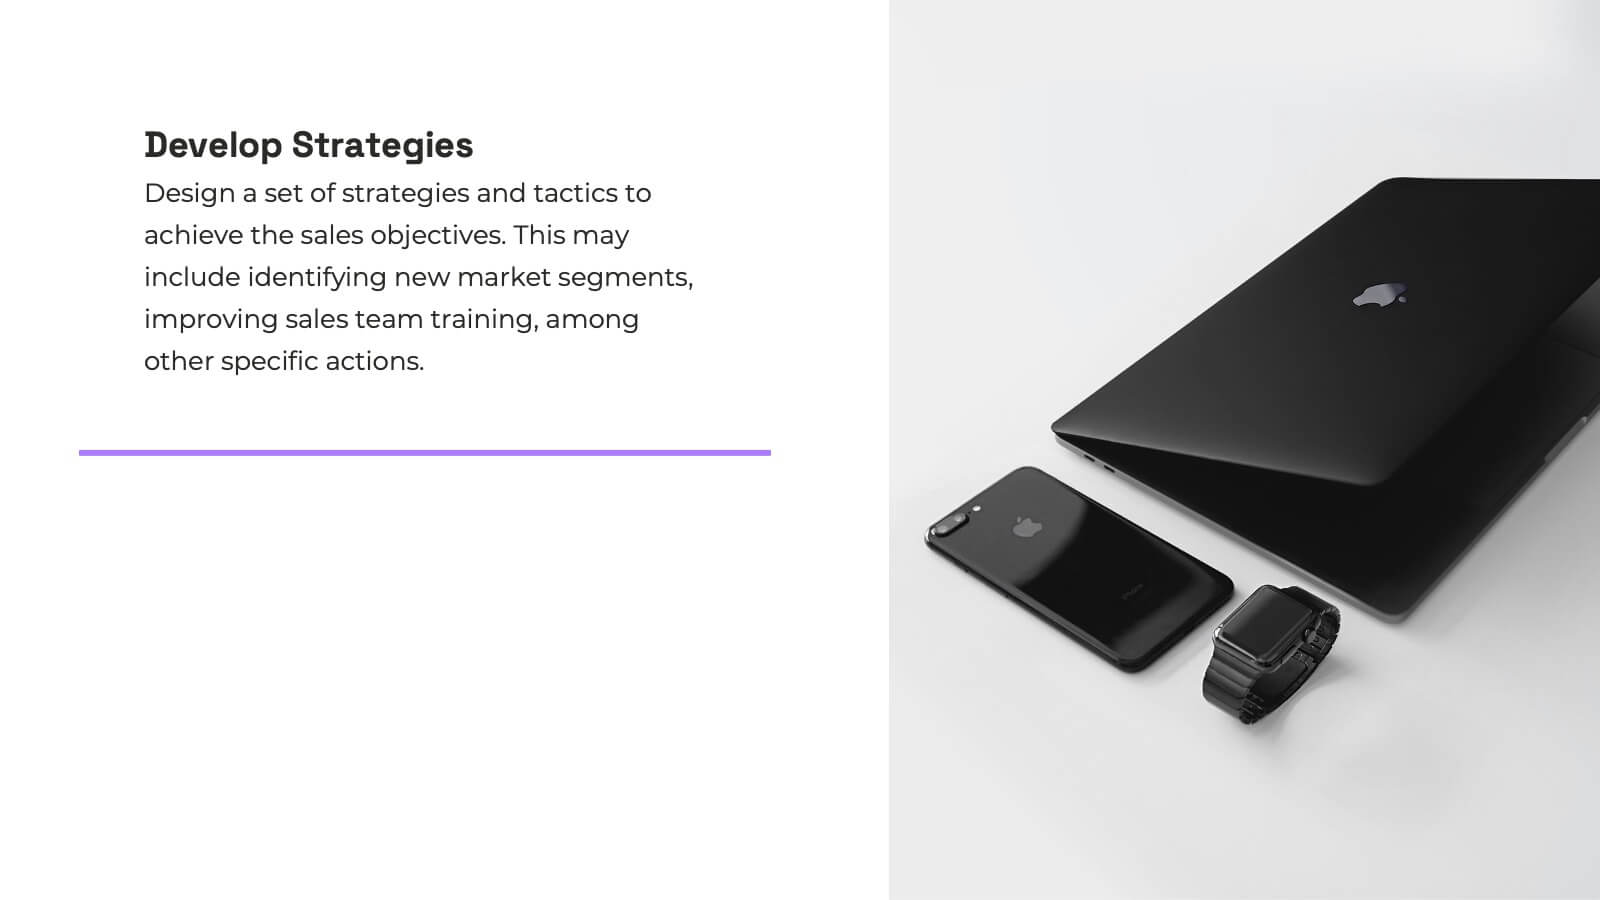
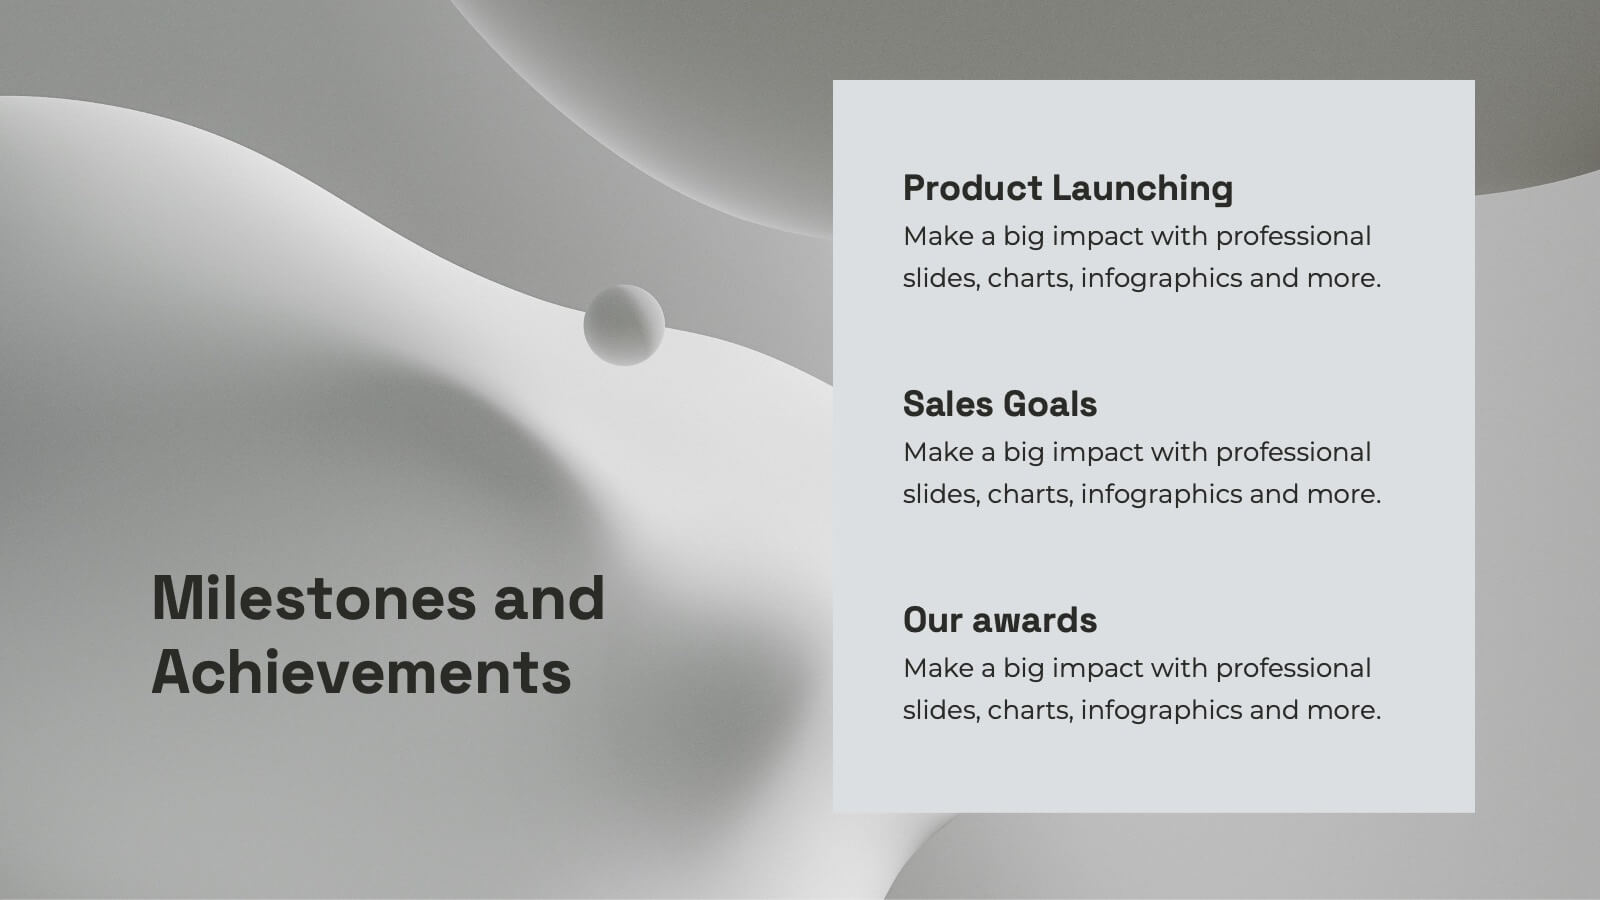
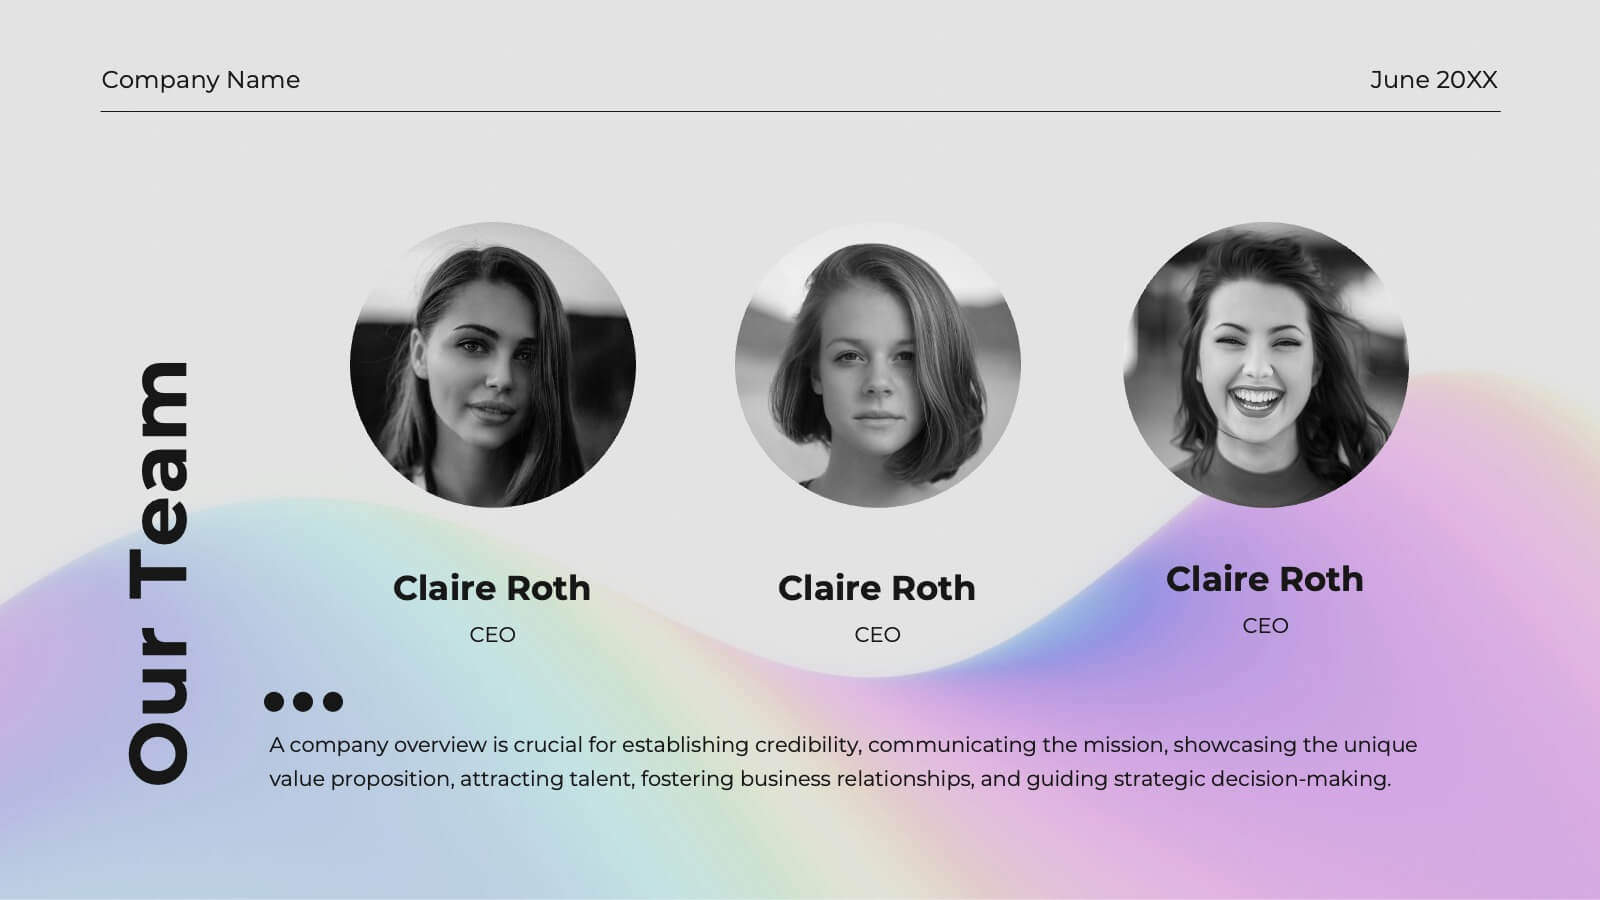
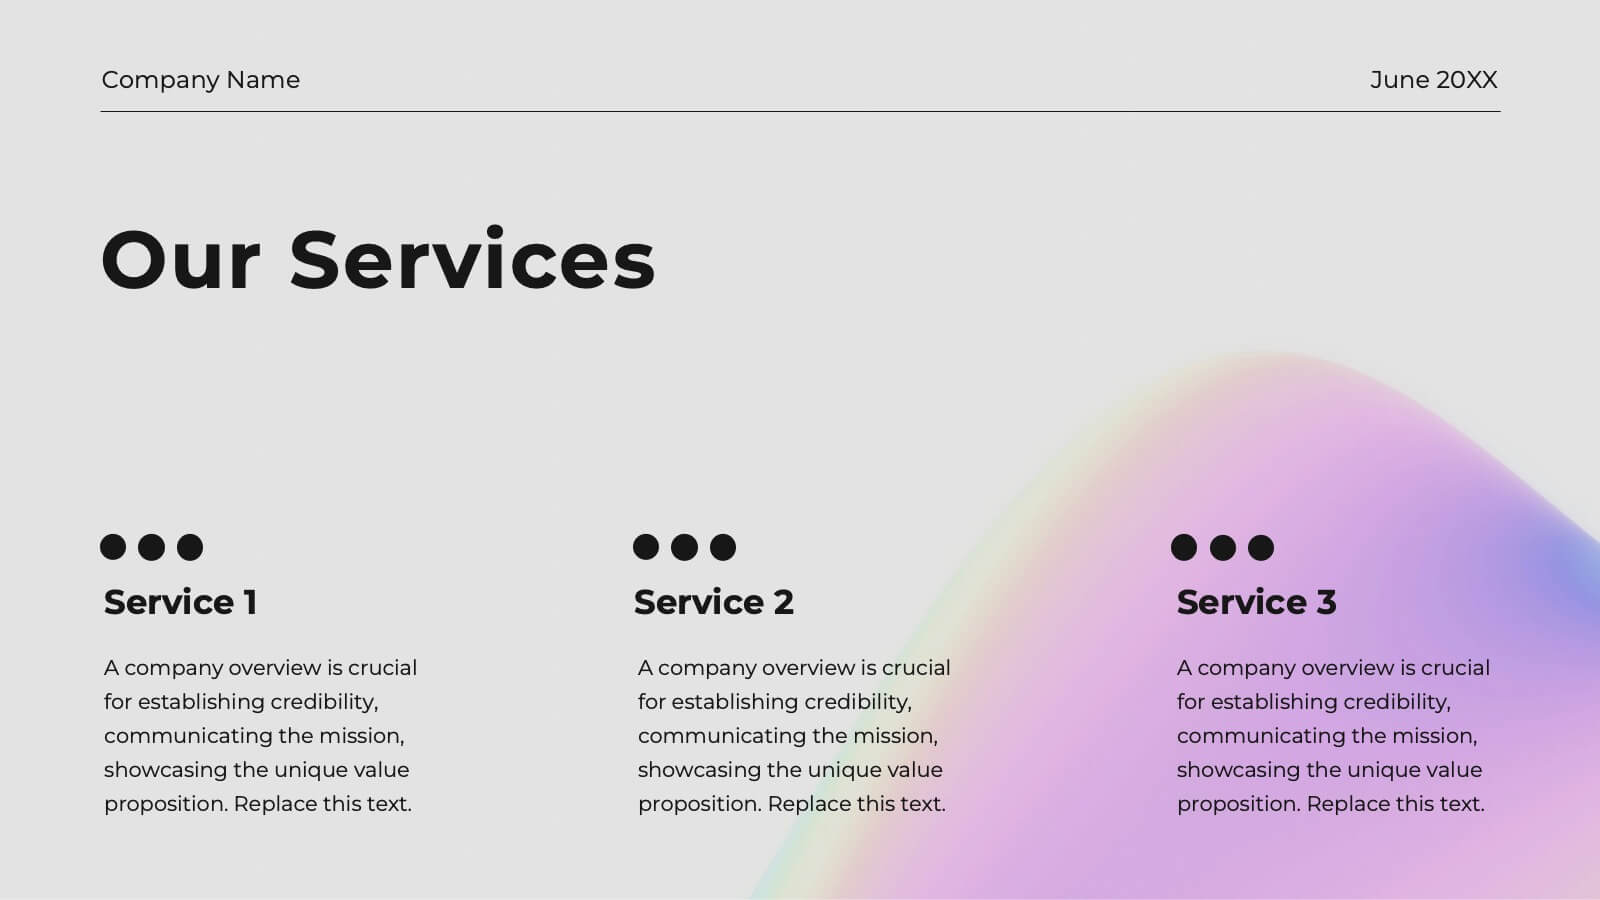
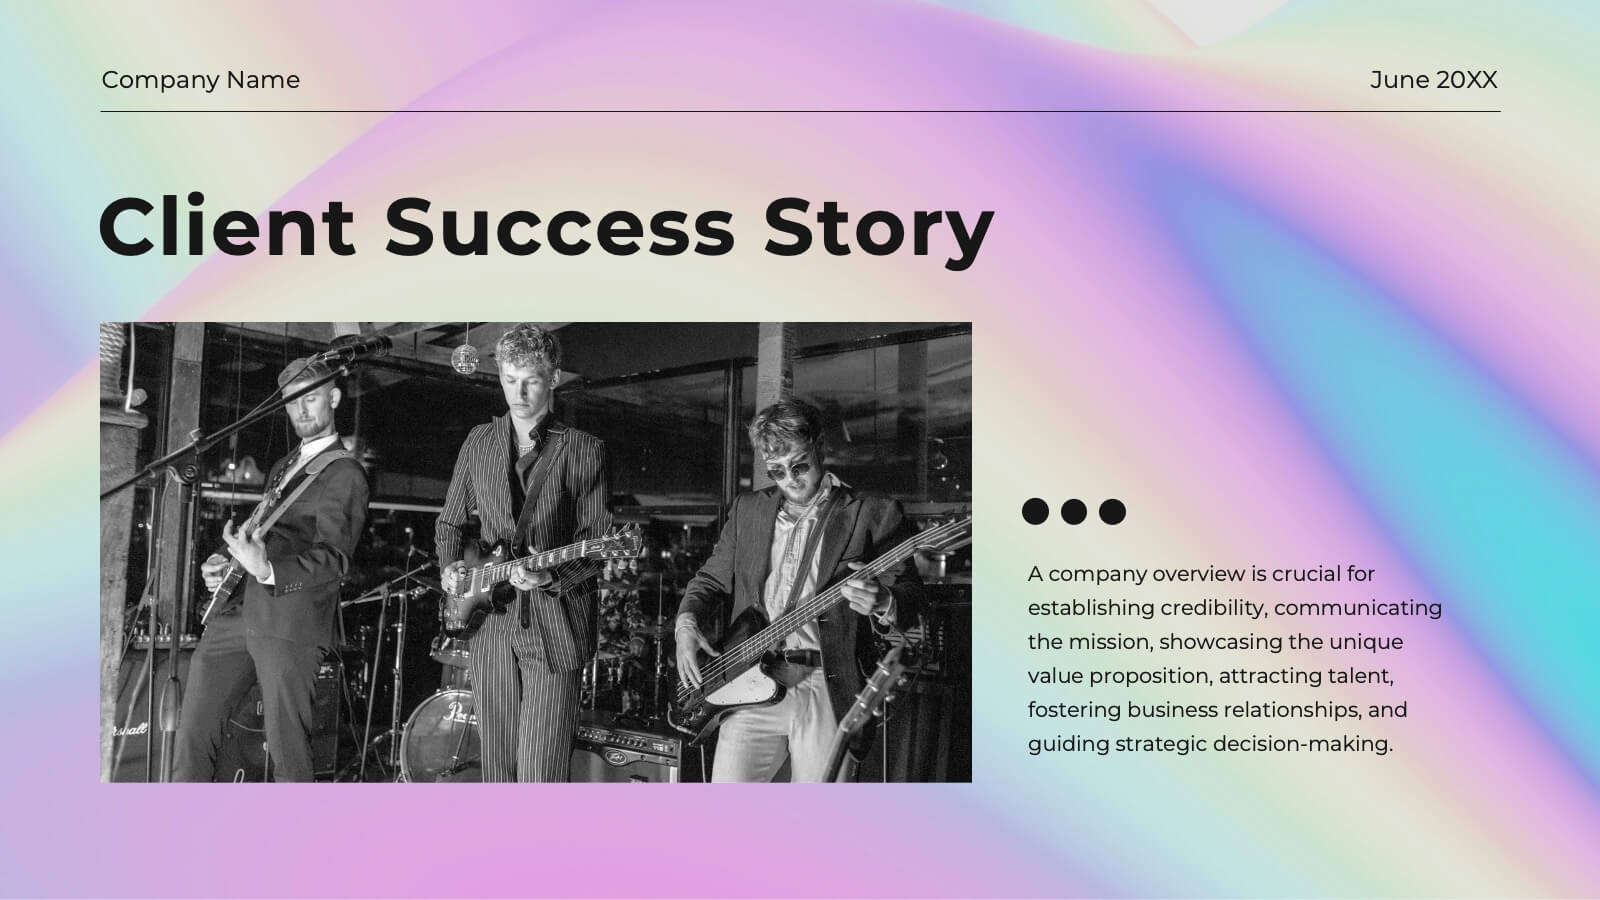
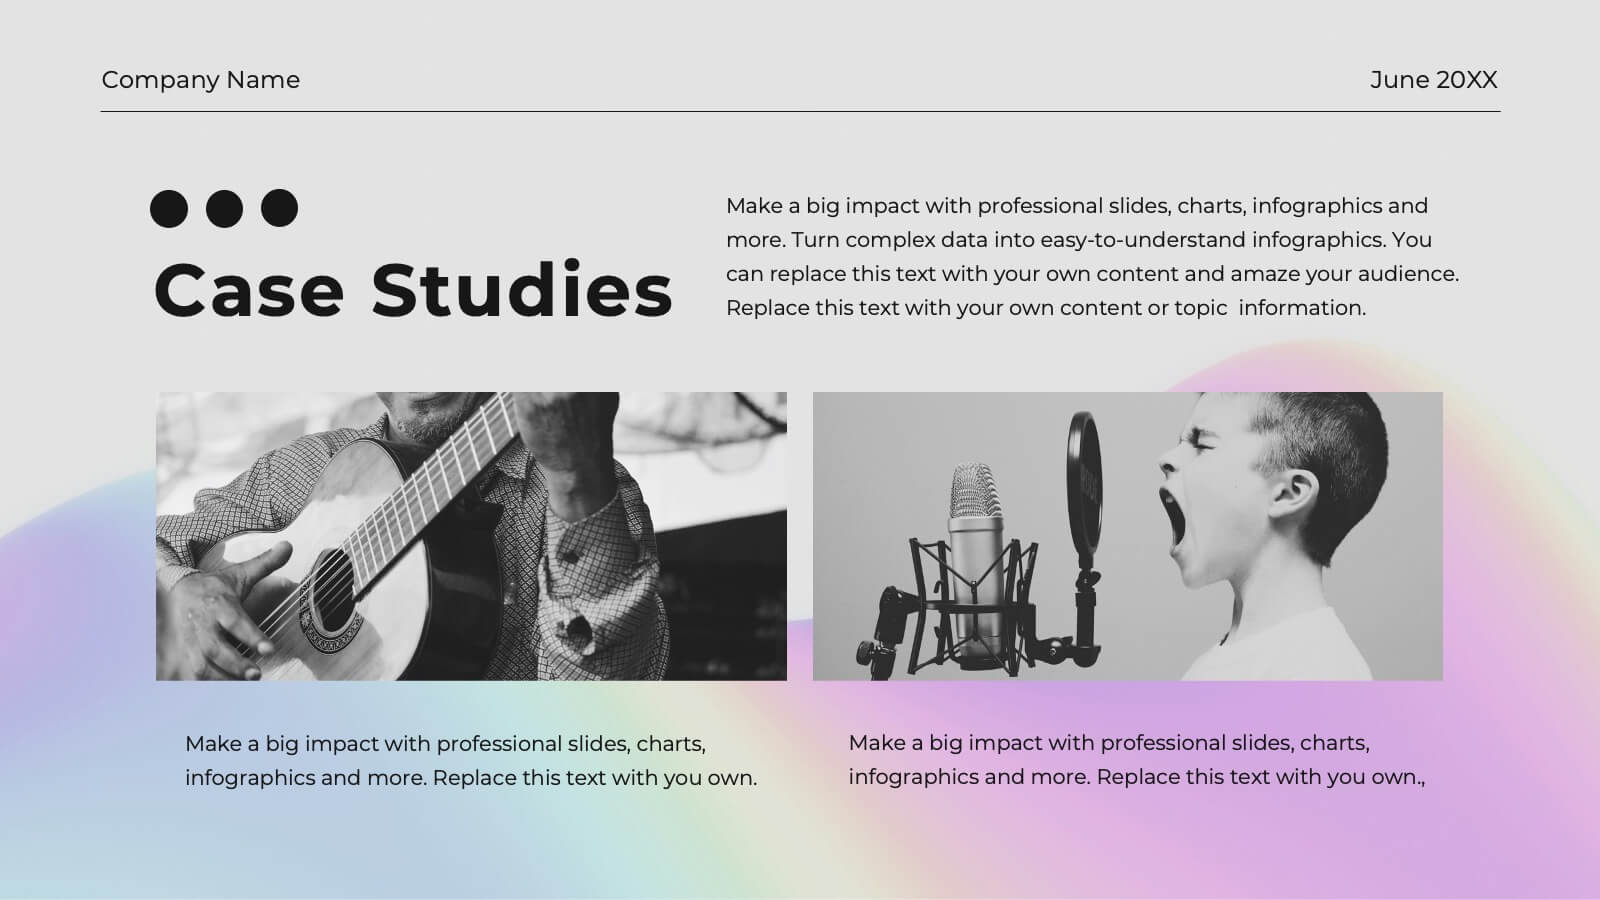
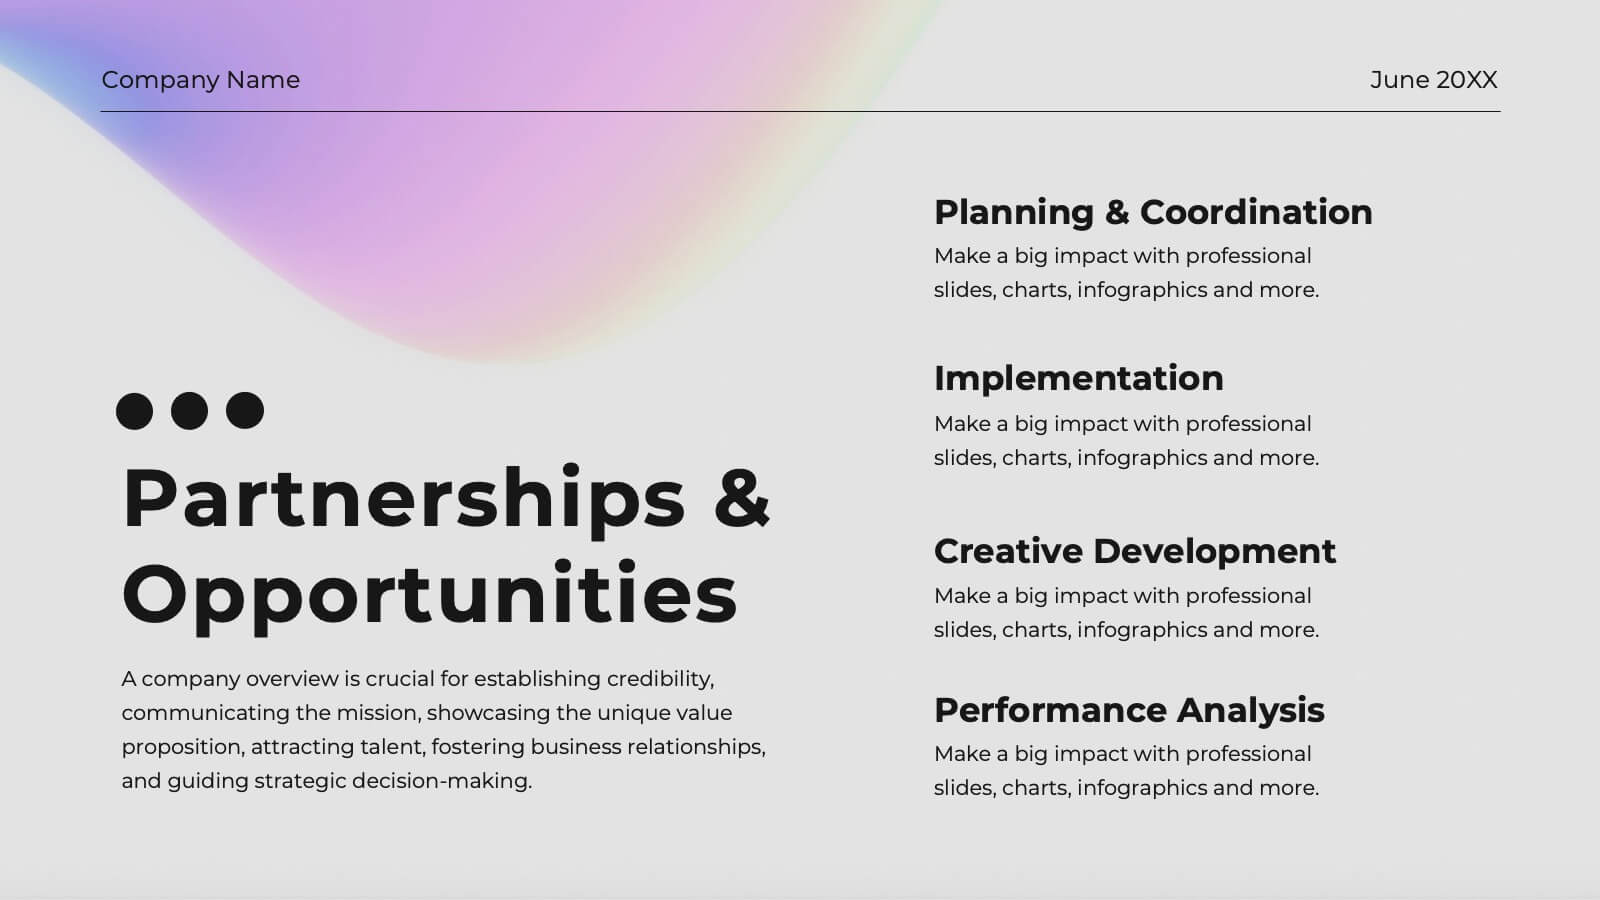
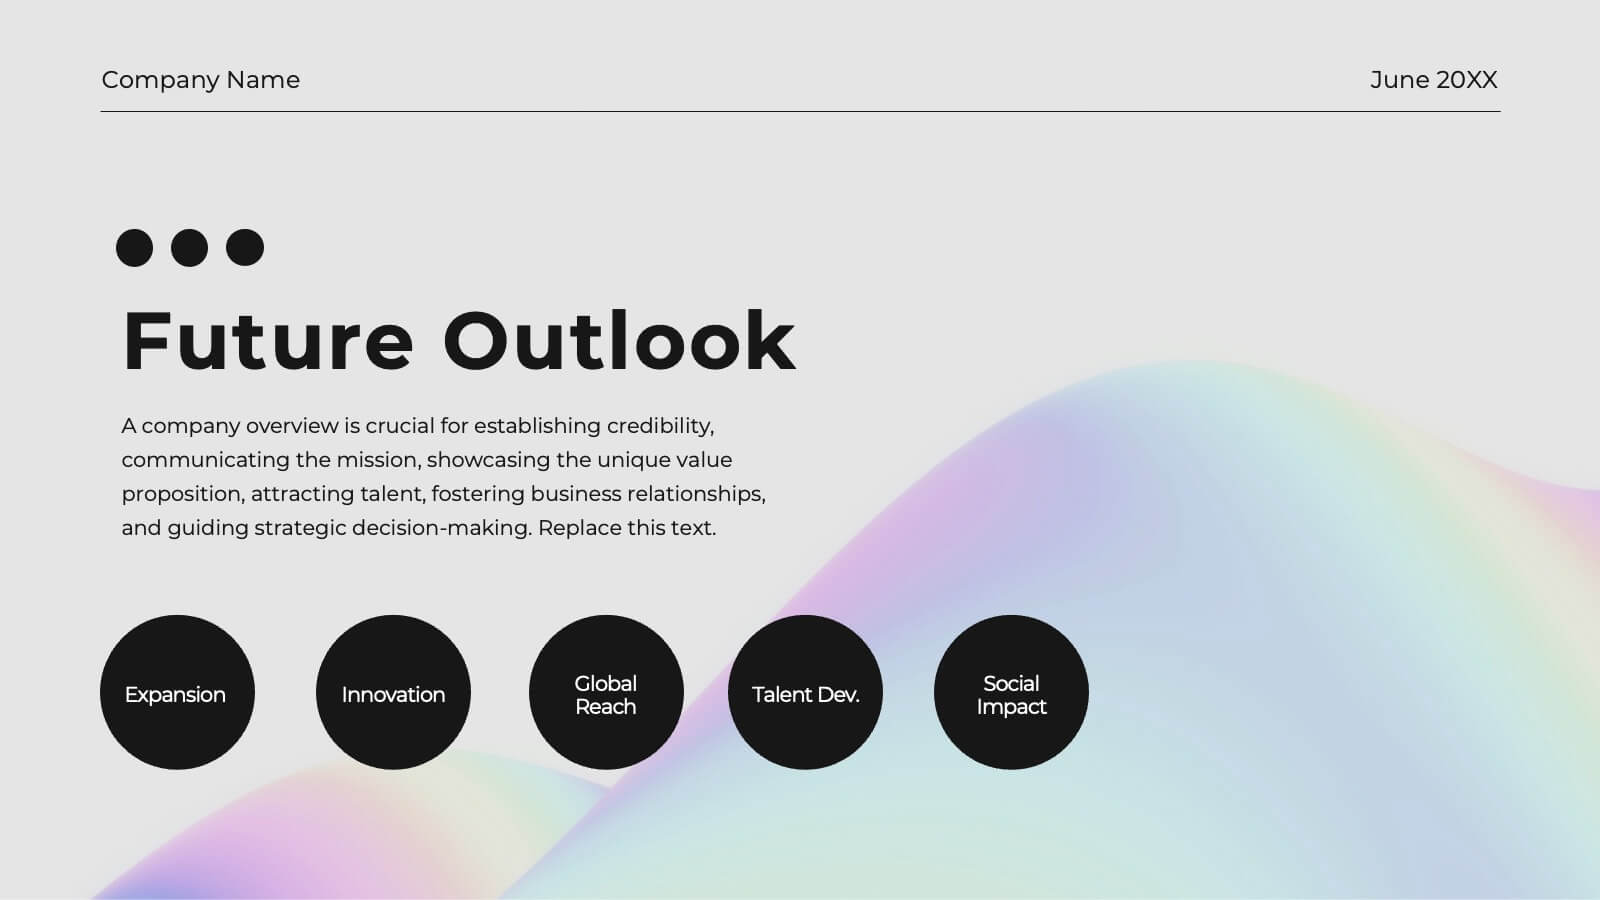
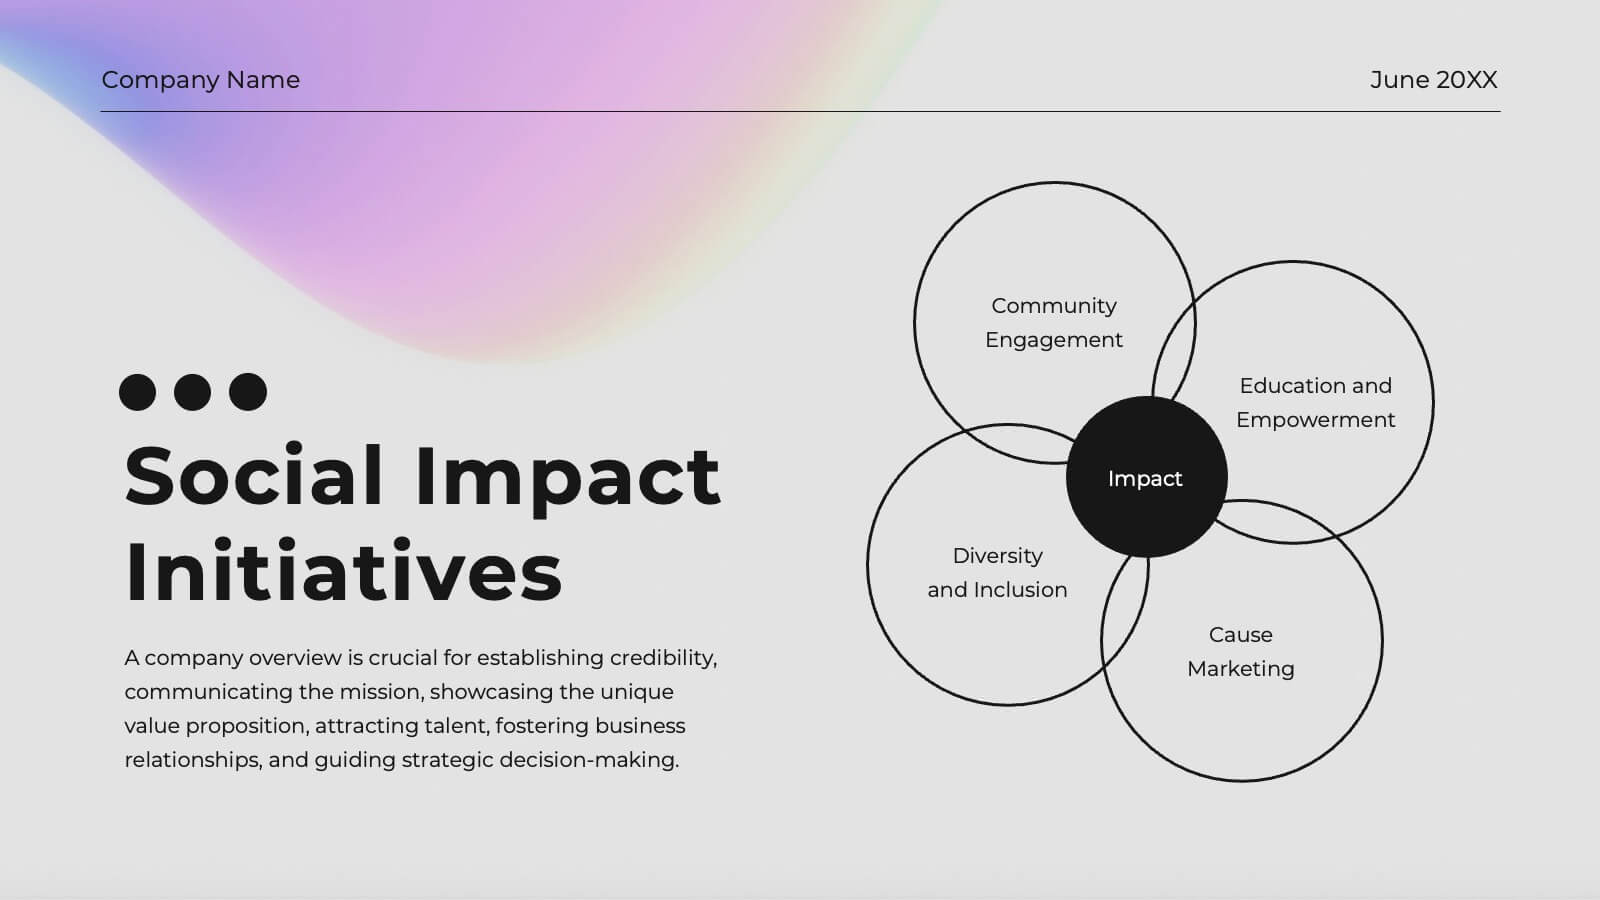
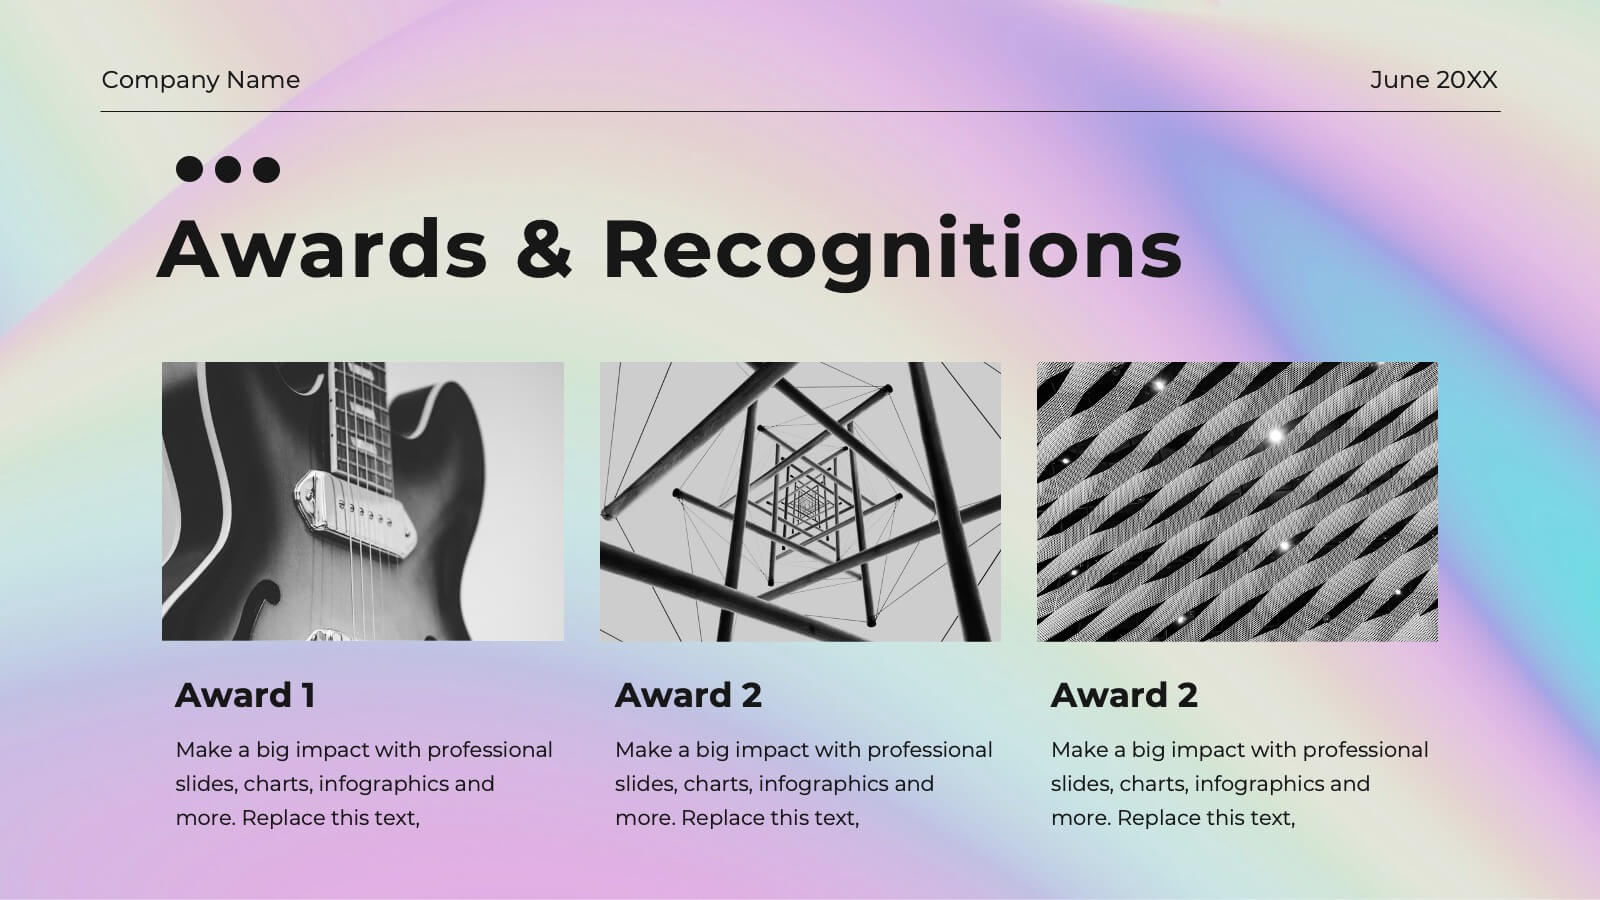
Professional Company Portfolio Presentation
Showcase Your Business Success with a Sleek Portfolio! The Professional Company Portfolio template is designed to highlight key achievements, performance metrics, and strategic insights with a modern, image-driven layout. Featuring three visually appealing sections, this template allows you to present KPIs, revenue growth, and business milestones in a compelling and structured way. Fully customizable in PowerPoint, Keynote, and Google Slides, this portfolio template is perfect for presentations, investor updates, and corporate showcases.


7 slides
Supply Chain Process Mapping Presentation
Streamline your logistics and operations presentations with the Supply Chain Process Mapping Presentation. Featuring a linked-chain visual, this editable template is ideal for outlining each step in your supply flow—from sourcing to delivery. Highlight dependencies, bottlenecks, or key stages with customizable color coding. Fully compatible with PowerPoint, Keynote, and Google Slides.


22 slides
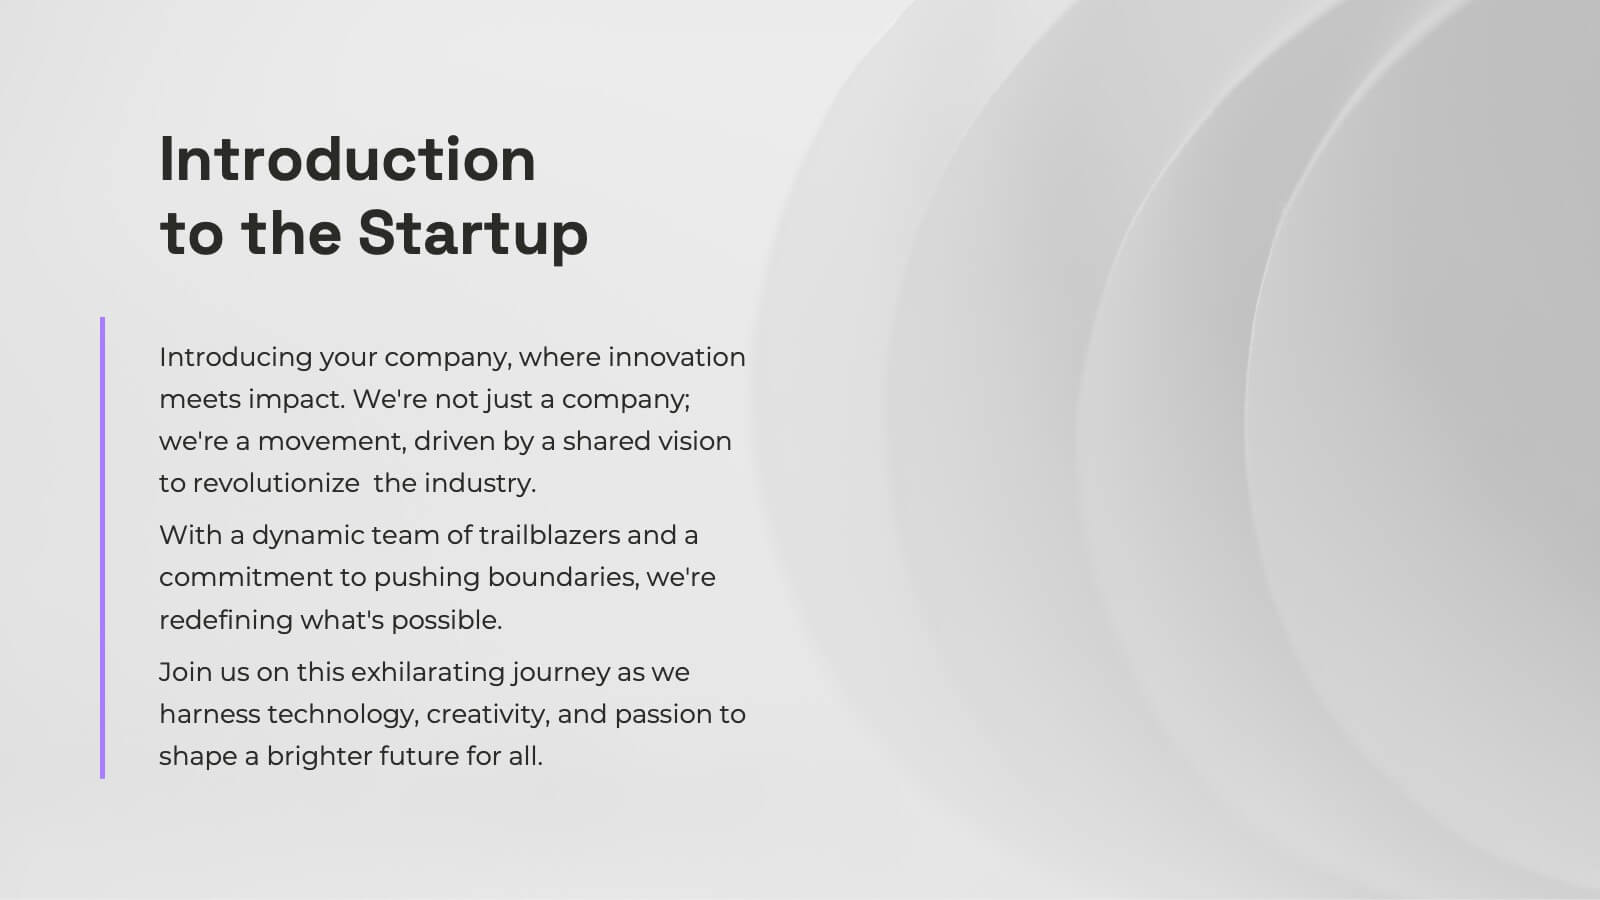
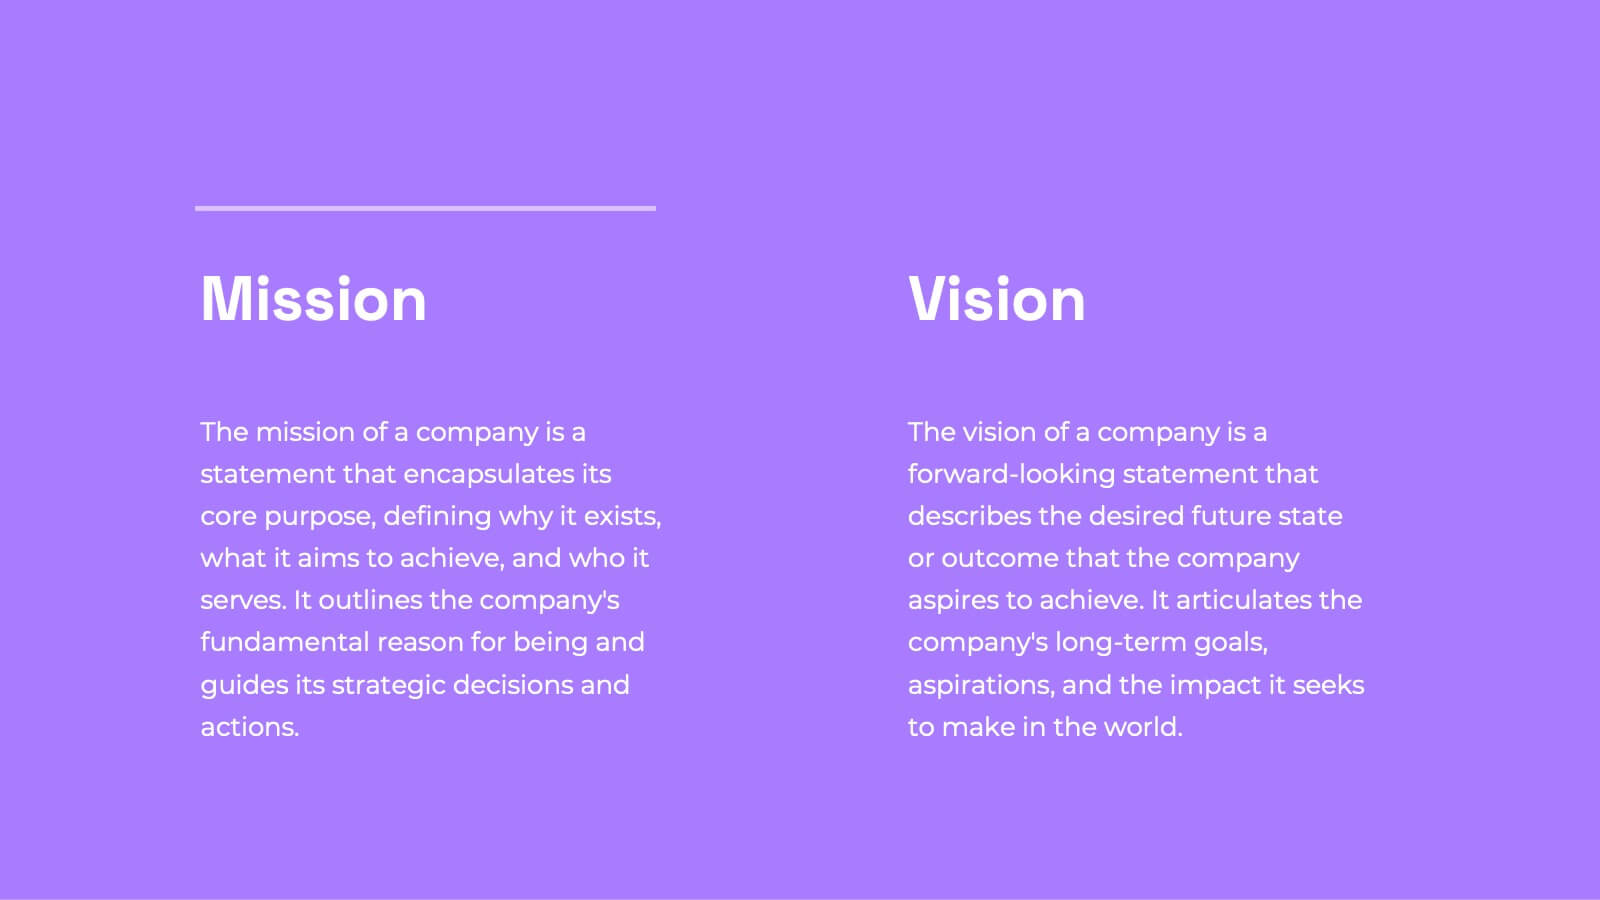
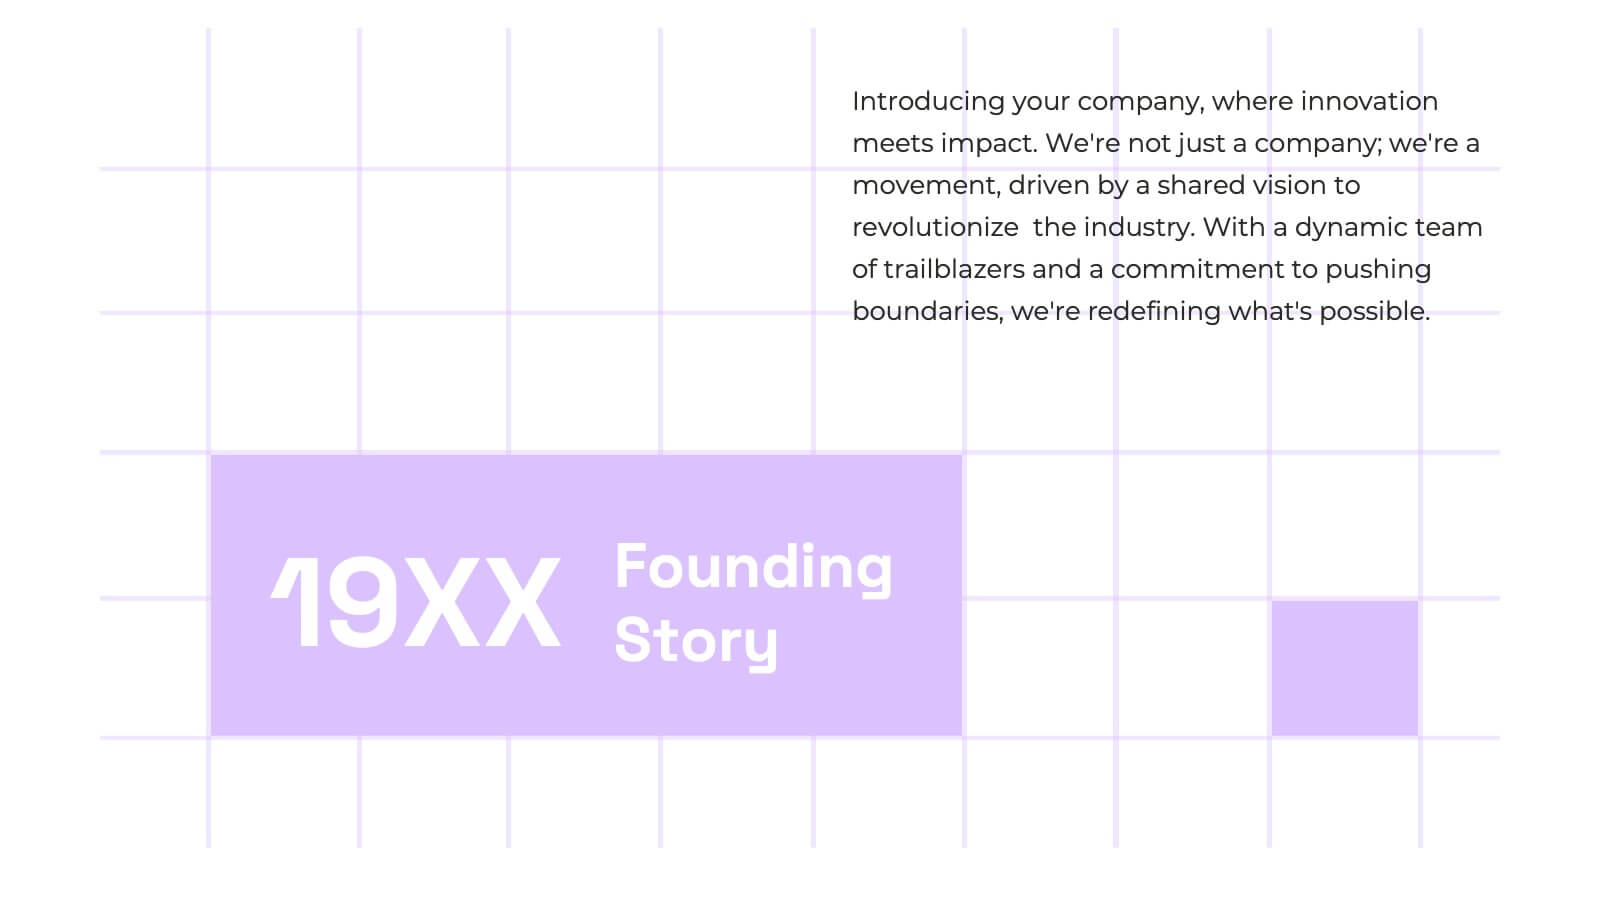
Nexus Startup Growth Plan Presentation
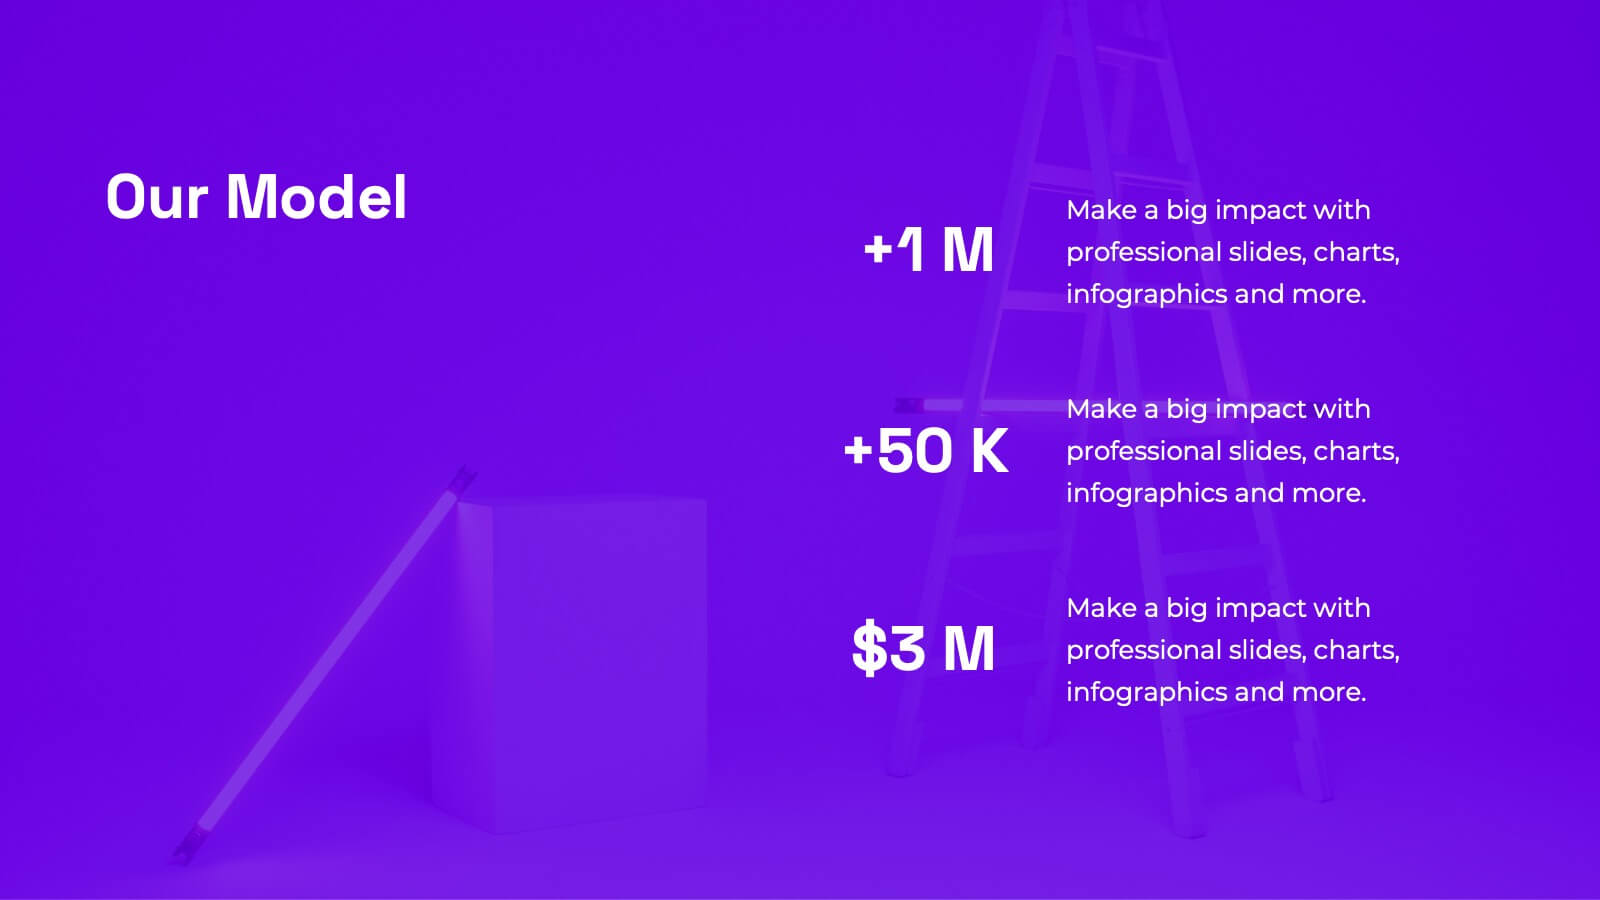
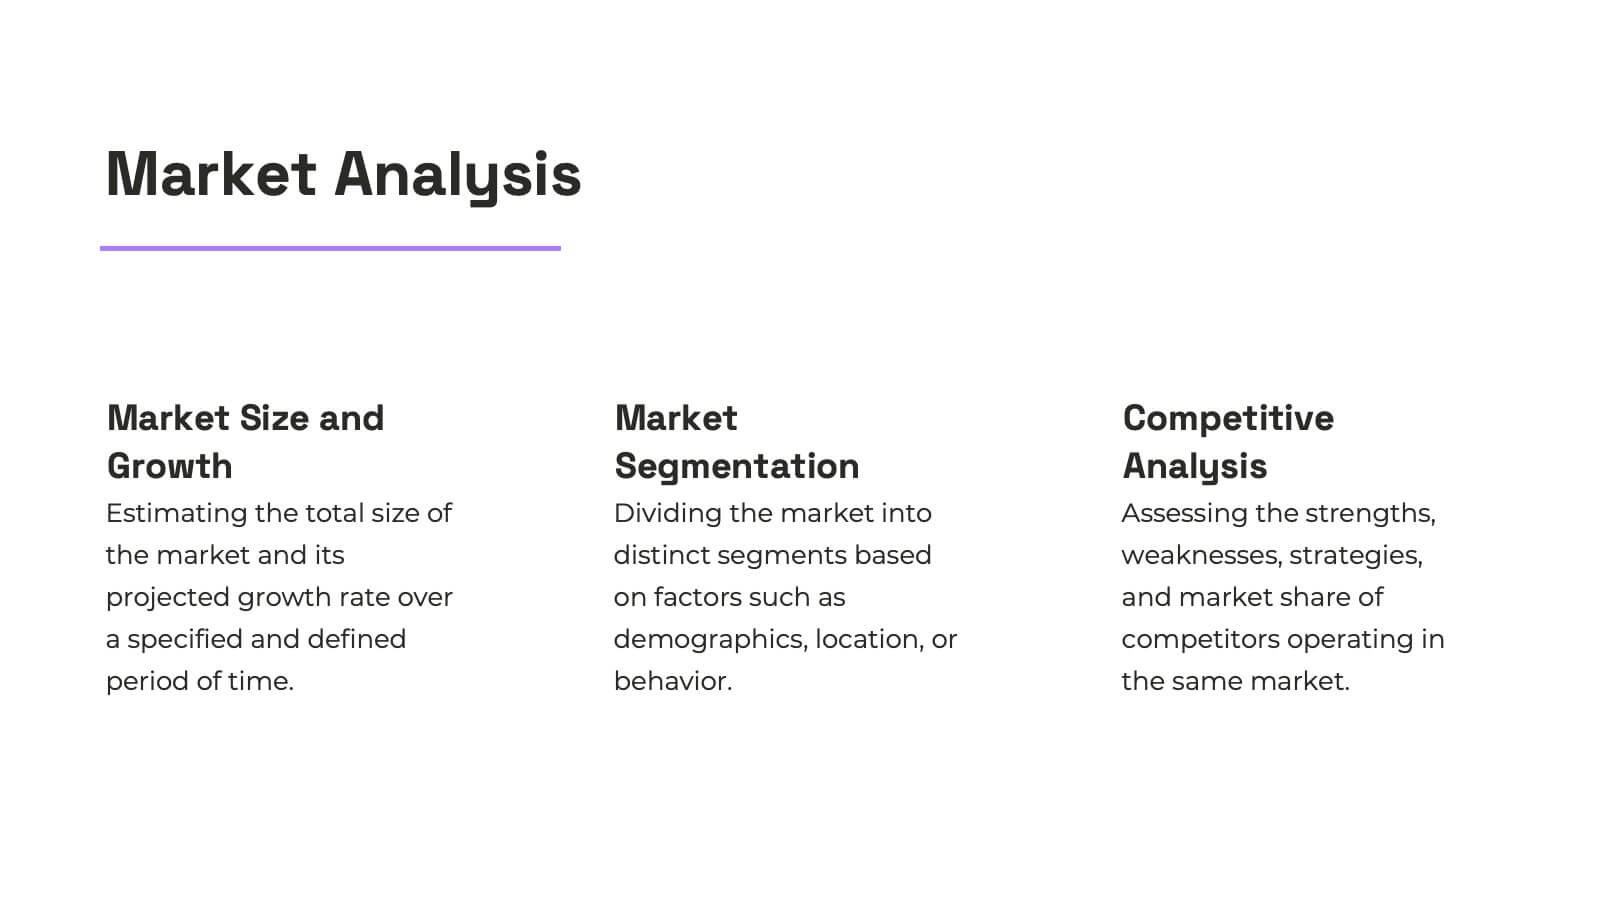
Jumpstart your business journey with this dynamic presentation template! Ideal for outlining your startup growth plan, it covers mission, vision, market analysis, and financial projections with sleek, professional slides. Capture investor interest and articulate your strategy effortlessly. Compatible with PowerPoint, Keynote, and Google Slides, ensuring seamless presentation across all platforms.


5 slides
Identifying Core Issues with Cause Mapping Presentation
Pinpoint the origin of your challenges with the Identifying Core Issues with Cause Mapping Presentation. This diagram is designed to break down problems step-by-step using a clean, logical flow format. Ideal for root cause analysis, risk reviews, and strategic audits, it helps teams visualize contributing factors and map out relationships. Fully editable in PowerPoint, Keynote, and Google Slides.


3 slides
Sustainabilitiy Management Plan Framework Presentation
Turn your sustainability goals into a clear, actionable plan with this dynamic presentation design. Ideal for showcasing environmental strategies, performance metrics, and corporate responsibility initiatives, it combines clarity with visual balance to engage audiences. Fully editable and compatible with PowerPoint, Keynote, and Google Slides for seamless customization and delivery.


7 slides
Business Timeline Infographics
A business timeline is a graphical or chronological representation that illustrates significant events, milestones, or activities within a business or project over a specific period. Embark on a visual voyage through your business's evolution with our business timeline infographic template. Fully customizable and compatible with Powerpoint, Keynote, and Google Slides. This vibrant and informative template is your canvas to fully narrate compellingly. Our timeline infographic is more than a timeline; it's a visual testament to your business's resilience, growth, and future potential!


6 slides
Financial Report Summary Presentation
Showcase key financial highlights with the Financial Report Summary slide. Featuring a central moneybag icon surrounded by currency symbols, this layout is ideal for presenting up to five critical financial insights or revenue sources. Each label is paired with editable titles and descriptions to keep your content clear and relevant. Fully compatible with PowerPoint, Keynote, and Google Slides for effortless customization.


6 slides
Geometric Patterns Infographics
Step into the fascinating realm of geometric patterns! This infographic invites you to explore the captivating world of shapes and symmetries. From the mesmerizing allure of intricate designs to the mathematical precision behind each pattern, we'll reveal the secrets that make geometric patterns a timeless art form. Delve into the core principles of geometric patterns. Gain insights into the geometry behind these intricate designs, from basic shapes like circles and squares to more complex constructions. Uncover the history and cultural significance of these patterns, from ancient civilizations to contemporary art and design. With this captivating infographic, compatible with PowerPoint, Keynote, and Google Slides, sharing your enthusiasm for geometric patterns has never been easier. Empower yourself with the knowledge to appreciate and create these mesmerizing designs. Dive into the world of geometric patterns and embark on a journey of artistic exploration and appreciation.


4 slides
Harvey Ball Chart Business Analysis
Simplify your data-driven storytelling with this Harvey Ball chart slide—perfect for consultants, analysts, and strategy teams. Visualize percentage-based insights across four categories using clean, easy-to-read circular progress visuals. Fully editable in PowerPoint, Keynote, and Google Slides to match your branding and message.


5 slides
Creative Brainstorming Presentation
Enhance your brainstorming sessions with this Creative Brainstorming template. Designed with a modern head outline and idea mapping structure, it visually organizes key insights for innovative discussions. Fully customizable with editable text, colors, and icons to fit your needs. Compatible with PowerPoint, Keynote, and Google Slides for seamless integration.


19 slides
Zenith Sales Proposal Presentation
Get ready to blow your clients away with this electrifying sales proposal template! Packed with sections on project scope, bold objectives, timelines, and jaw-dropping pricing, it’s designed to make a powerful impact. The sleek, cutting-edge design ensures you’ll leave a lasting impression. Fully compatible with PowerPoint, Keynote, and Google Slides!


7 slides
Team Work Strategy Infographic
Harness the collective strength of your team with our team work strategy infographic. Set against a pristine white backdrop, this design is accentuated with vivid strokes of purple, blue, yellow, and orange, symbolizing the diverse skills and unity in a team. Crafted for seamless compatibility with Powerpoint, Keynote, and Google Slides, the template features versatile graphics, detailed icons, and adaptable image placeholders. Envisage the synergy, collaboration, and the strategic prowess of a unified team, all laid out in a visually appealing format.


8 slides
Company Achievements Year in Review Presentation
Highlight milestones with impact using the Company Achievements Year in Review Presentation. This dynamic slide uses a multi-layered, pyramid-style layout to showcase your organization’s key wins, progress, and stats throughout the year. Perfect for internal reviews, investor decks, or annual reports. Fully editable and compatible with PowerPoint, Keynote, and Google Slides.
22 slides
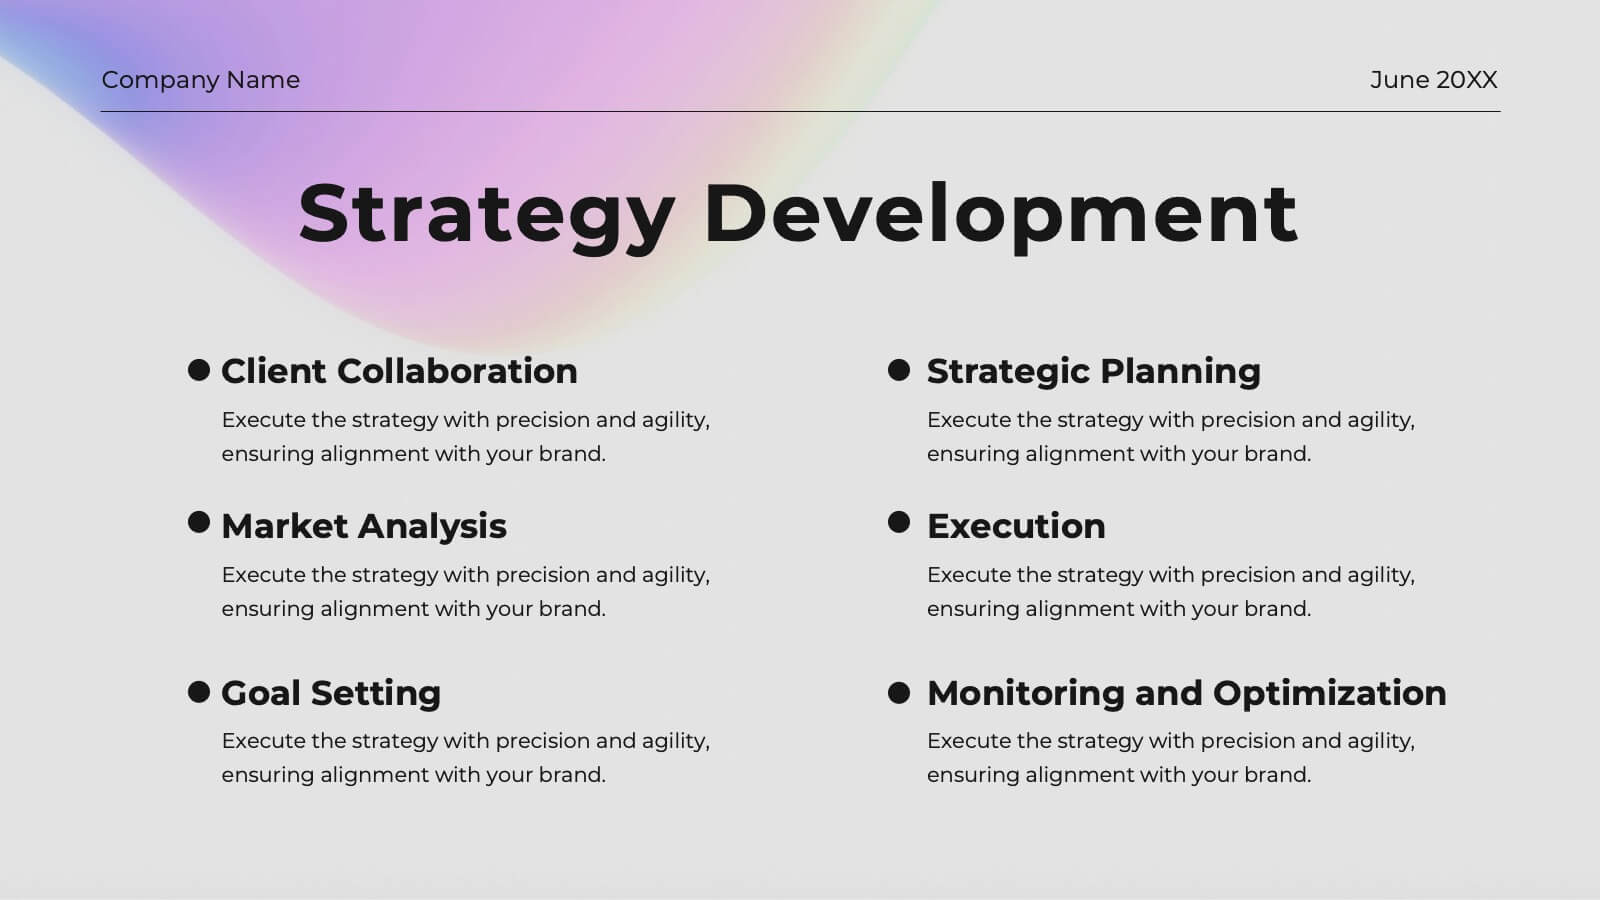
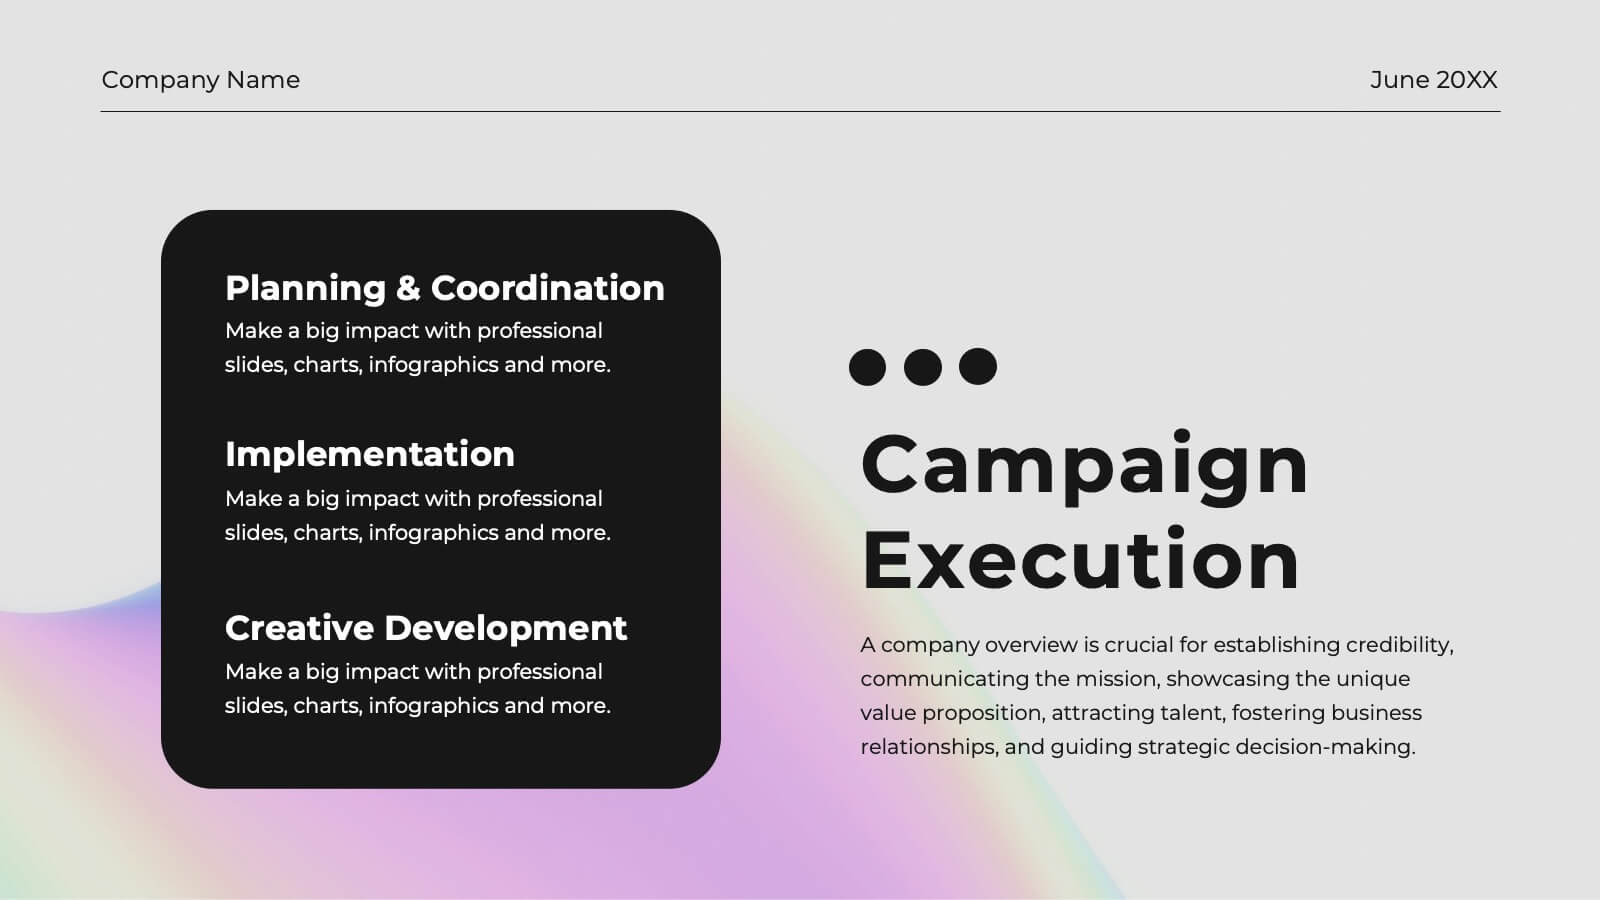
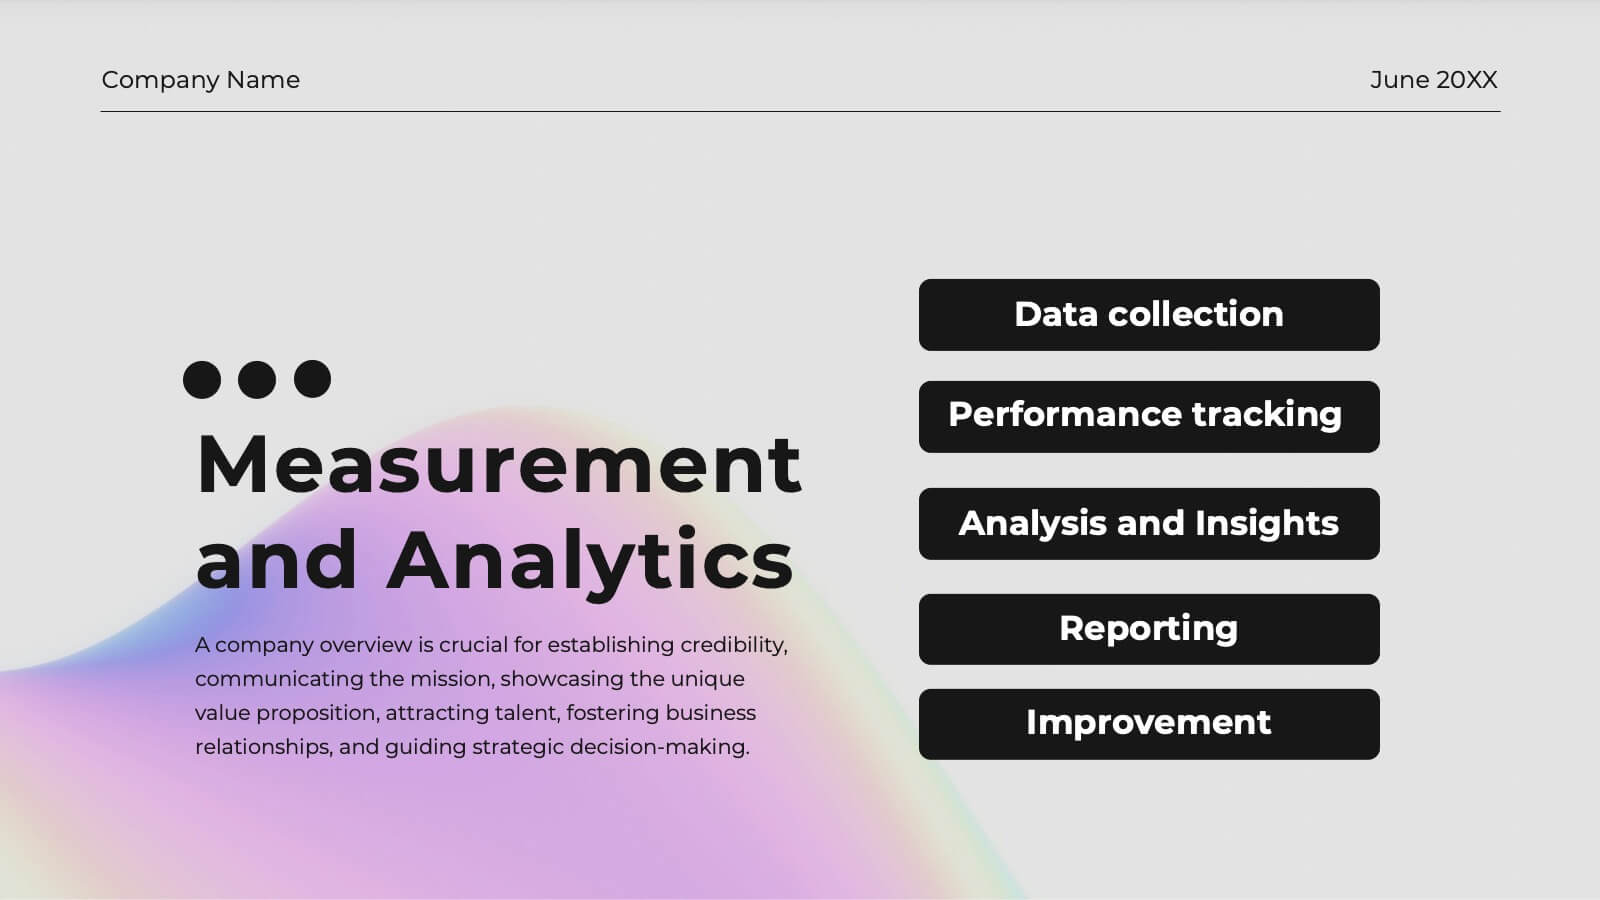
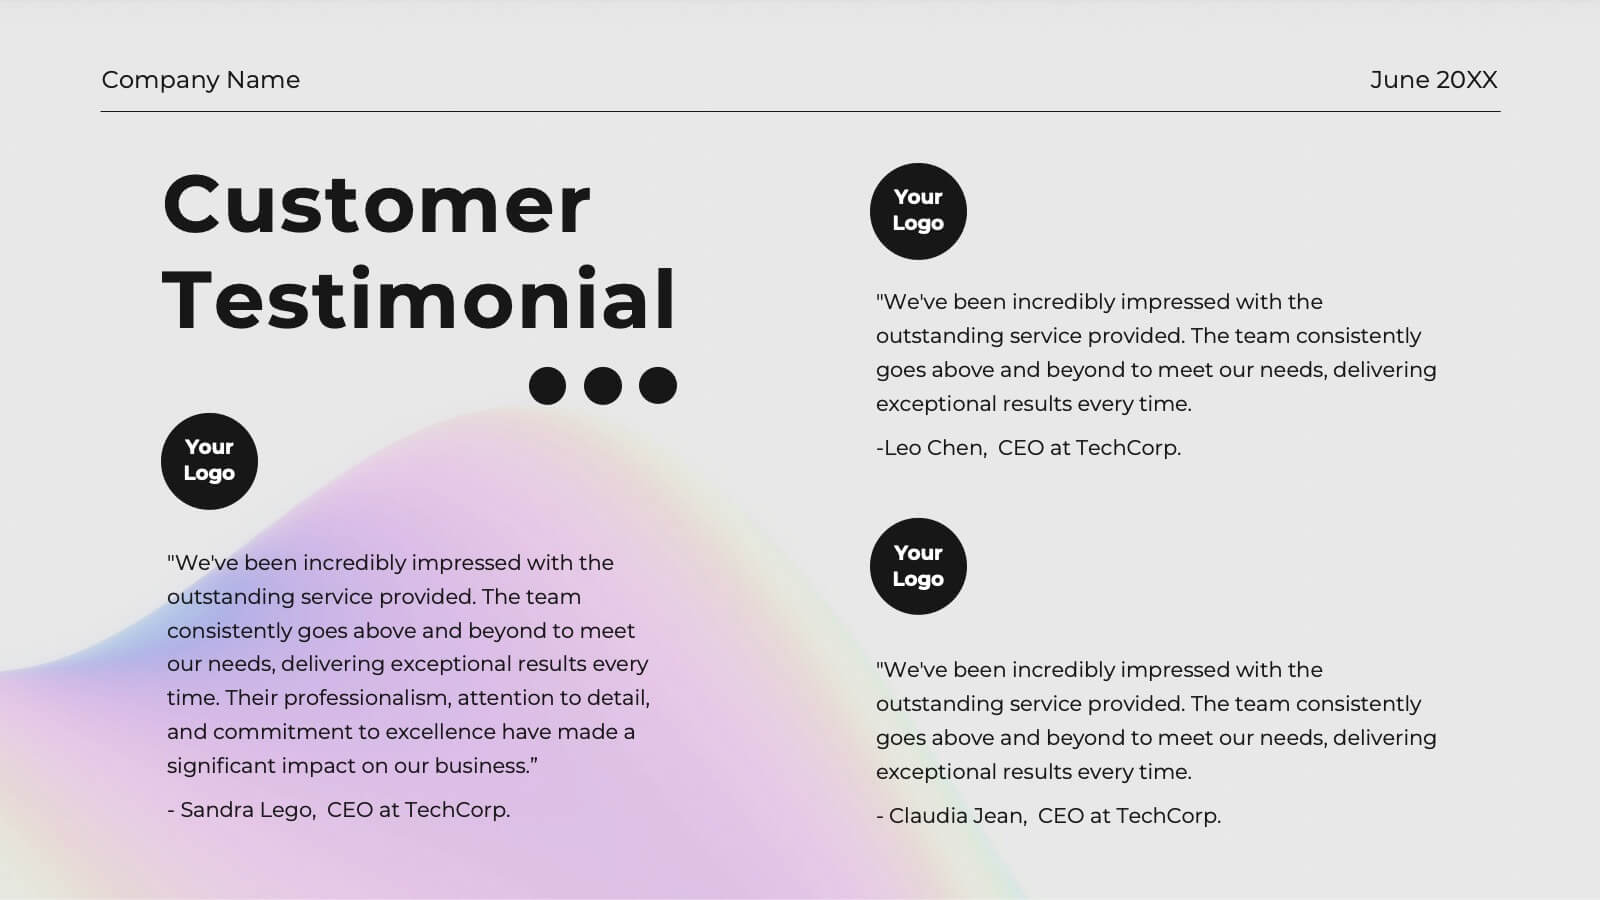
Frost Advertising Agency Proposal Presentation
Dazzle your clients with this radiant agency proposal template! Perfect for presenting your mission, services, and market analysis, it includes slides for case studies, strategy development, and campaign execution. Impress stakeholders with vibrant visuals and detailed content. Compatible with PowerPoint, Keynote, and Google Slides for seamless presentations on any platform.


7 slides
Professional Project Management Infographic Presentation
Project management is the process of planning, organizing, and overseeing resources and tasks to achieve goals and objectives within a defined timeframe. This template includes a clean, eye-catching design with plenty of space to add your content. This infographic template provides a step by step explanation of project management. It's the perfect way to explain complex projects easily to clients and employees. This template is compatible with Powerpoint, keynote and google slides making it easily customizable and editable. Use this for next project management research paper, presentation, etc.