


Features
- 8 Unique slides
- Fully editable and easy to edit in Microsoft Powerpoint, Keynote and Google Slides
- 16:9 widescreen layout
- Clean and professional designs
- Export to JPG, PDF or send by email


Do you have any questions?
Recommend


6 slides
Strategy Wheel Infographic Slide
Present key strategies, priorities, or action items in a visually engaging circular format. This infographic template is ideal for showcasing 5 interconnected components in business plans, marketing strategies, or process flows. Fully editable in PowerPoint, Keynote, and Google Slides for seamless customization.


5 slides
Consideration in Contract Law Infographics
Navigate the complexities of contract law with our consideration in contract law infographics. Crafted with a vintage aesthetic, using a palette of brown, tan, and blue, this sophisticated template radiates a classic legal ambiance. Ideal for law students, legal professionals, and educators, this collection aids in dissecting intricate contractual principles with clarity and elegance. Compatible with Powerpoint, Keynote, and Google Slides. The creative, vintage-themed design, adorned with graphics and icons, not only enriches your presentation but also serves as a compelling educational tool, transforming legal jargon into accessible information.


26 slides
Jewelry Elegant Company Profile Presentation
Immerse yourself in the dazzling world of jewelry, where gems and craftsmanship create timeless elegance. Our template, exuding luxury in shades of brown and orange, embodies the modern elegance and aesthetic charm of fine jewelry. Enhanced with chic graphics, bespoke icons, and evocative image placeholders, it mirrors the allure of precious metals and stones. Seamlessly adapted for Powerpoint, Keynote, or Google Slides. A shimmering choice for jewelry brands, boutique owners, designers, or anyone seeking to showcase the sparkle and artistry of jewelry. Illuminate your brand; let each jewel tell its story.


2 slides
Bold and Minimal Opening Presentation Layout
Make your first slide speak volumes with this bold yet minimal opening layout. Designed to grab attention while keeping things simple, this template helps you introduce your presentation with clarity and confidence. Great for modern business decks, it’s fully customizable and works seamlessly in PowerPoint, Keynote, and Google Slides.


23 slides
Journey Product Roadmap Presentation
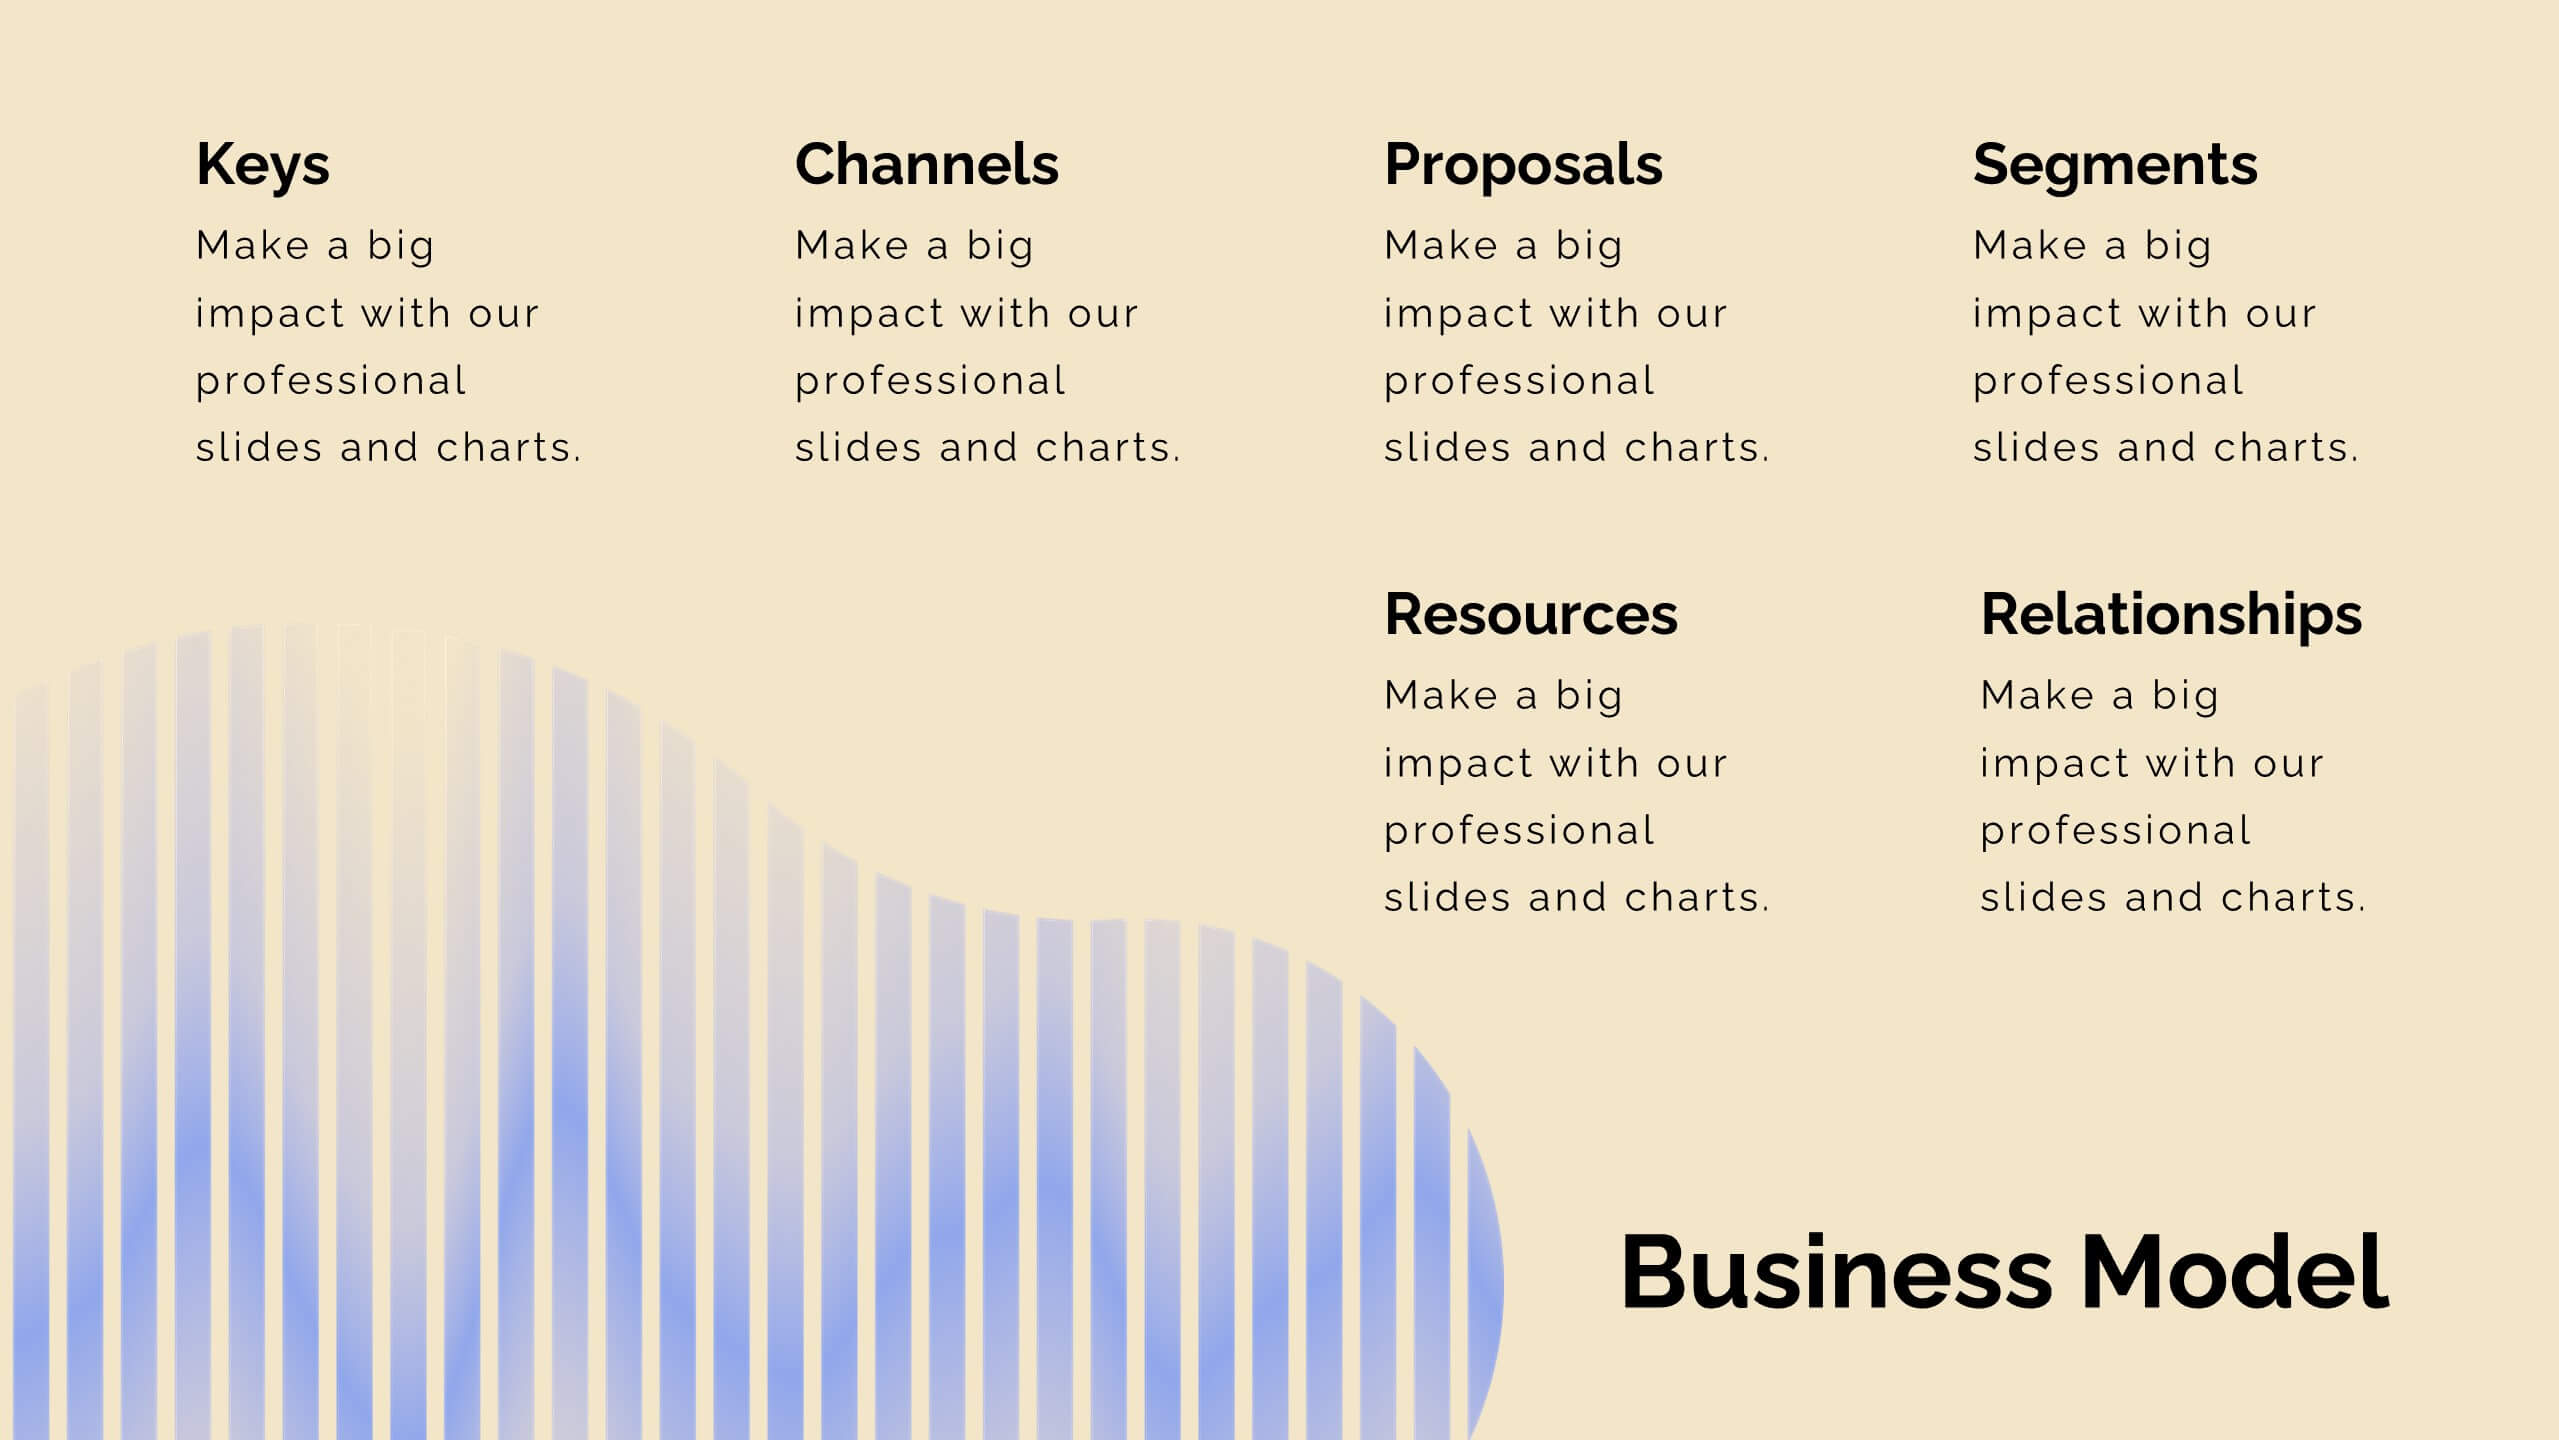
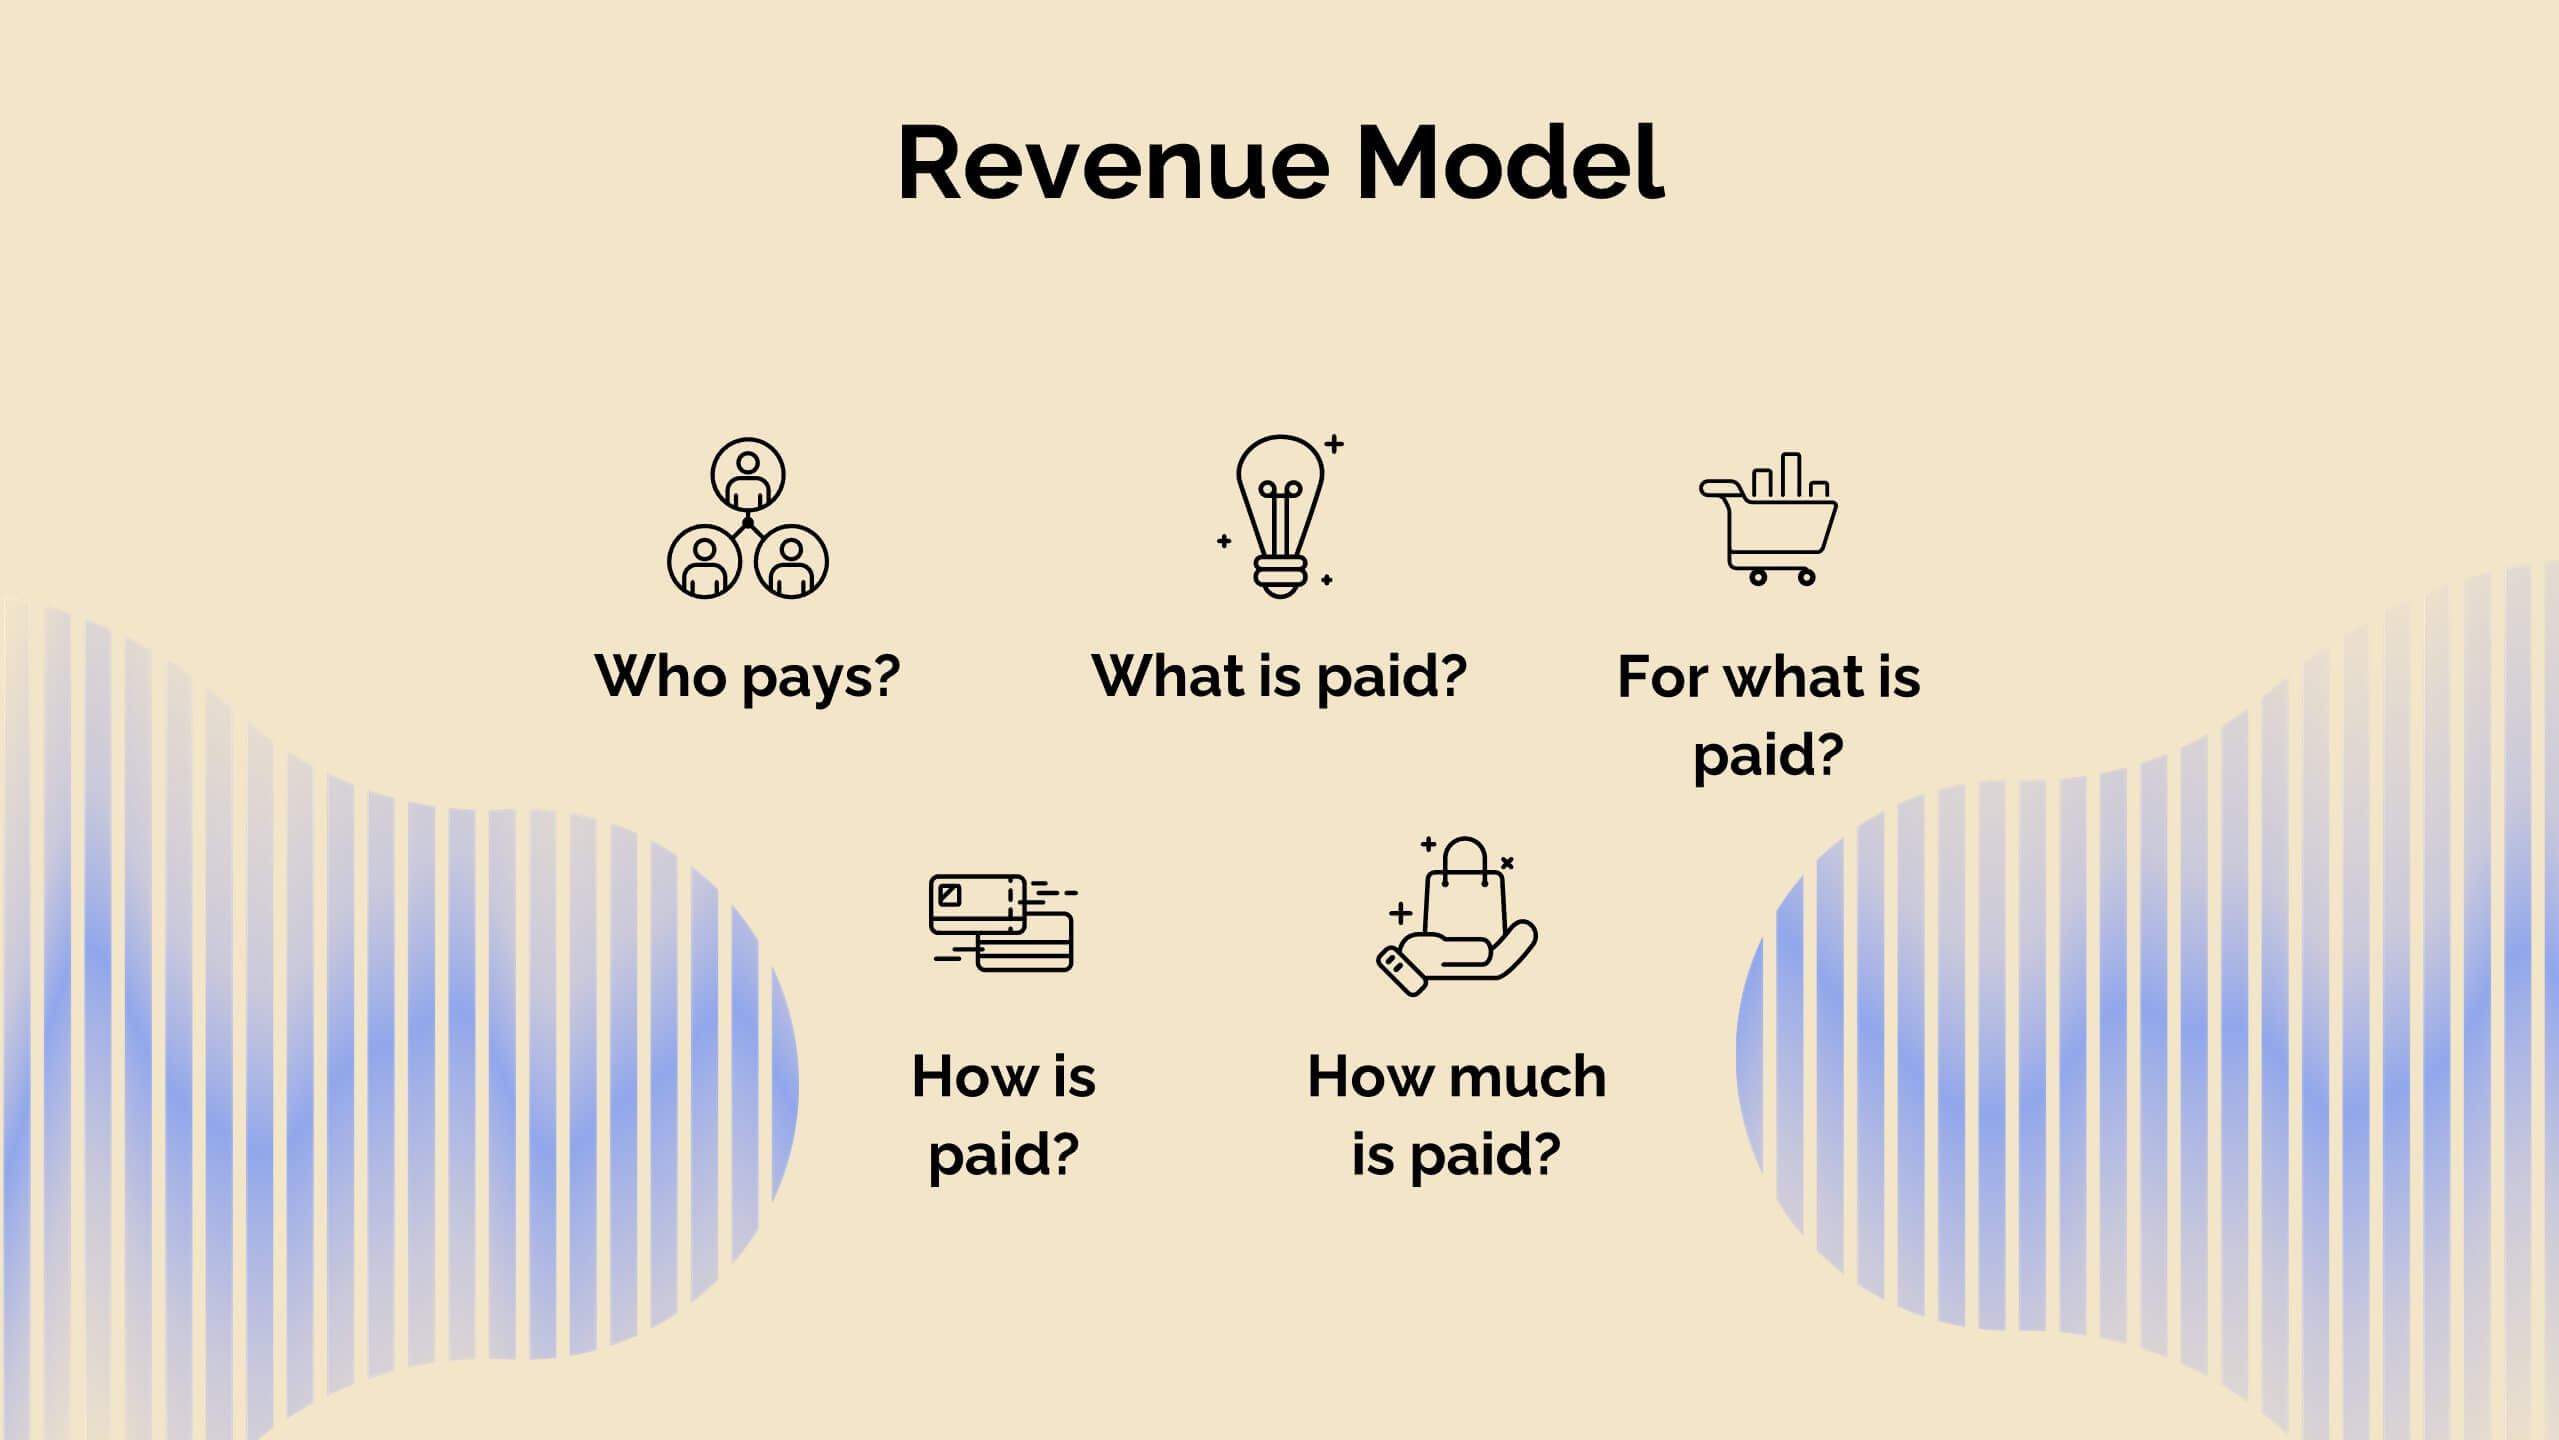
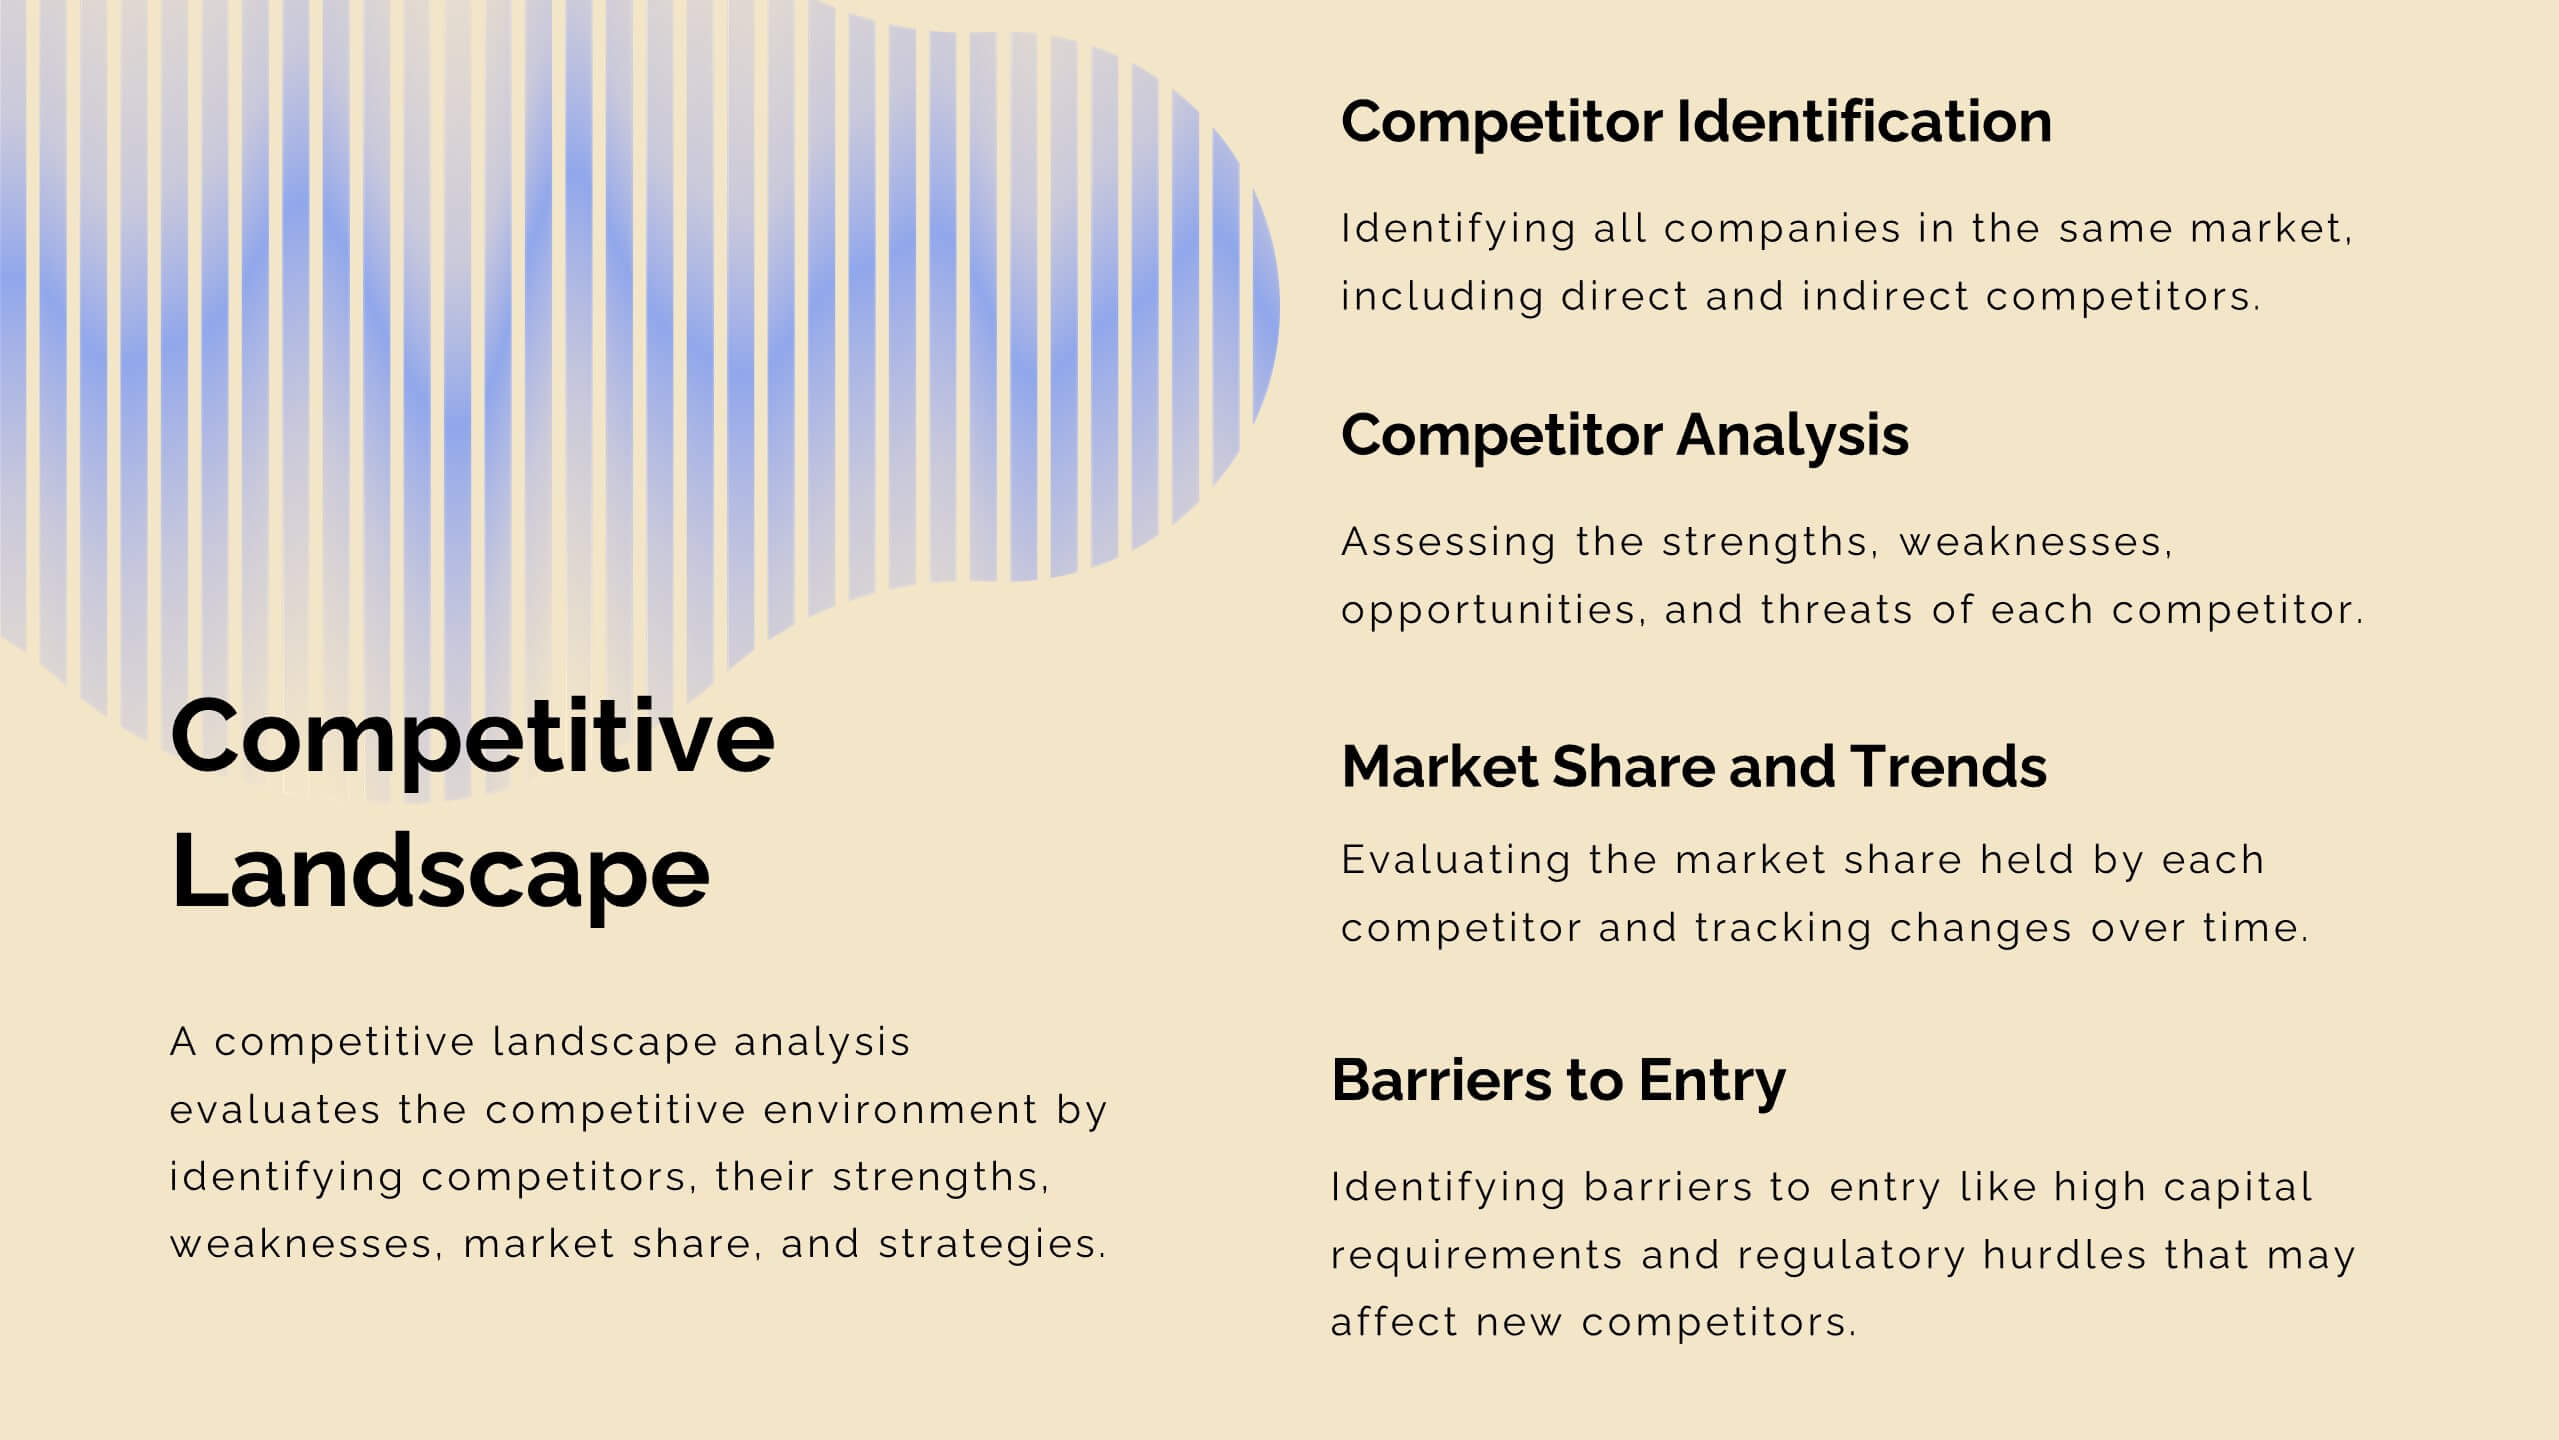
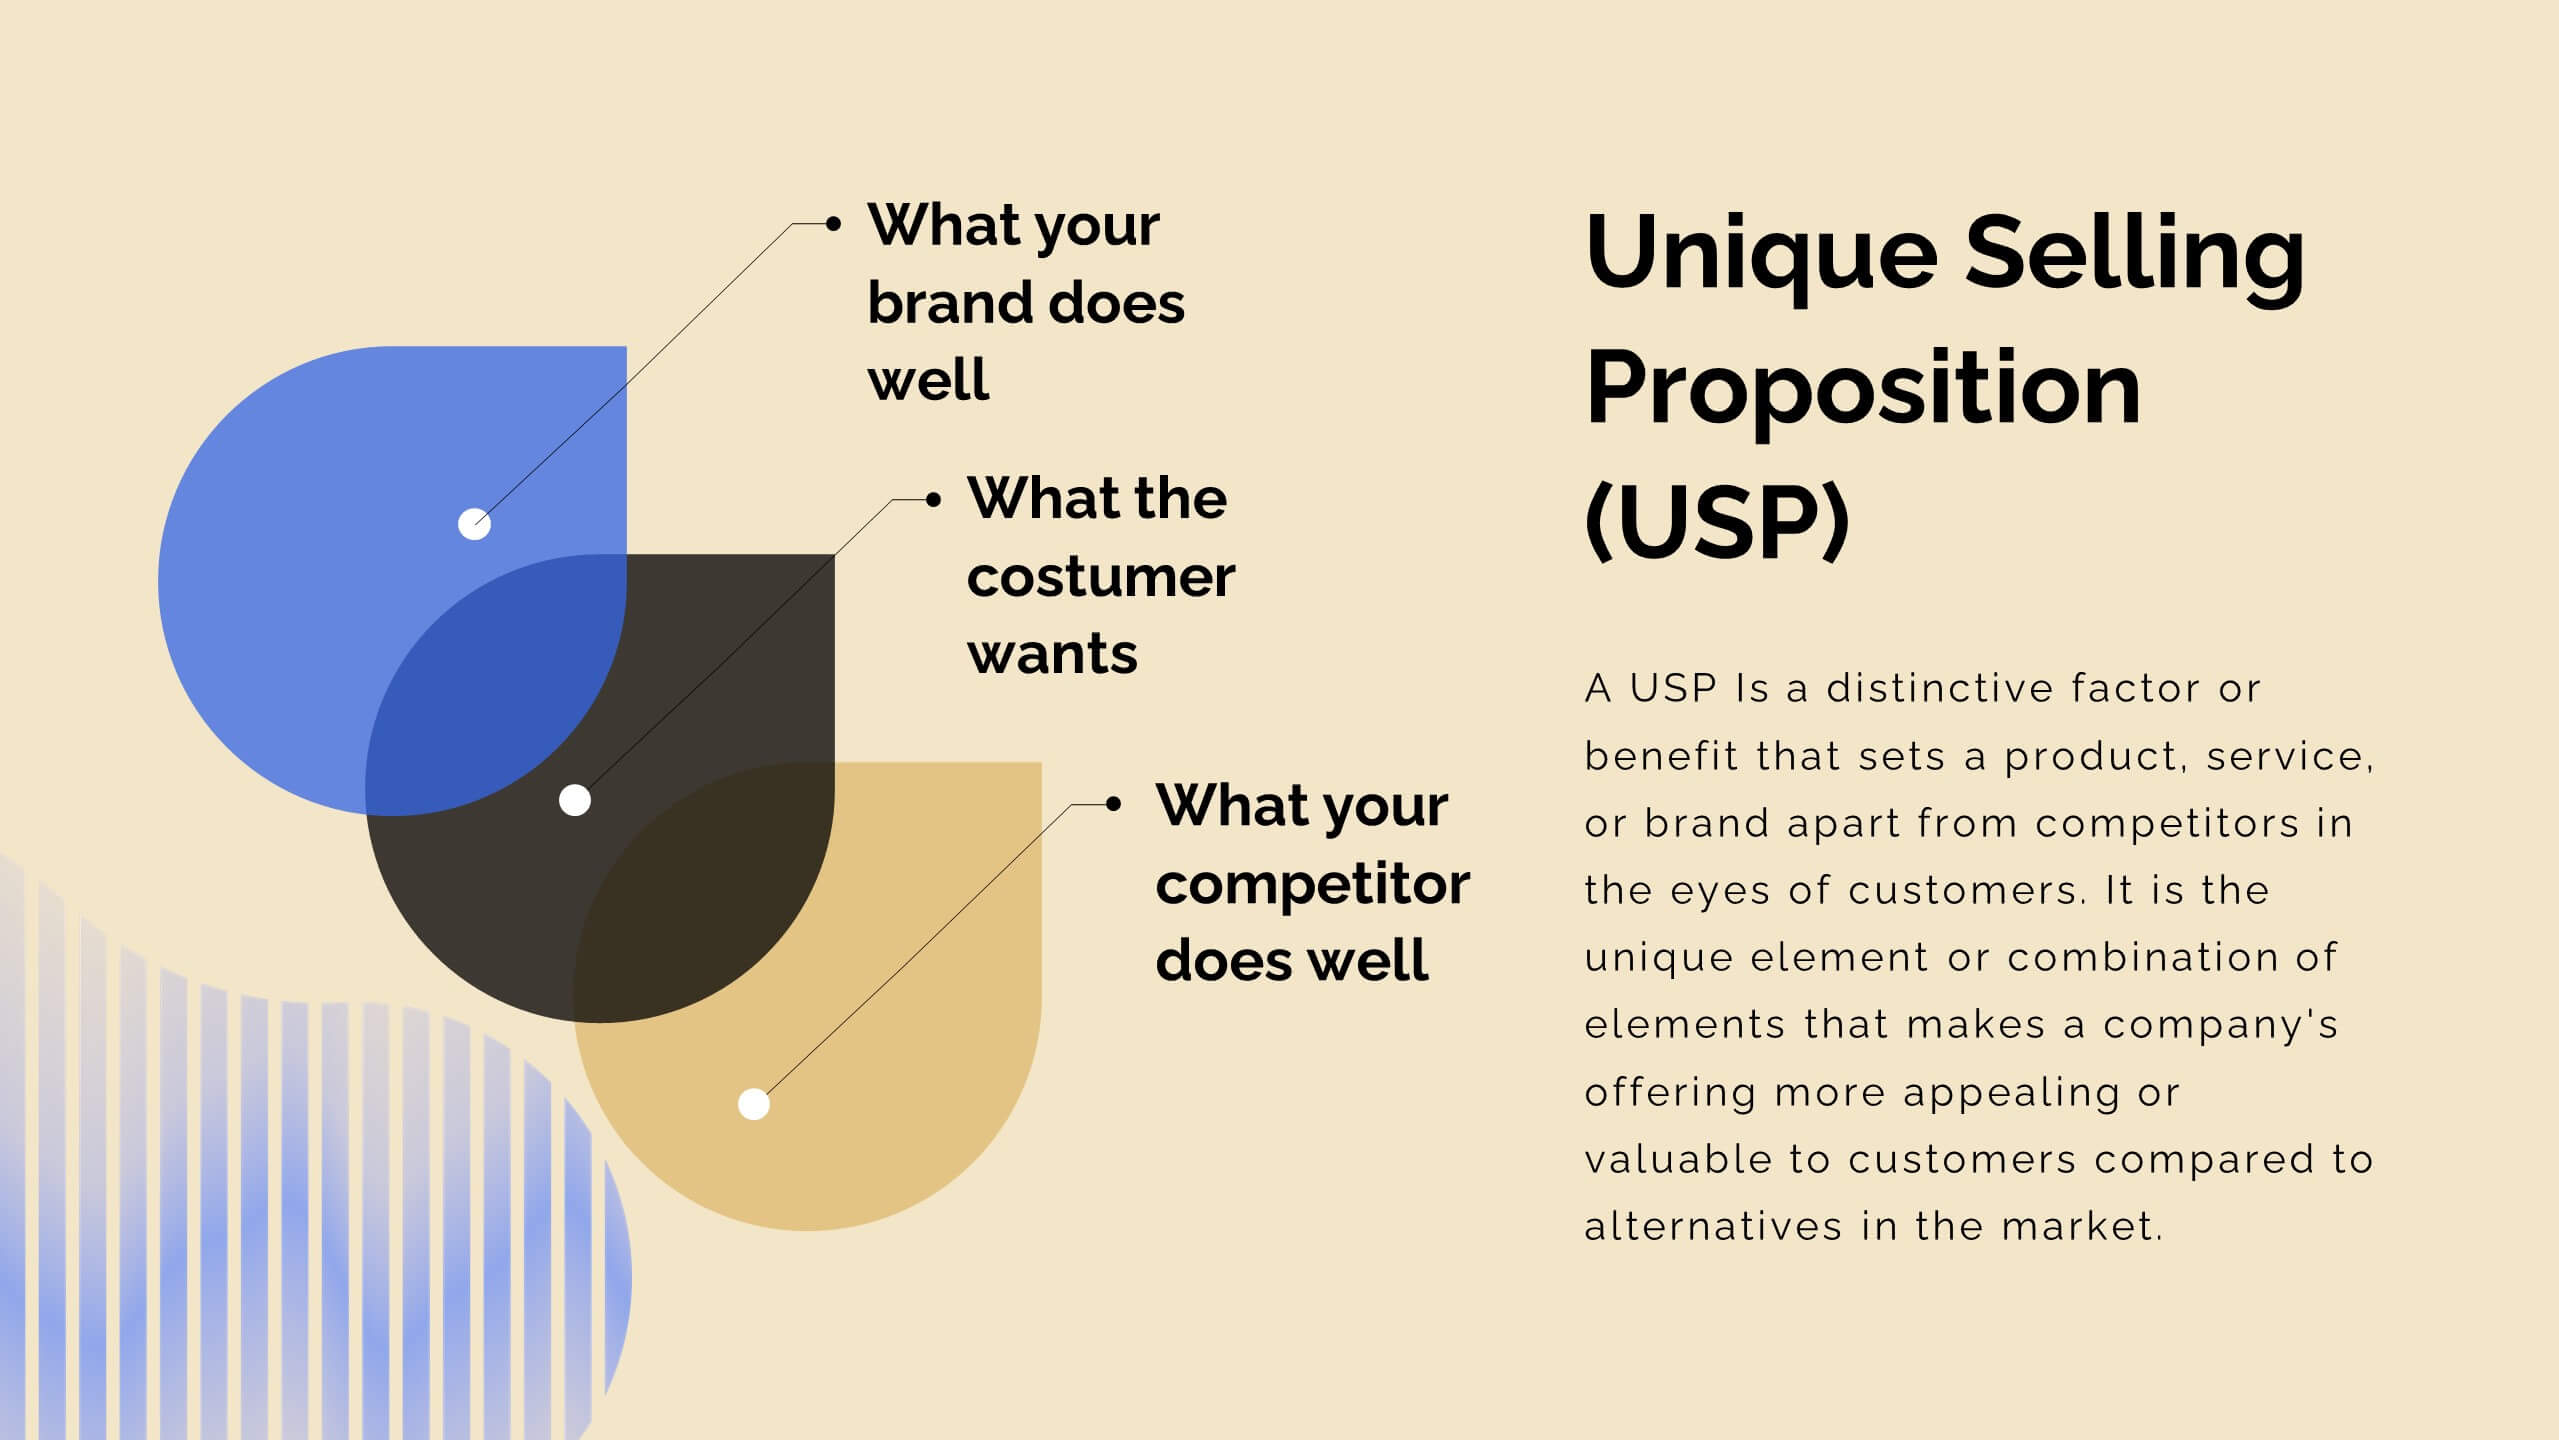
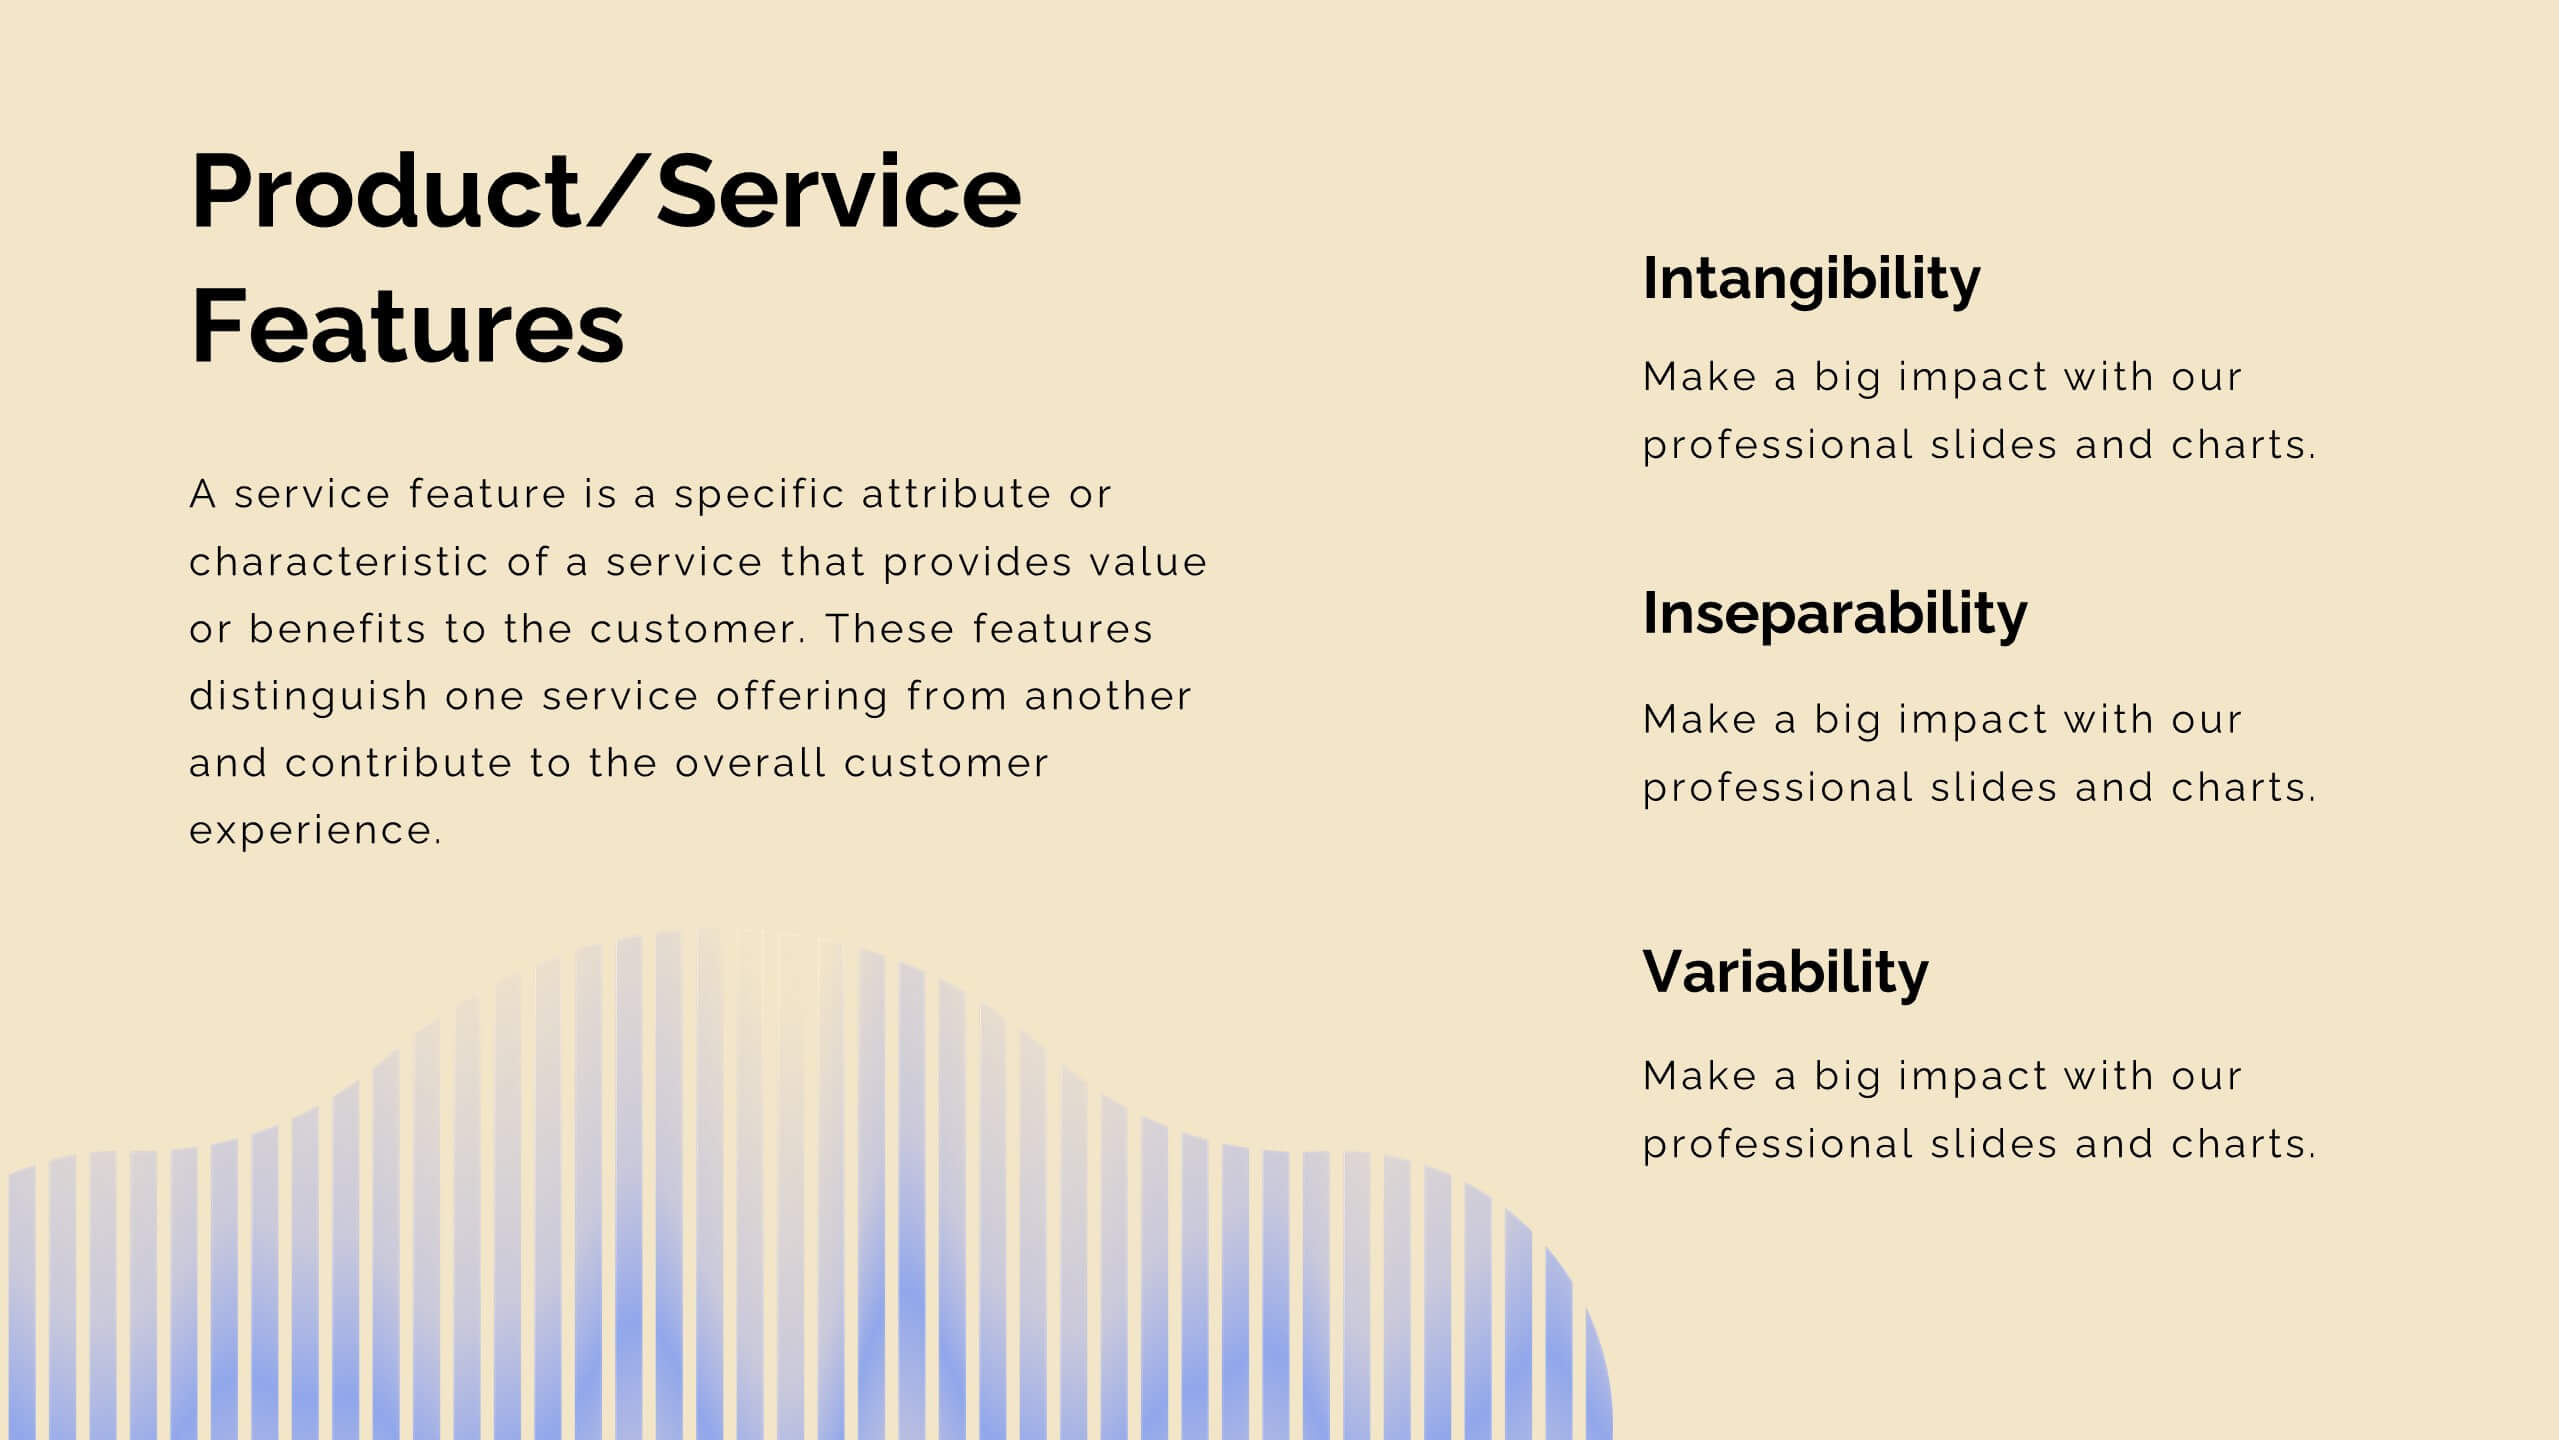
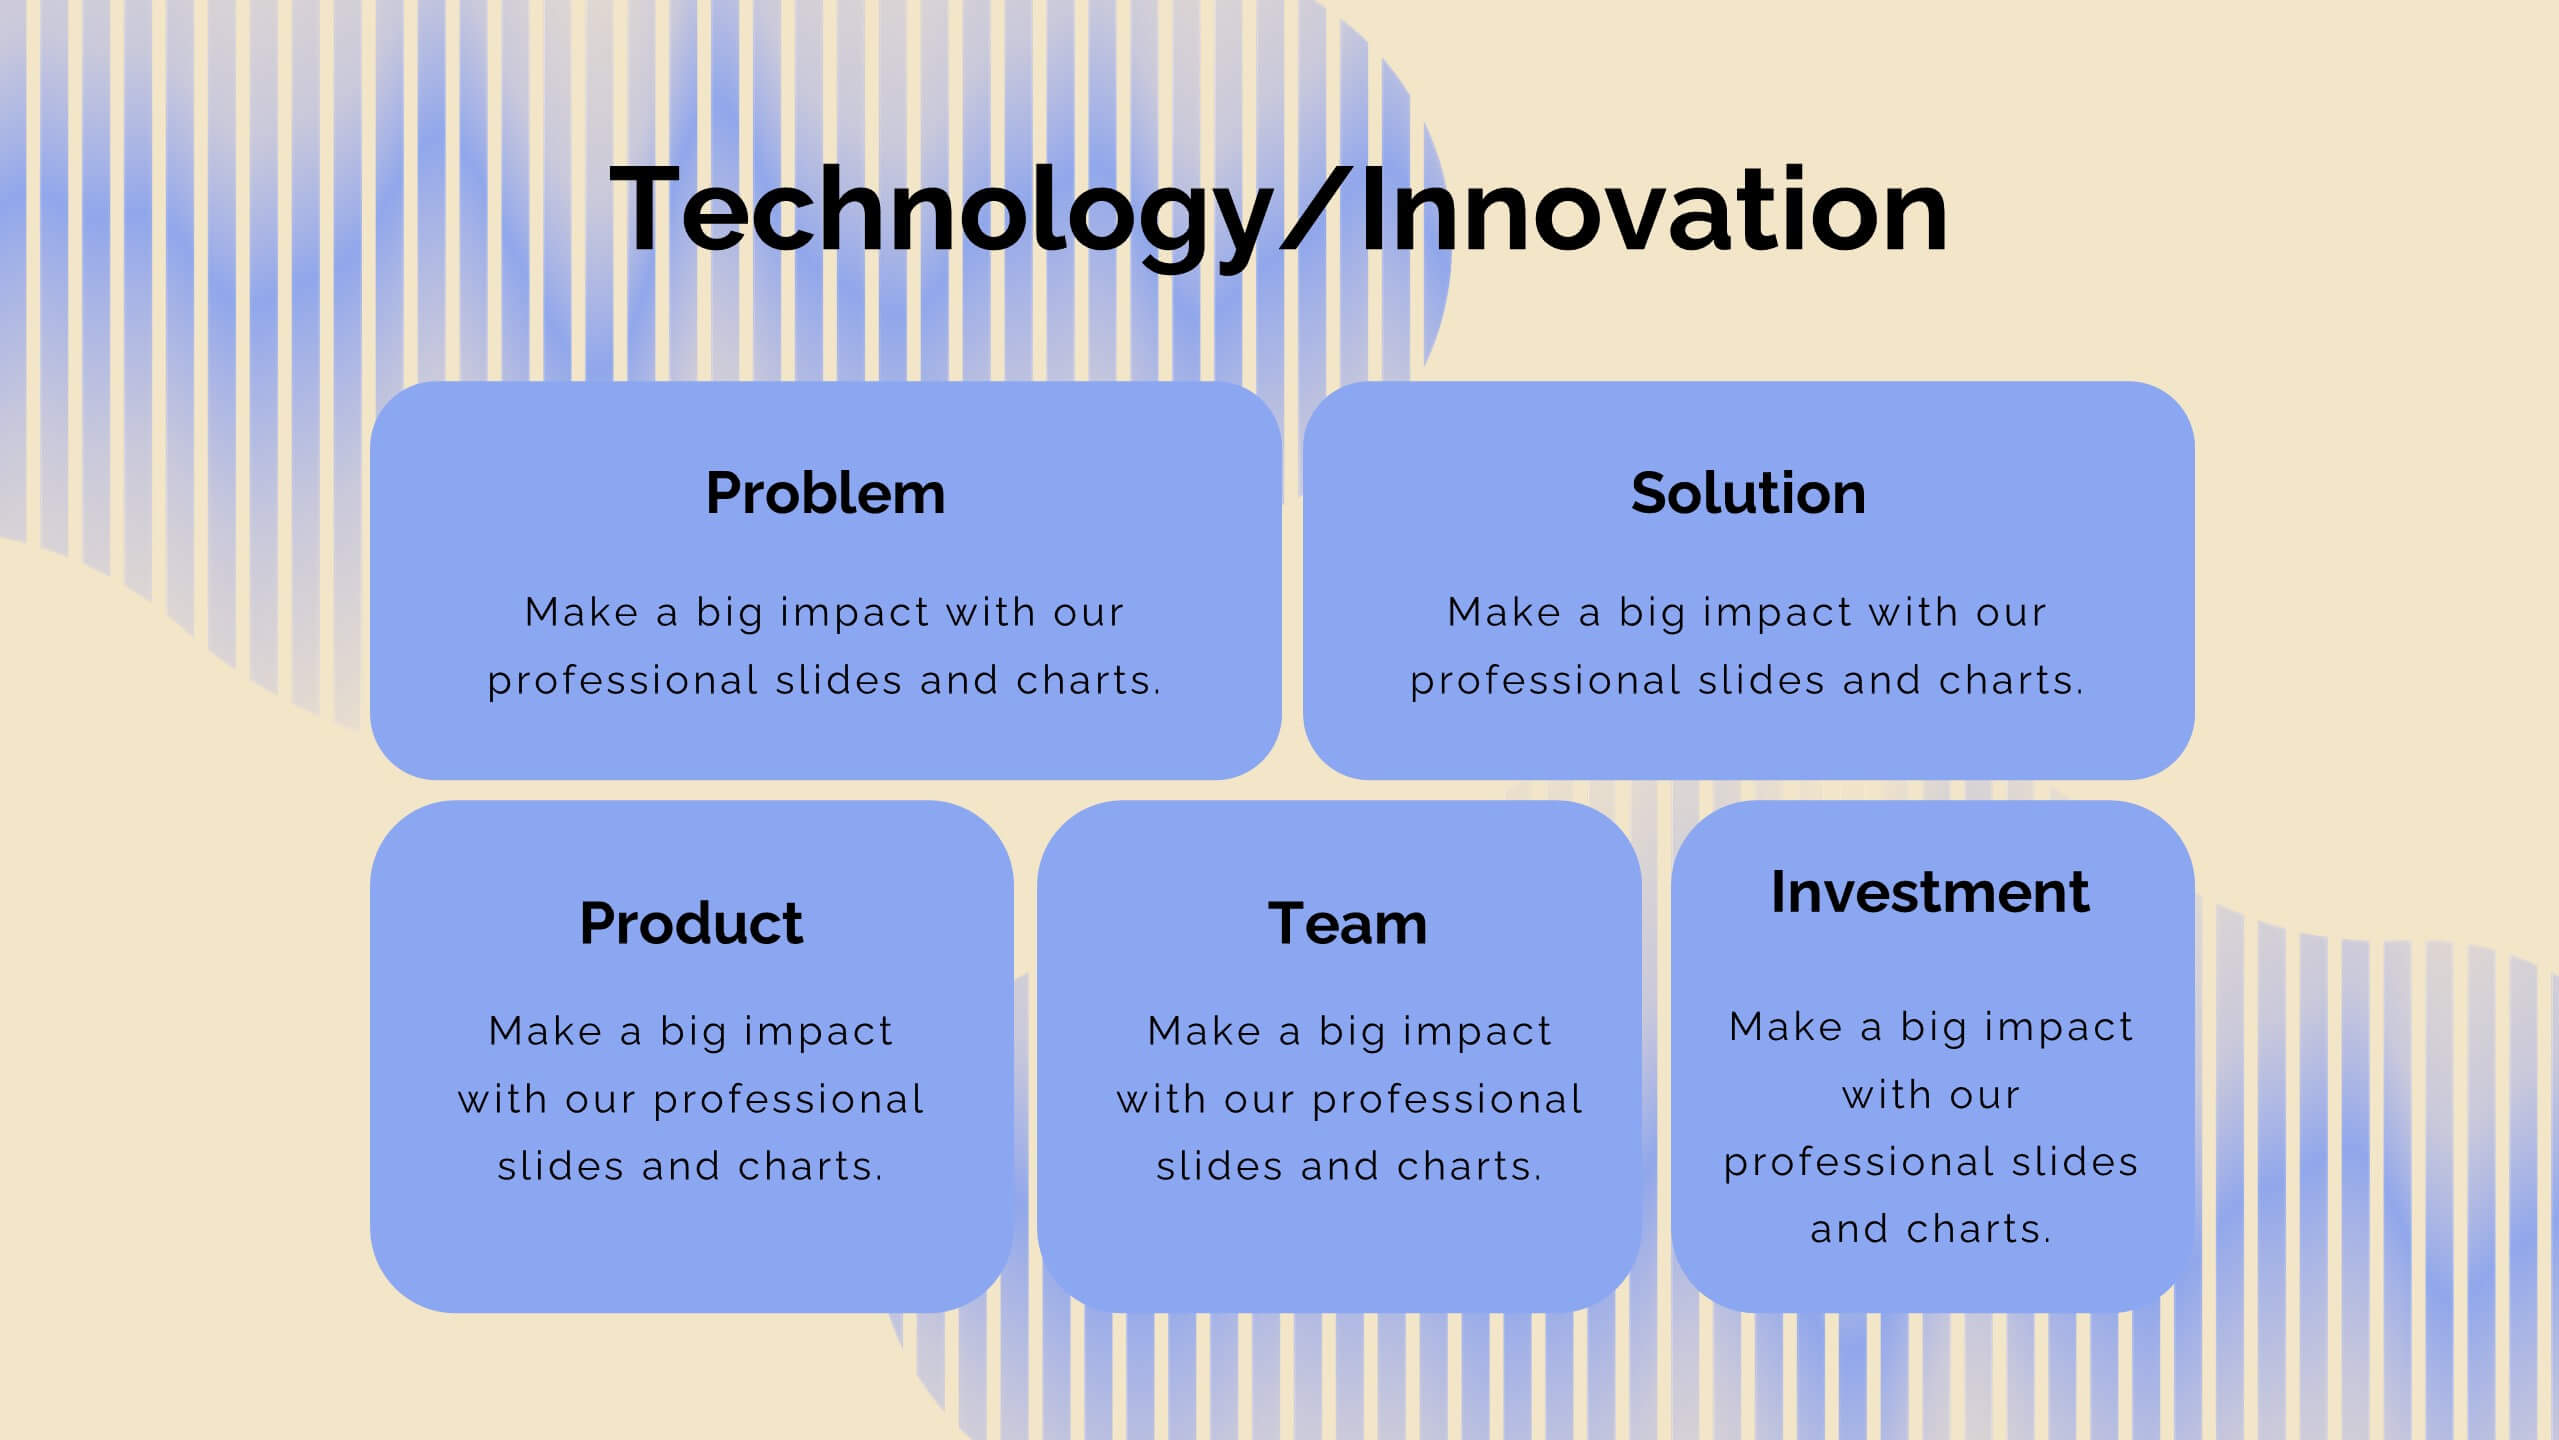
Embark on a seamless journey through your product’s lifecycle with this comprehensive roadmap template! Perfect for illustrating key milestones, business models, and market opportunities, it’s your go-to for clear and engaging presentations. Dive into competitive analysis, showcase your unique selling proposition, and outline your growth projections with style. Compatible with PowerPoint, Keynote, and Google Slides.


4 slides
Healthcare Procedure and Diagnosis Presentation
Simplify medical communication with the Healthcare Procedure and Diagnosis Presentation. Featuring clean visuals like syringes, hearts, and med kits, this layout is ideal for outlining treatment stages, clinical processes, or patient care steps. Perfect for hospitals, clinics, or healthcare startups. Fully editable in PowerPoint, Keynote, Google Slides, and Canva.


5 slides
Big Data Analytics Slide Presentation
Bring your insights to life with a clean, modern slide that transforms complex information into a simple visual journey. This layout helps you explain key data points, trends, and analytical steps with clarity and ease, making your message instantly understandable. Compatible with PowerPoint, Keynote, and Google Slides.


20 slides
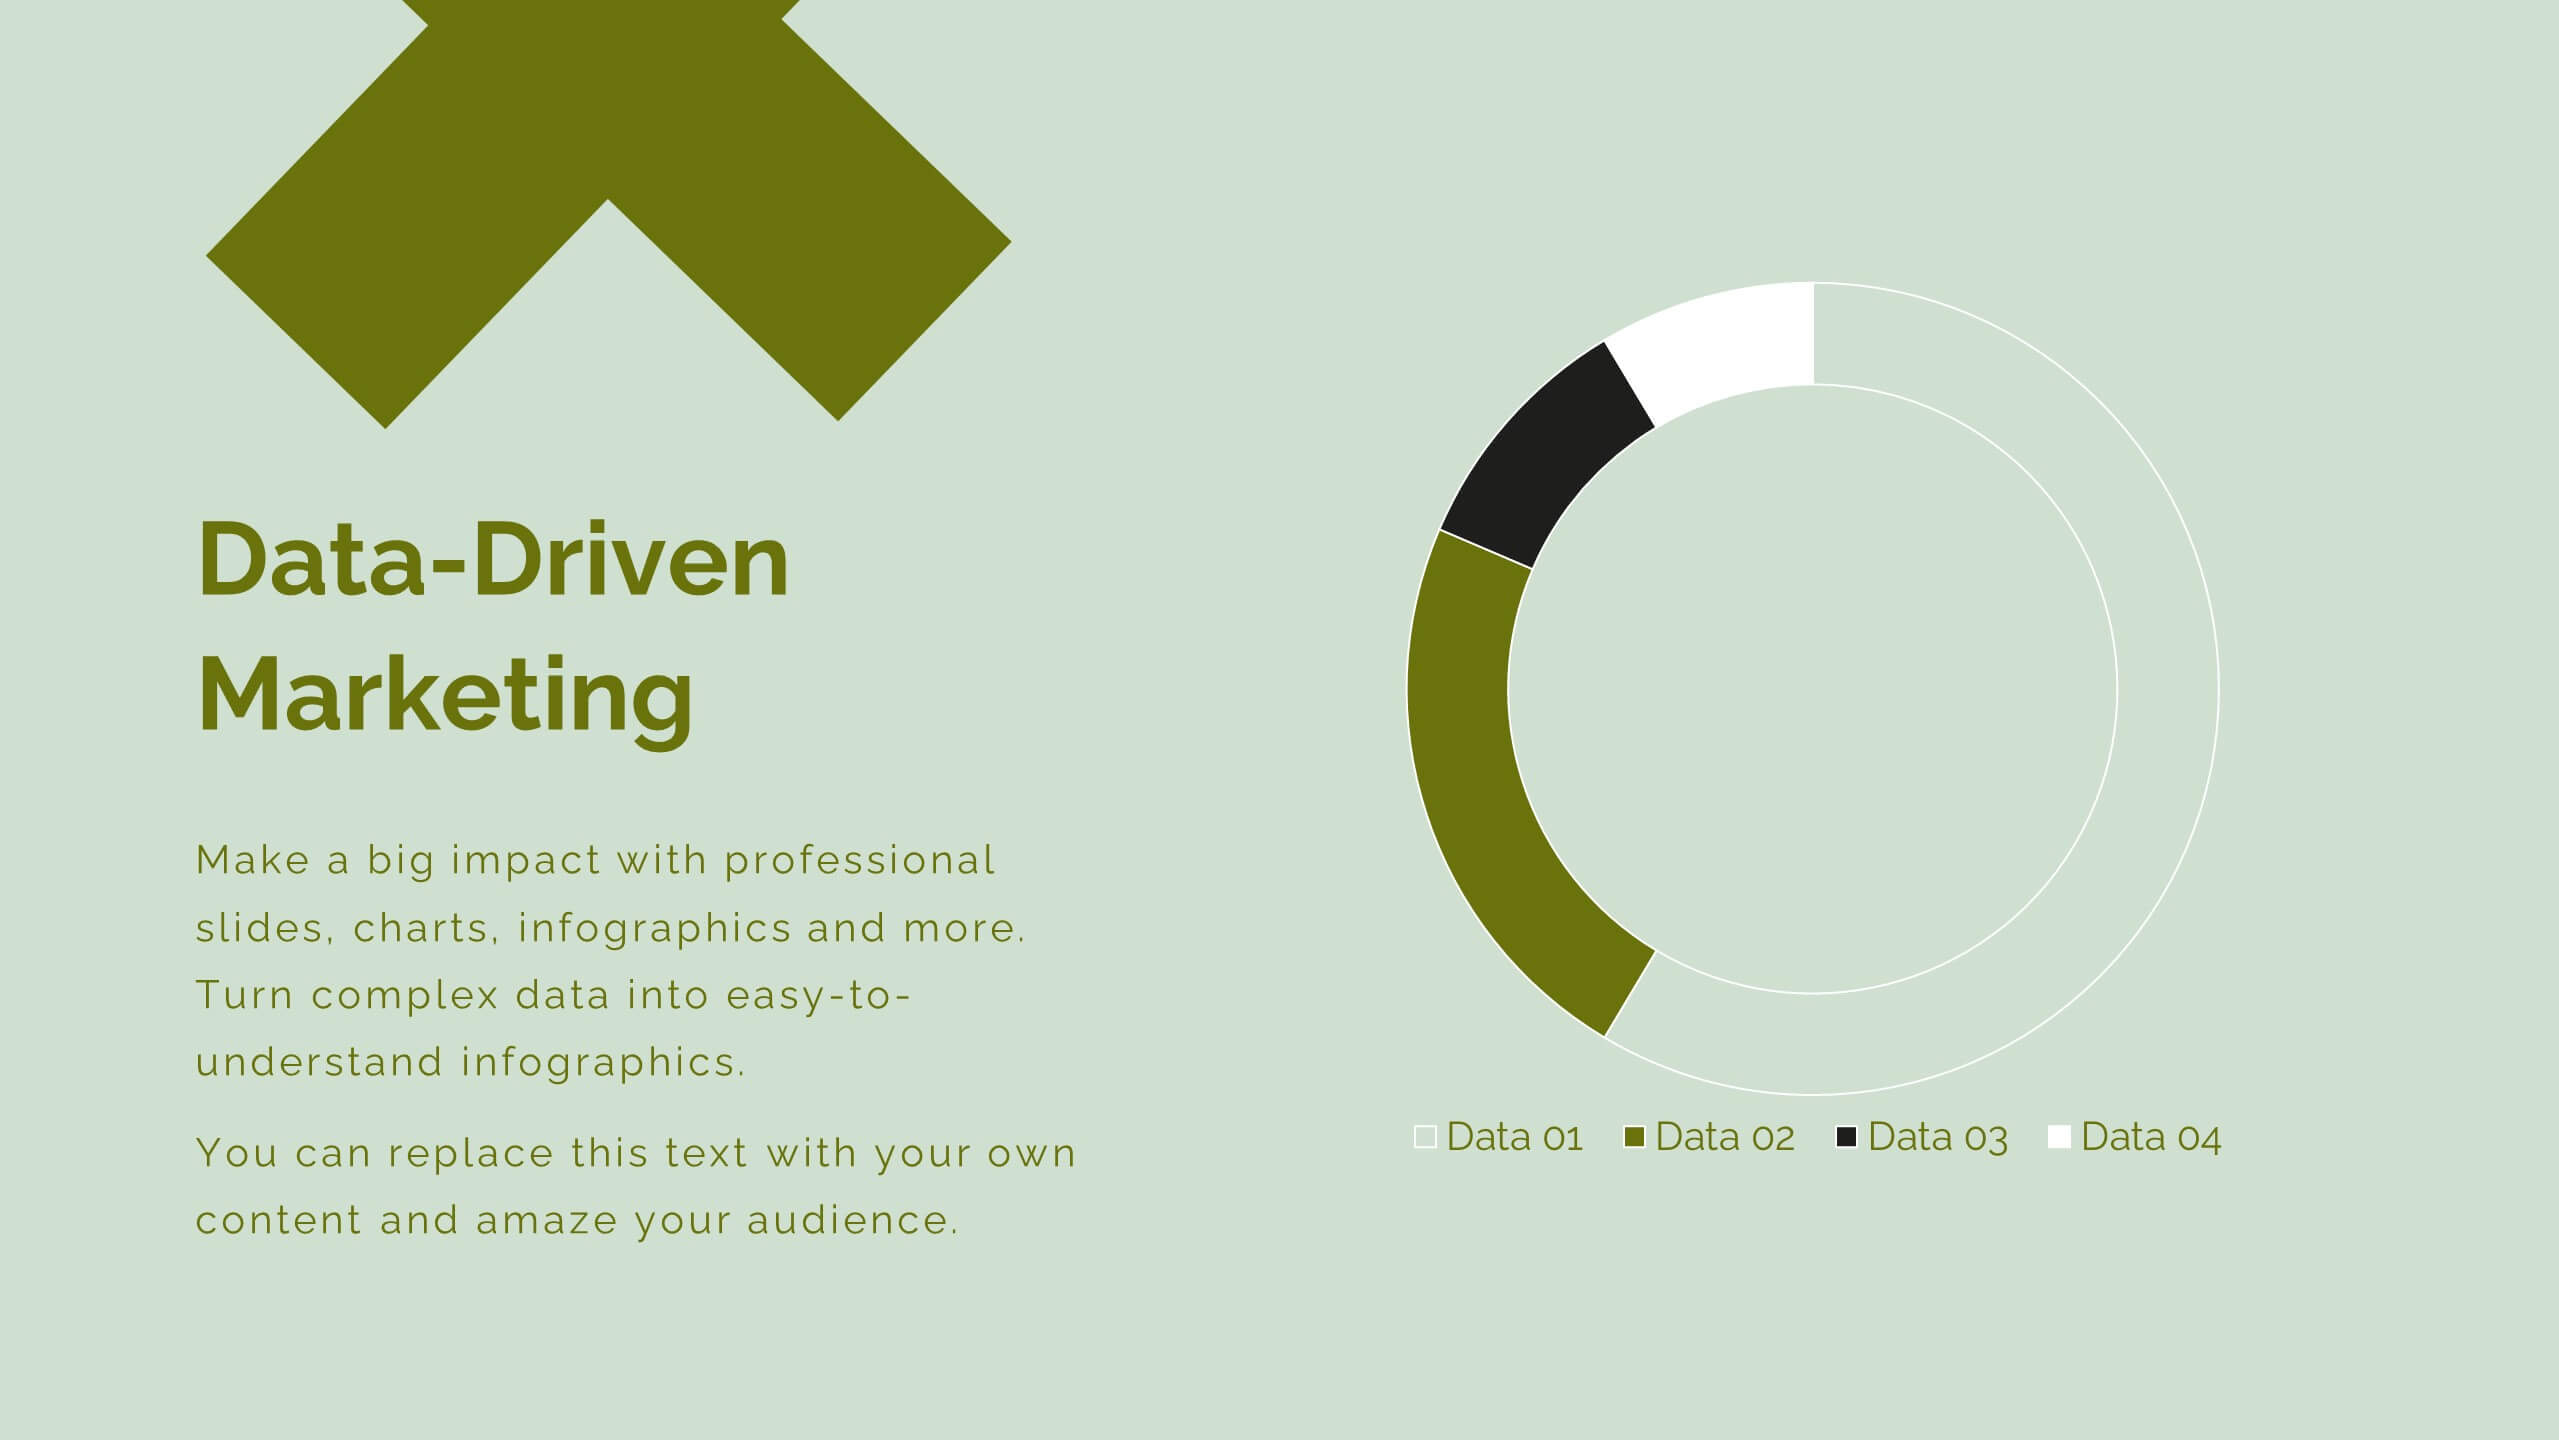
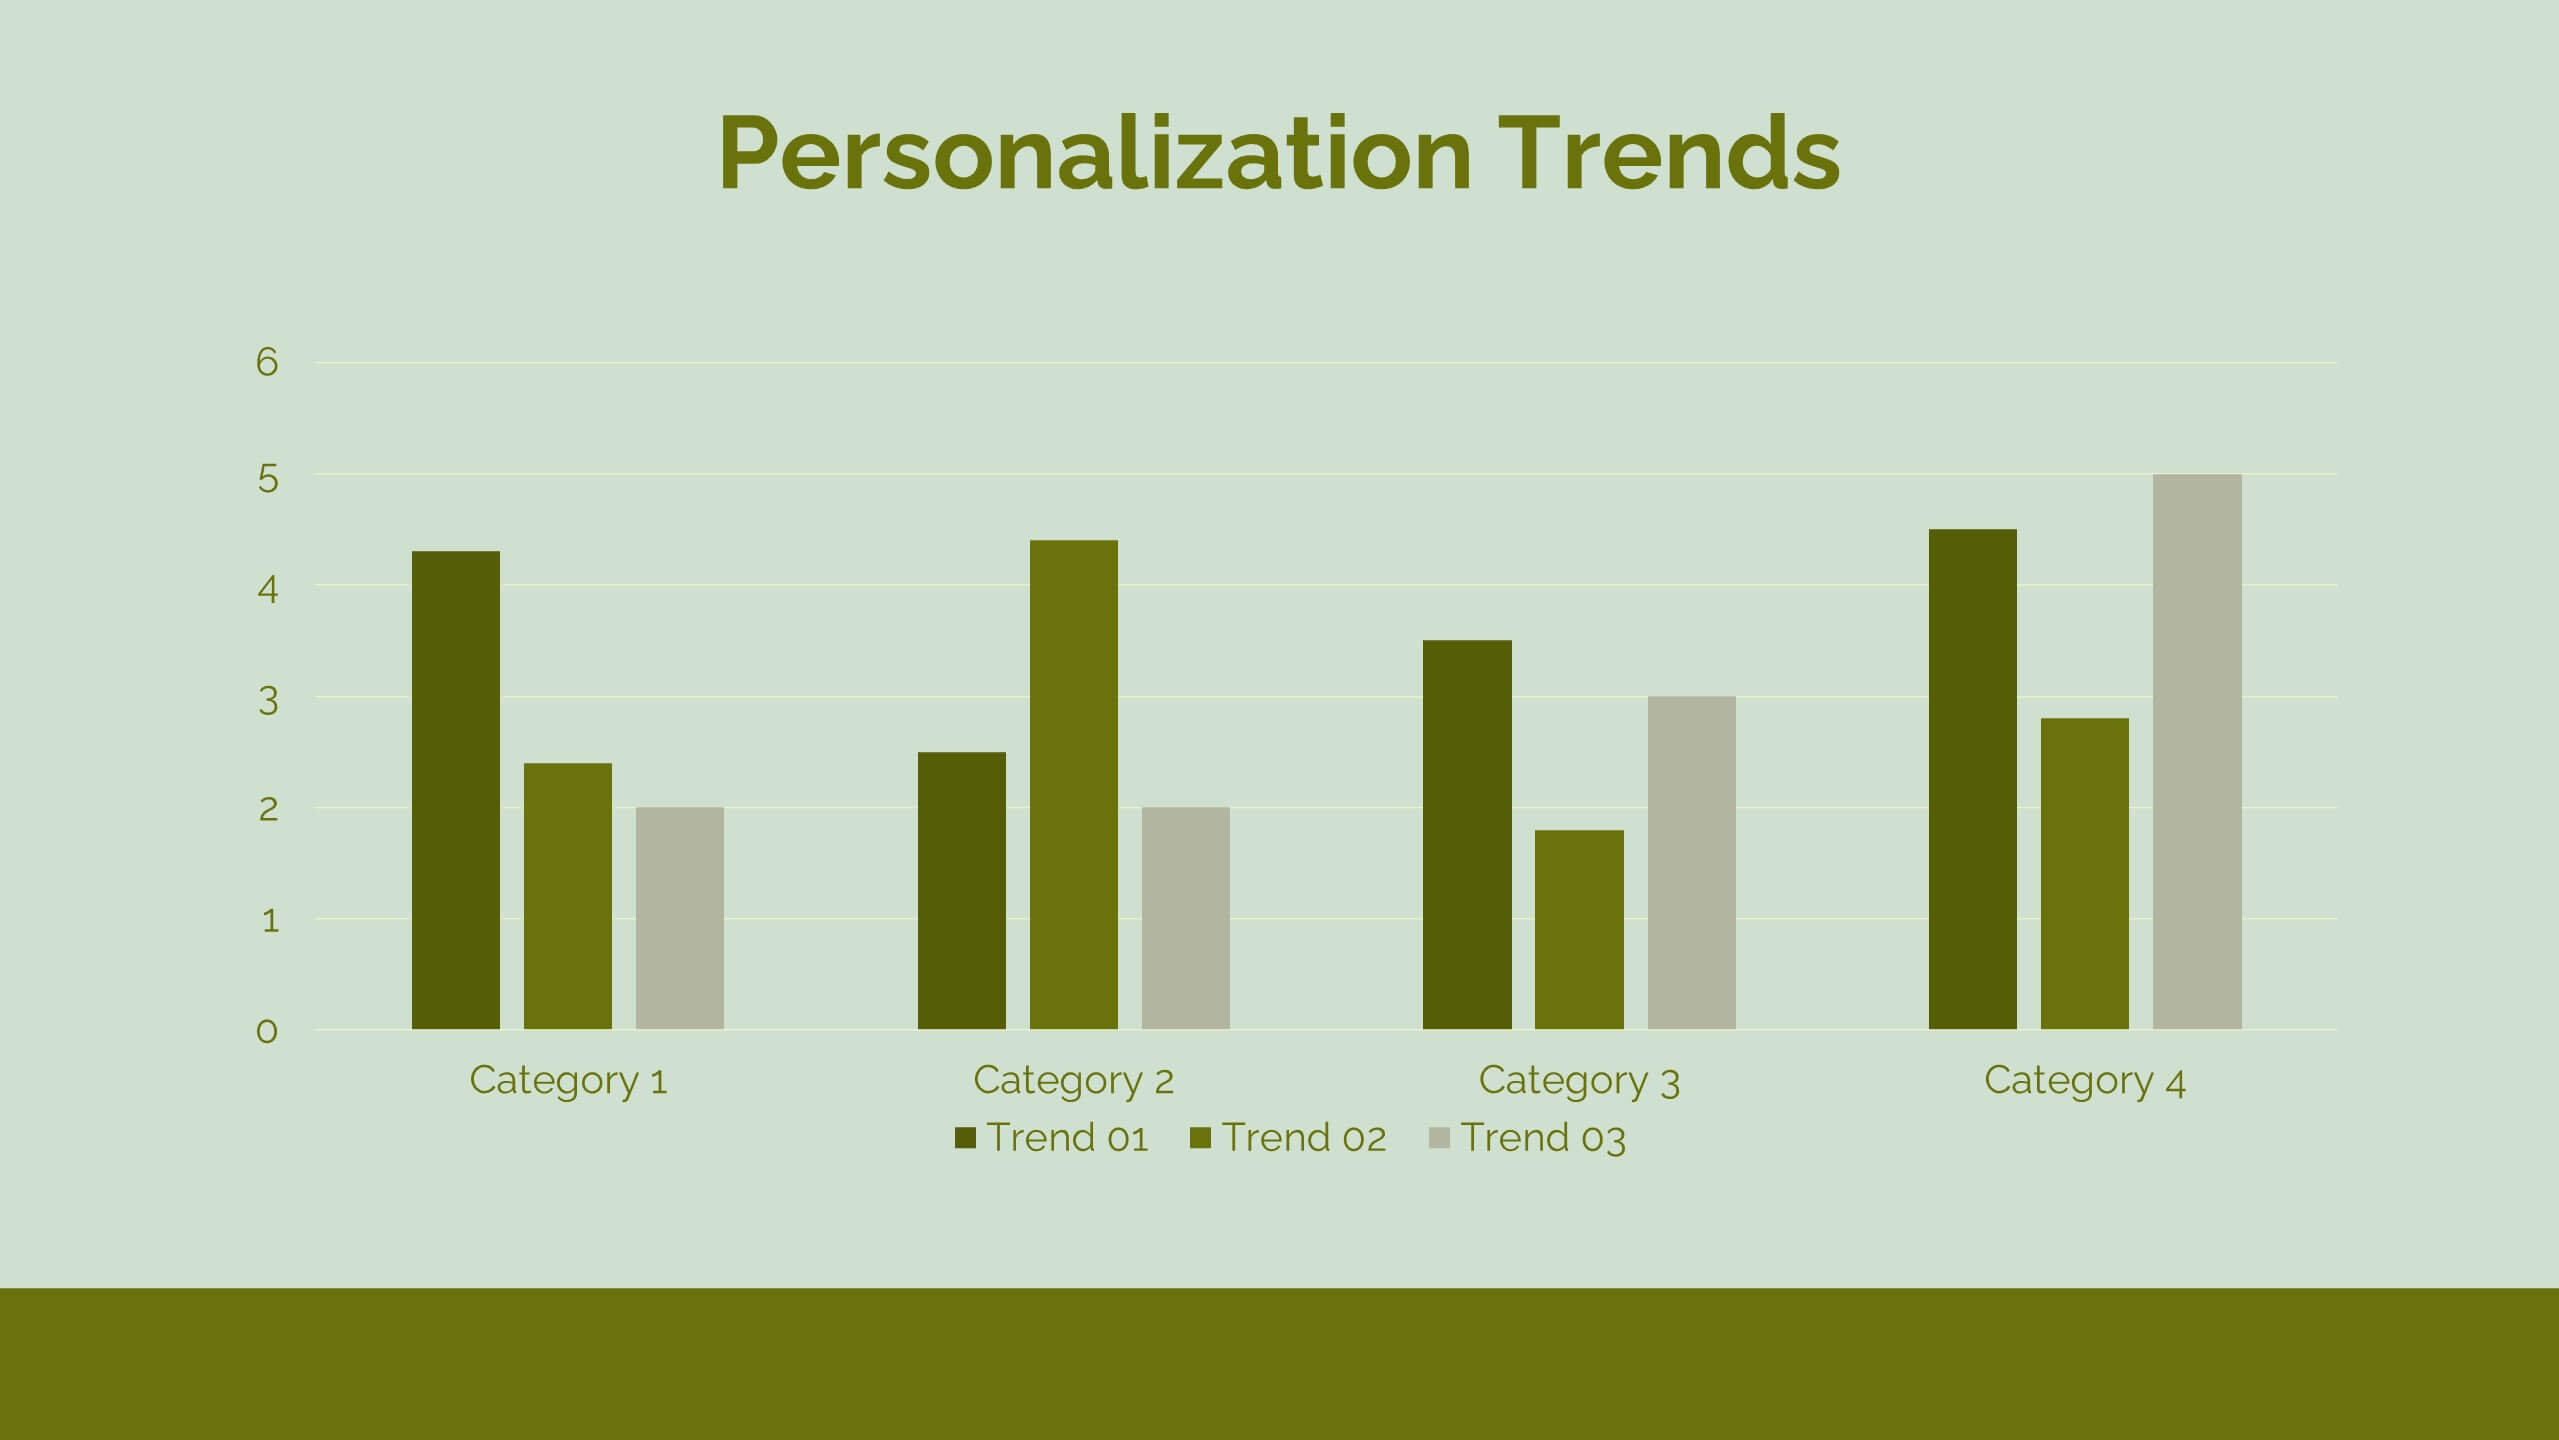
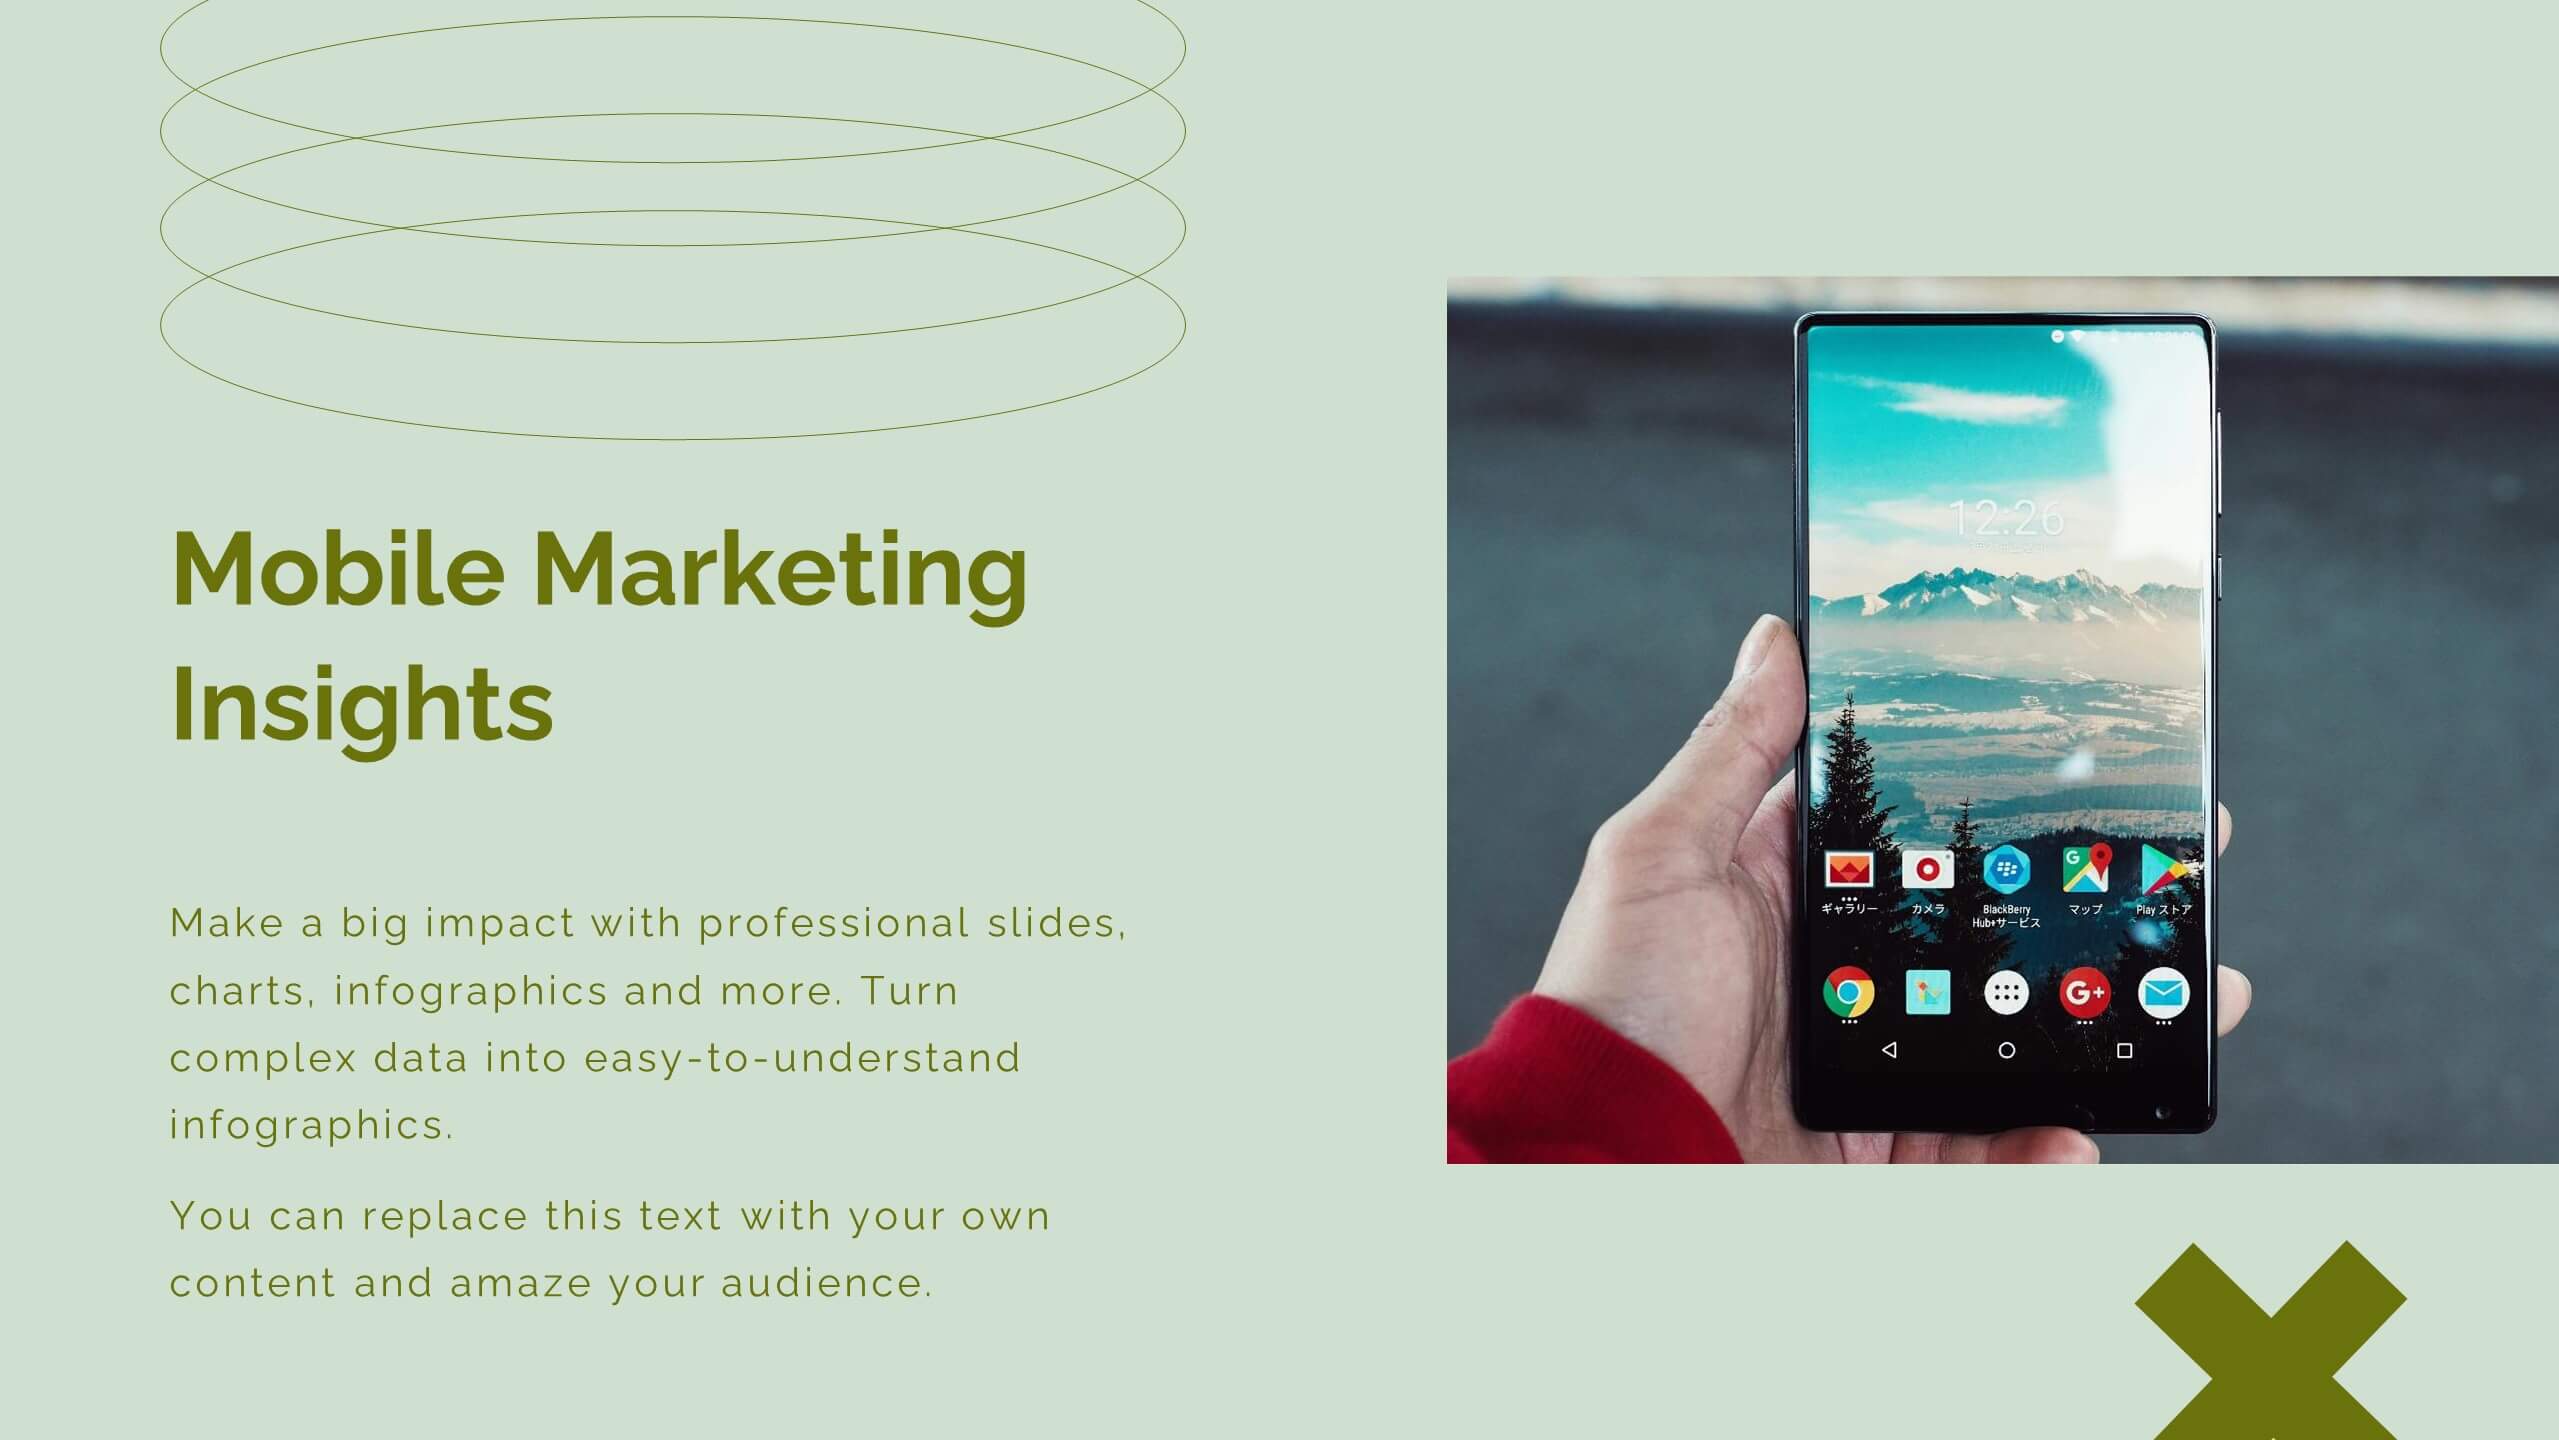
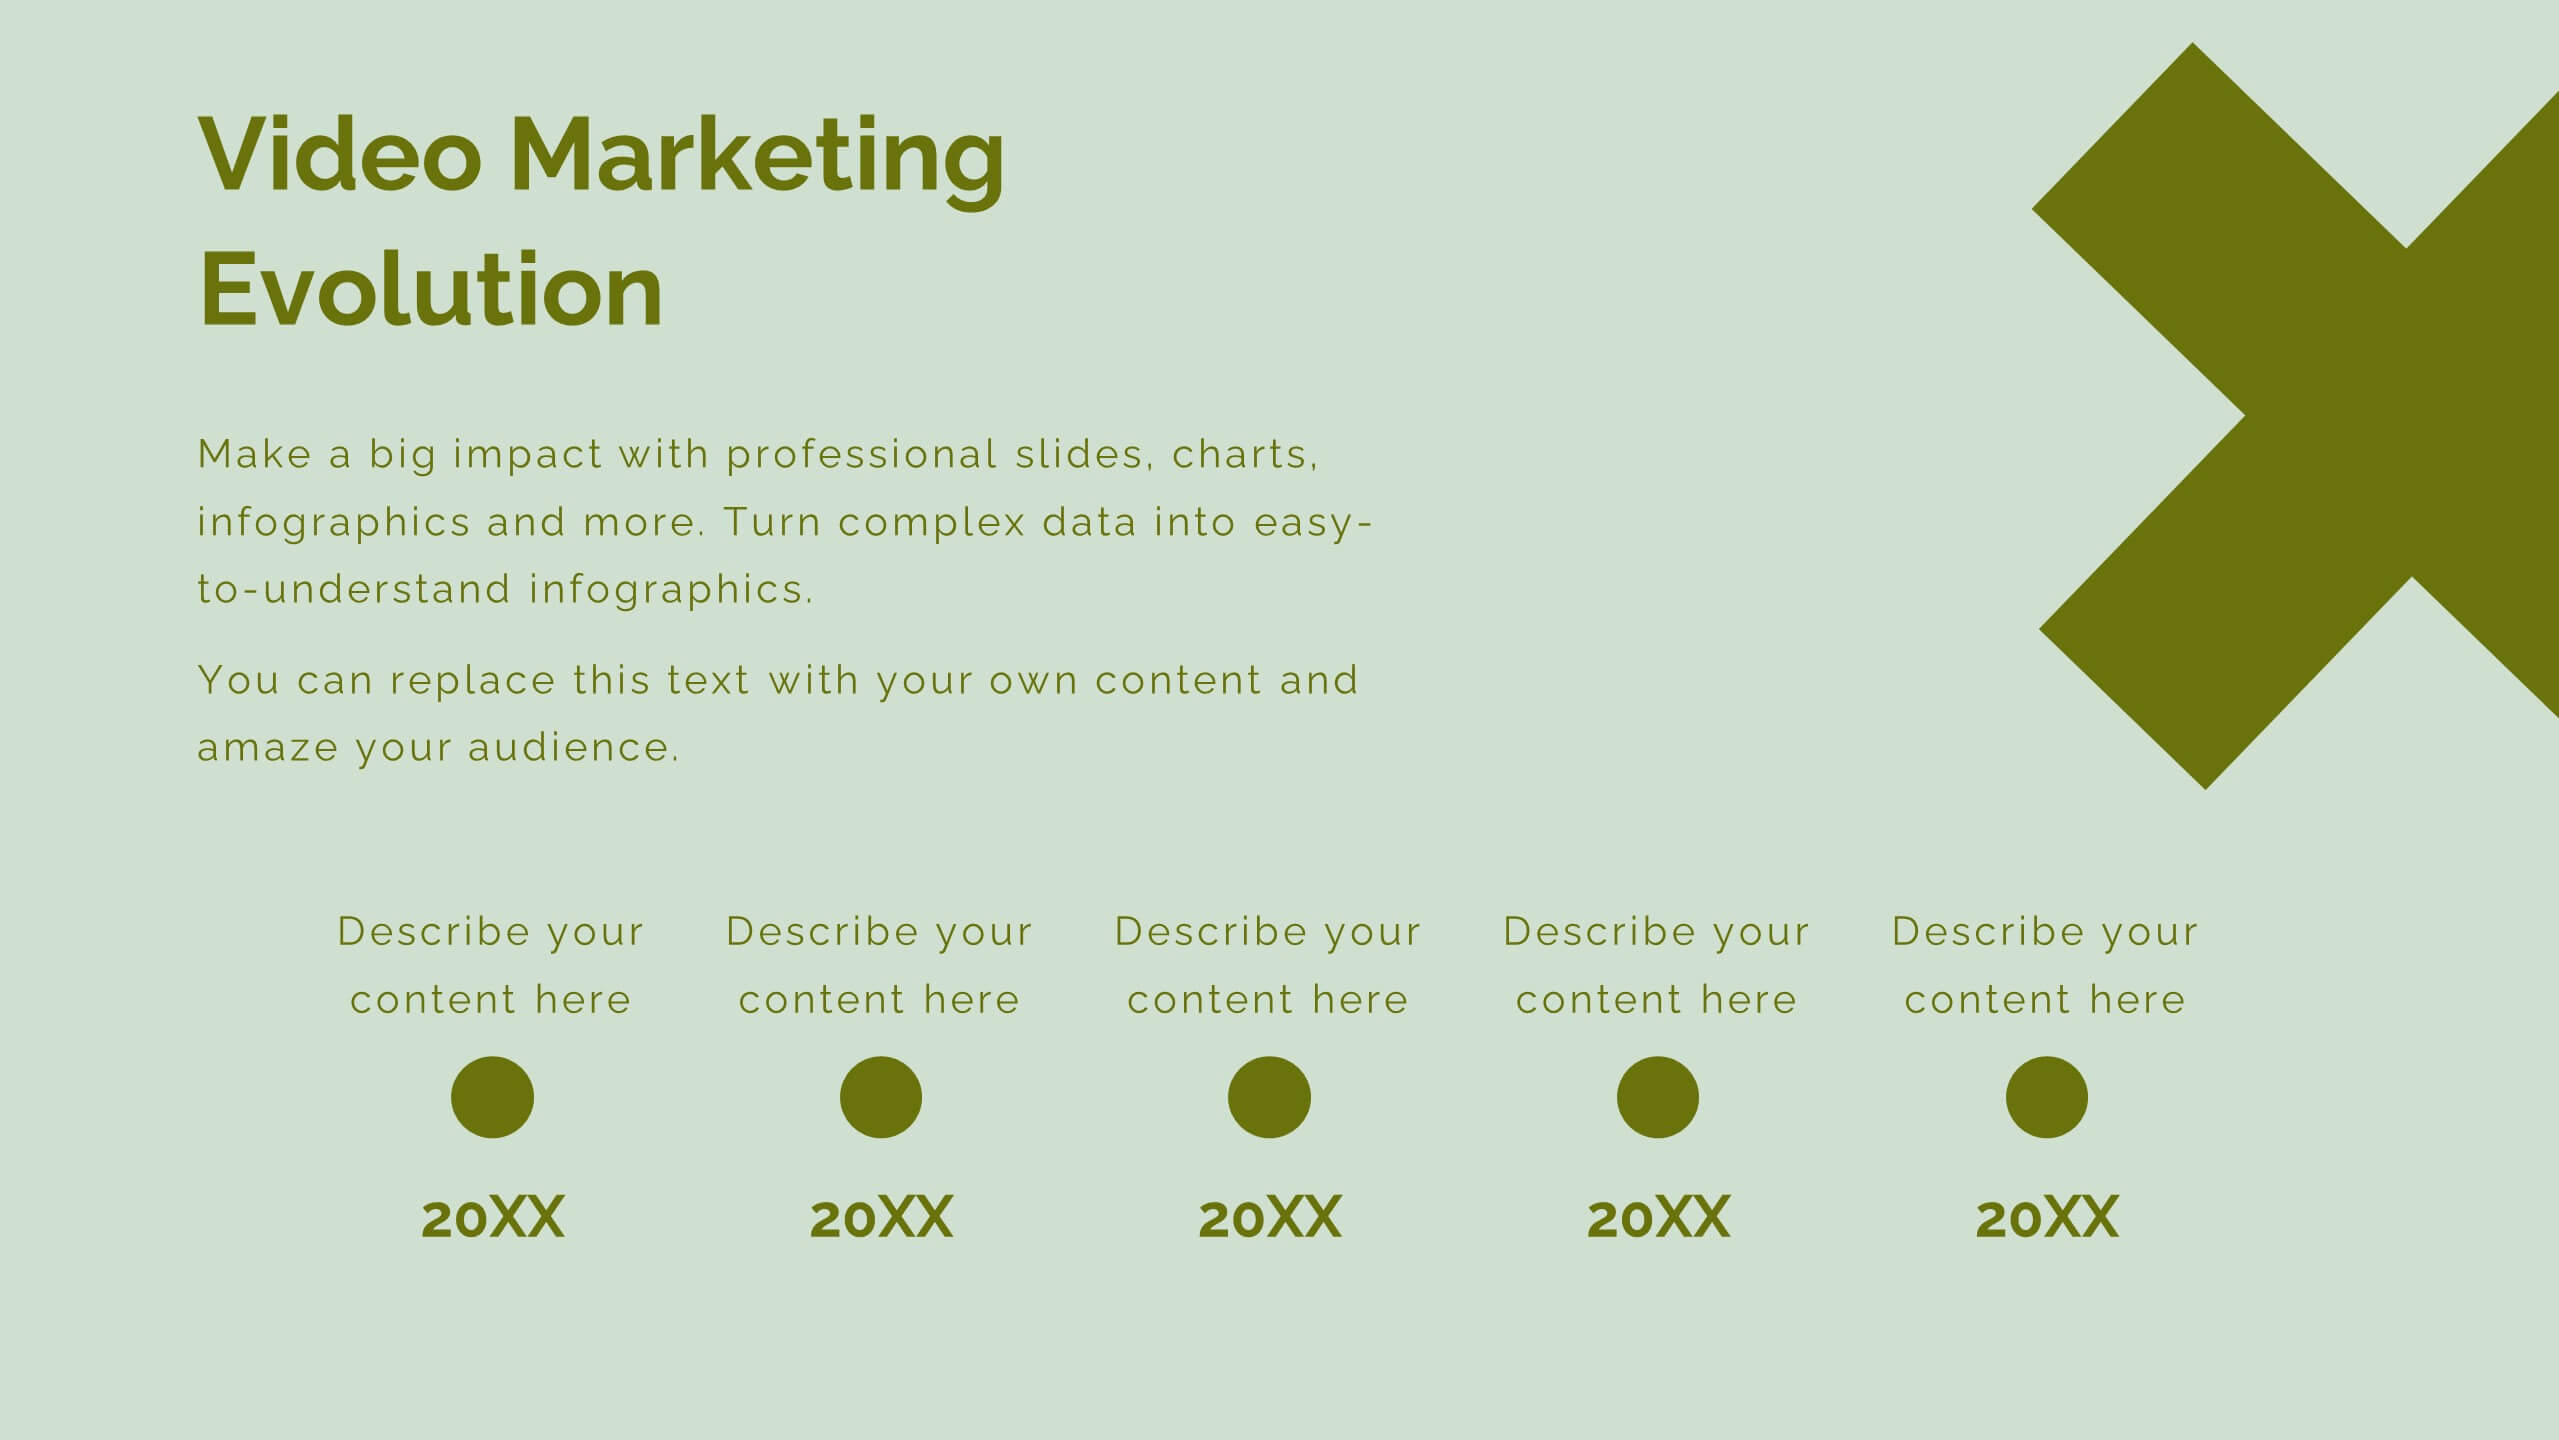
Falcon Digital Marketing Strategy Plan Presentation
Develop a winning marketing strategy with this dynamic template. Dive into current trends, consumer behavior, and innovative techniques. Perfect for social media, influencer marketing, and data-driven campaigns. Fully compatible with PowerPoint, Keynote, and Google Slides.


6 slides
SEO Services Infographic
Search Engine Optimization services are specialized strategies and practices aimed at improving a website's visibility and ranking in search engine results pages. The goal of SEO is to increase organic traffic to a website by optimizing various elements, such as content, keywords, website structure, and more. This template is designed to provide an overview of the different aspects of SEO that the agency specializes in. This Infographic is a valuable tool for SEO agencies to showcase their expertise, services, and track record to potential clients. This template is compatible with Powerpoint, Keynote, and Google Slides.


7 slides
Cryptocurrency Infographic Presentation Template
Cryptocurrency is a form of digital or virtual currency that uses cryptography (the conversion of data into an unreadable format) to secure transactions between two parties. Cryptocurrencies use decentralized control as opposed to centralized electronic money and central banking systems. This template is the perfect presentation for informing on the world of cryptocurrency. The decentralized control of each cryptocurrency works through a blockchain. It is an alternative currency brought on by the emergence of Internet. This template comes with appealing illustrations made for you to customize.


7 slides
Veterinary Hospital Infographic
A veterinary hospital, is a medical facility that provides healthcare services to animals, primarily focusing on the diagnosis, treatment, and prevention of illnesses and injuries in pets and other animals. This vibrant and heartwarming infographic template brings to life the journey of our beloved pets through the lens of a caring veterinary hospital. Compatible with Powerpoint, Keynote, and Google Slides. This template celebrates the love, care, and healing that happens every day at veterinary hospitals. This infographic is a haven where wagging tails and purring hearts find comfort and a reason to smile.


12 slides
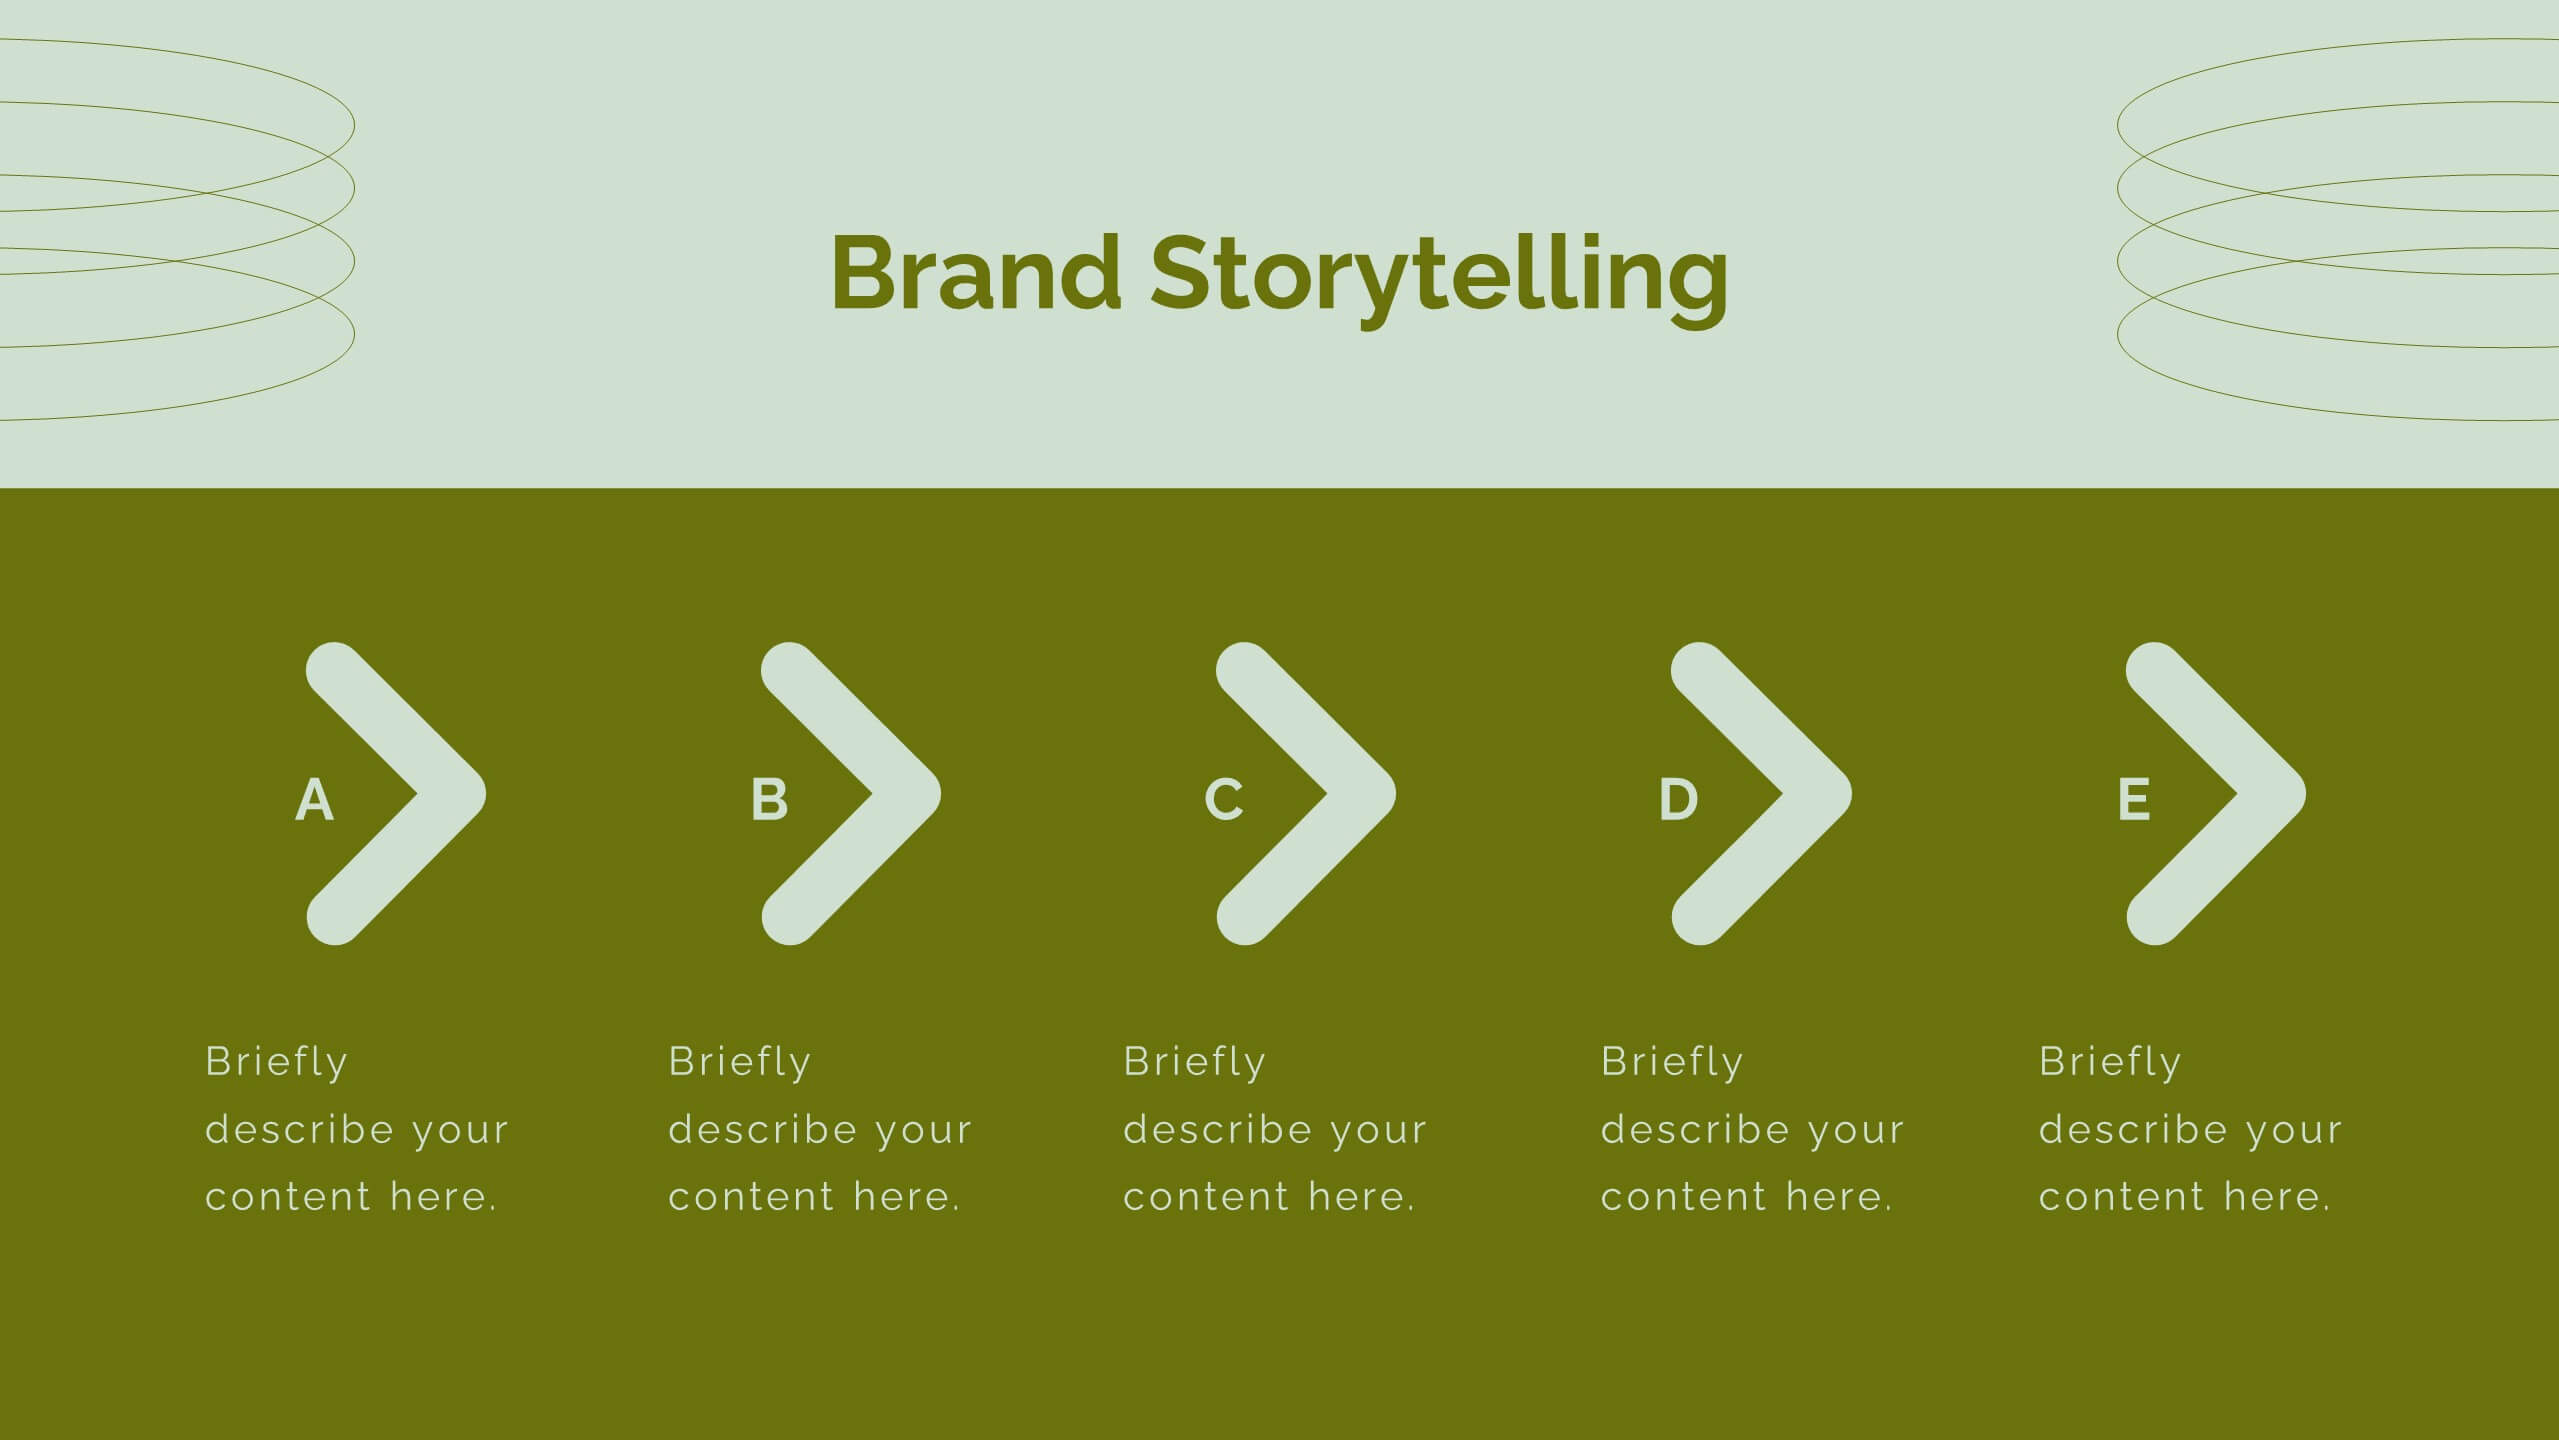
User Experience Journey Presentation
The "User Experience Journey Presentation" template offers a comprehensive visualization of the stages involved in user interaction with a product or service. This infographic template maps out each phase of the user experience journey, depicted in a sequence of steps marked from A to F, each stage highlighted with unique icons and a gradient color scheme enhancing visual appeal and understanding. Suitable for UX professionals, marketers, and product developers, this template aids in illustrating the process from initial contact to post-use evaluation, emphasizing key points at each stage. It is an invaluable tool for presentations aimed at enhancing customer satisfaction and optimizing user interaction strategies.


12 slides
Startup Investor Pitch Deck Presentation
Craft a compelling pitch with this Startup Investor Pitch Deck template. Featuring a structured layout, it helps showcase your startup’s vision, market potential, and financial projections. Designed for clarity and engagement, this template ensures a persuasive investor presentation. Fully compatible with PowerPoint, Keynote, and Google Slides for seamless customization.


20 slides
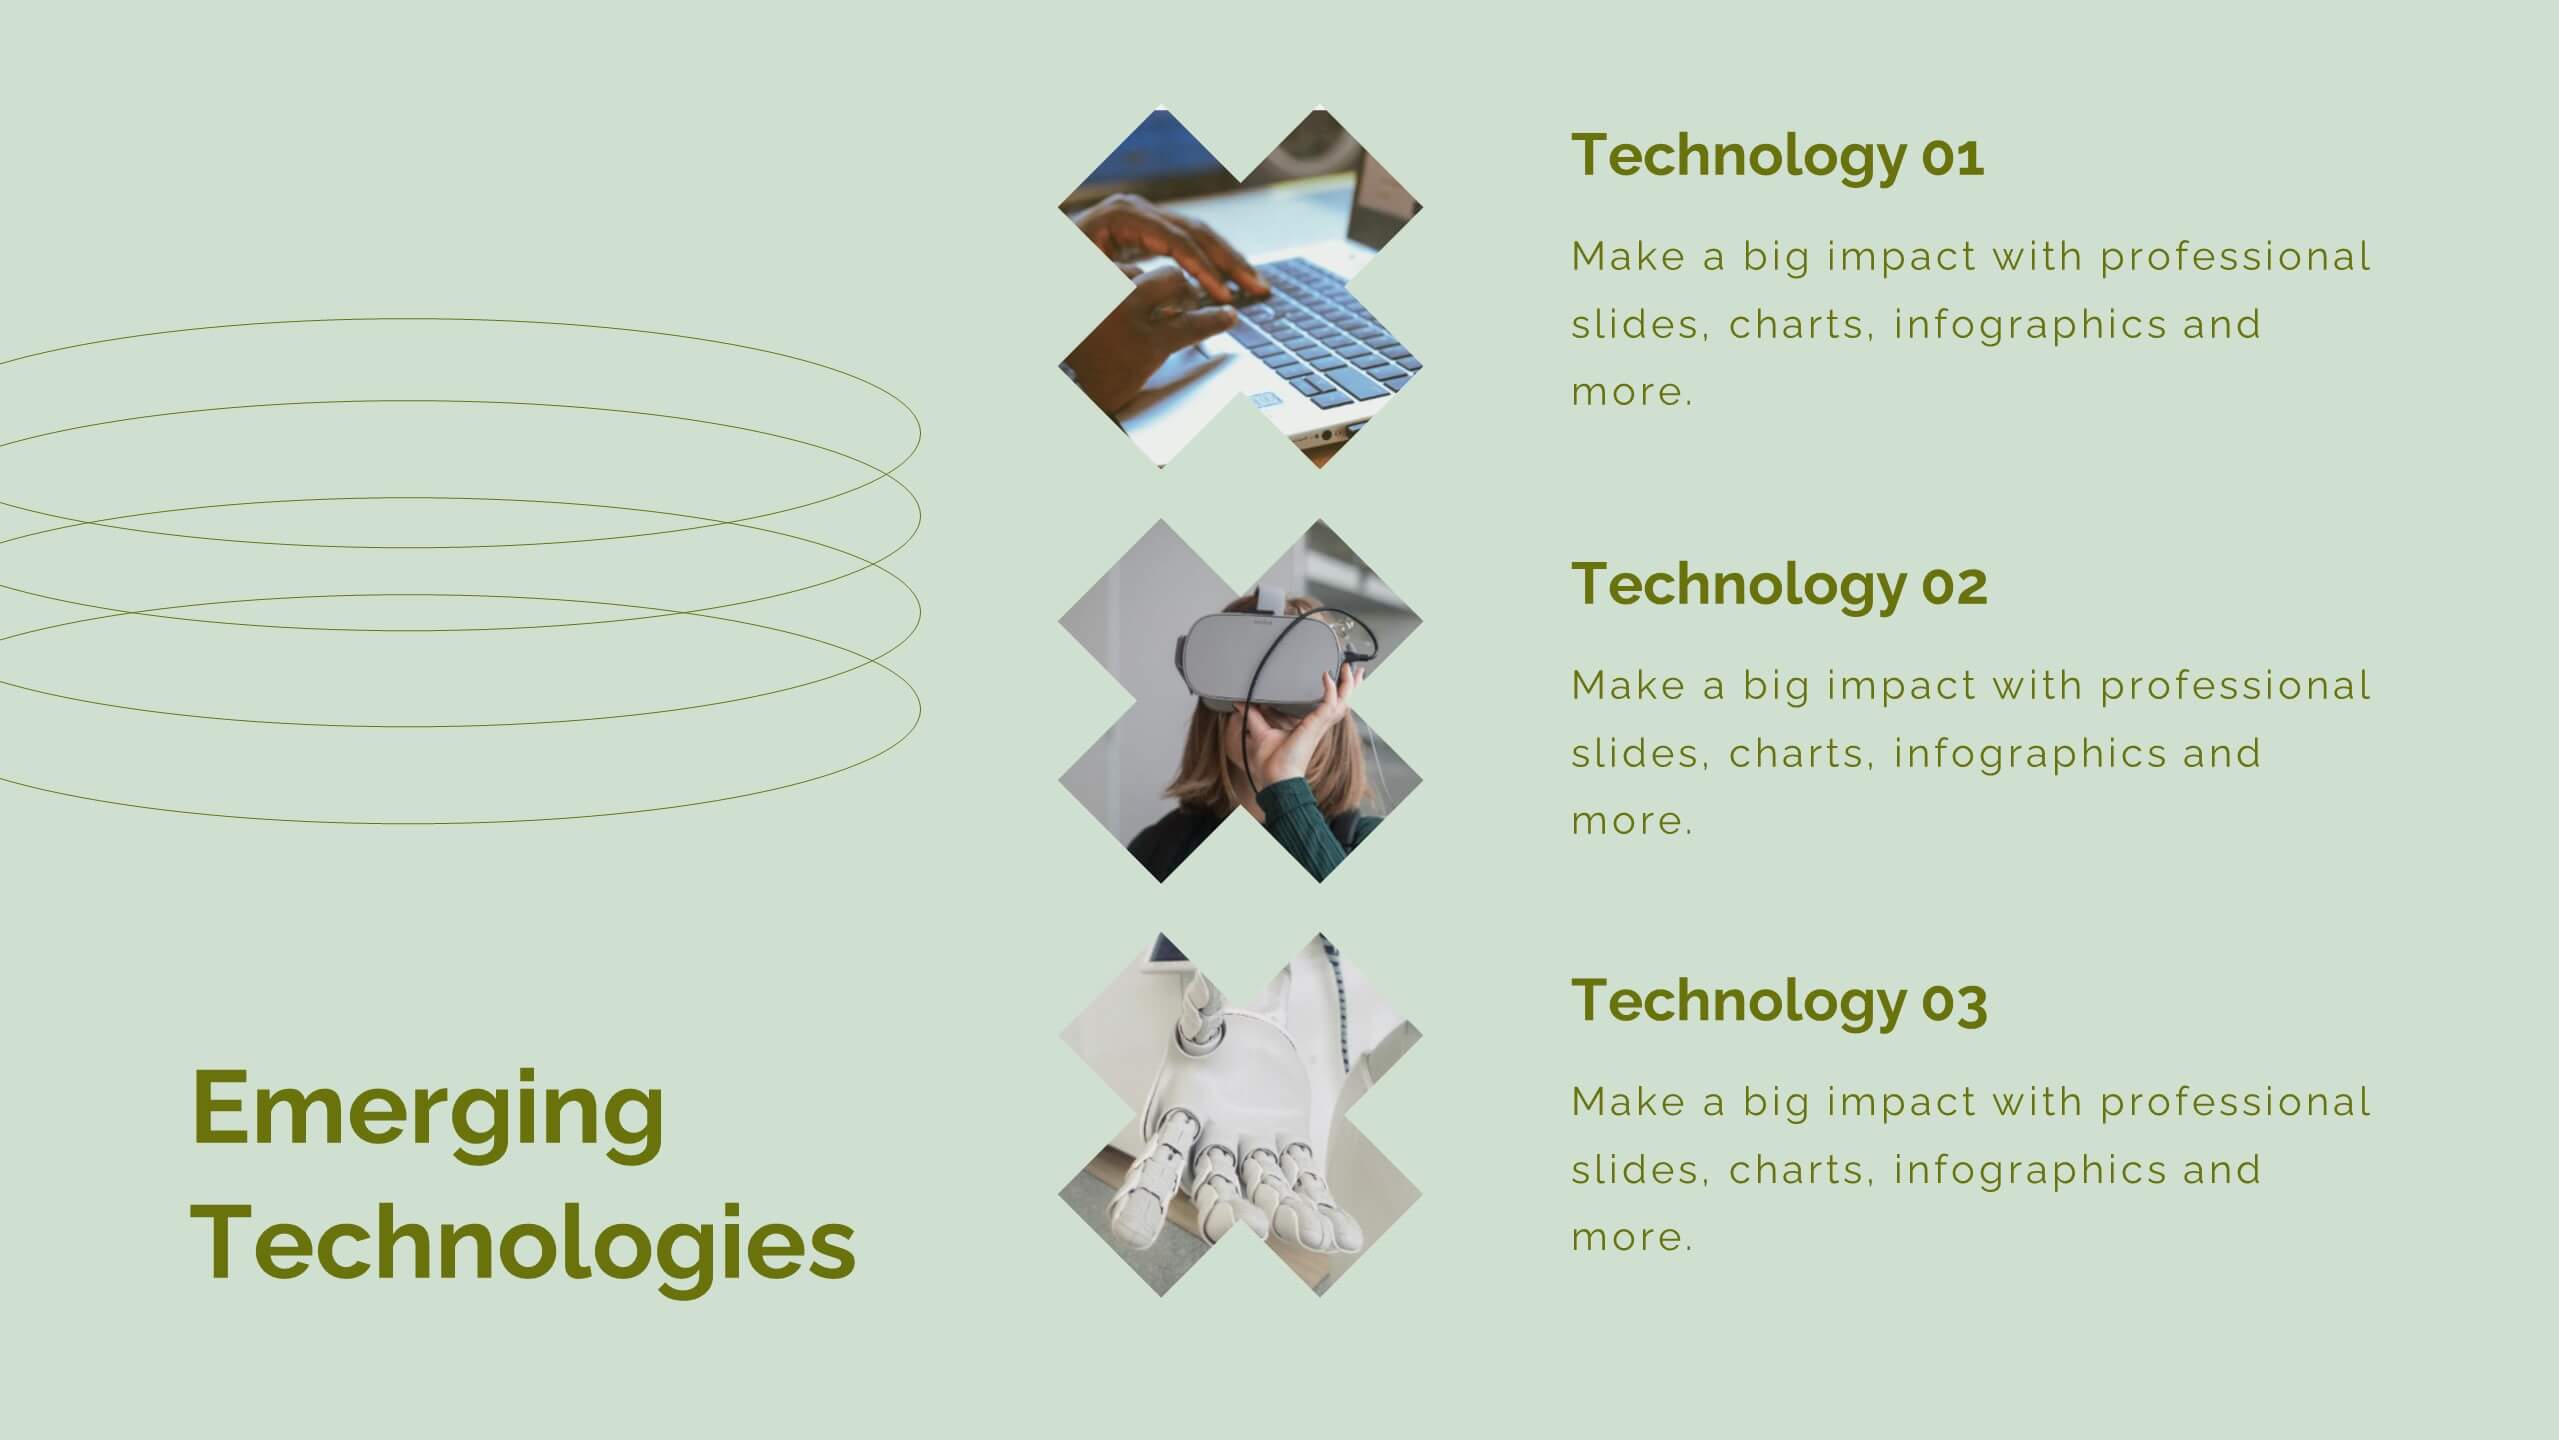
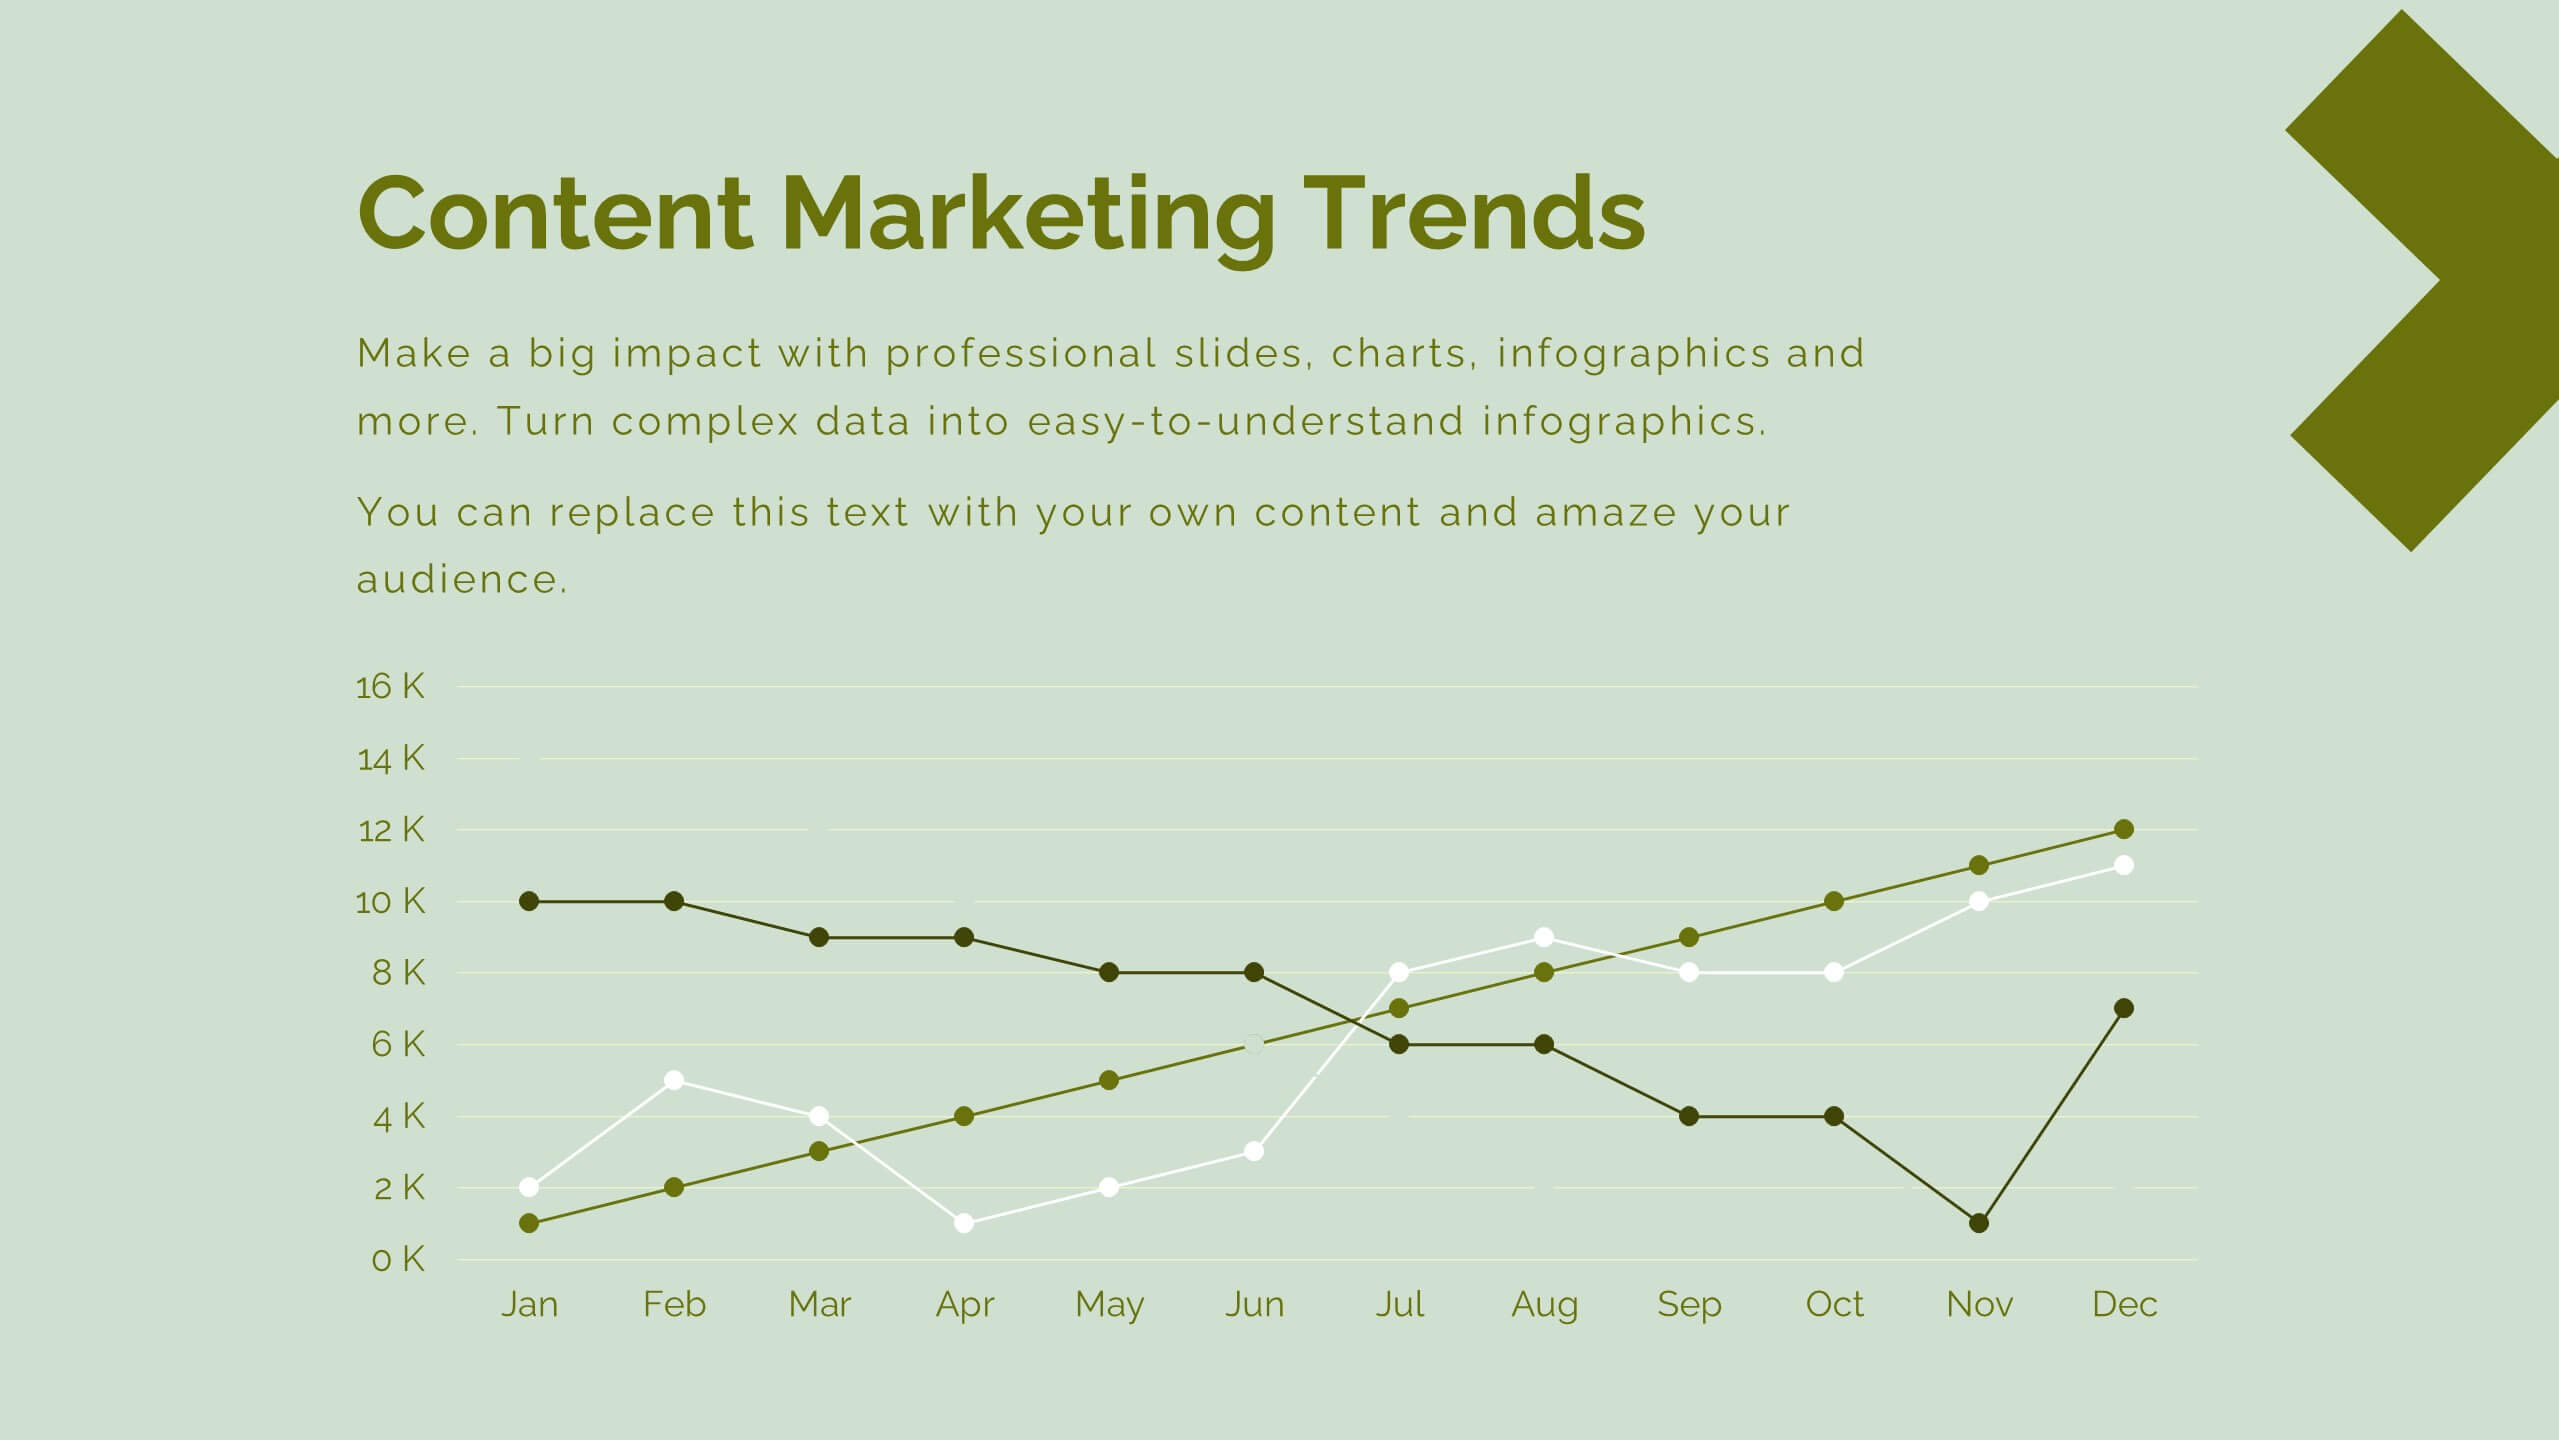
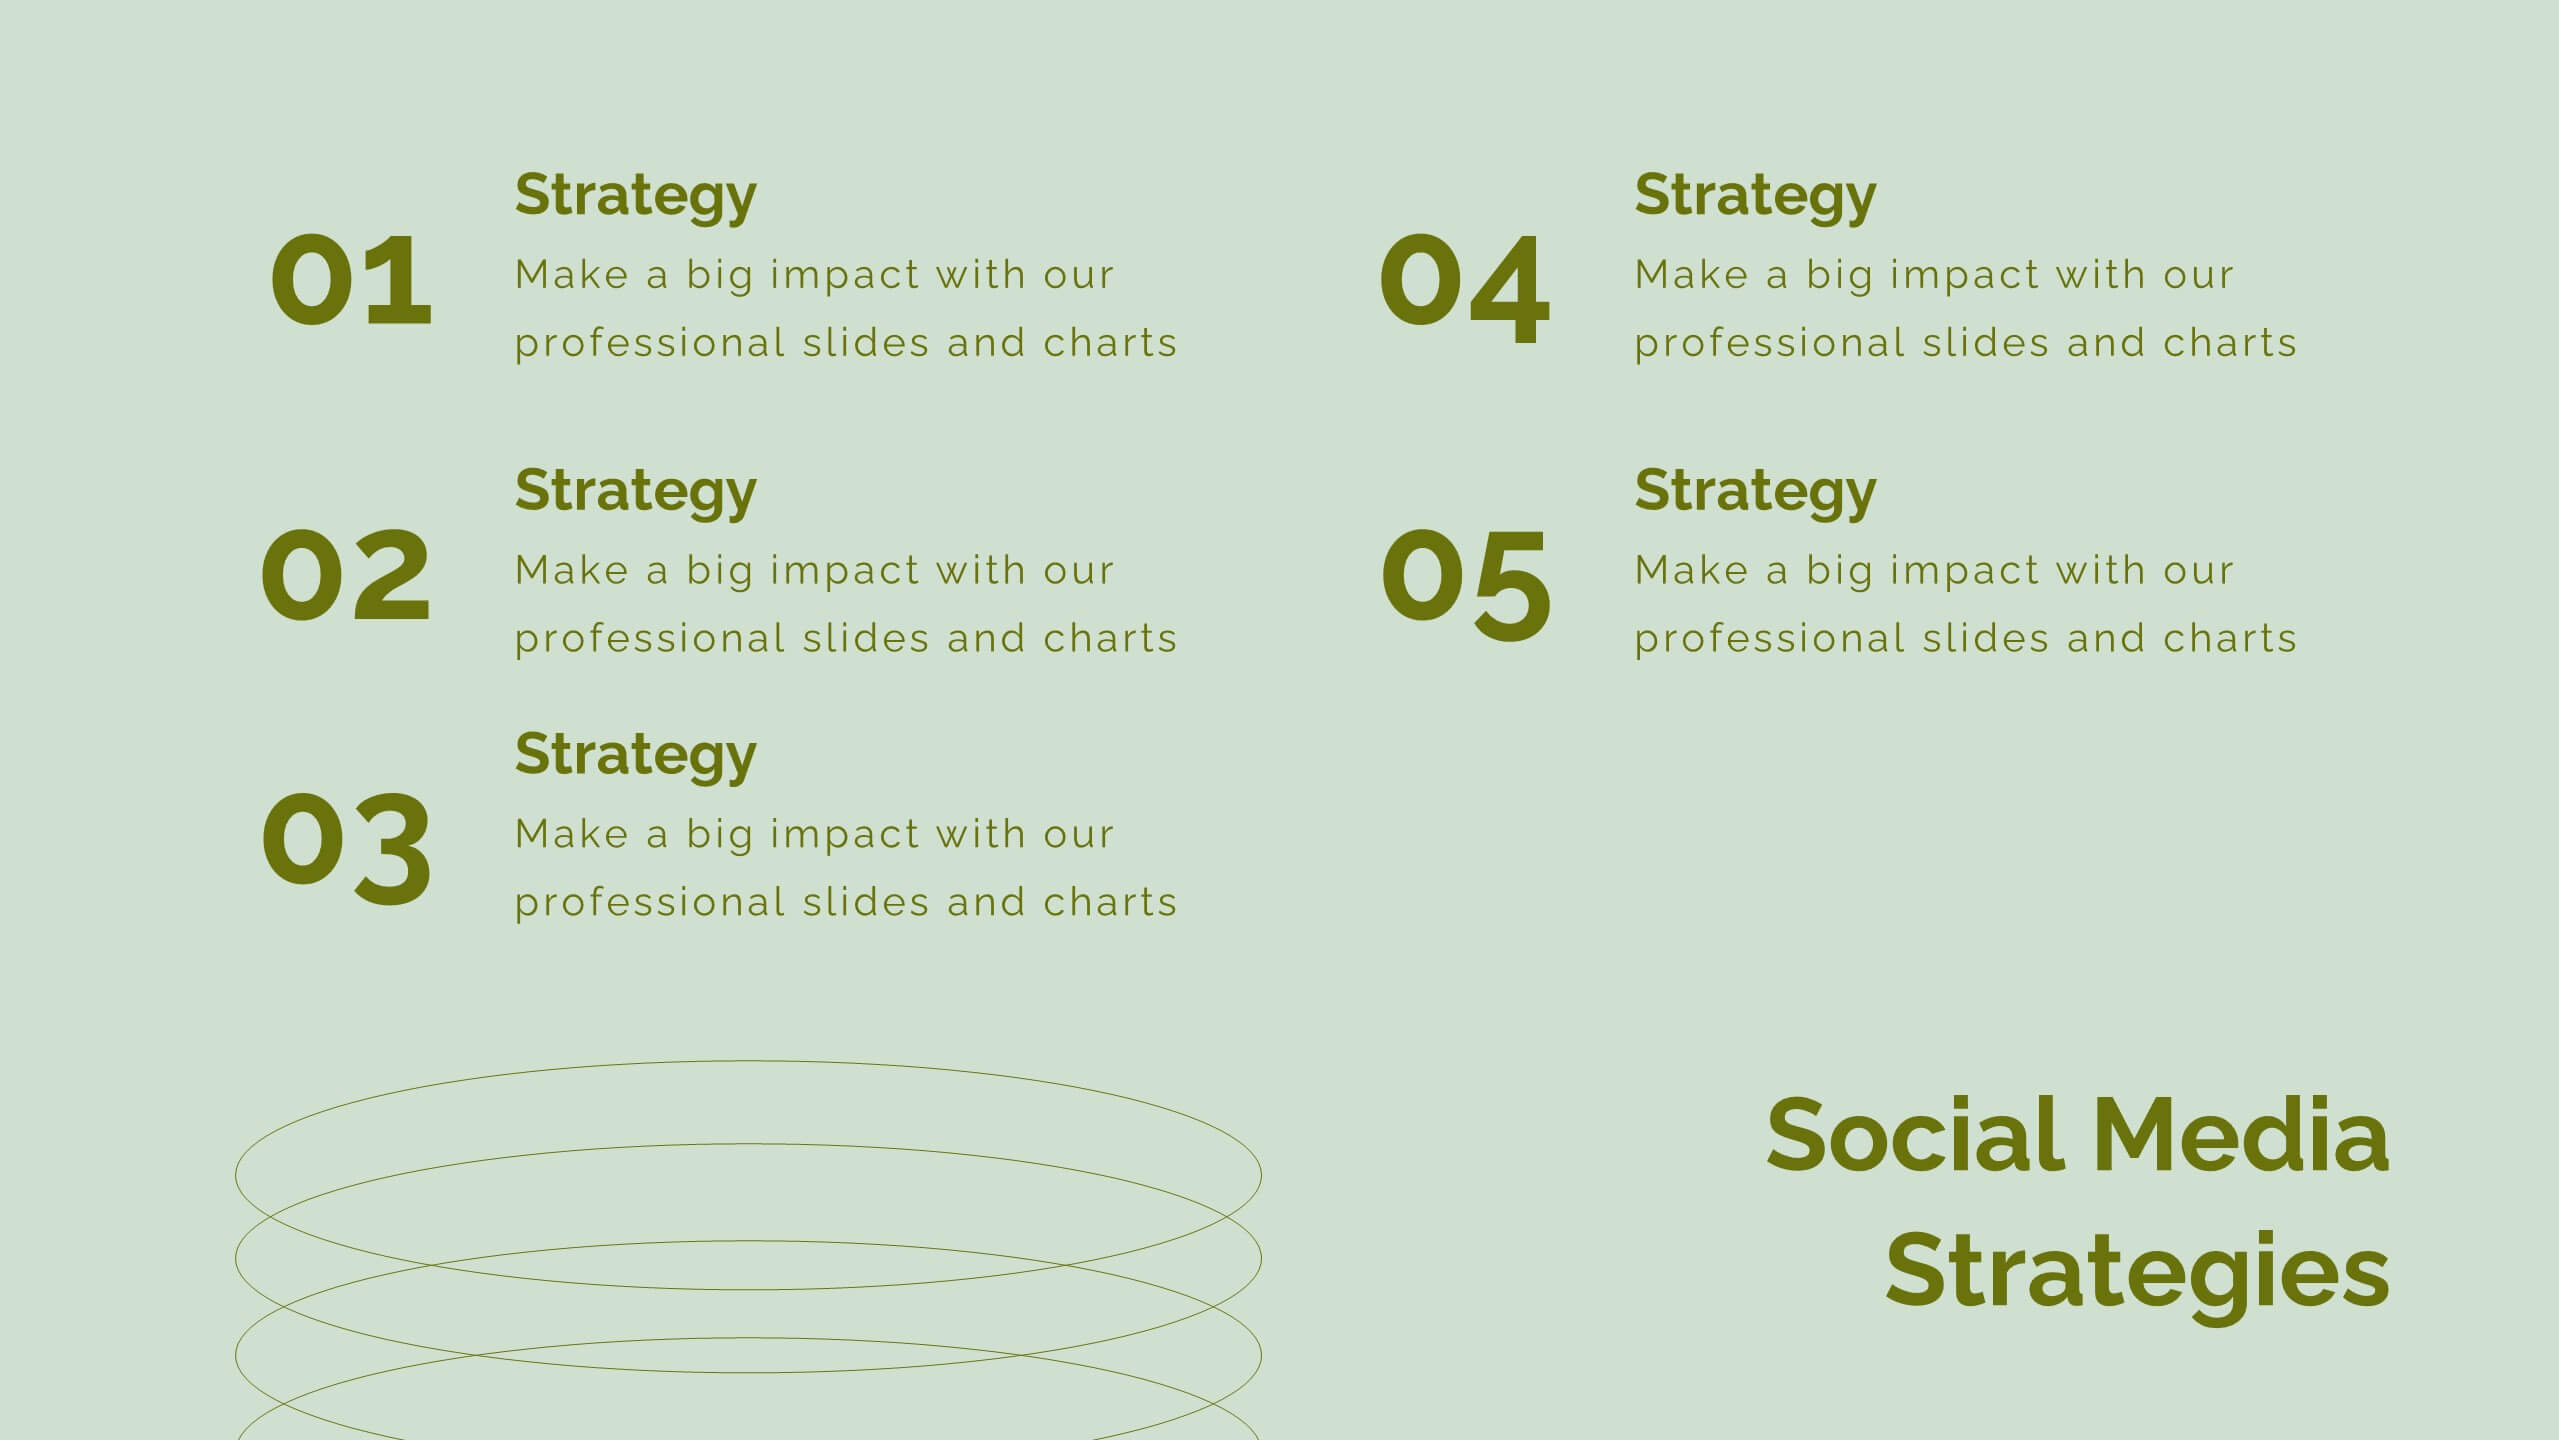
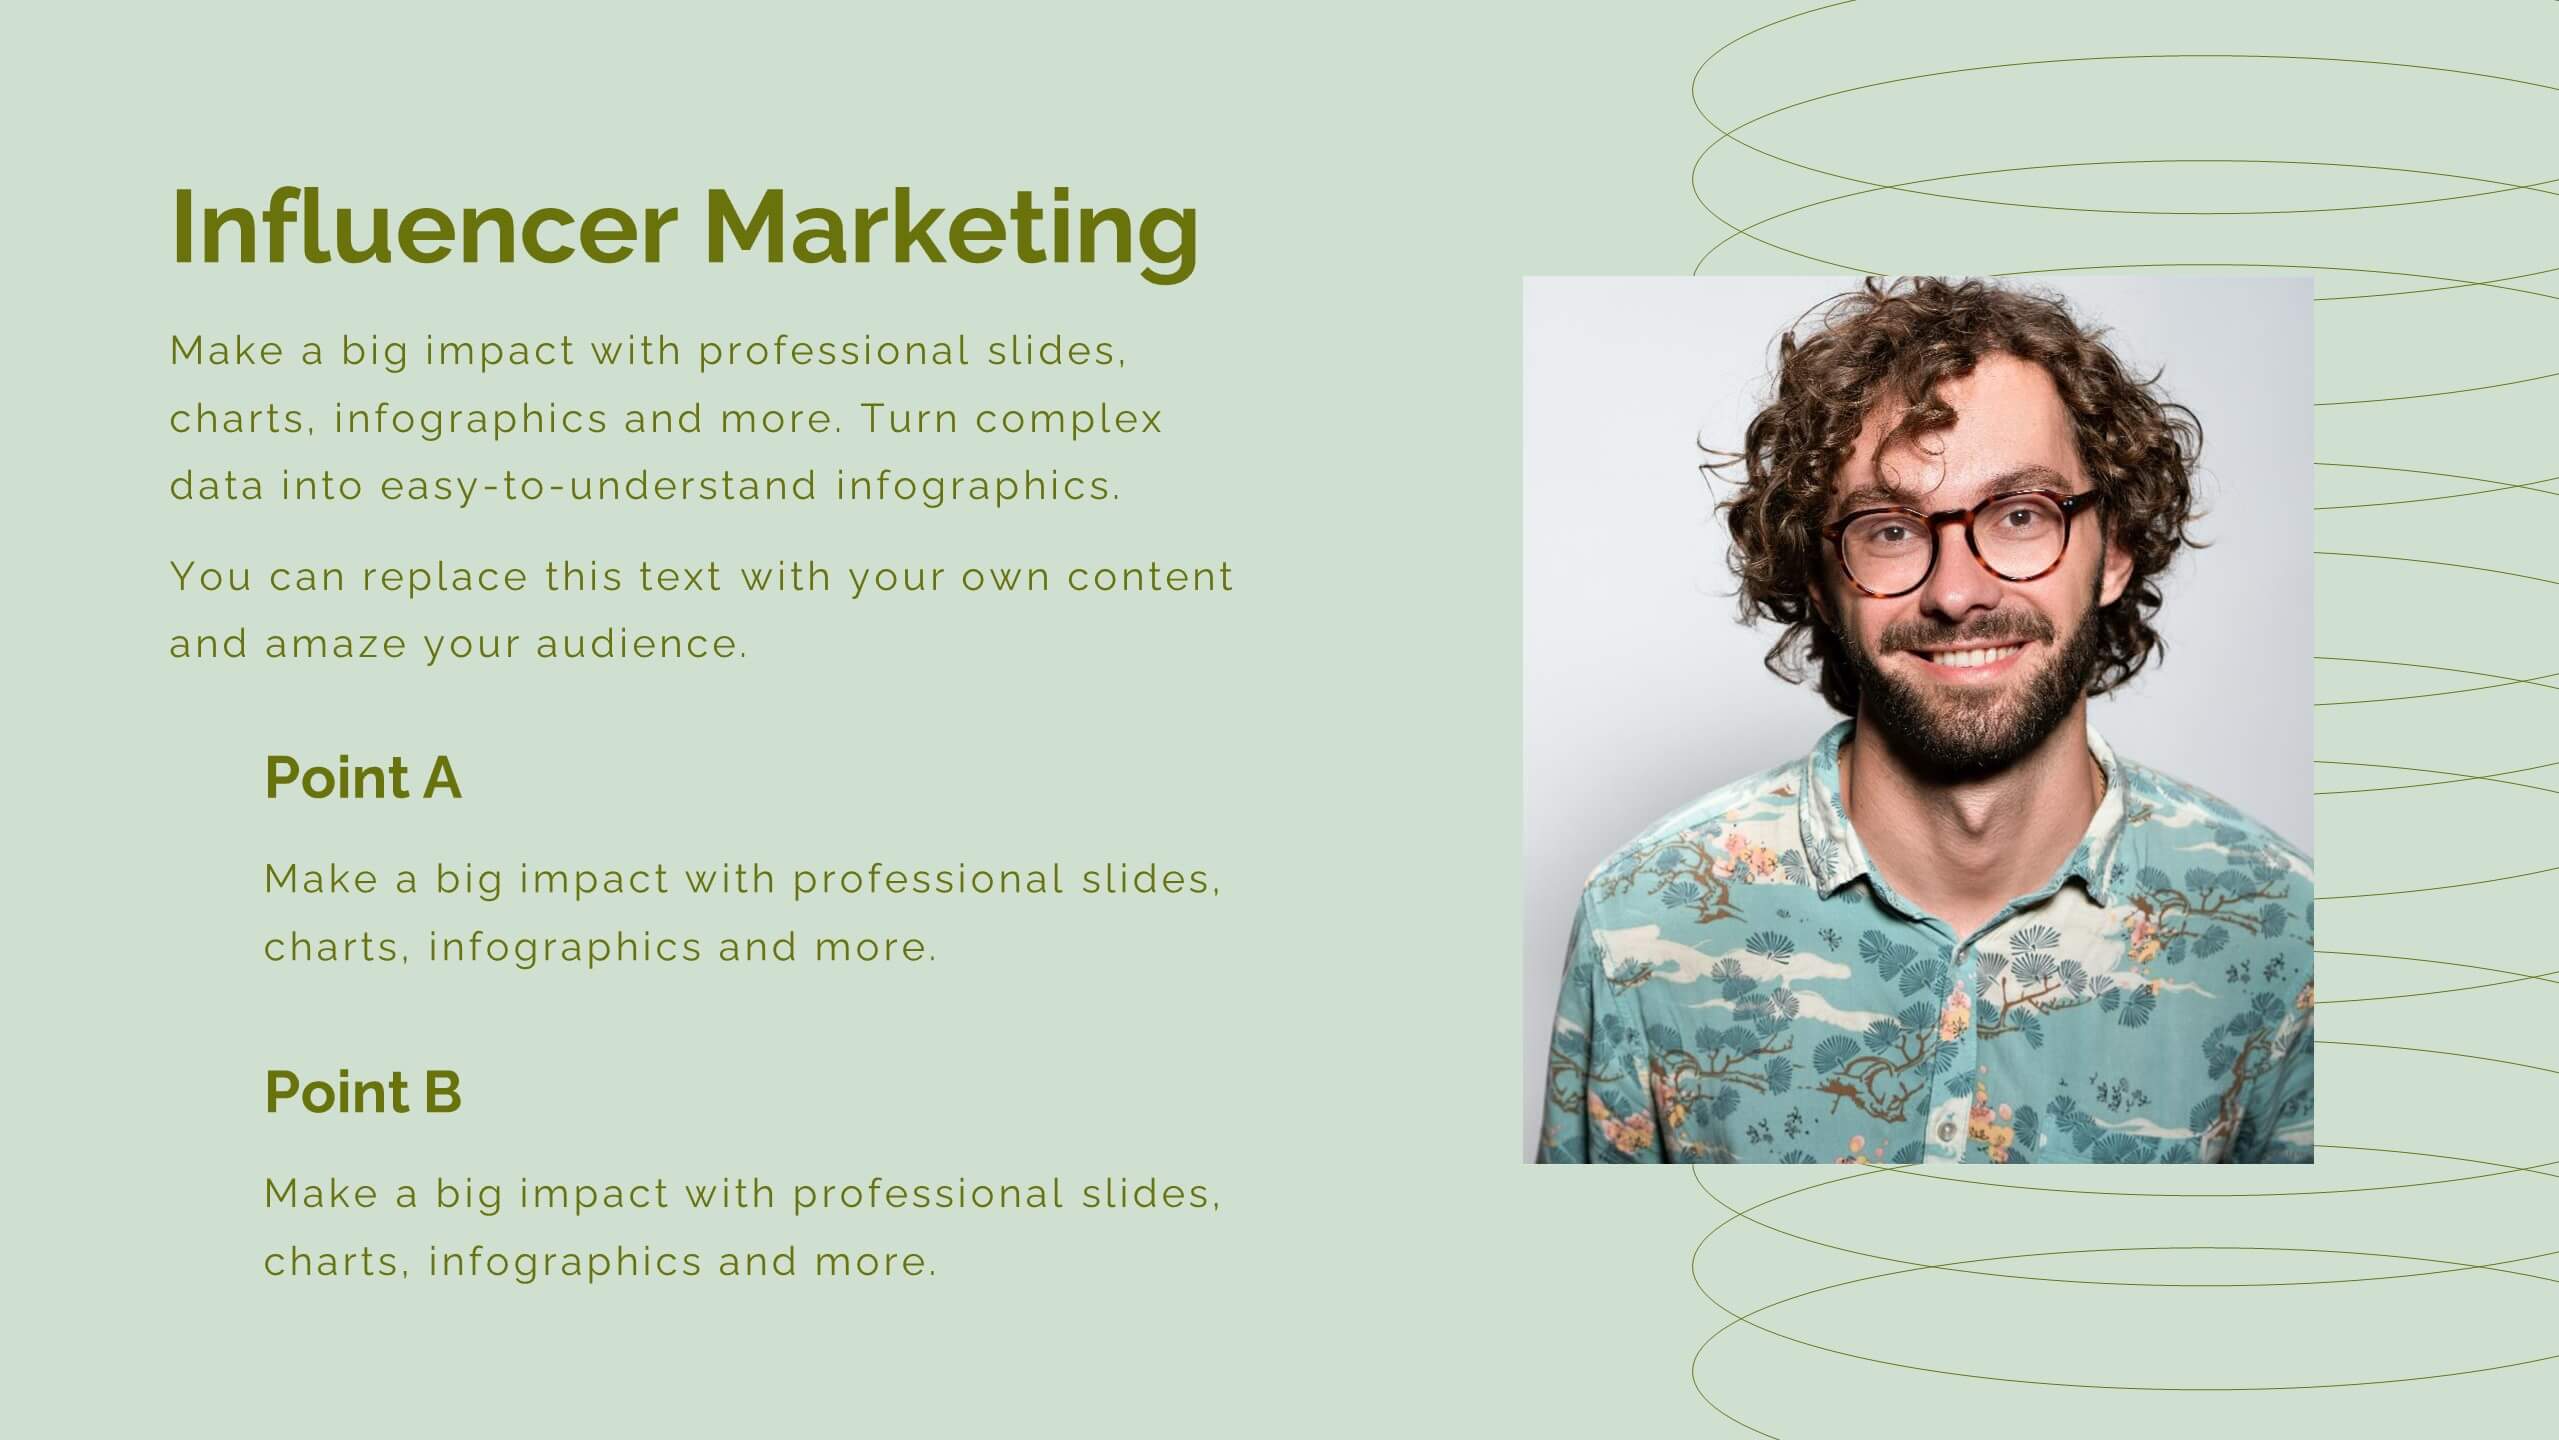
Aura Digital Marketing Strategy Plan Presentation
Revamp your digital marketing strategies with this dynamic template! Covering everything from industry overviews and consumer behavior analysis to emerging technologies and social media strategies, this template has it all. Perfect for creating compelling presentations that highlight data-driven marketing and brand storytelling. Compatible with PowerPoint, Keynote, and Google Slides.


12 slides
Compliance and Policy Management Presentation
Visualize your compliance ecosystem with the Compliance and Policy Management Presentation. Designed around a planetary orbit concept, this slide maps core policies at the center with surrounding regulations and enforcement layers. Each orbit can represent levels of governance, department roles, or regulatory zones—making it ideal for risk teams, auditors, and legal advisors. Fully customizable in PowerPoint, Keynote, and Google Slides for seamless use.


5 slides
Scientific Research Data Presentation
Bring your research to life with a clean, dynamic layout designed to simplify complex findings and highlight key scientific insights. This presentation offers a structured flow for showcasing data, experiments, or results in a clear and engaging way. Fully compatible with PowerPoint, Keynote, and Google Slides.


6 slides
Workforce Skills Gap Assessment Presentation
Identify, visualize, and address talent gaps with the Workforce Skills Gap Assessment Presentation. This template helps you clearly communicate current capabilities versus future needs across departments or teams. Perfect for HR leaders, L&D strategists, and organizational planners. Fully customizable in PowerPoint, Keynote, Canva, and Google Slides.