


Features
- 6 Unique slides
- Fully editable and easy to edit in Microsoft Powerpoint, Keynote and Google Slides
- 16:9 widescreen layout
- Clean and professional designs
- Export to JPG, PDF or send by email


Do you have any questions?
Recommend


6 slides
Branching Structure Tree Chart Presentation
Visualize ideas, processes, or team structures with the Branching Structure Tree Chart Presentation. This elegant tree diagram layout allows you to display six key points or stages branching out naturally from a central concept. Ideal for organizational charts, decision flows, or brainstorming visuals. Fully editable in PowerPoint, Keynote, and Google Slides.


20 slides
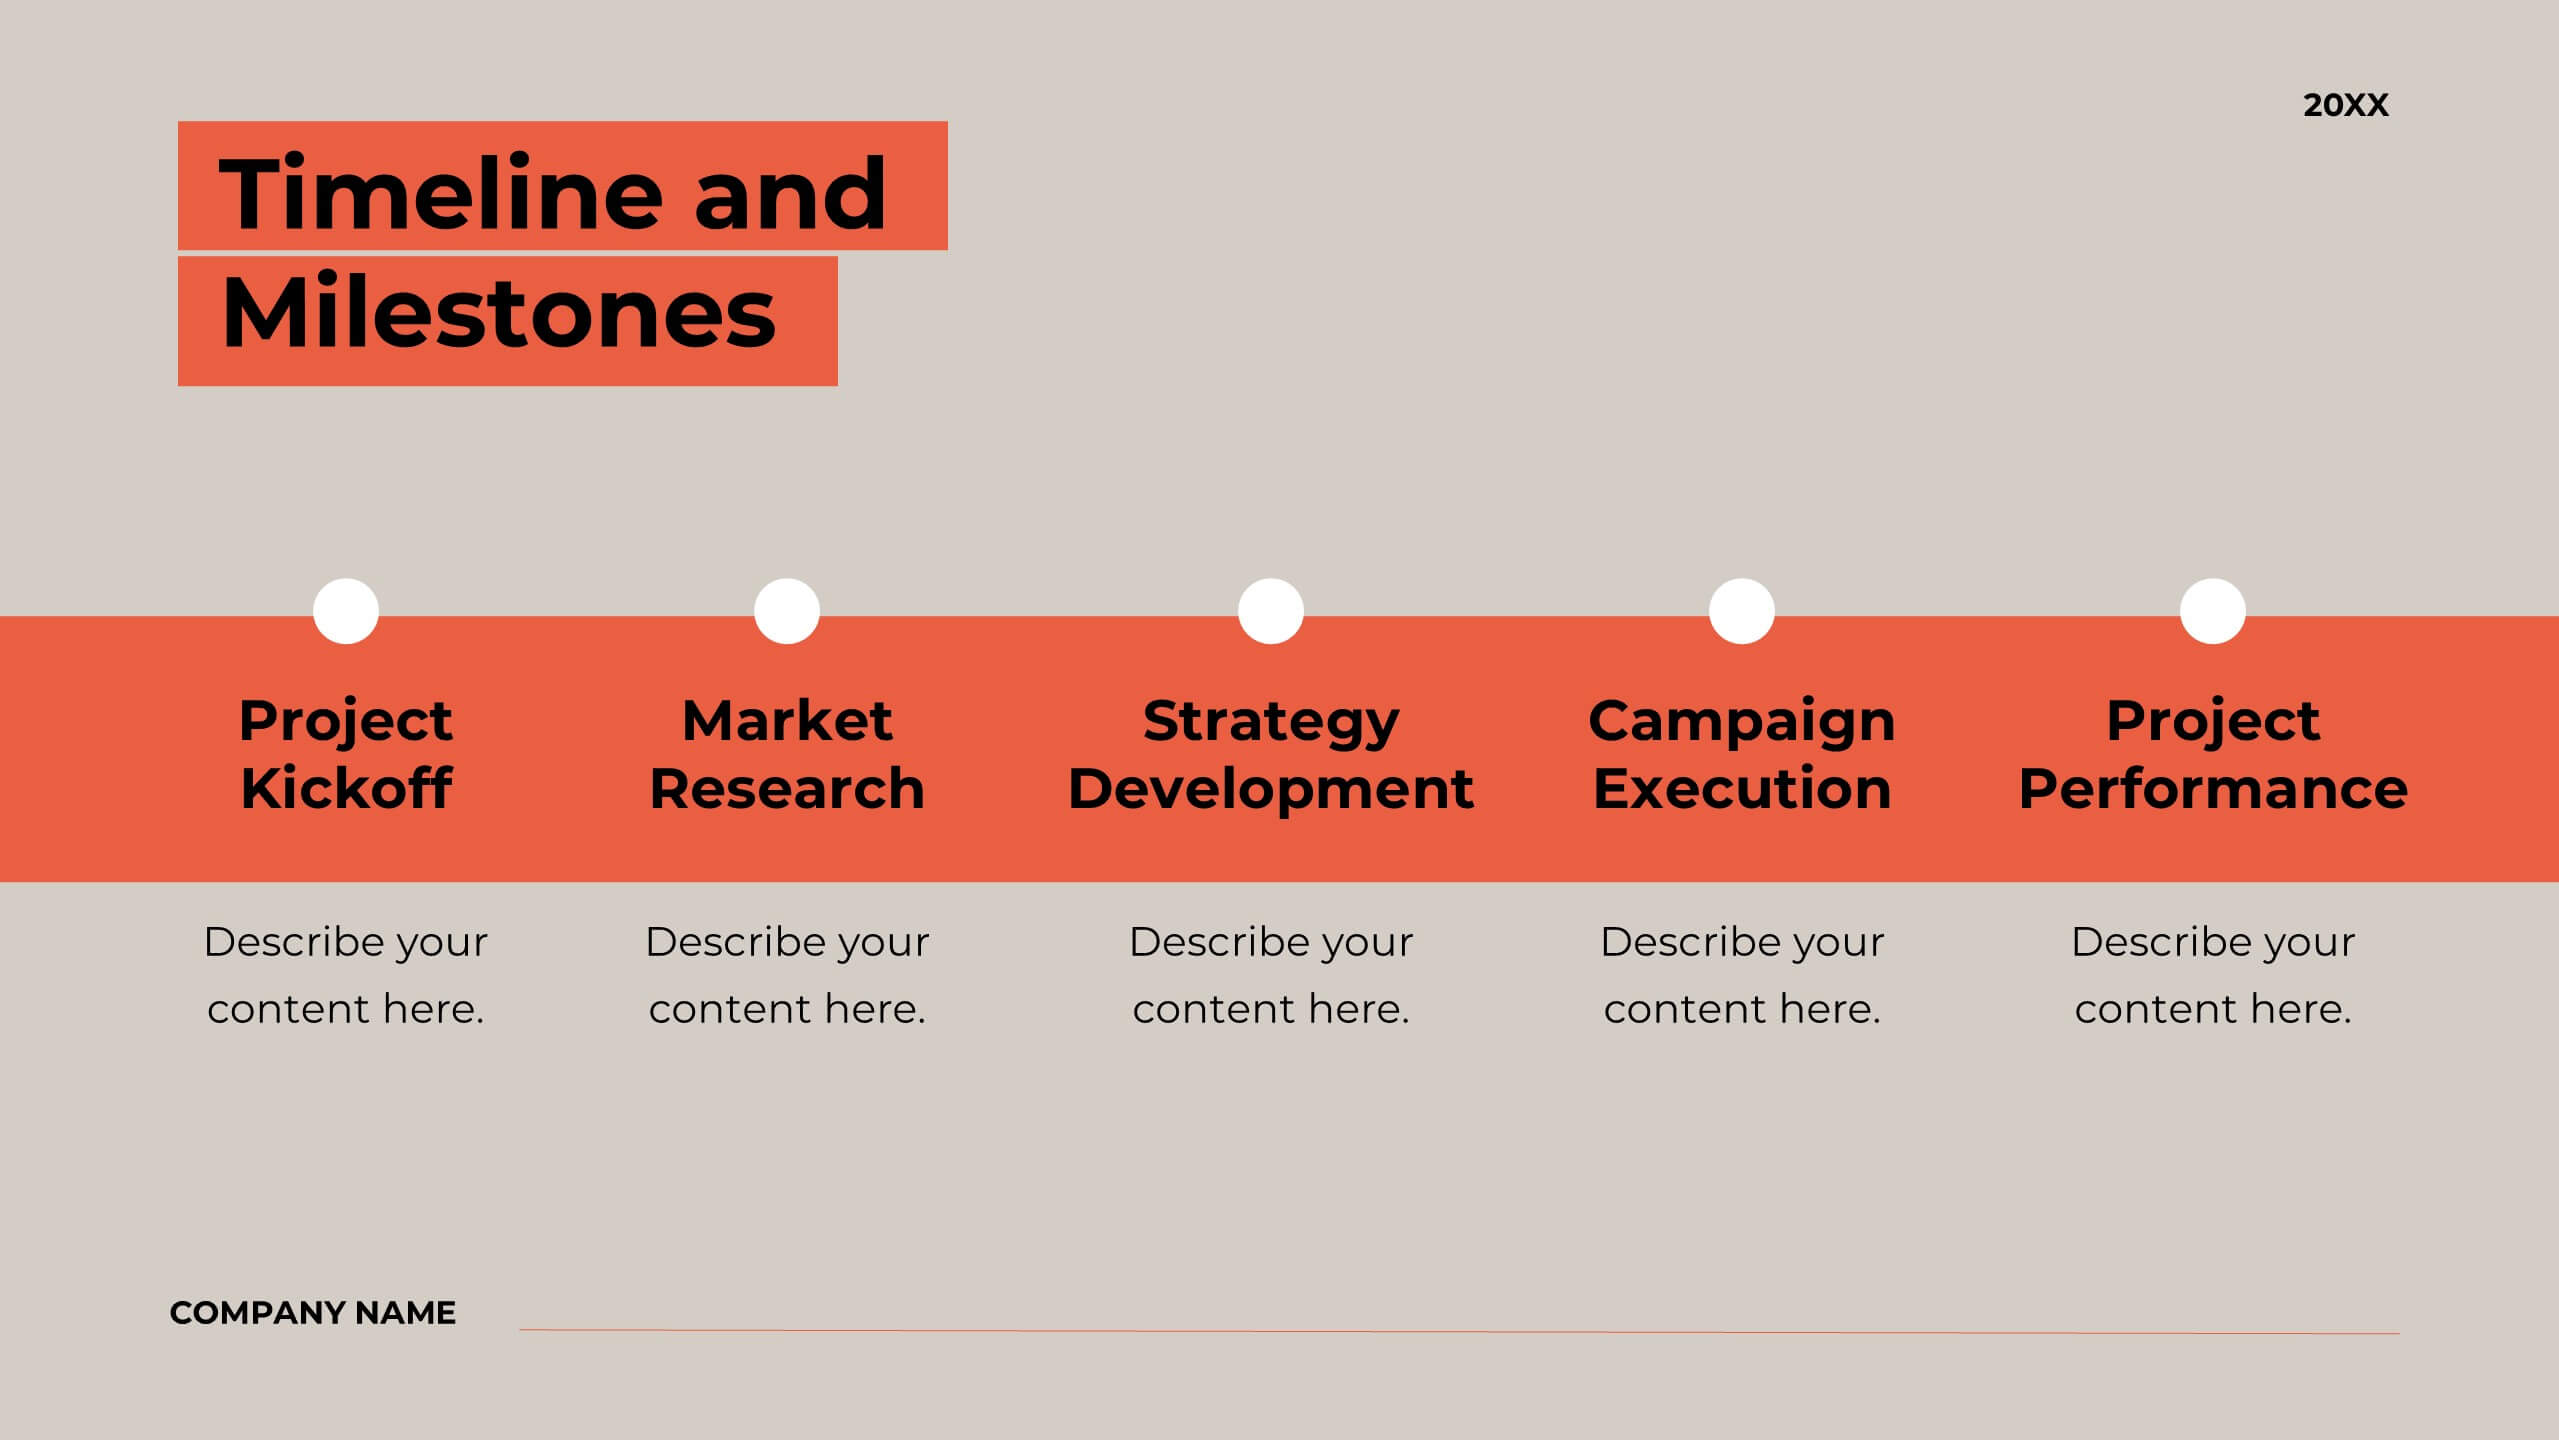
Bentom Marketing Proposal Presentation
This marketing proposal template is crafted to communicate your strategy with impact. With sections covering company overview, project summary, objectives, methodology, budget breakdown, and deliverables, it provides a professional layout for presenting key details to clients. Tailor it to fit your needs, and present confidently using PowerPoint, Keynote, or Google Slides.


5 slides
Business Objectives and Strategic Goals Presentation
Clarify your roadmap to success with this visually structured Business Objectives and Strategic Goals slide. Featuring five segmented goal icons arranged in a semi-circle layout, this template is perfect for strategic planning, quarterly reports, and team briefings. Each section allows space to detail your specific objectives with matching visuals for easy comprehension. Fully editable in PowerPoint, Keynote, and Google Slides.


5 slides
Financial Budget Infographics
Financial goals refer to specific objectives and targets that individuals or businesses set to manage their finances effectively and achieve financial success. These vertical infographics are designed to help individuals and businesses effectively present their financial budgets and plans. Whether you're a financial analyst or a business owner, this template is perfect for conveying complex financial information in a clear and concise manner. These infographics provide an overview of the budget, showcasing key financial goals, total income, and total expenses. This features visuals to help users set and track financial goals.


7 slides
Fishbone Stitch Infographic
Thread together insights with our fishbone stitch infographic. Set on a crisp white canvas, accented with the depth of purple, the intensity of red, and the freshness of green, this template elegantly showcases the intricate details of the fishbone stitch technique. Accentuated with intuitive infographics, emblematic icons, and specific image placeholders, it provides a detailed walk-through of this unique stitching method. Perfectly tailored for Powerpoint, Keynote, or Google Slides. A must-have for fashion designers, textile students, craft enthusiasts, or anyone with a passion for intricate stitchwork.


4 slides
Value Creation Strategy Presentation
Develop impactful strategies with this Value Creation Strategy template. Designed to visualize key business components, it presents a structured approach to innovation, growth, and market positioning. Ideal for corporate planning and investor presentations, this template is fully compatible with PowerPoint, Keynote, and Google Slides for effortless customization.


5 slides
Social Media Analytics and Metrics Presentation
Track performance across platforms with this sleek analytics dashboard. Visualize paid vs. organic reach, audience engagement, and conversion data in one view. Ideal for reporting social insights to clients or teams. Compatible with PowerPoint, Keynote, and Google Slides—fully editable to fit any social media strategy, campaign review, or content report.


6 slides
Mission Goals Infographic
These professionally designed slide templates are tailored to help you articulate your organization's mission goals with clarity and impact. Each slide is structured to emphasize the strategic objectives that guide your operations, making them ideal for communicating with stakeholders, teams, and external partners. Featuring a variety of layouts that include real-life imagery and concise text areas, these templates not only convey your goals but also illustrate the values that underpin your mission. They are perfect for enhancing corporate presentations, annual meetings, or internal strategy discussions, providing a visual and textual guide to what drives your organization forward. Customizable for various communication needs, these templates can be adapted to highlight specific mission goals or to align with different thematic elements of your presentations. They are an essential tool for organizations aiming to foster a unified understanding of their mission and to inspire alignment and action among all stakeholders.


4 slides
Cyber Threat Prevention Strategies Presentation
Clearly communicate your cybersecurity roadmap using this sleek timeline-style slide design. Each step is represented by a distinct icon and color-coded milestone, ideal for outlining protocols such as threat detection, employee training, or system hardening. Designed for IT teams, security analysts, and corporate risk departments. Fully editable and compatible with PowerPoint, Keynote, and Google Slides.


6 slides
Business Model Canvas Proposition Infographic
The Business Model Canvas is a strategic management tool that provides a visual framework for describing, analyzing, and developing a business model. This infographic template visually represents the key components of a business model using the Business Model Canvas framework. This framework provides an overview of how a business creates, delivers, and captures value. This template is designed to be a comprehensive way to map out all the key components of a business model. This infographic is a versatile tool perfect for startups, established companies, and entrepreneurs to visualize, communicate, and iterate on their business models.


5 slides
Strategic Framework Slide Presentation
Turn your strategy into a story that flows with clarity and precision using this clean, timeline-based presentation design. Ideal for illustrating project phases, corporate planning, or growth roadmaps, it keeps information structured and engaging. Fully editable and compatible with PowerPoint, Keynote, and Google Slides for seamless customization.


26 slides
Transportation and Logistics Company Profile Presentation
Delve into the fast-paced realm of Transportation and Logistics, the backbone of global commerce. Our vibrant template captures this essence with a lively mix of yellow, blue, orange, and purple. Precision-crafted, it comes alive with industry-specific graphics, adaptable icons, and purpose-built image placeholders. Seamless compatibility ensures smooth sailing whether you're on Powerpoint, Keynote, or Google Slides. Tailored for businesses, it's the go-to choice for presenting company profiles within the transportation sector. Don't just inform; captivate and inspire your audience. Elevate your presentation game today!


6 slides
World Map Biomes Infographics
The "World Map Biomes" infographic template is a visually stunning and educational tool, expertly designed for PowerPoint, Keynote, and Google Slides. This template is a treasure trove for educators, environmentalists, and geographers aiming to provide a captivating geographical overview of the planet's diverse biomes. This template beautifully illustrates the Earth's varied biomes, from lush rainforests and arid deserts to tundra and coral reefs. Each biome is vividly represented, complete with key characteristics, flora and fauna, and climate information. This makes it a powerful resource for educational programs, environmental awareness campaigns, and geographical studies. The design is as informative as it is visually appealing, with a color scheme that mirrors the richness and diversity of the Earth's ecosystems. This not only makes the presentation a feast for the eyes but also enhances the educational impact, engaging audiences of all ages in the wonders of our world's biomes. Whether used in a classroom, a seminar, or an environmental exhibit, this template ensures that the "World Map Biomes" are presented in an enthralling, informative, and visually spectacular manner.


12 slides
Leadership Development and Growth
Highlight leadership skills with this dynamic radar chart template, ideal for tracking individual or team competencies across six core areas. Use this layout to visualize progress in communication, strategy, vision, influence, adaptability, and accountability. Great for HR reviews, training evaluations, or performance dashboards. Fully editable in PowerPoint, Keynote, and Google Slides.


7 slides
Housing Investment Strategy Presentation
Visualize housing strategies with this clean, key-focused layout. Featuring a central house-and-key icon flanked by six sections, this slide is perfect for outlining investment stages, market insights, or project milestones. Fully editable in Canva, PowerPoint, and Google Slides—ideal for real estate professionals, developers, or analysts presenting actionable housing strategies.


5 slides
Future of 5G and Wireless Innovation Presentation
Step into the next era of connectivity with a clean, visual story that highlights how emerging wireless technologies continue to evolve. This presentation helps you explain trends, breakthroughs, and network innovations in a clear, modern layout. Fully compatible with PowerPoint, Keynote, and Google Slides.


4 slides
Breast Cancer Awareness Campaign Presentation
Raise awareness with impact using the Breast Cancer Awareness Campaign Presentation. This visually engaging design uses symbolic visuals to highlight key messages, educate audiences, and inspire action. Perfect for nonprofit initiatives, educational sessions, or health campaigns. Fully editable in PowerPoint, Google Slides, Keynote, and Canva for easy customization.