


Features
- 5 Unique slides
- Fully editable and easy to edit in Microsoft Powerpoint, Keynote and Google Slides
- 16:9 widescreen layout
- Clean and professional designs
- Export to JPG, PDF or send by email


Do you have any questions?
Recommend


4 slides
Workplace Safety and Compliance Presentation
Ensure a safer work environment with our 'Workplace Safety and Compliance' presentation template. Perfect for illustrating essential safety protocols and compliance standards, this visual tool boosts understanding and adherence. Fully compatible with PowerPoint, Keynote, and Google Slides, it's an excellent resource for any safety-oriented presentation.


23 slides
Flash Cannon Corporate Strategy Report Presentation
Get ready to elevate your business presentations with the Flash Canvas Corporate Strategy Report template! This bold and modern template is designed to command attention with its striking black and blue color scheme, perfect for delivering high-impact reports. Whether you're outlining strategic initiatives, showcasing performance metrics, or discussing team updates, this template ensures your content is not only informative but also visually compelling. The clean and structured layout guides your audience through every key point, making complex information easy to digest. Each slide is tailored to present challenges, solutions, collaboration opportunities, and more, in a way that is both professional and engaging. Ideal for corporate environments, board meetings, or any setting where you need to communicate strategy effectively. Fully compatible with PowerPoint, Keynote, and Google Slides, this template is your go-to for delivering presentations that leave a lasting impression.


4 slides
Elegant Watercolor Background Presentation
Add a touch of sophistication to your presentation with soft watercolor textures that create a calming, professional atmosphere. Perfect for creative projects, proposals, or portfolios, this elegant design blends artistry with clarity. Fully compatible with PowerPoint, Keynote, and Google Slides for seamless customization and a refined visual finish.


6 slides
Post Office Scenes Infographics
The "Post Office Scenes" infographic template, designed for PowerPoint, Keynote, and Google Slides, is an ideal tool for postal services, logistics companies, and educational settings. This engaging template provides a detailed overview of everyday activities in a post office, making it perfect for a range of presentations. This template showcases key aspects of post office operations, including mail sorting, customer service interactions, and package handling. Its design is structured to convey the intricacies of postal services in an easy-to-understand and visually appealing manner. This makes it highly effective for training purposes, educational presentations, or explaining postal logistics in corporate environments. Adopting a professional color scheme that reflects the atmosphere of a postal service, the design is both thematic and informative. It captures the essence of a post office environment, enhancing the educational impact of the presentation. Whether used for staff training, classroom teaching, or corporate presentations, this template ensures a comprehensive and clear understanding of post office scenes and operations.


21 slides
Techne Strategic Planning Report Presentation
Streamline your strategic planning process with this meticulously crafted presentation template, designed for professionals seeking clarity and structure. Featuring slides dedicated to market trends, SWOT analysis, target audience profiling, and competitive insights, this template ensures your strategy is well-rounded and impactful. The clean and modern design accommodates sections for defining objectives, key challenges, and resource allocation, allowing your team to focus on actionable solutions. Performance metrics and risk management slides help you track progress and address uncertainties effectively. Whether presenting to stakeholders or internal teams, this tool simplifies complex data into easily digestible visuals. Fully editable and compatible with PowerPoint, Google Slides, and Keynote, this template provides the flexibility to adapt to various needs. Perfect for organizations aiming to communicate strategic initiatives and actionable plans with precision and professionalism. Take your strategic planning reports to the next level with this essential template.


7 slides
Digital Marketing Strategies Infographic
The Digital Marketing Strategies Infographic provides a colorful and organized presentation of key performance indicators and metrics essential for evaluating the success of digital marketing campaigns. It covers various platforms and strategies, illustrating comparative engagement rates, follower counts, and other relevant data points. This infographic is an excellent resource for marketers looking to convey their campaign results in a clear, concise manner. It is suitable for use in PowerPoint, Google Slides, and Keynote presentations, ideal for illustrating progress, setting benchmarks, and sharing insights with team members, stakeholders, or clients.


22 slides
Etherwind Advertising Agency Proposal Presentation
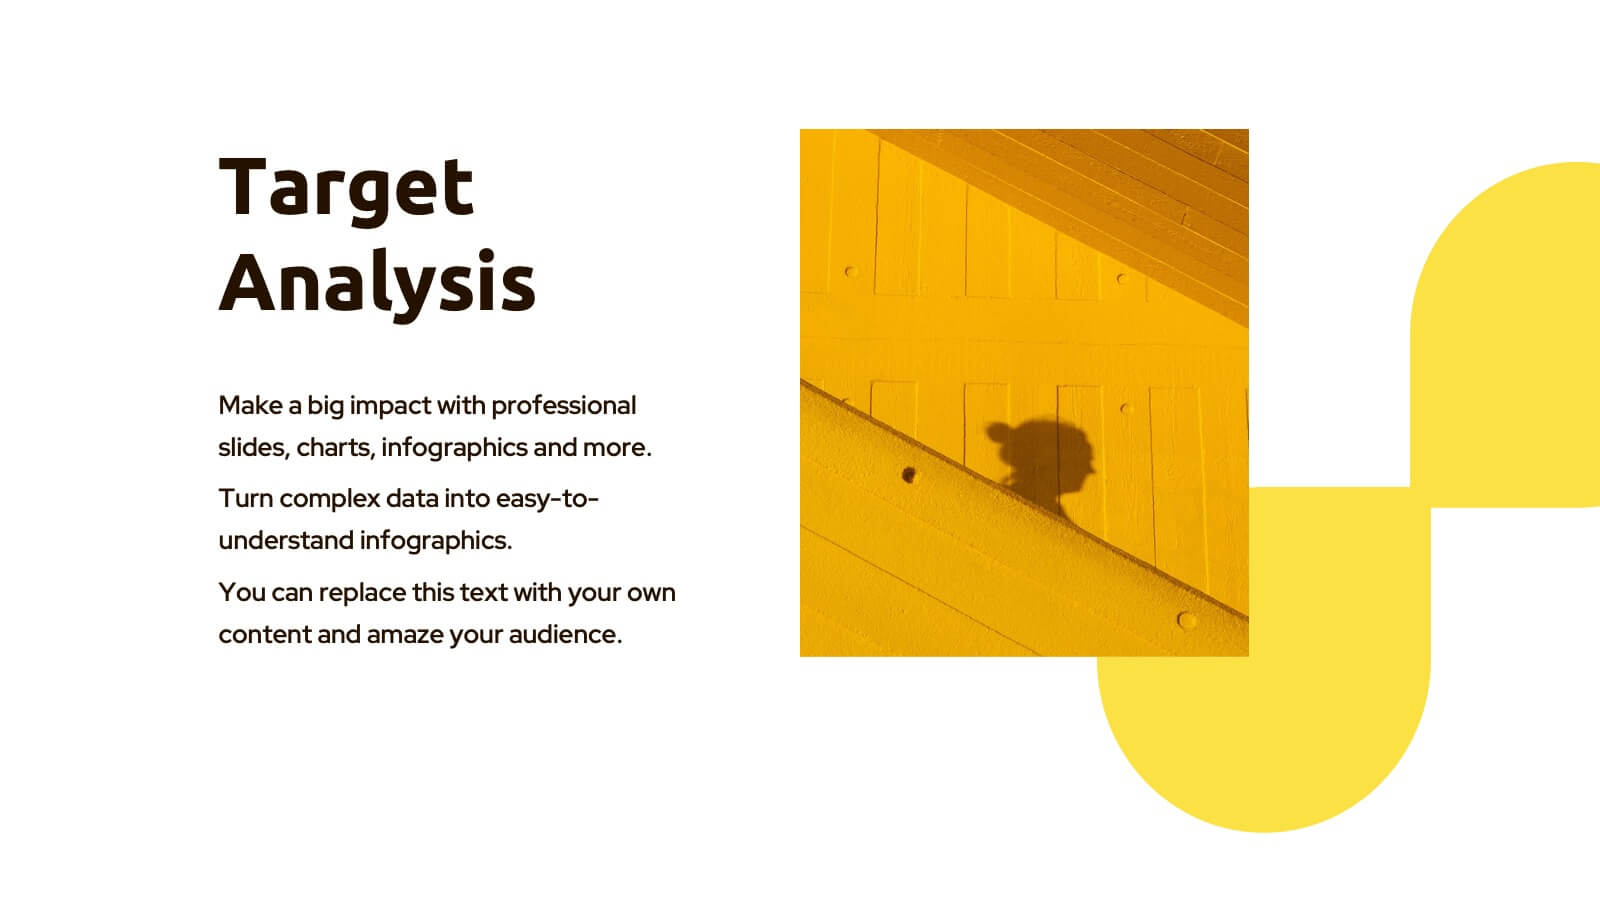
This Advertising Agency Proposal Presentation Template offers a sleek and professional layout, perfect for showcasing your agency's capabilities, services, and success stories. Covering essential sections such as market analysis, strategy development, campaign execution, and client testimonials, it ensures a compelling pitch to potential clients. Designed for easy customization in PowerPoint, Keynote, and Google Slides, making it a versatile choice for agencies looking to impress their audience.


4 slides
90-Day Success Plan for New Hires Presentation
Set your team up for success with this 90-Day Success Plan for New Hires Presentation. This template is perfect for onboarding workflows, outlining key milestones at 30, 60, and 90 days. Help managers and HR professionals communicate expectations clearly and track new employee progress. Fully editable in PowerPoint, Keynote, and Google Slides.


5 slides
Defining Target Market and Audience Presentation
Identify and segment your ideal customer base with this visually structured pyramid slide. Designed to represent layered audience demographics or buyer personas, each level allows space for detailed insights and strategy alignment. The accompanying icons and side labels enhance clarity and storytelling for marketing, branding, or campaign planning presentations. Fully editable in PowerPoint, Keynote, and Google Slides to fit your branding and messaging needs.


4 slides
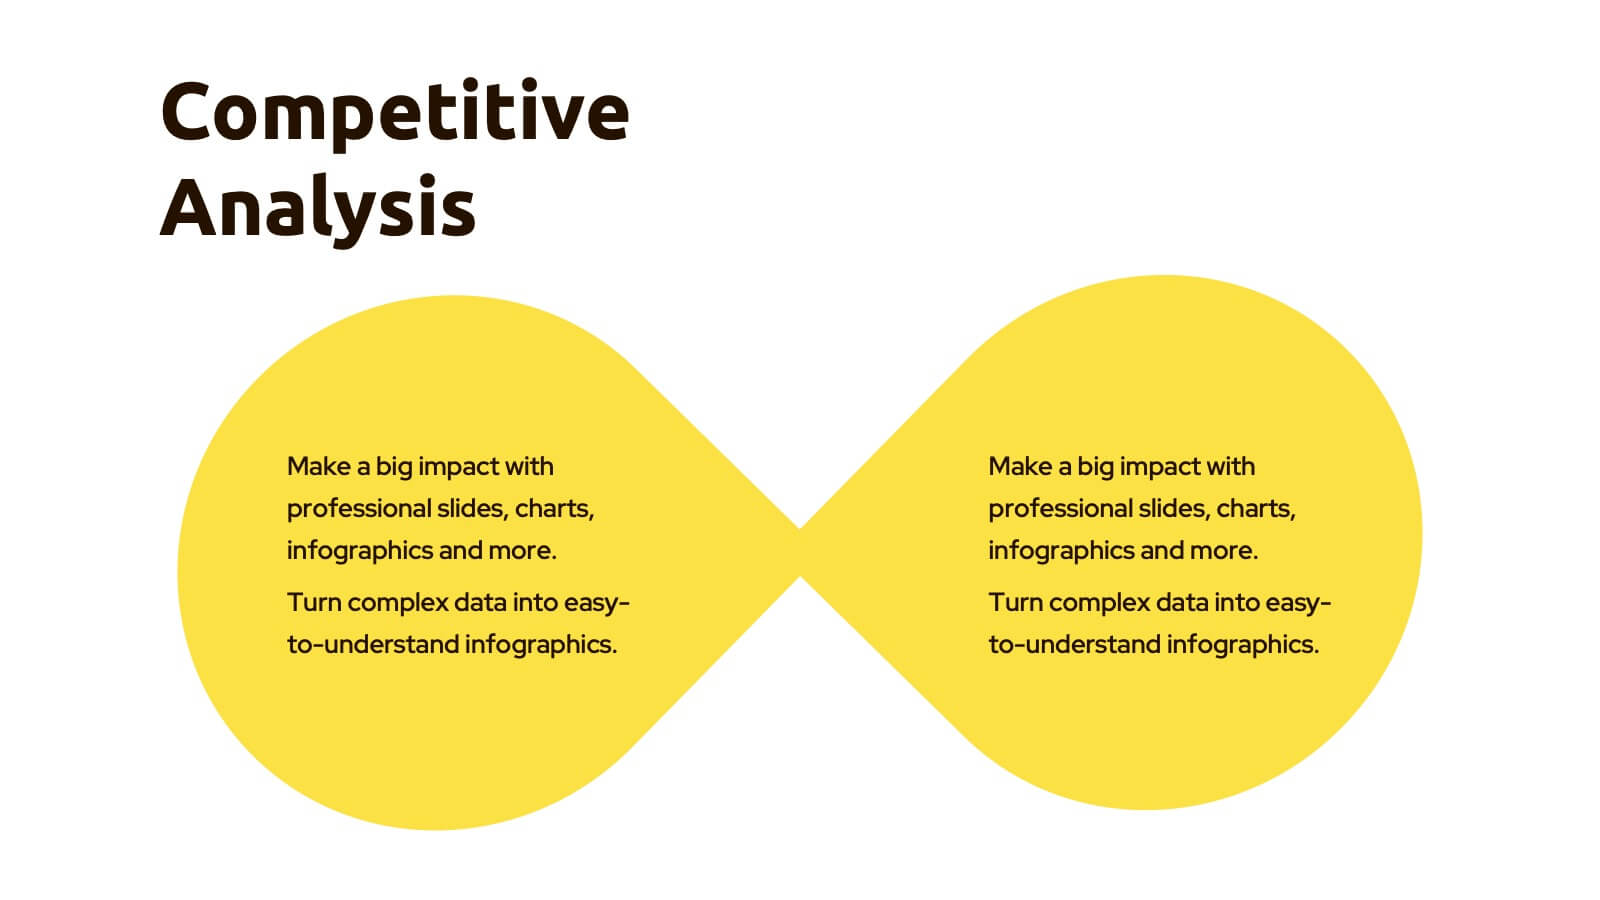
Side-by-Side Comparison Butterfly Chart Presentation
Compare data clearly and effectively with the Side-by-Side Comparison Butterfly Chart Presentation. This layout is perfect for showcasing performance metrics, survey results, or A/B comparisons in a symmetrical, easy-to-read format. Editable in Canva, PowerPoint, Google Slides, and Keynote to match your brand and presentation style effortlessly.


7 slides
Brainstorm Bubble Map Infographic
A brainstorm bubble map is a visual representation used to generate and organize ideas, concepts, or information around a central theme or topic. This infographic template is designed to be a versatile tool commonly utilized in brainstorming sessions, planning, problem-solving, or organizing thoughts. Compatible with Powerpoint, Keynote, and Google Slides. Fully customizable, visualize a multitude of colorful bubbles branching out from the central theme, each encapsulating a unique idea or concept. The vibrant and lively color palette adds an element of fun, reflecting the joy that comes from a successful brainstorming session.


6 slides
Growth Through Lifelong Learning Presentation
Visualize personal or organizational development with this creative lifelong learning slide. Featuring a human head silhouette and puzzle piece graphics, it's perfect for illustrating stages of learning, training programs, or growth mindset principles. Fully editable in PowerPoint, Keynote, and Google Slides—ideal for educators, coaches, or corporate development professionals.


6 slides
6-Step Training Program Slide Presentation
Make your training process feel like a journey worth taking. This vibrant 6-step infographic template helps you break down each stage of your program with clear icons, color-coded steps, and a clean visual path. Ideal for onboarding, workshops, or employee development. Fully compatible with PowerPoint, Keynote, and Google Slides.


6 slides
Competitive Research and Strategy Review Presentation
Present your market insights with clarity using the Competitive Research and Strategy Review Presentation. This puzzle-style layout is ideal for showing strategic steps or comparing research points in sequence. Fully editable in Canva, PowerPoint, Keynote, and Google Slides, it’s perfect for marketing teams, business analysts, and strategy consultants.


5 slides
Managing Product Maturity and Decline
Effectively visualize each phase of a product’s lifecycle with this curve-style infographic—from introduction to decline. Ideal for business strategy, product development, or market lifecycle planning. Fully editable in PowerPoint, Keynote, or Google Slides for seamless customization.


5 slides
Employee Onboarding HR Presentation
Start your presentation with energy and clarity using this clean, engaging slide designed to simplify every step of the onboarding journey. It helps explain employee integration, training stages, and team alignment in a way that feels intuitive and visually organized. Fully compatible with PowerPoint, Keynote, and Google Slides.


5 slides
Detailed Project Scope Definition Presentation
Bring structure and clarity to your planning process with a layout designed to define every stage of your project. Perfect for outlining goals, deliverables, and timelines, this presentation keeps information clear and organized. Fully compatible with PowerPoint, Keynote, and Google Slides for easy customization and professional results.