


Features
- 5 Unique slides
- Fully editable and easy to edit in Microsoft Powerpoint, Keynote and Google Slides
- 16:9 widescreen layout
- Clean and professional designs
- Export to JPG, PDF or send by email


Do you have any questions?
Recommend


6 slides
Product Comparison Table Presentation
Compare features, performance, or specifications at a glance with this Product Comparison Table Presentation. Featuring colorful bar charts and side-by-side metrics, this layout is perfect for showcasing multiple options clearly and professionally. Fully customizable in PowerPoint, Keynote, and Google Slides.


6 slides
Meeting Overview Infographic
A meeting overview is a concise summary of the key points, goals, and agenda items that will be discussed during a meeting. This informative infographic provides a quick reference guide for your audience to understand the purpose of the meeting and what topics will be covered. This template provides a concise summary that helps participants and viewers quickly understand the main highlights. Summarize the purpose of the meeting overview infographic and encourage viewers to refer to it for a quick understanding of the meeting's main points. Compatible with Powerpoint, Keynote, and Google Slides.


5 slides
Identifying and Mitigating Risks Presentation
Master risk management with the Identifying and Mitigating Risks template, designed to deliver clear and impactful presentations that outline key risk factors and mitigation strategies. It features easily customizable icons representing various aspects of risk assessment. This template allows professionals to effectively communicate risk mitigation strategies, ensuring essential information is concise and understandable. Additionally, it is compatible with PowerPoint, Keynote, and Google Slides.


26 slides
Forge Brand Strategy Report Presentation
The Brand Strategy Presentation Template is a sleek solution for showcasing brand identity. Highlight mission, values, audience personas, and future growth plans across 26 structured slides. Fully customizable for PowerPoint, Keynote, and Google Slides, it’s ideal for presenting brand insights to clients or stakeholders with professionalism and clarity.


6 slides
Startup Business Validation Plan Presentation
Present your startup’s validation strategy with this structured, color-coded framework. Ideal for mapping business assumptions, customer segments, and testing stages. Includes five top-phase boxes and supporting rows for team input or feedback. Fully editable in PowerPoint, Keynote, or Google Slides—perfect for founders, incubators, or pitch decks.


21 slides
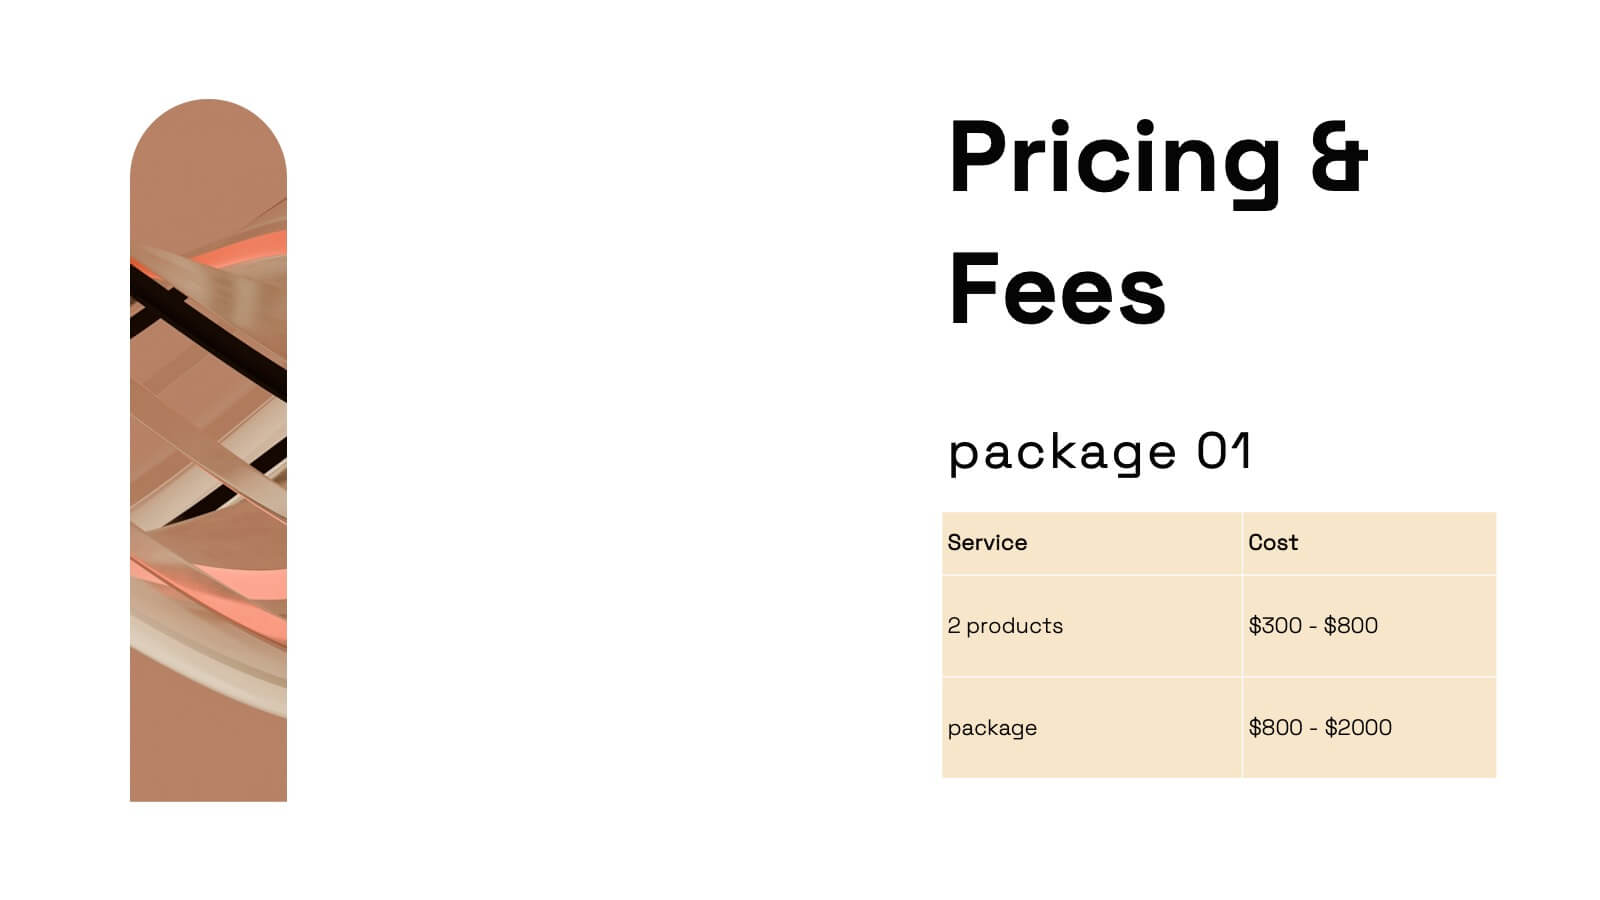
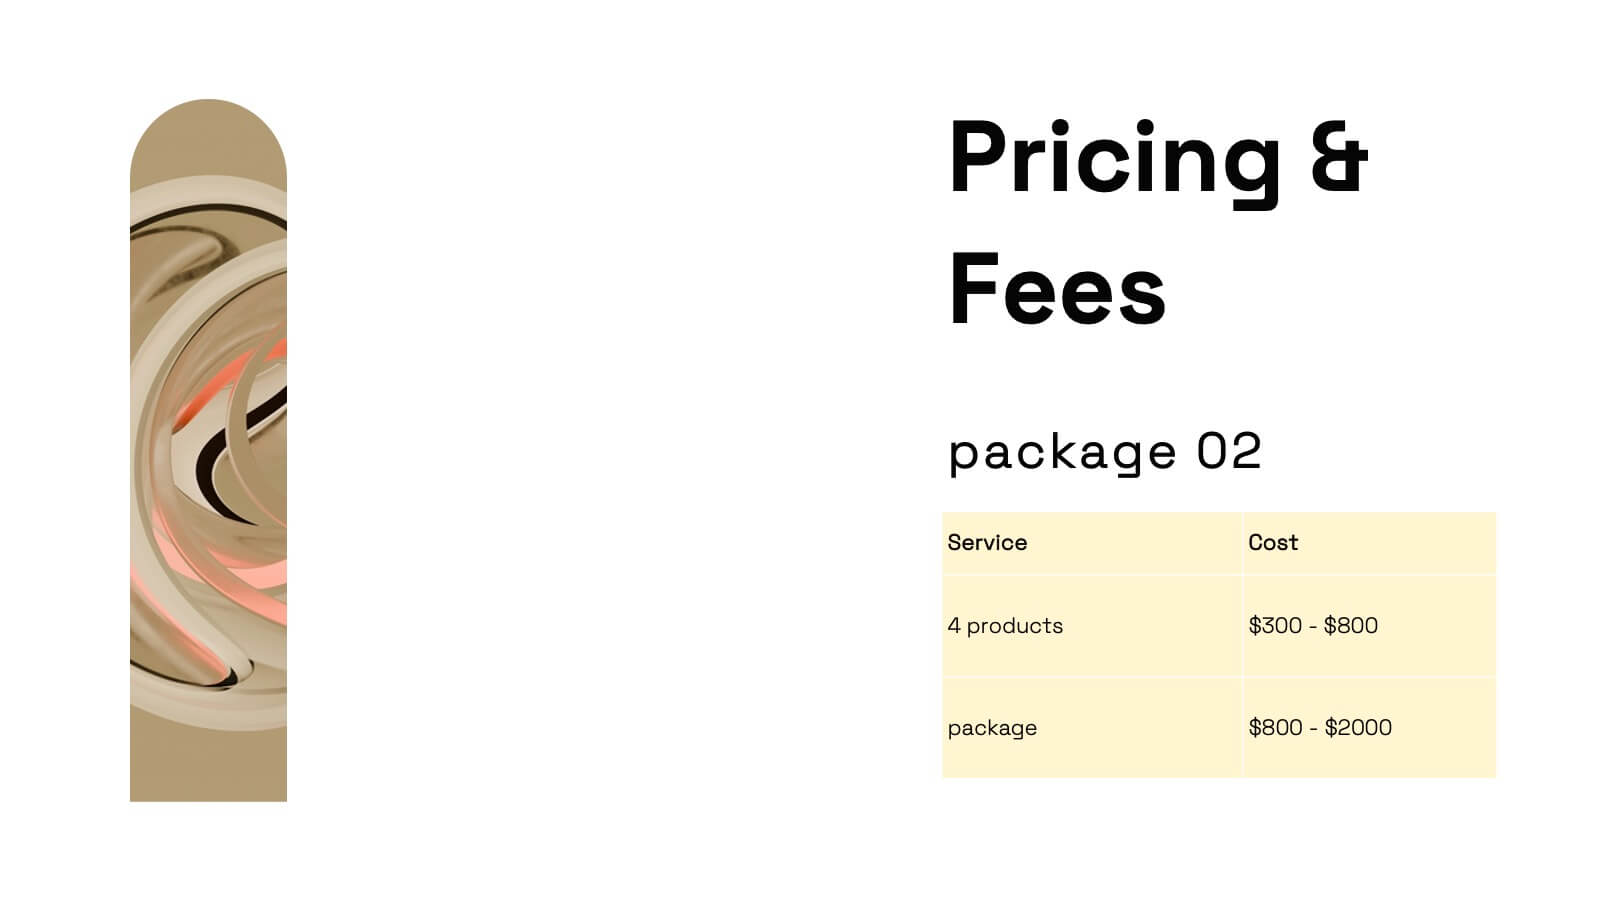
Haze Professional Portfolio Showcase Presentation
Elevate your professional presence with this stunning haze-inspired presentation template! Ideal for showcasing your portfolio, it beautifully highlights your skills, projects, and achievements with a clean and sophisticated design. This template ensures your work stands out, captivating potential clients and employers. Compatible with PowerPoint, Keynote, and Google Slides.


7 slides
Travel Infographic Presentation Template
Our Travel Infographic is a gorgeous infographic template that allows you to instantly create a modern, stylish and eye-catching travel infographic. You can easily customize this travel infographic to suit all your needs in just a few minutes. This Travel Infographic is designed to used as a travel guide with tons of destinations, flight deals and tips to make your trip memorable. This template can be used to help you create dynamic visual content for your travels. This travel infographic is a perfect way to plan, organize and prepare for your next trip or for all the upcoming trips!


5 slides
Recycling Basics Infographics
Recycling is the process of converting waste materials into new products to reduce the consumption of raw materials, energy usage, and environmental pollution. These infographic templates are designed to educate and motivate individuals to embrace recycling as a sustainable practice. With its eye-catching design, concise information, and visually appealing graphics, this template will help raise awareness and inspire positive recycling behaviors in your audience. This template allows you to effectively communicate key information about recycling. This is compatible with Powerpoint, Keynote, and Google Slides.


7 slides
Annual Marketing Report Infographic
Elevate your corporate narrative with our meticulously curated Annual Report Infographic. Cloaked in the purity of white and varying professional blue tones, our template mirrors the precision and credibility essential for annual reviews. Enhanced with succinct infographics, coherent icons, and pertinent image placeholders, it weaves a year's data into a compelling visual story. Flawlessly adapted for Powerpoint, Keynote, or Google Slides. A quintessential instrument for CEOs, financial analysts, stakeholders, or any organization presenting its yearly milestones and future outlook. Reflect, report, and strategize; let every slide be a testament to your organization's journey and ambition.


7 slides
Buyer Persona Guide Infographic
Elevate your marketing strategy with our Buyer Persona Guide Infographic Template, designed to distill complex customer data into stunning, easy-to-understand visual profiles. This template is a canvas for creativity, allowing marketers to paint detailed portraits of their ideal customers using a mix of vibrant colors, engaging layouts, and succinct text. Craft each persona with care, detailing demographics, preferences, behaviors, and needs, all laid out in an aesthetically pleasing format that makes data pop off the page. Whether you're presenting to stakeholders, guiding your content strategy, or training your sales team, these visuals serve as your roadmap to deeper customer connections. Fully customizable to reflect your brand's unique voice and style, this template adapts seamlessly to your needs, ensuring that every insight into your audience is not just informative but also visually captivating. It's an essential tool for anyone looking to enhance their understanding of their market and refine their approach to meet customer demands.


5 slides
Artificial Intelligence Tools Infographics
Artificial Intelligence has advanced rapidly in recent years, leading to the development of various tools and technologies that leverage AI algorithms and techniques. These vertical infographics highlight various tools and technologies used in the field of AI. This template provides an engaging way to showcase different AI tools and their functionalities. This features a sleek and contemporary design that captures attention. The combination of vibrant colors, high-quality icons, and visuals adds a modern touch to the infographics. The template offers multiple slides that provide an overview of AI and its technologies.


4 slides
Sustainability Report Slide Deck Presentation
Bring your sustainability story to life with a bright, modern layout that turns complex environmental data into a clear visual narrative. This presentation helps you outline key initiatives, performance metrics, and long-term goals in a clean, structured format. Fully editable and compatible with PowerPoint, Keynote, and Google Slides.


10 slides
Digital Transformation Strategy Presentation
The "Digital Transformation Strategy Presentation" template is designed to clearly showcase the stages of digital transformation initiatives. It features a visually appealing layout with concentric circles or varying targets that focus on key elements of transformation strategy. This format is ideal for emphasizing the progression from planning to execution and monitoring of digital strategies. Each section is distinctly colored and provides a space for succinctly labeled titles and detailed descriptions, making it perfect for presenting strategic initiatives, technology implementation, or progress metrics in corporate settings. The template ensures that complex strategies are communicated in an understandable and visually engaging manner.


4 slides
Enterprise IT Architecture Presentation
Visualize the foundation of your organization’s technology with this sleek, layered presentation. Designed to showcase system hierarchies, integration processes, and strategic frameworks, it simplifies complex IT concepts through a clear, structured layout. Fully customizable and compatible with PowerPoint, Keynote, and Google Slides for effortless professional presentations.


10 slides
Healthcare Innovations in Medicine Presentation
Showcase groundbreaking advancements with the Healthcare Innovations in Medicine Presentation template. Designed to highlight medical breakthroughs, research developments, and technological advancements, this visually appealing layout is ideal for healthcare professionals, researchers, and medical institutions. Fully customizable and compatible with PowerPoint, Keynote, and Google Slides, this template ensures your presentation is clear, engaging, and impactful.


5 slides
Quality Control with Six Sigma Strategy Presentation
Showcase your quality control framework using the Quality Control with Six Sigma Strategy Presentation. This modern layout highlights each stage of the DMAIC process in a visually engaging format, ideal for Lean Six Sigma teams and continuous improvement professionals. Fully customizable in PowerPoint, Keynote, Canva, and Google Slides.


4 slides
Current vs Future State Gap Presentation
Take your audience on a journey of progress with this dynamic slide, designed to clearly compare where things stand today and where they’re headed next. It helps highlight key gaps, improvement areas, and strategic opportunities with a simple, visual flow. Fully compatible with PowerPoint, Keynote, and Google Slides.