


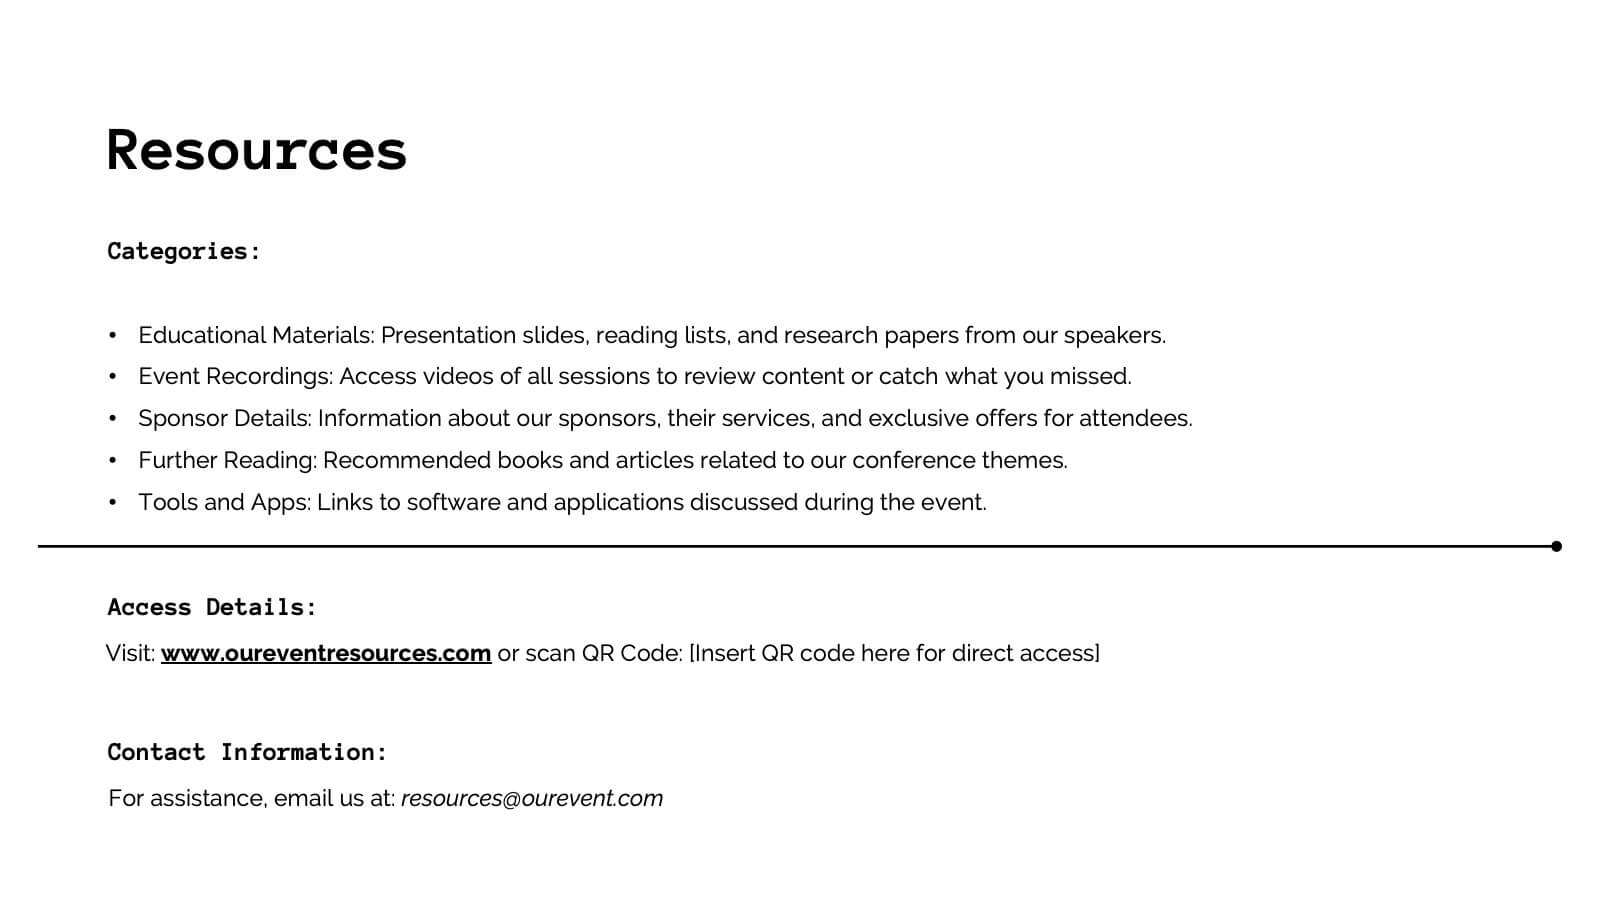
Features
- 6 Unique slides
- Fully editable and easy to edit in Microsoft Powerpoint, Keynote and Google Slides
- 16:9 widescreen layout
- Clean and professional designs
- Export to JPG, PDF or send by email


Do you have any questions?
Recommend


6 slides
Real Estate Housing Solutions Presentation
Present property features and real estate plans with this creative multi-level housing diagram. Designed for agents, developers, or housing consultants, this layout clearly segments space usage or service offerings. Fully customizable in PowerPoint, Keynote, and Google Slides—perfect for showcasing floor plans, room functions, or housing solutions with vibrant clarity.


6 slides
Break Even Analysis Rate Infographics
Analyze your business's break-even point effectively with our Break-Even Analysis Rate infographic template. This template is fully compatible with popular presentation software like PowerPoint, Keynote, and Google Slides, allowing you to easily customize it to illustrate and communicate critical break-even analysis concepts. The Break-Even Analysis Rate infographic template offers a visually engaging platform to calculate and display the point at which your business covers all its costs and begins to generate a profit. Whether you're an entrepreneur, financial analyst, or business owner, this template provides a user-friendly canvas to create informative presentations and reports on your break-even analysis. Optimize your financial decision-making with this SEO-optimized Break-Even Analysis Rate infographic template, thoughtfully designed for clarity and ease of use. Customize it to showcase your break-even calculations, assumptions, and scenarios, helping you make informed decisions about pricing, costs, and profitability. Start crafting your personalized infographic today to enhance your break-even analysis skills and strategies.


4 slides
SaaS Pricing Comparison Chart Presentation
Make pricing comparisons exciting with this bold, side-by-side layout designed to instantly spotlight key differences. Whether you’re showcasing SaaS plans or product tiers, this chart template lets you present value and features clearly. Fully editable and easy to customize in PowerPoint, Keynote, and Google Slides for polished pricing presentations.


5 slides
Foundation of Success Pillars Presentation
Dive into the structural essence of your enterprise with our engaging 'Foundation of Success Pillars' presentation template. Vividly illustrate the key components vital for organizational prosperity. Ideal for presenting corporate strategies and values. Compatible with PowerPoint, Keynote, and Google Slides, it's perfect for enhancing your presentation visuals.


20 slides
Celestique Photography Portfolio Template Presentation
This Photography Portfolio Presentation offers a sleek and modern design to showcase your work professionally. Featuring sections for project highlights, creative process, client testimonials, and pricing, it's fully customizable and easy to edit in PowerPoint, Keynote, and Google Slides. Perfect for photographers looking to impress potential clients.


5 slides
Flow Chart for Decision Trees
Clarify complex decisions with the Flow Chart for Decision Trees Presentation. This layout uses a vertical tree design with branching logic paths, making it perfect for outlining strategic choices, workflows, or evaluation criteria. Featuring five customizable sections with icon support and placeholder text, this template works seamlessly in PowerPoint, Keynote, and Google Slides.


6 slides
Business Idea Presentation for Investors Presentation
Present your business concept with clarity using the Business Idea Presentation for Investors. This unique hexagon-centric layout highlights six key pillars of your idea—perfect for showcasing problem-solving, market fit, innovation, competitive advantage, scalability, and profitability. Each point includes customizable icons and text, allowing you to adapt it to your pitch needs. Clean, visually balanced, and easy to edit in PowerPoint, Keynote, or Google Slides, this slide is ideal for entrepreneurs, founders, and startup teams seeking investment and buy-in.


23 slides
Pomona Business Plan Presentation
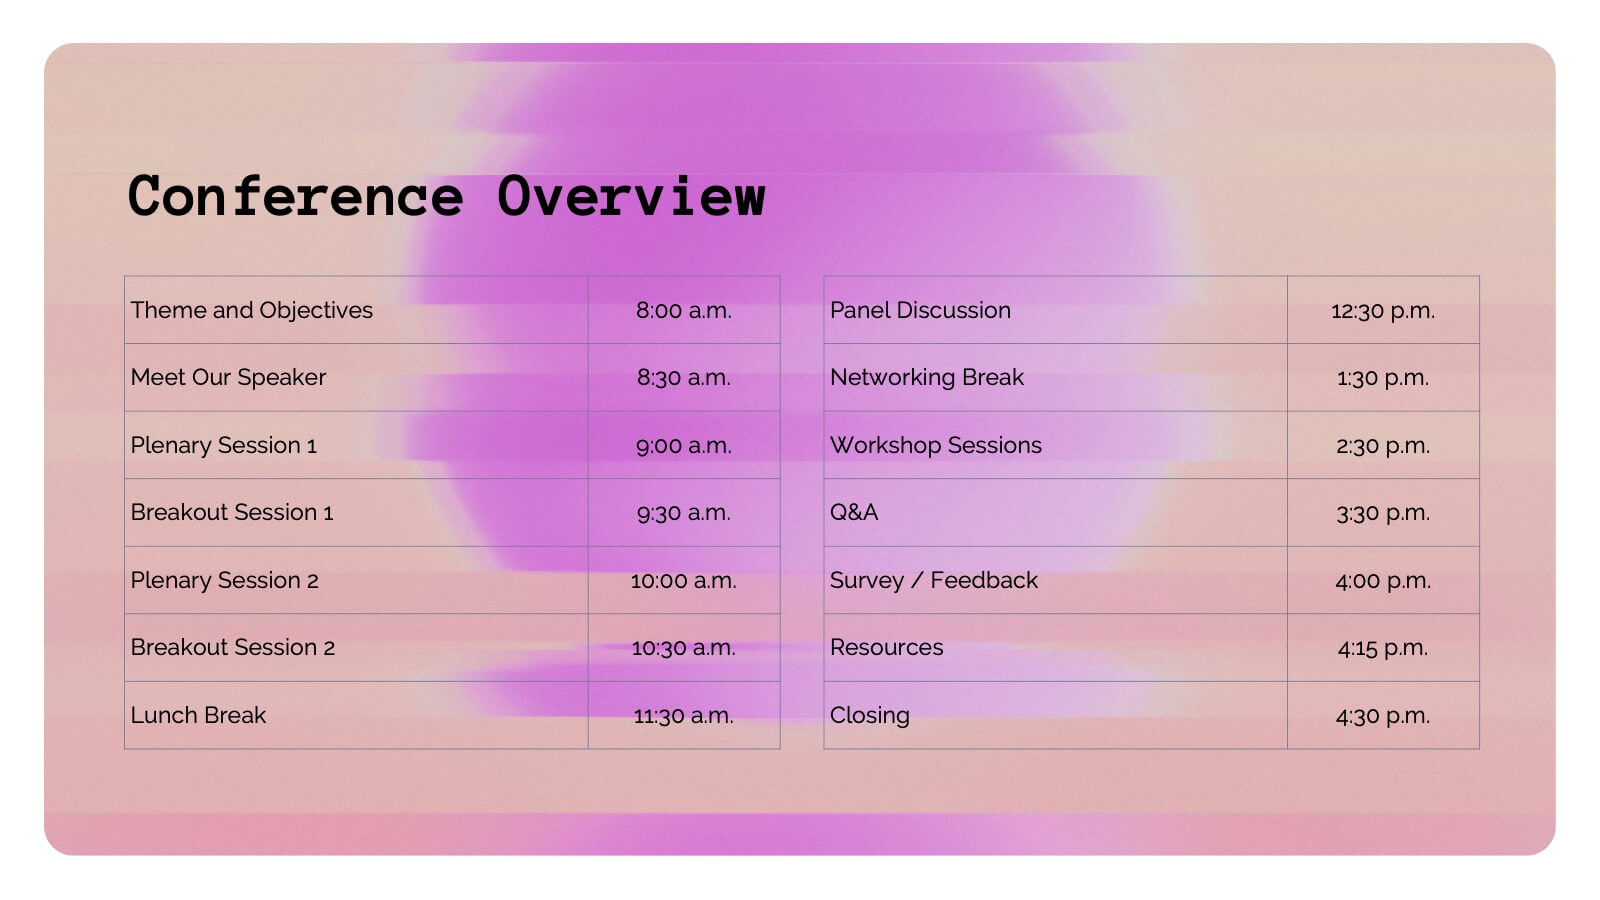
This vibrant and adaptable event agenda template is perfect for organizing your business conference or corporate event. It includes customizable sections for session details, speaker information, and key activities like networking breaks, workshops, and panel discussions. Compatible with PowerPoint, Keynote, and Google Slides, it ensures a smooth and engaging event presentation experience!


12 slides
Understanding Digital Currencies Presentation
Simplify the complexity of crypto ecosystems with the Understanding Digital Currencies presentation template. Designed around a wallet-style visual, this layout highlights key features of various cryptocurrencies using six labeled touchpoints. Perfect for introducing Bitcoin, Ethereum, altcoins, and digital wallets in educational, financial, or blockchain-related presentations. Ideal for crypto educators, fintech startups, and investment analysts. Compatible with PowerPoint, Keynote, and Google Slides.


21 slides
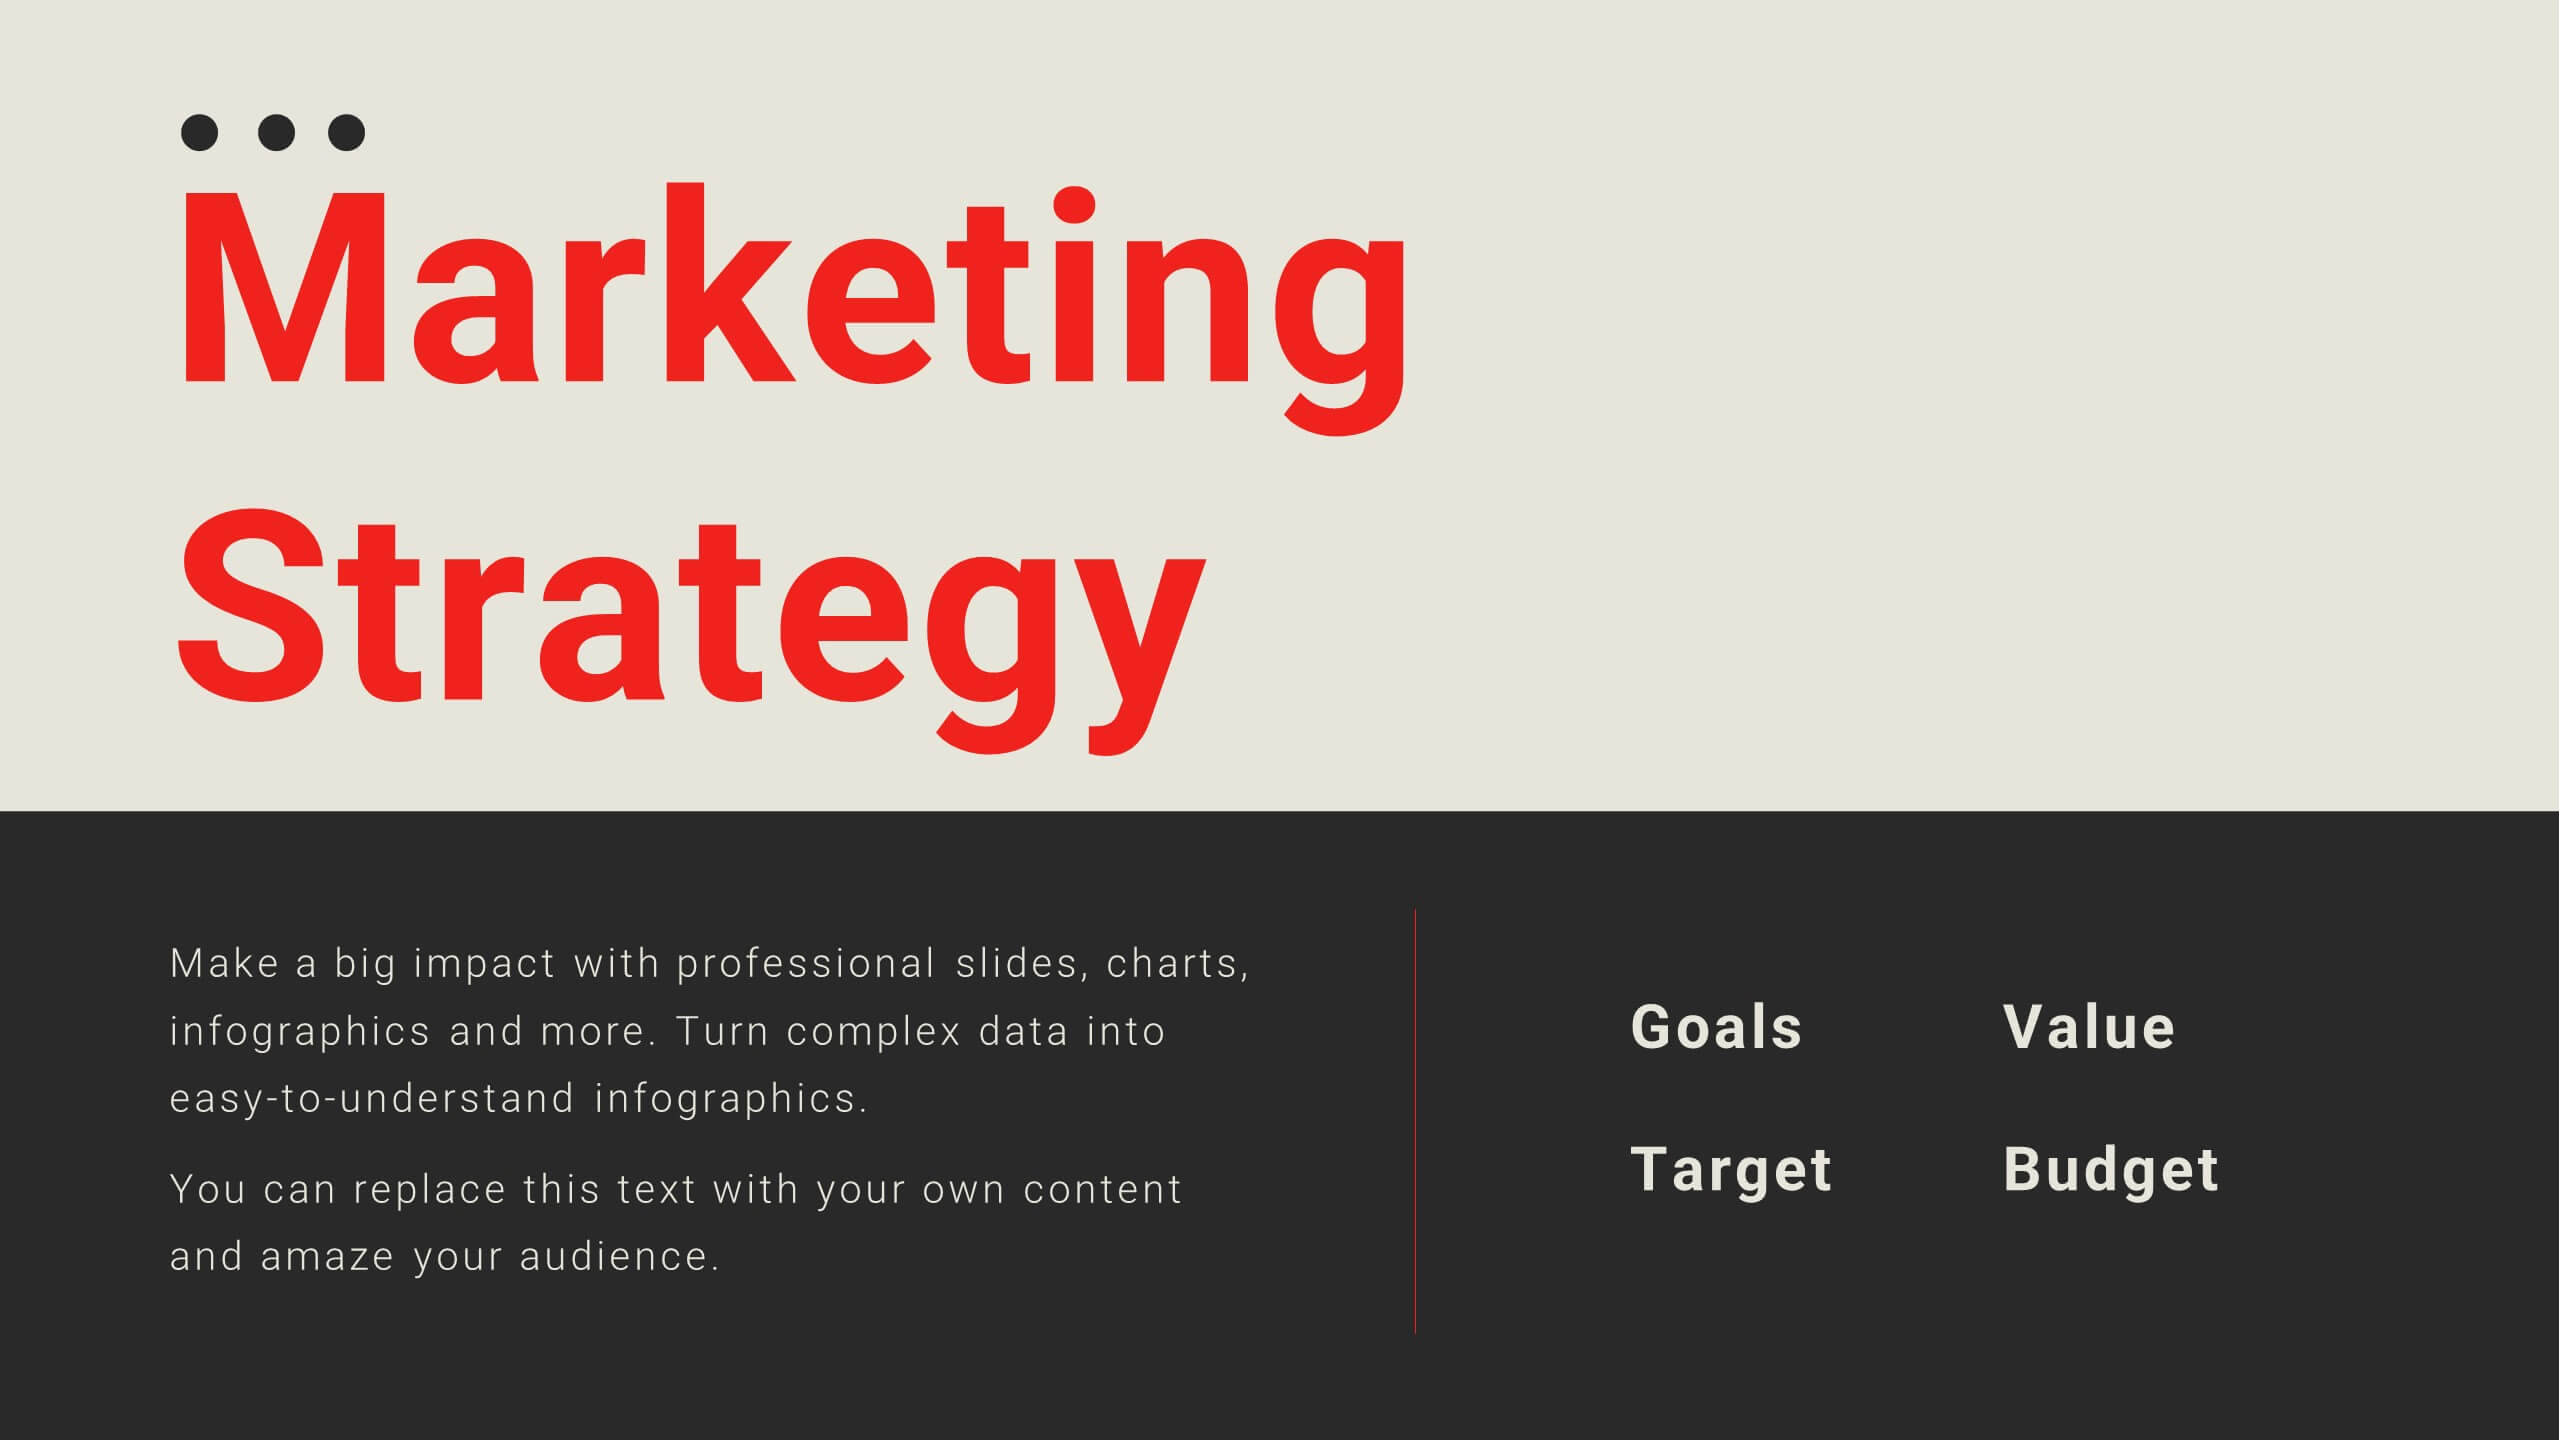
Velocity Startup Growth Plan Presentation
Accelerate your startup's growth with this dynamic plan template! Perfect for outlining your mission, vision, business model, and marketing strategy. Ideal for entrepreneurs aiming to secure funding and drive success. Compatible with PowerPoint, Keynote, and Google Slides, this template ensures your growth plan is clear, professional, and compelling. Achieve your startup goals today!


5 slides
Experience-Based Smile Scorecard Presentation
Measure sentiment with ease using this Experience-Based Smile Scorecard slide. Designed with a vertical battery-style layout, each tier represents a distinct emotional level—from dissatisfied to happy. Ideal for visualizing user experiences, customer feedback, or service quality. Fully editable and compatible with PowerPoint, Canva, and Google Slides.


5 slides
Cryptocurrency Market Trends Presentation
Navigate the dynamic world of digital finance with our "Cryptocurrency Market Trends" presentation templates. Perfect for analysts and enthusiasts alike, these templates provide a clear, visual representation of market movements and trends. They are fully compatible with PowerPoint, Keynote, and Google Slides, making them an excellent resource for anyone keen on the pulse of cryptocurrency markets.


26 slides
Flowers Bold Company Profile Presentation
Step into the enchanting garden of happy flowers, where petals dance and colors sing. Our template, awash in sunlit shades of pink, yellow, orange, and blue, encapsulates the very essence of floral joy. Bursting with vibrant graphics, whimsical icons, and cheerful image placeholders, it's a bouquet of design brilliance. Crafted to perfection for Powerpoint, Keynote, or Google Slides. A delightful pick for florists, garden enthusiasts, event planners, or anyone looking to infuse their presentation with a touch of nature's merriment. Blossom your ideas; let your presentations bloom with happiness.


2 slides
Long-Term Vision Strategy Presentation
Spark forward momentum with a clean, modern slide that turns long-range planning into a story your audience can instantly follow. This presentation helps teams outline future goals, strategic priorities, and the actions needed to stay aligned over time. Fully compatible with PowerPoint, Keynote, and Google Slides.


4 slides
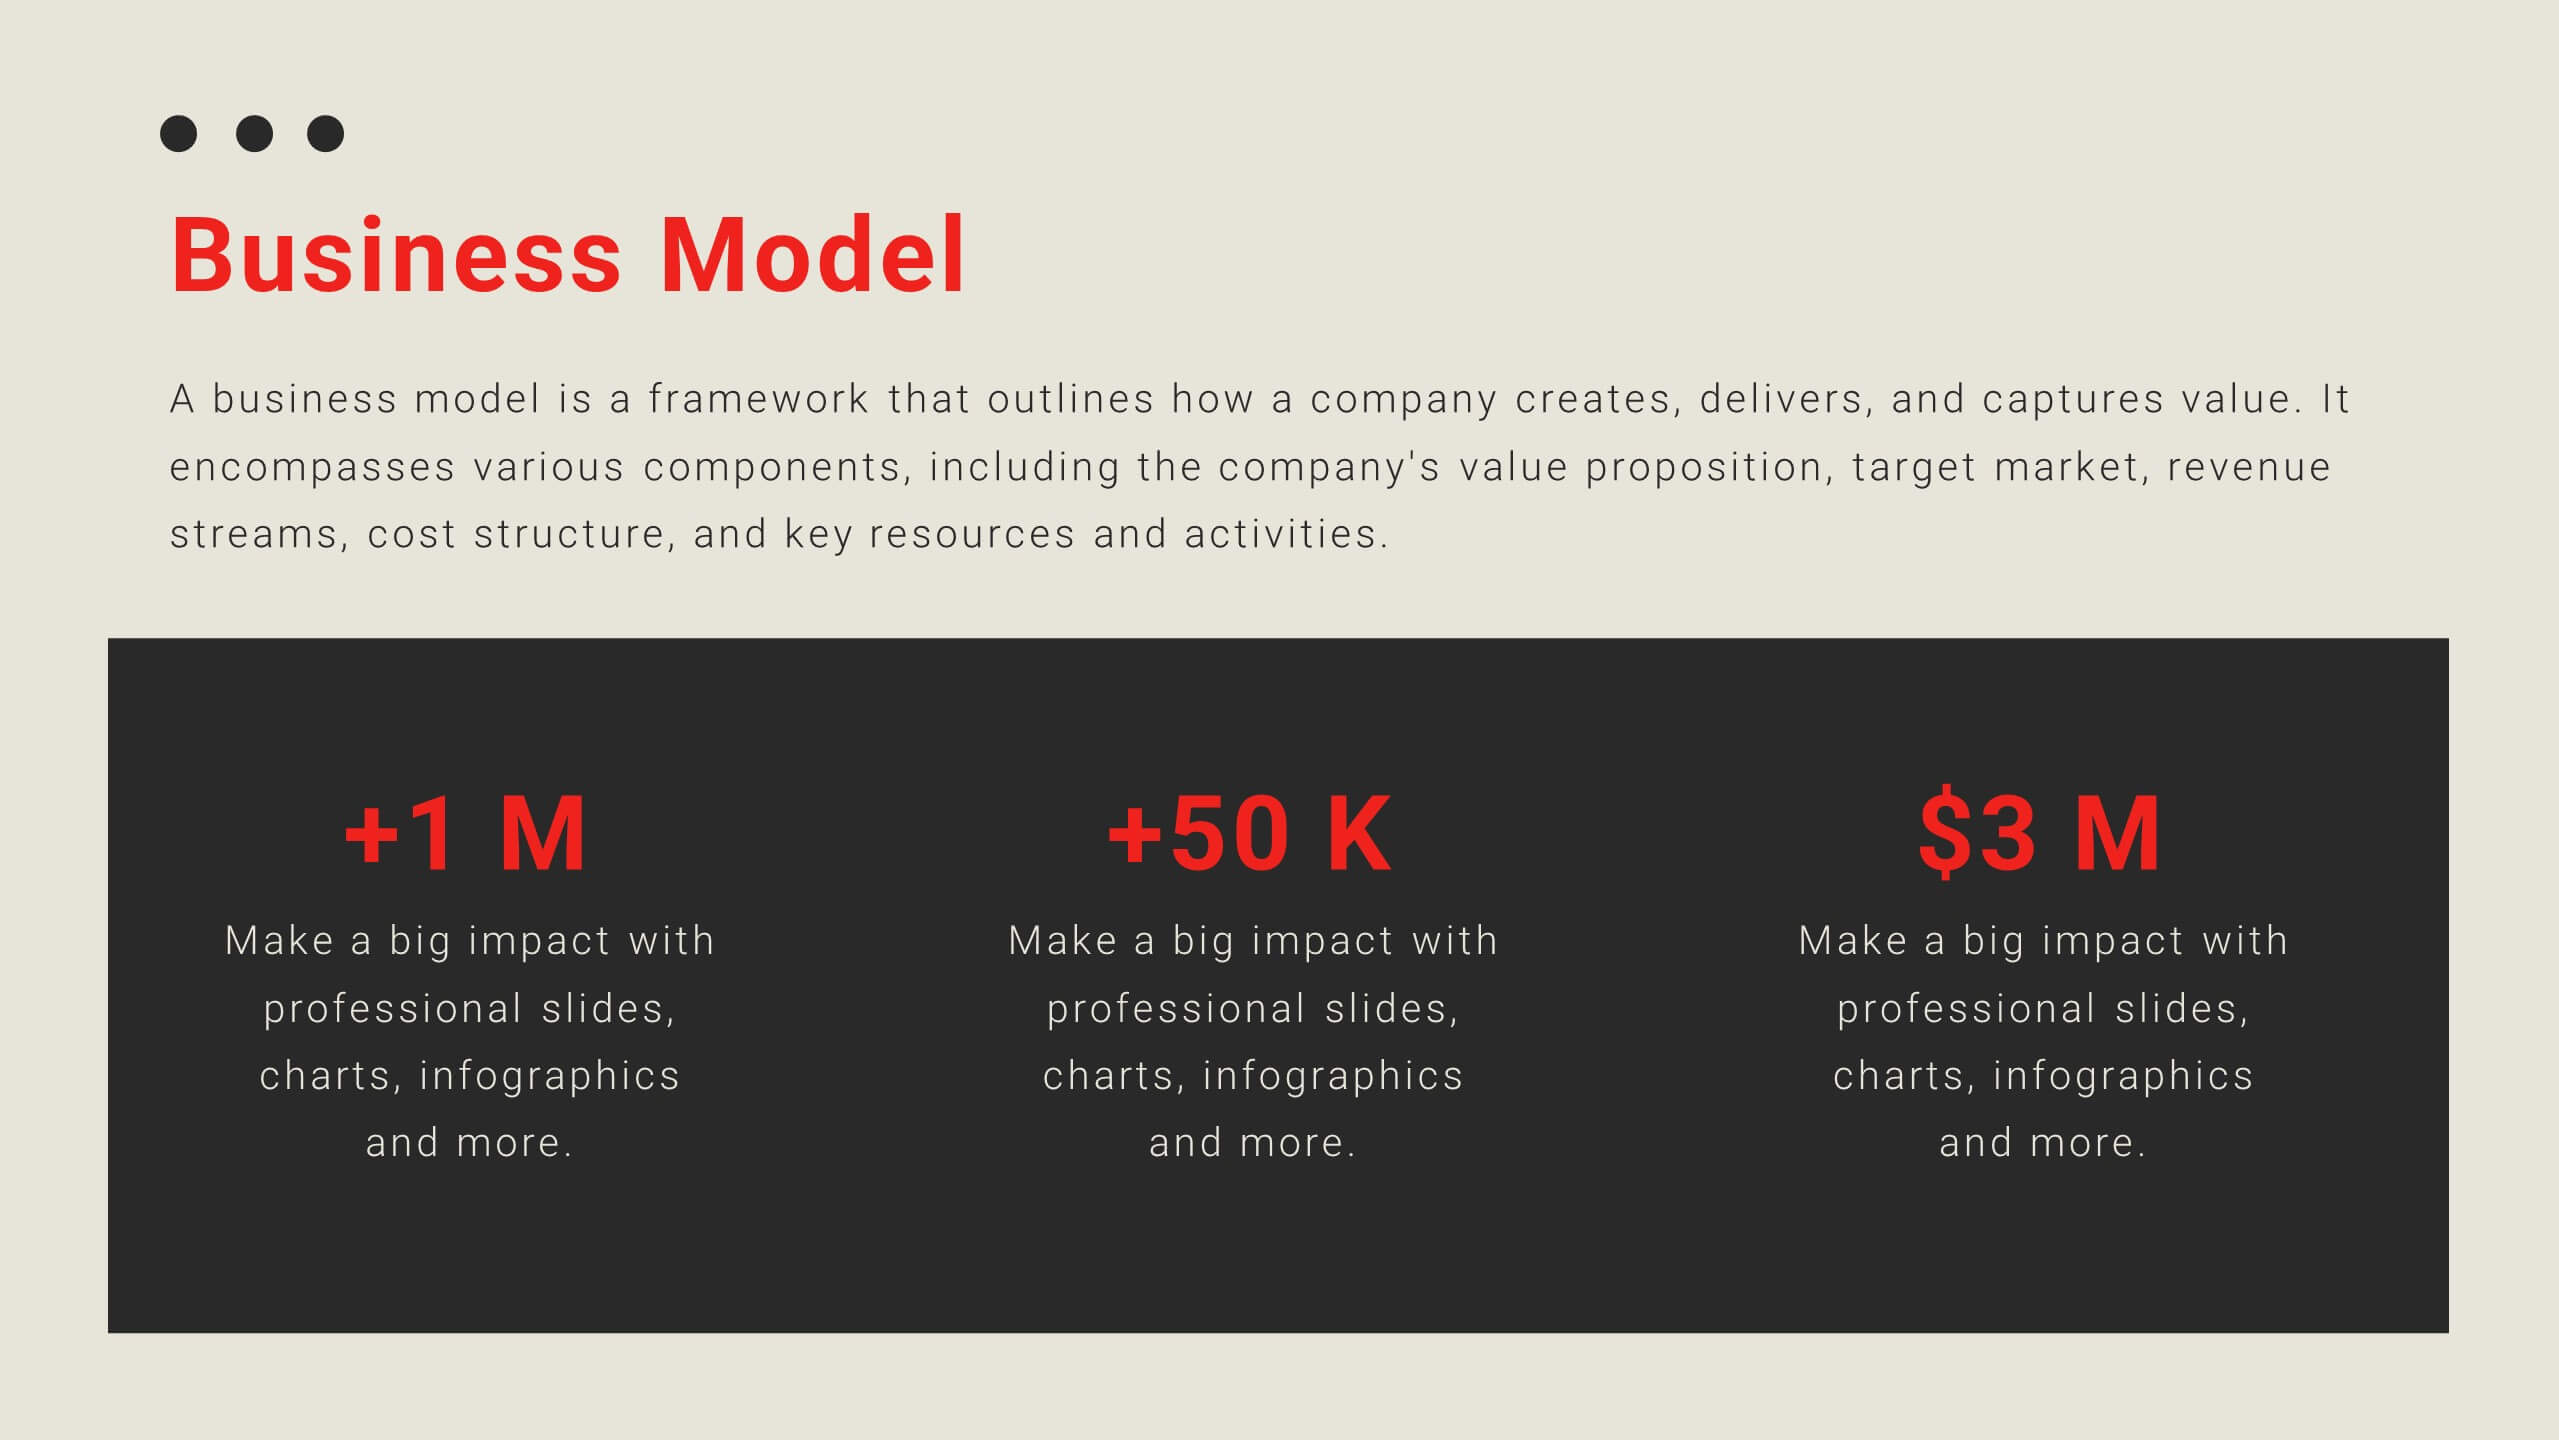
Strategic Business Model Outline Presentation
Present a clear visual of your business model with this Strategic Business Model Outline. Designed to break down key components across four categories, this slide is perfect for strategy meetings, business overviews, or investor decks. Fully editable in PowerPoint, Keynote, and Google Slides for seamless customization and professional presentations.


6 slides
Customer Feedback Insights Chart Presentation
Visualize feedback data effectively with this sleek, horizontal bar chart layout. Highlight percentages per category with bold labels and color accents to emphasize results. Ideal for surveys, product reviews, or satisfaction ratings. Fully customizable in Canva, PowerPoint, or Google Slides for a professional, easy-to-read presentation experience.


6 slides
Sales SWOT Infographic
SWOT analysis is a strategic planning framework used to evaluate the strengths, weaknesses, opportunities, and threats of a business, project, or situation. This infographic template will help you analyze the strengths, weaknesses, opportunities, and threats of a business, project, or idea. The template is designed to assist individuals or teams in conducting a SWOT analysis, a strategic planning tool used to assess the internal and external factors that can impact an organization's success. This template effectively communicates the outcomes of a SWOT analysis in a clear and concise manner, enabling informed decision-making and strategy development.