


Features
- 5 Unique slides
- Fully editable and easy to edit in Microsoft Powerpoint, Keynote and Google Slides
- 16:9 widescreen layout
- Clean and professional designs
- Export to JPG, PDF or send by email


Do you have any questions?
Recommend


23 slides
Orbit Marketing Strategy Plan Presentation
Elevate your marketing strategy presentations with this vibrant and dynamic template! Perfect for analyzing market trends, identifying target audiences, and outlining strategic objectives. Ideal for marketing professionals aiming to captivate their audience and drive results. Compatible with PowerPoint, Keynote, and Google Slides, this template ensures your strategy is clear, compelling, and effective.


5 slides
Scaling Operations and Team Expansion Presentation
Illustrate your company’s growth journey with the Scaling Operations and Team Expansion Presentation. This dynamic layout uses a circular sequence to showcase five key phases of business scaling, from small teams to full-scale departments. Perfect for strategy sessions, investor updates, and team meetings. Fully editable in Canva, PowerPoint, Keynote, and Google Slides.


8 slides
Investor Business Plan Presentation
The "Investor Business Plan Presentation" template is innovatively designed to illustrate the balance and interdependence of various business elements critical for attracting investors. Utilizing a seesaw mechanism as a metaphor, this template vividly demonstrates how key aspects like Partners, Resources, Activities, and Channels contribute to maintaining a stable and functional business model. Each section of the seesaw is colored differently to distinguish between the categories, providing a clear visual hierarchy. This presentation format is excellent for startups and existing businesses preparing to pitch to investors, highlighting how each strategic component is vital for overall success and stability in the market.


4 slides
Effective Leadership Tips Presentation
Lead with clarity and confidence using this clean, modern presentation design. Perfect for sharing management insights, motivational principles, and communication strategies, it helps visualize ideas that inspire stronger teams and better decision-making. Fully editable and compatible with PowerPoint, Keynote, and Google Slides for effortless professional customization.


6 slides
Change Management Model Infographics
Navigate organizational change effectively with our Change Management Model infographic template. This template is fully compatible with popular presentation software like PowerPoint, Keynote, and Google Slides, allowing you to easily customize it to illustrate and communicate the key components of a change management model. The Change Management Model infographic template offers a visually engaging platform to outline the stages, strategies, and best practices for managing change within an organization. Whether you're a change management professional, business leader, or team member involved in change initiatives, this template provides a user-friendly canvas to create informative presentations and educational materials. Optimize your change management processes with this SEO-optimized Change Management Model infographic template, thoughtfully designed for clarity and ease of use. Customize it to showcase the change model you're using, steps involved, communication strategies, and the importance of addressing resistance to change. Ensure that your audience gains valuable insights into effective change management. Start crafting your personalized infographic today to navigate change with confidence.


6 slides
Common Question for Businesses Infographic
Captivate your audience and enhance interaction with our collection of slide templates, perfect for engaging beginners and prompting them to ask top questions. These templates feature inviting designs and dynamic layouts, making them ideal for educational sessions, workshops, or any presentation aimed at beginners. Each template employs bright colors and creative graphics to draw attention and stimulate curiosity. The designs are crafted to not only pose questions but also to invite thoughtful responses and active participation. Whether you are hosting a seminar, leading a training session, or facilitating a learning module, these slides provide a friendly and approachable way to encourage questions and discussions. Customize these templates to suit your specific session, adapting the text, colors, and images to fit the theme and audience. They are a fantastic tool for educators and trainers looking to create a more engaging and interactive learning environment.


4 slides
Annual Report Summary Slide
Present key performance metrics with confidence using this Annual Report Summary Slide. Designed with bold percentage visuals and clear titles, it helps break down quarterly or category results in a clean, professional format. Ideal for financial overviews, sales performance, or strategic summaries. Fully editable in PowerPoint, Keynote, and Google Slides.


6 slides
Hospital Management System Presentation
Bring structure and efficiency to your healthcare operations with this professional presentation. Designed to simplify complex hospital workflows, it helps visualize patient management, service coordination, and system processes with clarity. Ideal for administrators and consultants, it’s fully editable and compatible with PowerPoint, Keynote, and Google Slides for seamless customization.


3 slides
Stock Market Investment Analysis Presentation
Unlock the secrets of the stock market with our "Stock Market Investment Analysis" presentation templates. Ideal for financial analysts and investors, these templates provide a clear framework for analyzing trends and making informed decisions. With easy-to-edit elements and professional design, they are perfect for delivering compelling investment insights. Compatible with PowerPoint, Keynote, and Google Slides, they ensure your analysis looks sharp and persuasive across all platforms.


5 slides
Digital Marketing Strategy Roadmap
Visualize your marketing initiatives step-by-step with this clean, arrow-driven roadmap design. Ideal for showcasing campaign planning, funnel stages, or content rollouts, this slide helps keep your strategy clear and easy to follow. Fully editable and compatible with PowerPoint, Keynote, and Google Slides.


5 slides
Modern Home Layout Slides Presentation
Give your design ideas a modern edge with this clean, architectural presentation. Perfect for showcasing home layouts, interior concepts, or real estate projects, it combines structure and creativity to keep viewers engaged. Fully customizable and compatible with PowerPoint, Keynote, and Google Slides for effortless editing and professional delivery.


7 slides
E-Learning Tools Infographic Presentation
E-learning refers to any type of learning that occurs through electronic devices, and offers numerous benefits, including flexibility, cost-effectiveness, continuous learning, and environmental friendliness. This E-Learning Template is designed to make your online training and educational material more engaging and effective. The template is fully customizable and compatible with presentation software such as Powerpoint, Keynote, and Google Slides. This template is a powerful tool for anyone who wants to create engaging and effective online training and educational material!


7 slides
Performance Improvement Infographics
A Performance Improvement infographic is a visual representation of the key elements of a plan to enhance the performance of an individual, team, or organization. The purpose of this template is to communicate the plan's objectives, strategies, and metrics in an informative and engaging way. This infographic contains graphs, and diagrams to illustrate key performance indicators and other measures of success. This performance template can help motivate and engage stakeholders, highlight the benefits of performance improvement, and facilitate communication and collaboration among team members.


6 slides
360-Degree Feedback System Overview
Clearly communicate your evaluation process with the 360-Degree Feedback System Overview Presentation. Featuring a circular layout with six editable segments, this template helps visualize feedback from peers, subordinates, managers, and more. Ideal for HR reviews, performance evaluations, and leadership development programs. Fully customizable in PowerPoint, Keynote, or Google Slides.


23 slides
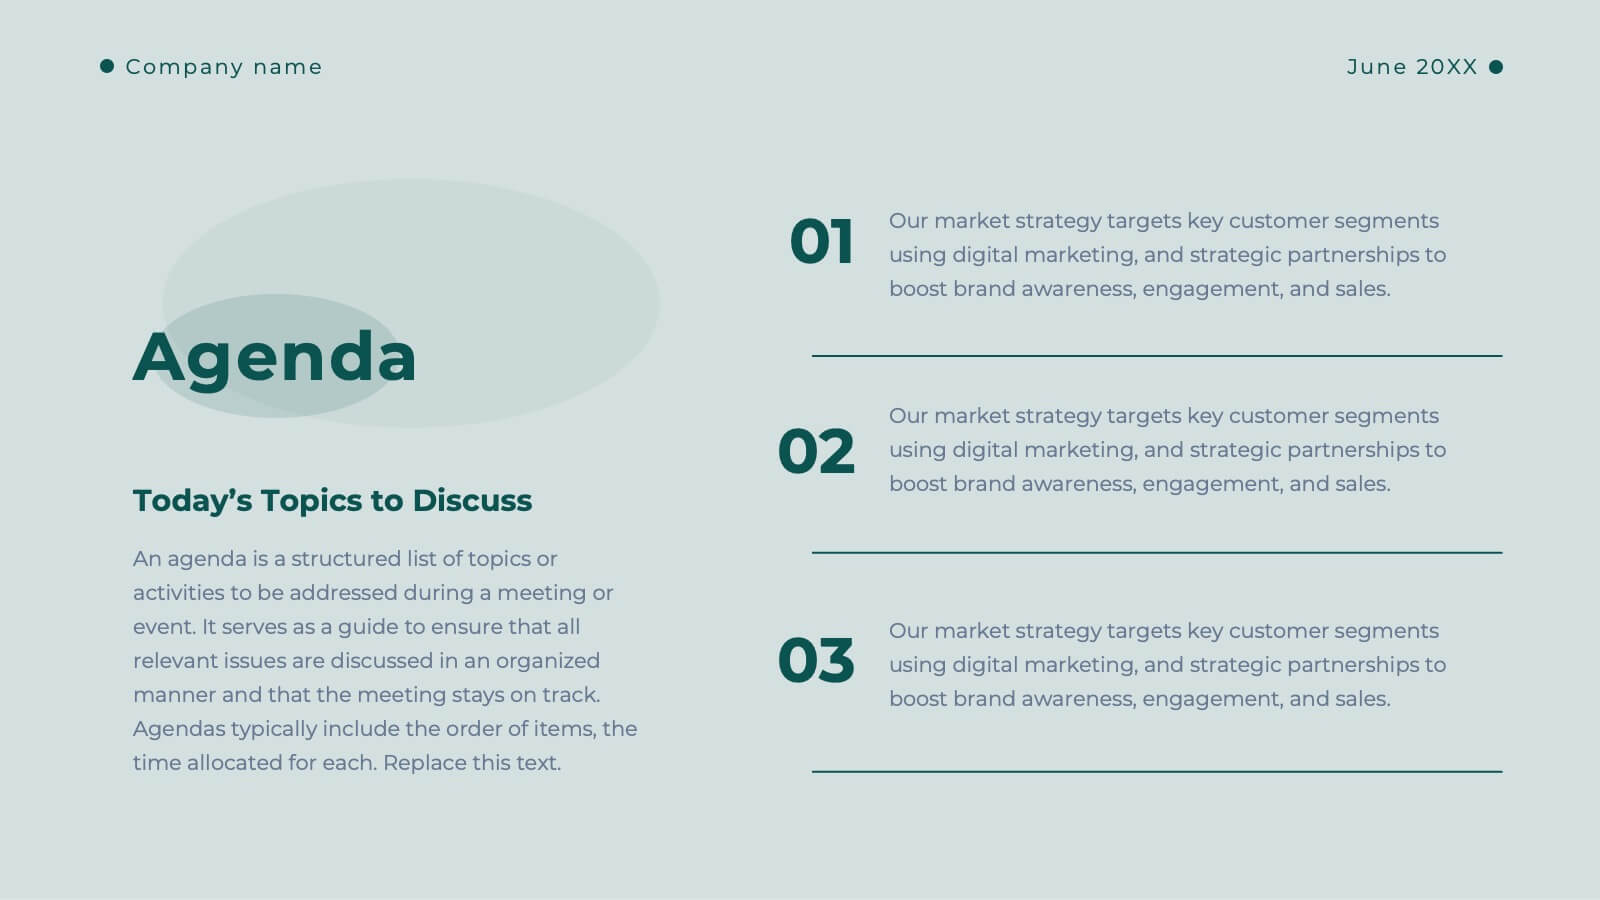
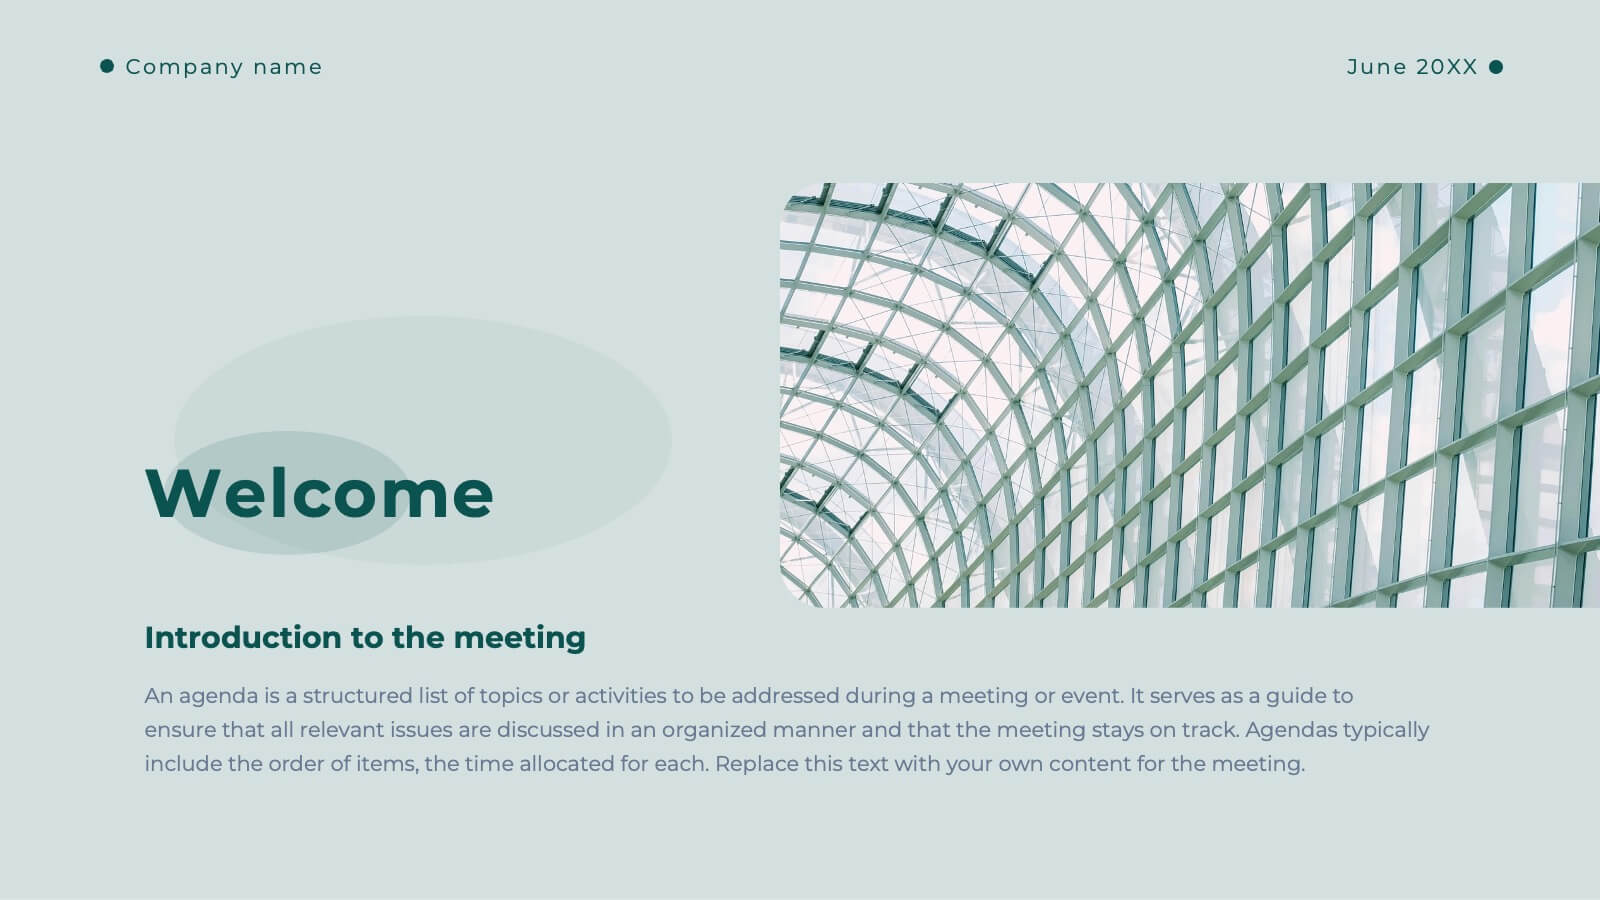
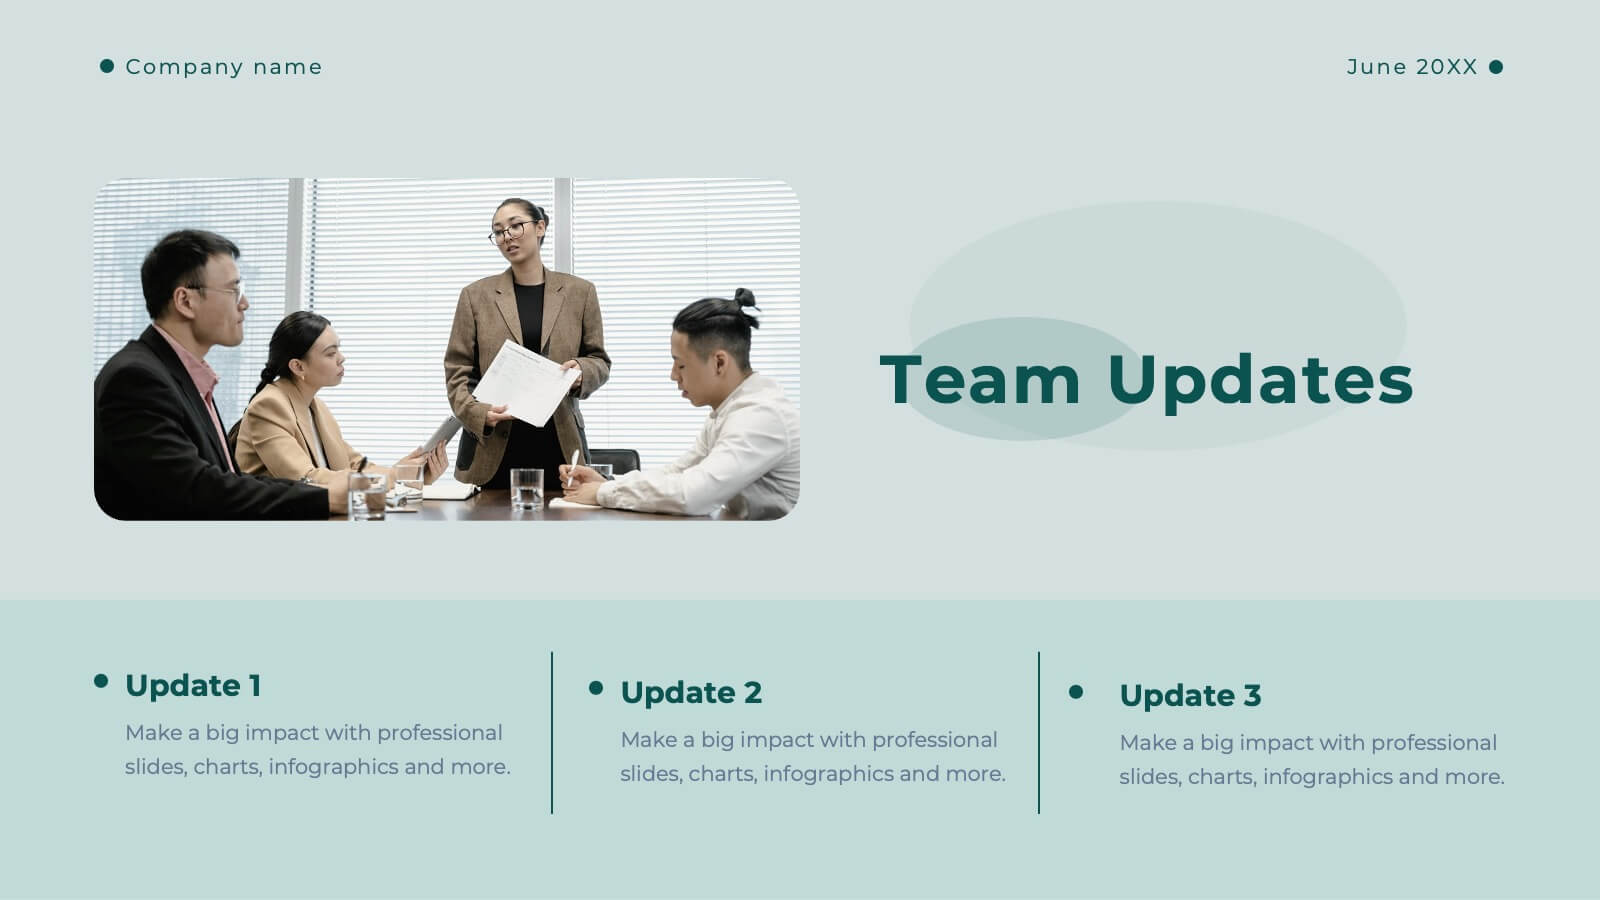
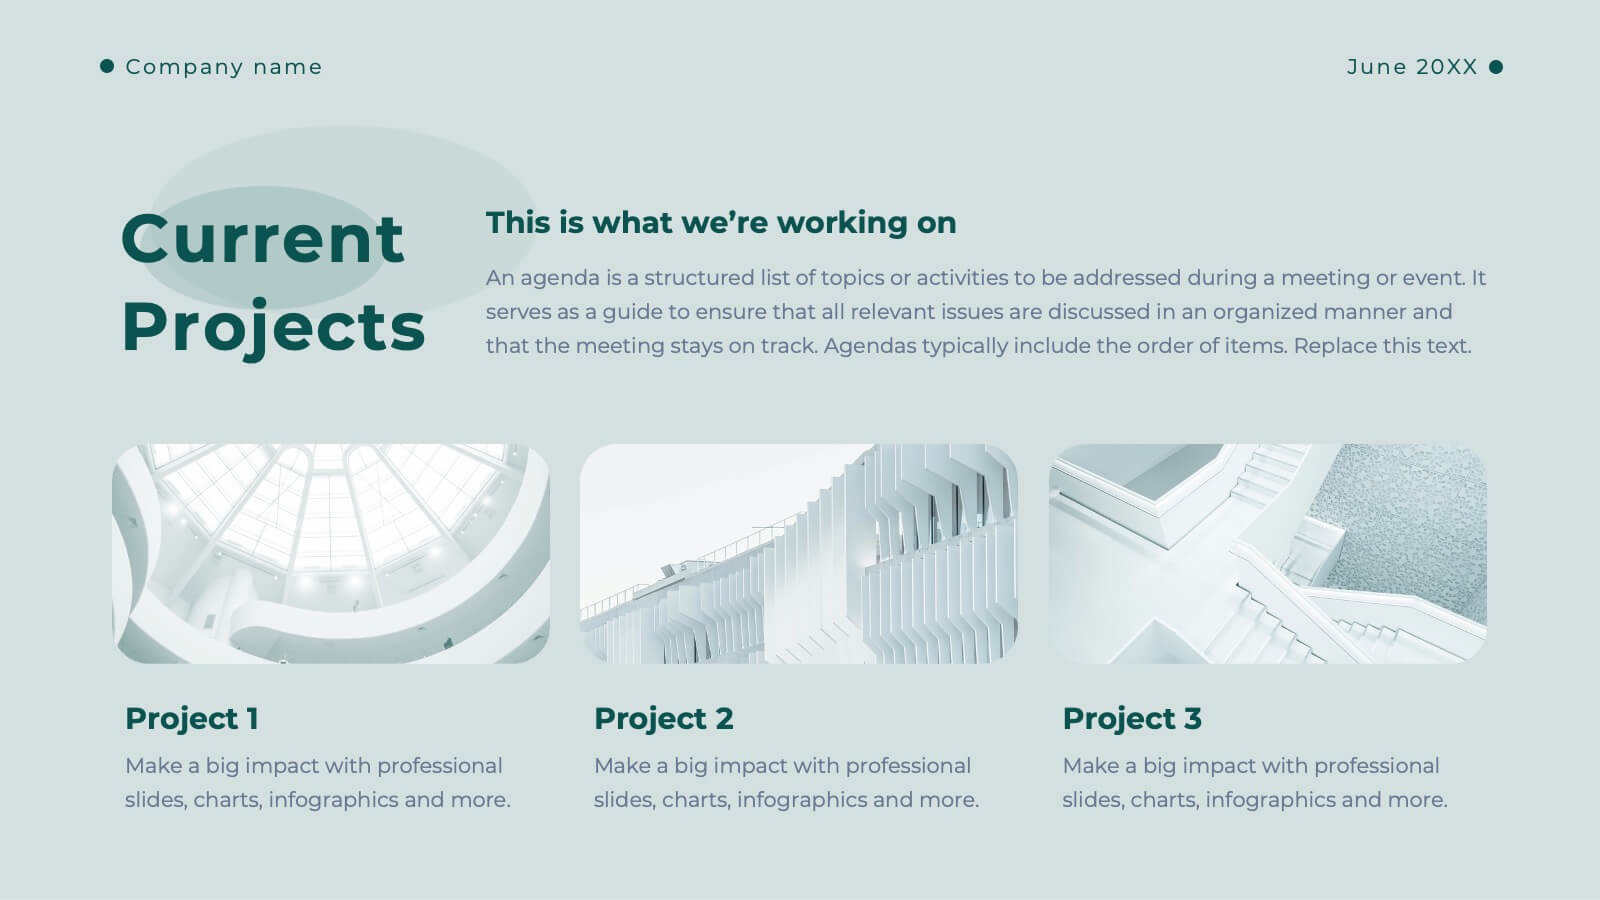
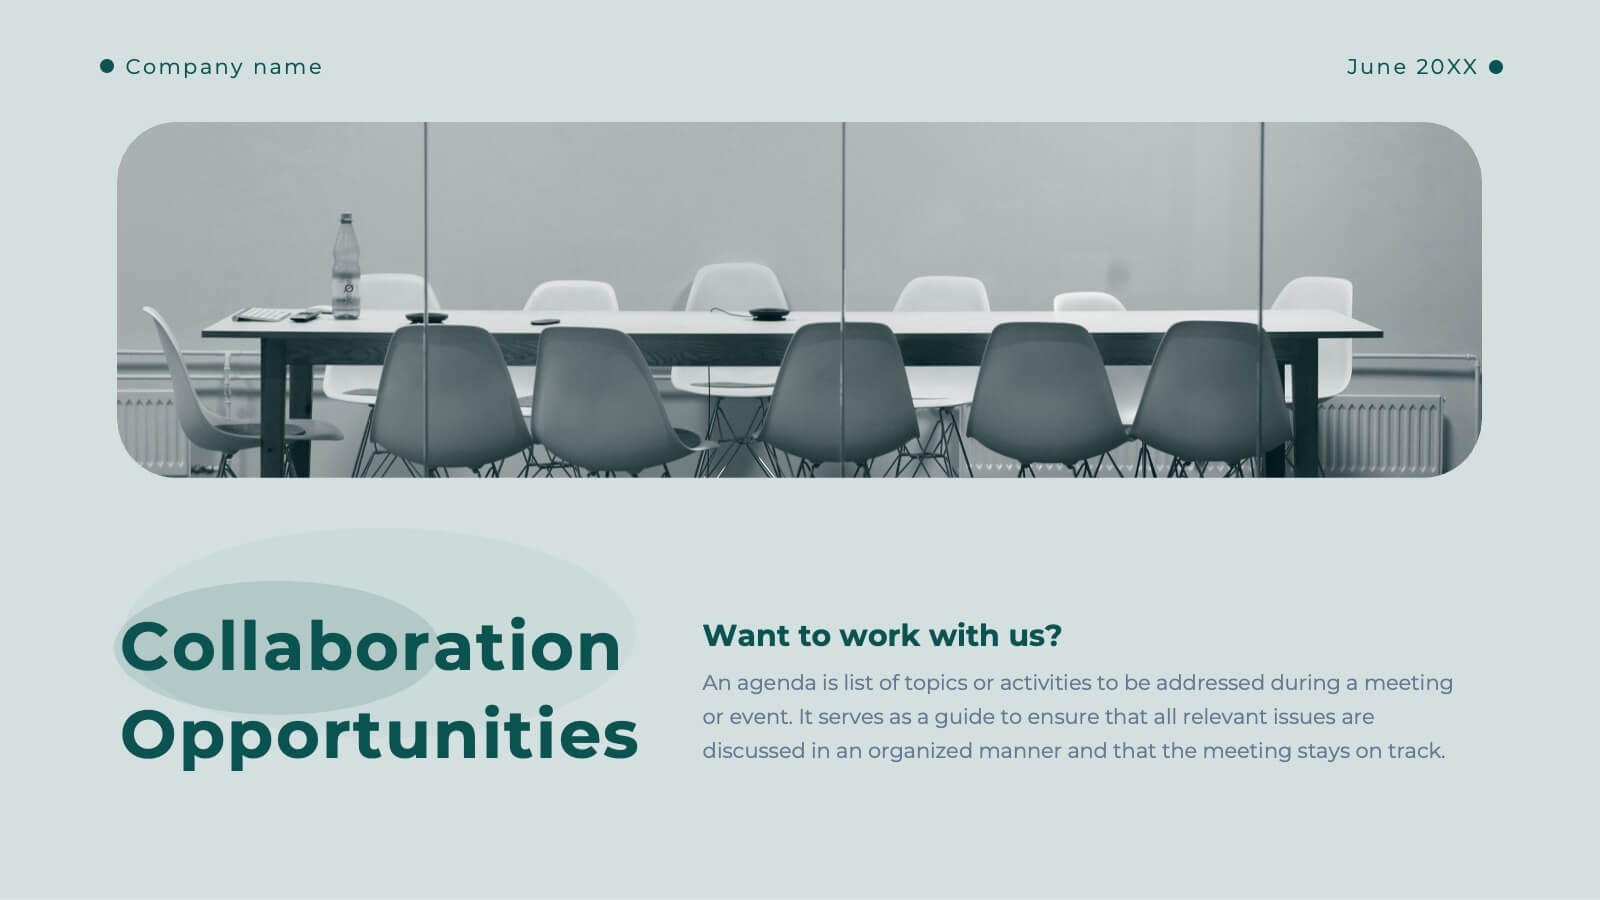
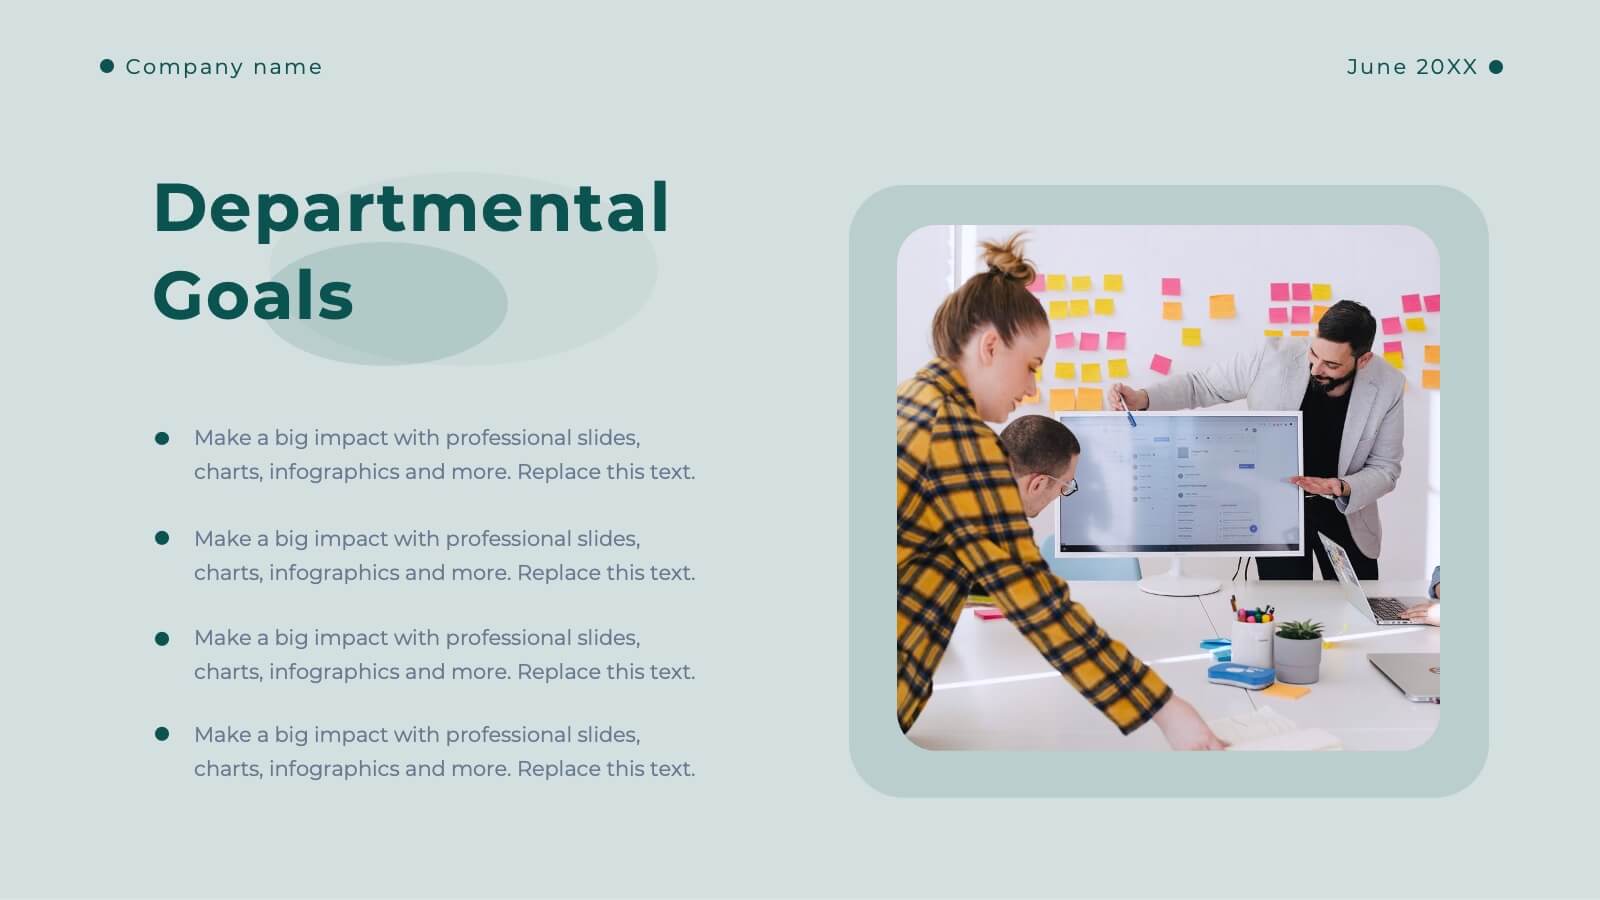
Clarity Business Operations Plan Presentation
Optimize your business operations with this sleek presentation template! Perfect for outlining team updates, key achievements, and performance metrics, it includes slides for departmental goals, process improvements, and upcoming events. Engage your team with clear visuals and detailed content. Compatible with PowerPoint, Keynote, and Google Slides for seamless presentations on any platform.


3 slides
Company Vision Roadmap Presentation
Bring your future story to life with a clear, inspiring layout that guides viewers through your long-term direction and strategic milestones. This presentation helps teams communicate purpose, goals, and planned progress in a simple, structured format that’s easy to follow. Compatible with PowerPoint, Keynote, and Google Slides.


10 slides
Results-Oriented Strategy Solutions Presentation
Drive your message home with the Results-Oriented Strategy Solutions Presentation. This layout features a presenter and chart graphic to emphasize goal tracking, performance analysis, and strategic actions. Perfect for business updates, KPIs, or coaching sessions. Fully customizable for PowerPoint, Keynote, and Google Slides.