


Features
- 10 Unique slides
- Fully editable and easy to edit in Microsoft Powerpoint, Keynote and Google Slides
- 16:9 widescreen layout
- Clean and professional designs
- Export to JPG, PDF or send by email


Do you have any questions?
Recommend


7 slides
Strategic Matrix Comparison Framework Presentation
Easily compare business risks, priorities, or strategic choices with this matrix comparison framework. Featuring editable grids for mapping likelihood and impact, it’s perfect for decision-making and performance analysis. Highlight key categories using color-coded segments. Fully customizable and compatible with PowerPoint, Google Slides, and Keynote for professional presentations.


26 slides
Networking for Success Presentation Template
Elevate your professional connections and opportunities with this sleek and impactful presentation template designed for networking success. Tailored for professionals, entrepreneurs, and career coaches, it features dynamic layouts for showcasing strategies, tools, and benefits of effective networking. The template includes sections for step-by-step guides, actionable tips, relationship-building techniques, and key metrics to measure success. With modern visuals and well-organized content, it ensures your message is both compelling and easy to follow. Highlight your ideas with infographics, timelines, and data charts to keep your audience engaged. Whether you’re conducting a workshop, pitching a business, or presenting at a seminar, this template adapts to various purposes with ease. Fully customizable and easy to edit, it ensures your presentation reflects your unique style and message. Compatible with PowerPoint, Keynote, and Google Slides, this template makes it simple to deliver a polished and professional presentation across any platform.


5 slides
Pet Care Infographics
Pet care refers to the practices and actions taken to ensure the well-being, health, and happiness of pets. These vertical infographic templates are perfect for providing essential information and tips for pet owners to ensure the well-being and proper care of their furry companions. This infographic is designed to present key aspects of pet care in a concise and engaging manner, making it a valuable resource for pet owners, veterinarians, pet stores, or any organization related to pet care. Compatible with Powerpoint, Keynote, and Google Slides. Use the text boxes and graphs to promote responsible pet ownership and provide valuable information about pet care.


8 slides
Leadership Training Workshop Presentation
Boost your team's leadership skills with our 'Leadership Training Workshop' template, perfect for structuring dynamic and effective training sessions. Designed to focus on core leadership competencies, this template supports organizations in cultivating influential leaders. It's fully compatible with PowerPoint, Keynote, and Google Slides, facilitating a seamless integration into your training curriculum.
8 slides
Business Growth and Progress Tracking Presentation
Visualize success with this upward-arrow roadmap template designed to highlight four key stages of business development. Ideal for managers, analysts, and entrepreneurs, this slide uses milestone icons and clean, directional layout to emphasize progress. Fully editable in PowerPoint, Keynote, and Google Slides for seamless customization.


5 slides
Business Success Case Study Presentation
Showcase impactful results with the Business Success Case Study Presentation template. This structured layout highlights key milestones, challenges, and solutions in a visually engaging format, making it perfect for demonstrating business achievements and growth strategies. Fully editable and compatible with PowerPoint, Keynote, and Google Slides, it’s ideal for case studies, reports, and business reviews.


26 slides
Aedele Presentation Template
We all know how important food is, it's the center of life. We plan our days around food, we travel to eat food and our emotions are often tied up in food. This template was designed for people who love food and know how important it is to stand out from the crowd when it comes to the culinary world. Whether you're an investor, a food critique, a restaurant owner or simply a foodie we have all the classy modern slides you need to really make an impact on your audience and make sure your message doesn't get lost amongst all the other exciting talks and presentations at your next pitch meeting.


5 slides
Corporate Risk Assessment Slide Presentation
Streamline complex evaluations with a clean, step-by-step visual that guides your audience through key business risks and mitigation strategies. Ideal for planning sessions or executive reports, this modern design helps simplify communication and enhance decision-making. Fully compatible with PowerPoint, Keynote, and Google Slides for seamless editing and presentation.


21 slides
Dreamwood Sales Pitch Deck Presentation
Deliver powerful sales presentations with this vibrant and engaging sales pitch deck template! It provides all essential sections, including sales objectives, customer testimonials, pricing strategy, and performance metrics, to help you leave a lasting impact. Perfect for business teams and client pitches, it’s compatible with PowerPoint, Keynote, and Google Slides for seamless customization.


6 slides
Market Challenges and Resilience Strategy Presentation
Tackle volatility with clarity using the Market Challenges and Resilience Strategy presentation. This slide features a modern smartphone graphic surrounded by six key strategy zones, each with its own icon and text area—ideal for outlining market pressures, competitive moves, or adaptive responses. Use it to communicate resilience frameworks, digital transformation steps, or scenario planning. Fully customizable in PowerPoint, Keynote, and Google Slides.


7 slides
Business Process Checklist
Simplify workflow tracking with this visual business process checklist slide. Featuring circular progress bars and bold letter labels (A–C), this template helps visualize task completion percentages for up to six steps. Perfect for audits, quality checks, or operational reviews. Fully customizable in PowerPoint, Keynote, and Google Slides.
21 slides
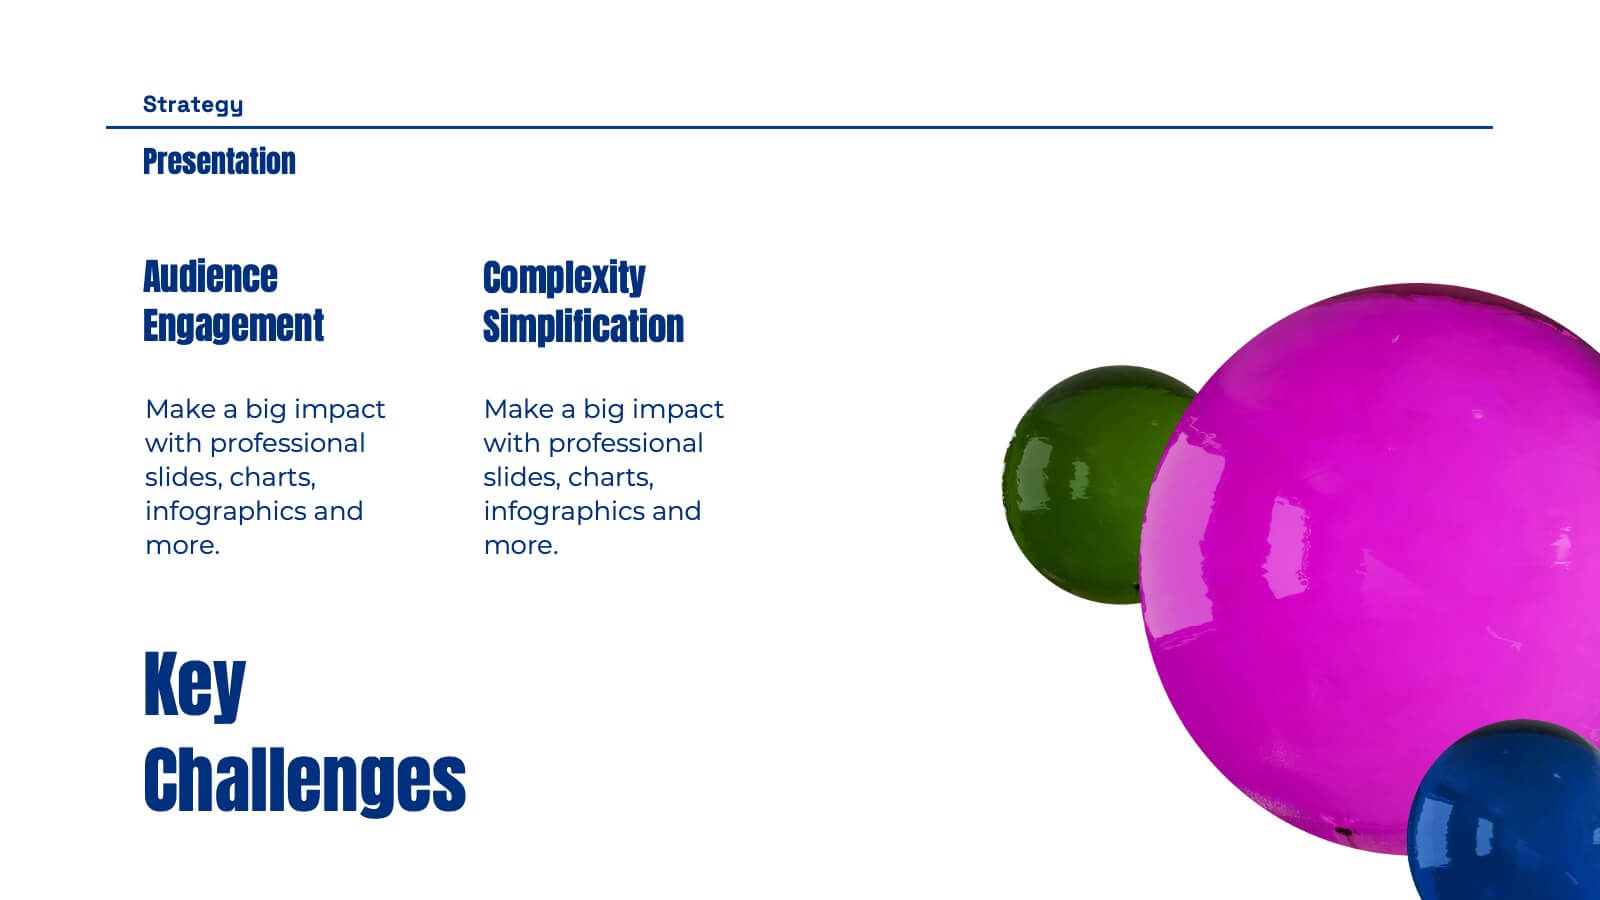
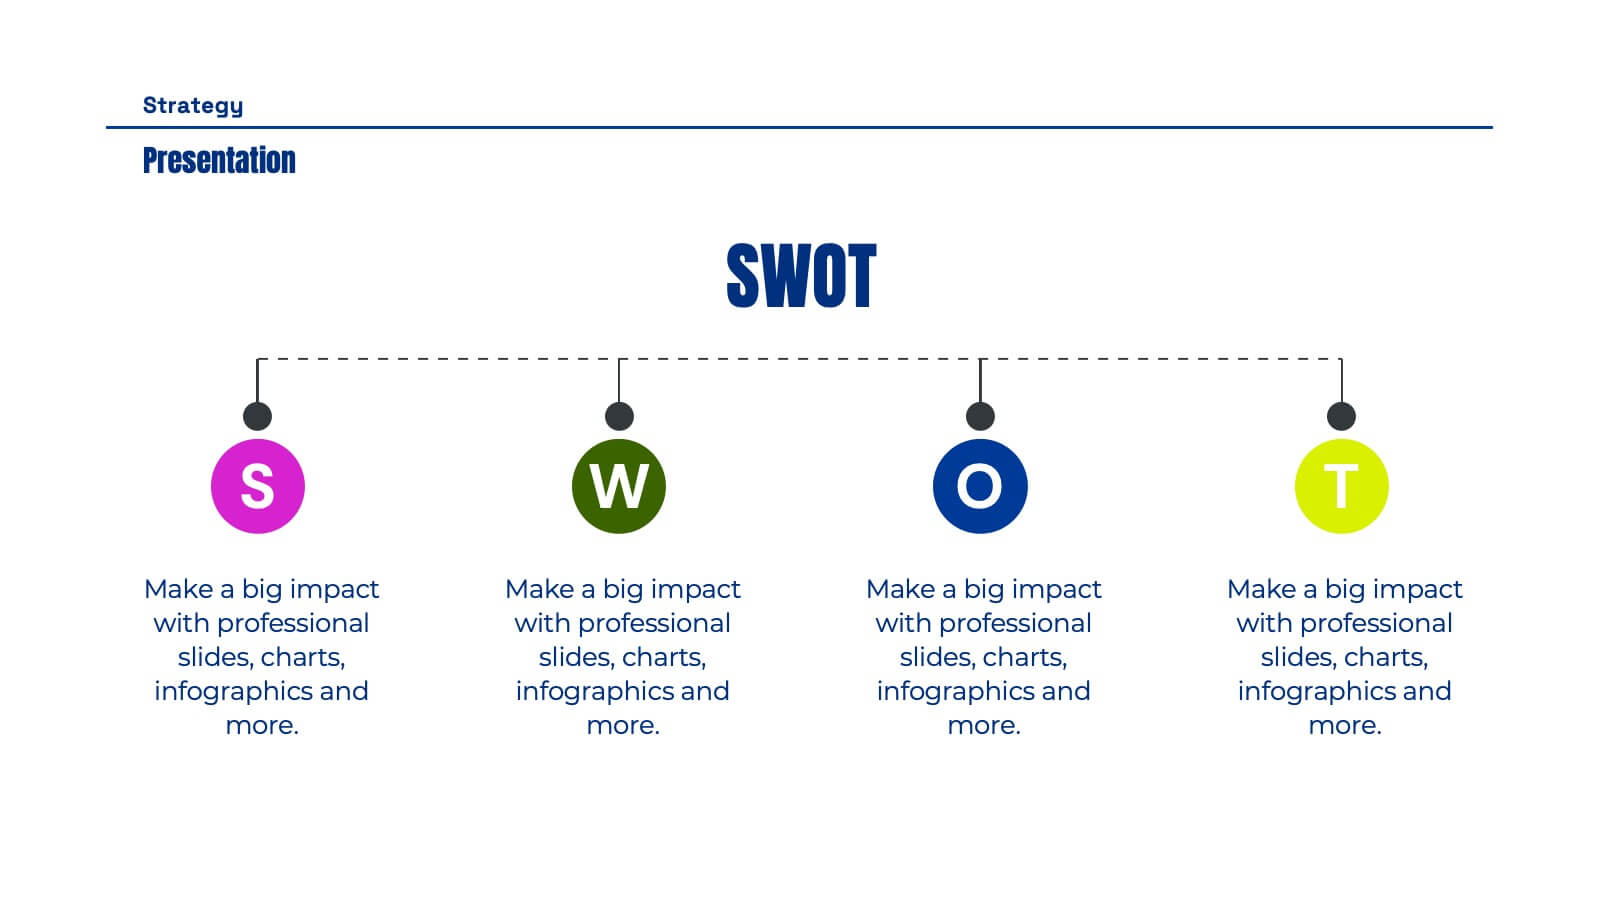
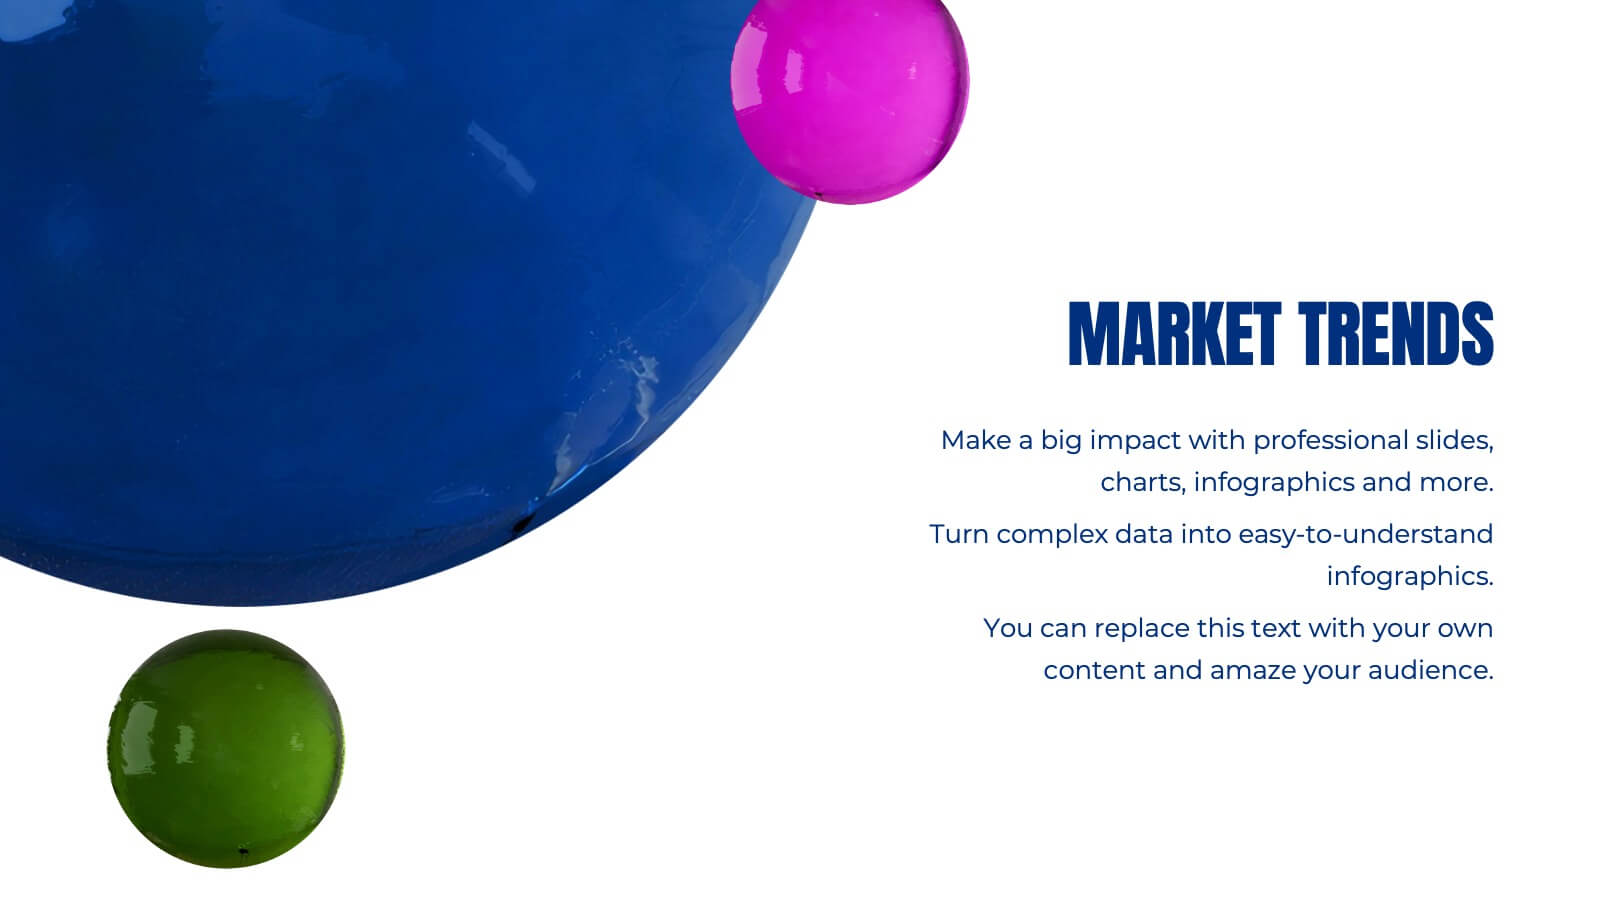
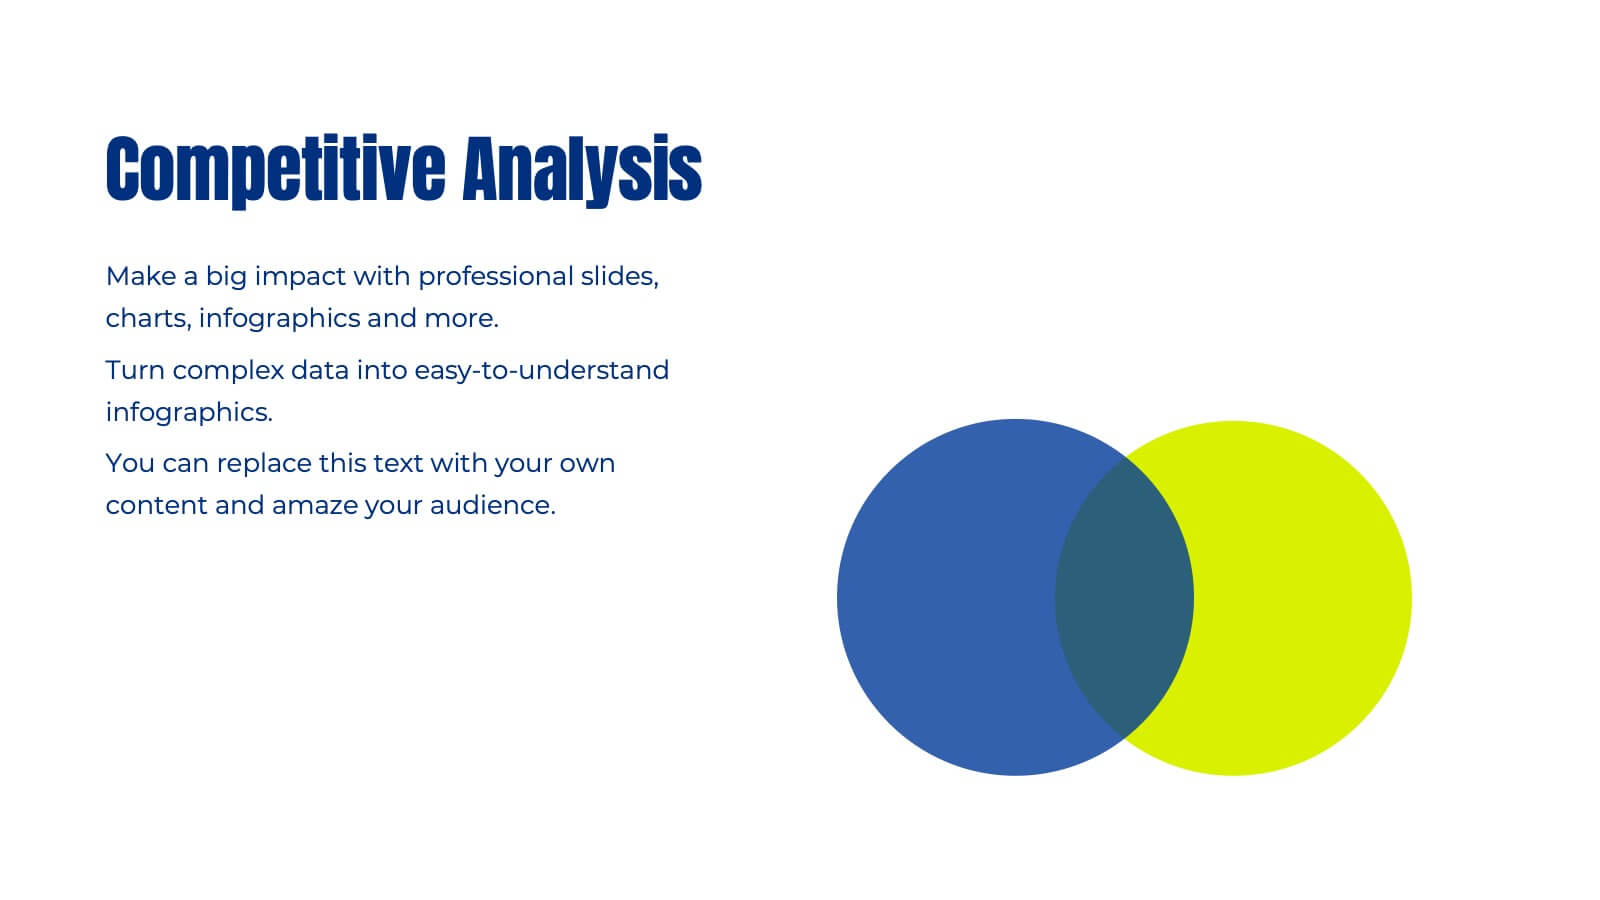
Ops Business Strategy Presentation
Set your strategy in motion with this dynamic, visually striking presentation template! Perfect for conveying key business insights like competitive analysis, market trends, and strategic objectives, it helps organize your plan for success. Each slide focuses on clarity and effectiveness, making it ideal for impactful presentations. Compatible with PowerPoint, Keynote, and Google Slides for effortless use across platforms.


6 slides
Clear Roadmap and Action Strategy Presentation
Present your strategic roadmap with clarity using this arrow-step diagram. Ideal for visualizing processes, workflows, or goal-driven action plans. The curved sequence highlights five progressive steps with icons and color coding. Fully customizable in PowerPoint, Keynote, or Google Slides—perfect for business strategy meetings, project planning, or milestone tracking.


7 slides
Project Status Infographic Presentation Template
Project status reports are a great way for project managers to track the progress of their projects and identify risks, challenges and opportunities. They can also help stakeholders better understand what’s going on in the project. They are a critical part of the project documentation system. They allow you to monitor the state of your project’s progress, efficiently share information with upper management and help everyone involved understand where things stand. You can use project status reports to guarantee that you have a constant information flow and higher productivity.


6 slides
Organizational Structure Framework Presentation
Unlock the potential of your organization with our Organizational Structure Framework template. This versatile tool is designed to help you present and analyze various business structures, from chain-of-command to functional divisions. Ensure clear, concise communication of strategies across your organization. Perfect for use in PowerPoint, Keynote, and Google Slides, this template supports a professional presentation of your organizational strategy, ensuring alignment and clarity in your business processes.


6 slides
Corporation Schedule Infographics
Elevate your corporate presentations with our Corporation Schedule infographic, expertly designed for compatibility with Powerpoint, Keynote, and Google Slides. This practical and polished infographic is an exceptional resource for managers, team leads, and event coordinators planning and presenting schedules, timelines, and agendas. The infographic is structured to visually organize and communicate a corporation's schedule, making it an invaluable tool for outlining project timelines, meeting agendas, or corporate event itineraries. Its clear, concise format is specifically tailored to the business environment, where readability and quick comprehension are paramount. Integrating this infographic into your presentation will not only enhance its professional appearance but also facilitate effective time management and ensure alignment across teams. Whether you’re detailing a week-long conference schedule or outlining a project’s phases, this infographic provides a streamlined approach to sharing that information with your audience. It’s a strategic way to keep everyone informed and focused on the company's key timeframes and objectives.


5 slides
Big Data Interpretation and Metrics Presentation
Break down complex data into digestible segments with the Big Data Interpretation and Metrics Presentation. Featuring a puzzle-inspired layout, this template is ideal for illustrating interconnected data points, analytics strategies, or metric-based frameworks. Fully customizable in PowerPoint, Keynote, and Google Slides.