


Features
- 6 Unique slides
- Fully editable and easy to edit in Microsoft Powerpoint, Keynote and Google Slides
- 16:9 widescreen layout
- Clean and professional designs
- Export to JPG, PDF or send by email


Do you have any questions?
Recommend


6 slides
Machine Learning Systems Overview
Get ready to light up your next tech talk with a bold, clean layout that simplifies even the most complex systems. This infographic presentation template is designed to break down how intelligent algorithms function, analyze data, and learn patterns—perfect for explaining how machine learning fits into real-world applications. Each slide uses smart visuals and icons to guide viewers through each system stage with clarity. Ideal for educators, developers, or startups pitching AI-powered solutions, it’s a creative and professional way to keep your audience engaged. Fully compatible with PowerPoint, Keynote, and Google Slides.


5 slides
5 Whys Analysis Slide Presentation
Unlock problem-solving clarity with a vibrant, puzzle-style layout that helps teams dig deeper and uncover the true reason behind any challenge. This presentation guides viewers through each “why” step in a simple, structured flow, making root-cause insights easy to communicate. Fully compatible with PowerPoint, Keynote, and Google Slides.


26 slides
Kimbr Presentation Template
Kimbr is a modern and simple Powerpoint template that uses bold text in order to immediately catch your audience’s attention and let them focus on your innovative ideas. Combined with the modern and minimalistic style of Kimbr, this presentation packs a punch in the minimalism department: It comes with unique and modern slides perfect for Spa businesses or anyone looking for a clean minimal presentation. In addition, it has Charts, timelines and image placeholders, you'll be sure to find a space for all your information. Don't wait any longer and get started presenting your ideas today.


6 slides
Post Office Scenes Infographics
The "Post Office Scenes" infographic template, designed for PowerPoint, Keynote, and Google Slides, is an ideal tool for postal services, logistics companies, and educational settings. This engaging template provides a detailed overview of everyday activities in a post office, making it perfect for a range of presentations. This template showcases key aspects of post office operations, including mail sorting, customer service interactions, and package handling. Its design is structured to convey the intricacies of postal services in an easy-to-understand and visually appealing manner. This makes it highly effective for training purposes, educational presentations, or explaining postal logistics in corporate environments. Adopting a professional color scheme that reflects the atmosphere of a postal service, the design is both thematic and informative. It captures the essence of a post office environment, enhancing the educational impact of the presentation. Whether used for staff training, classroom teaching, or corporate presentations, this template ensures a comprehensive and clear understanding of post office scenes and operations.


21 slides
Juno UX Case Study Presentation
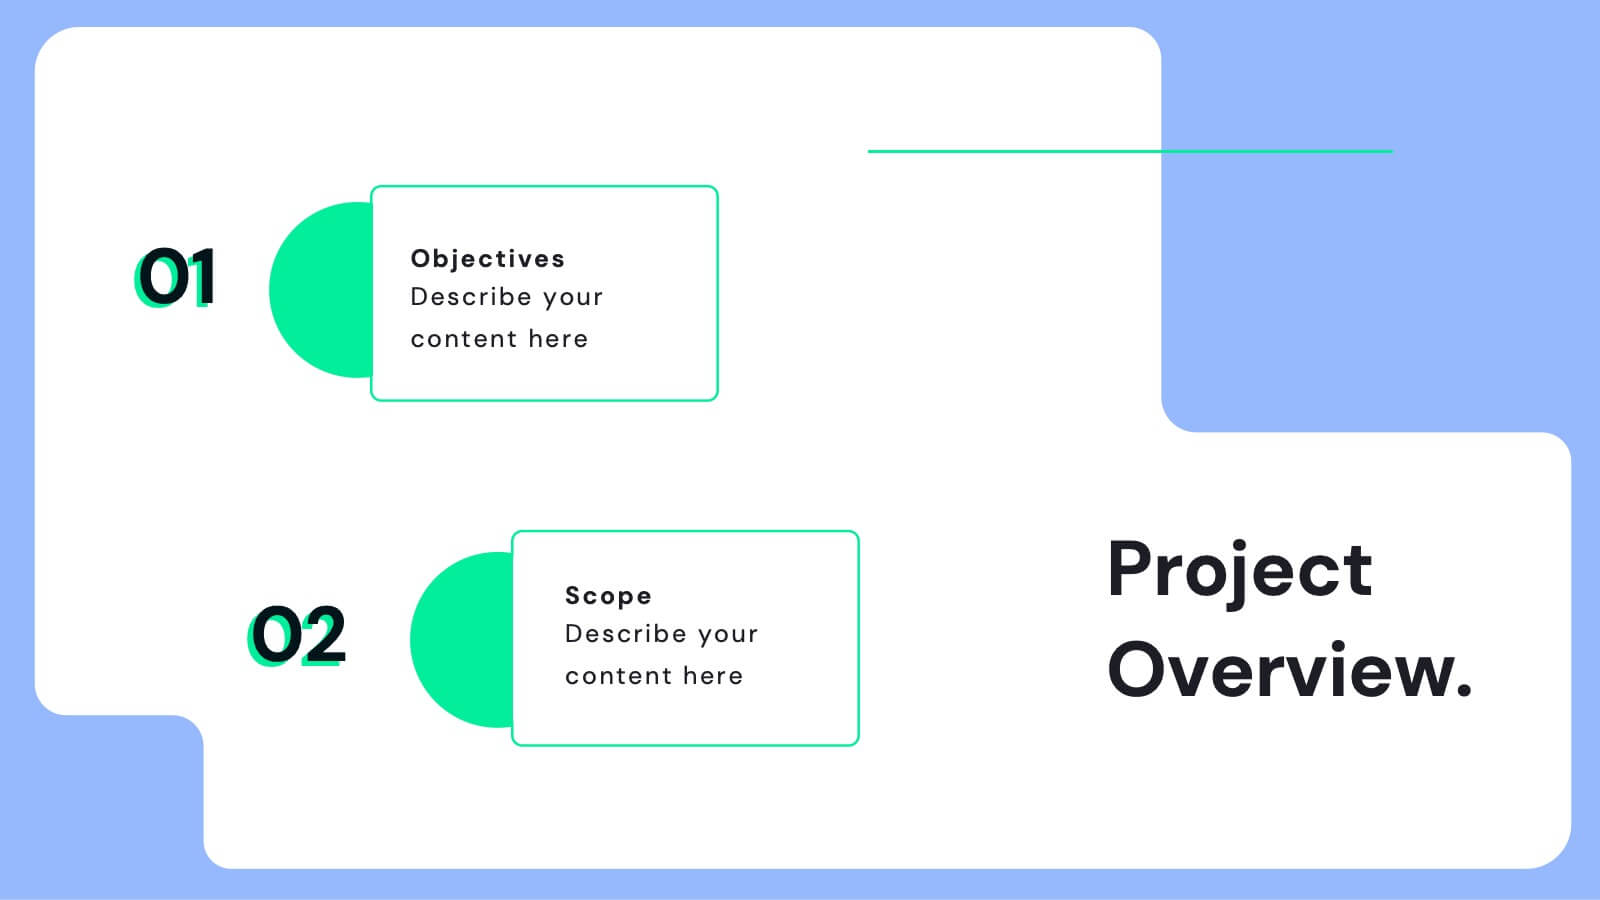
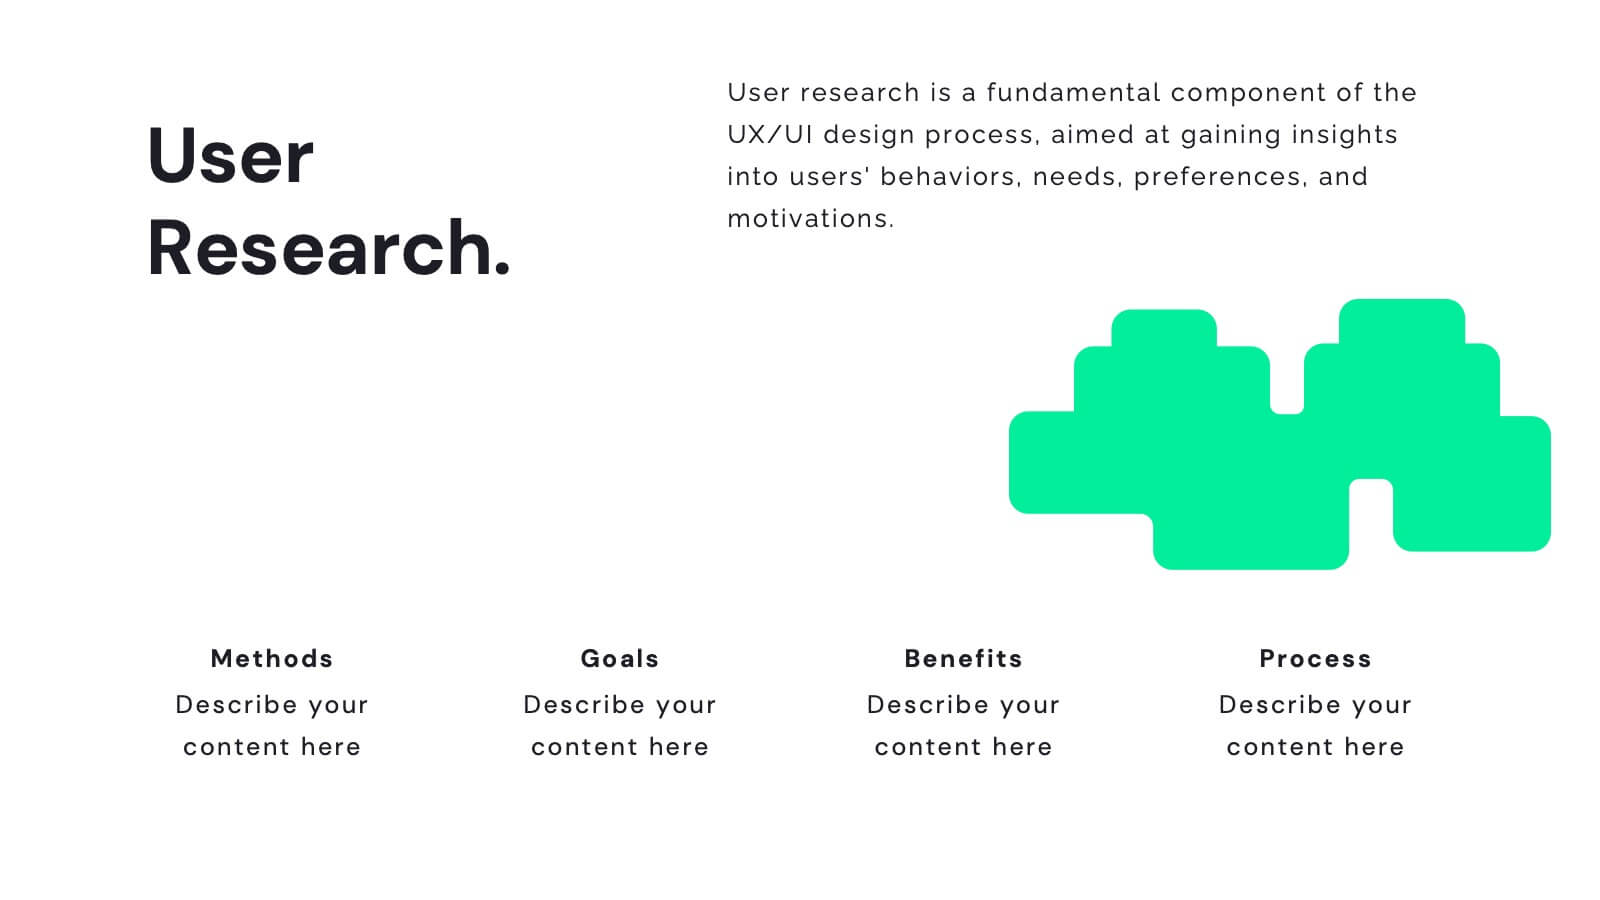
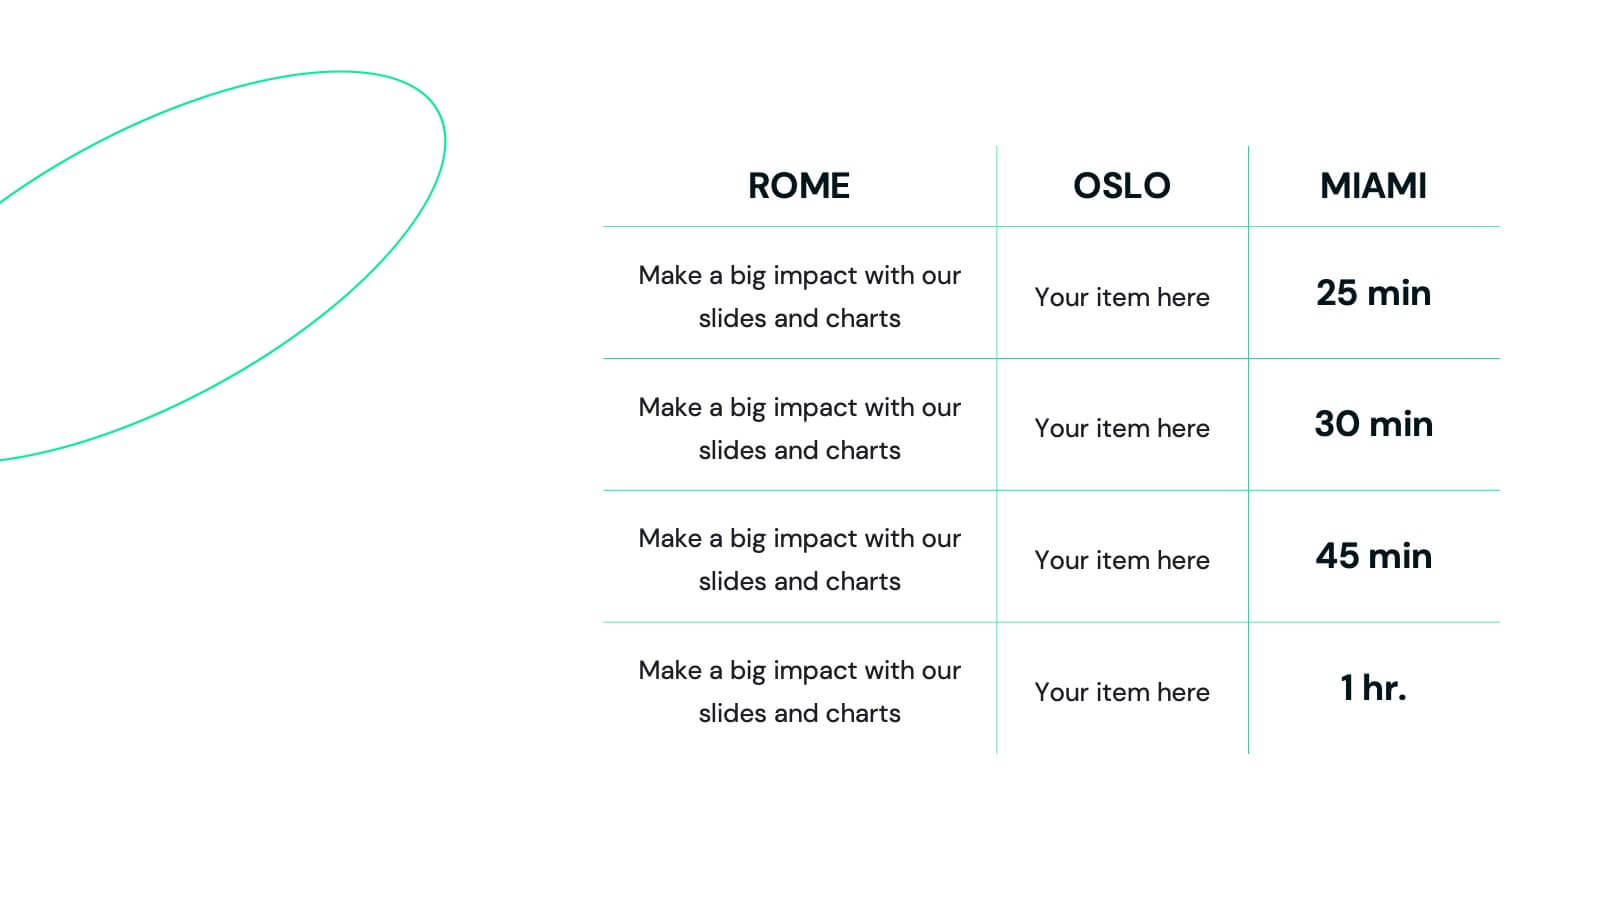
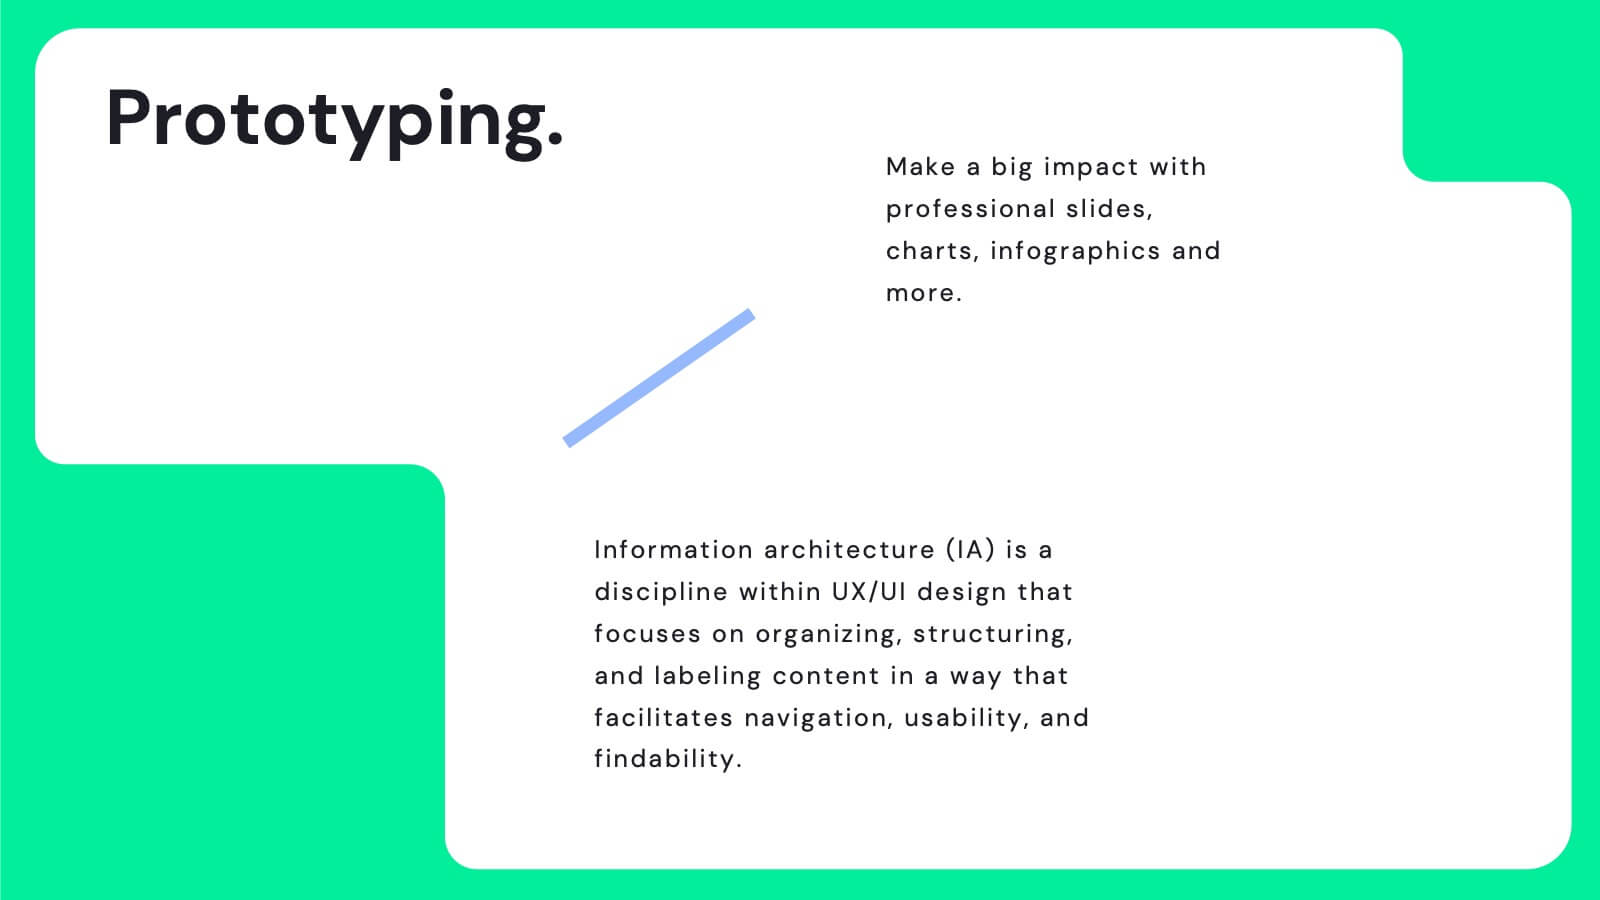
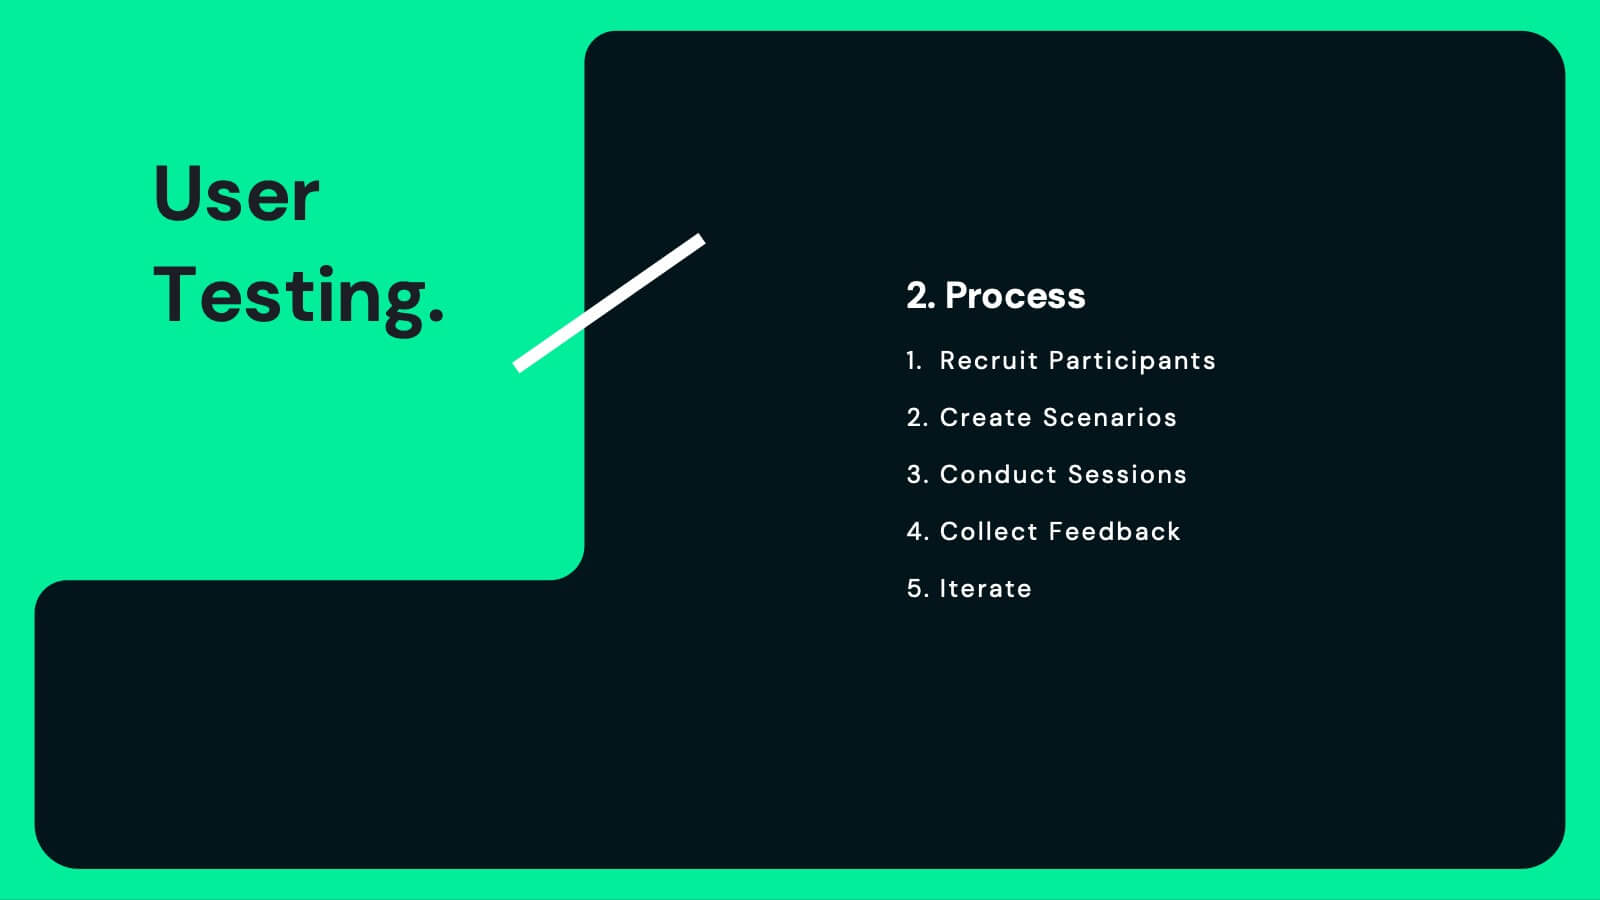
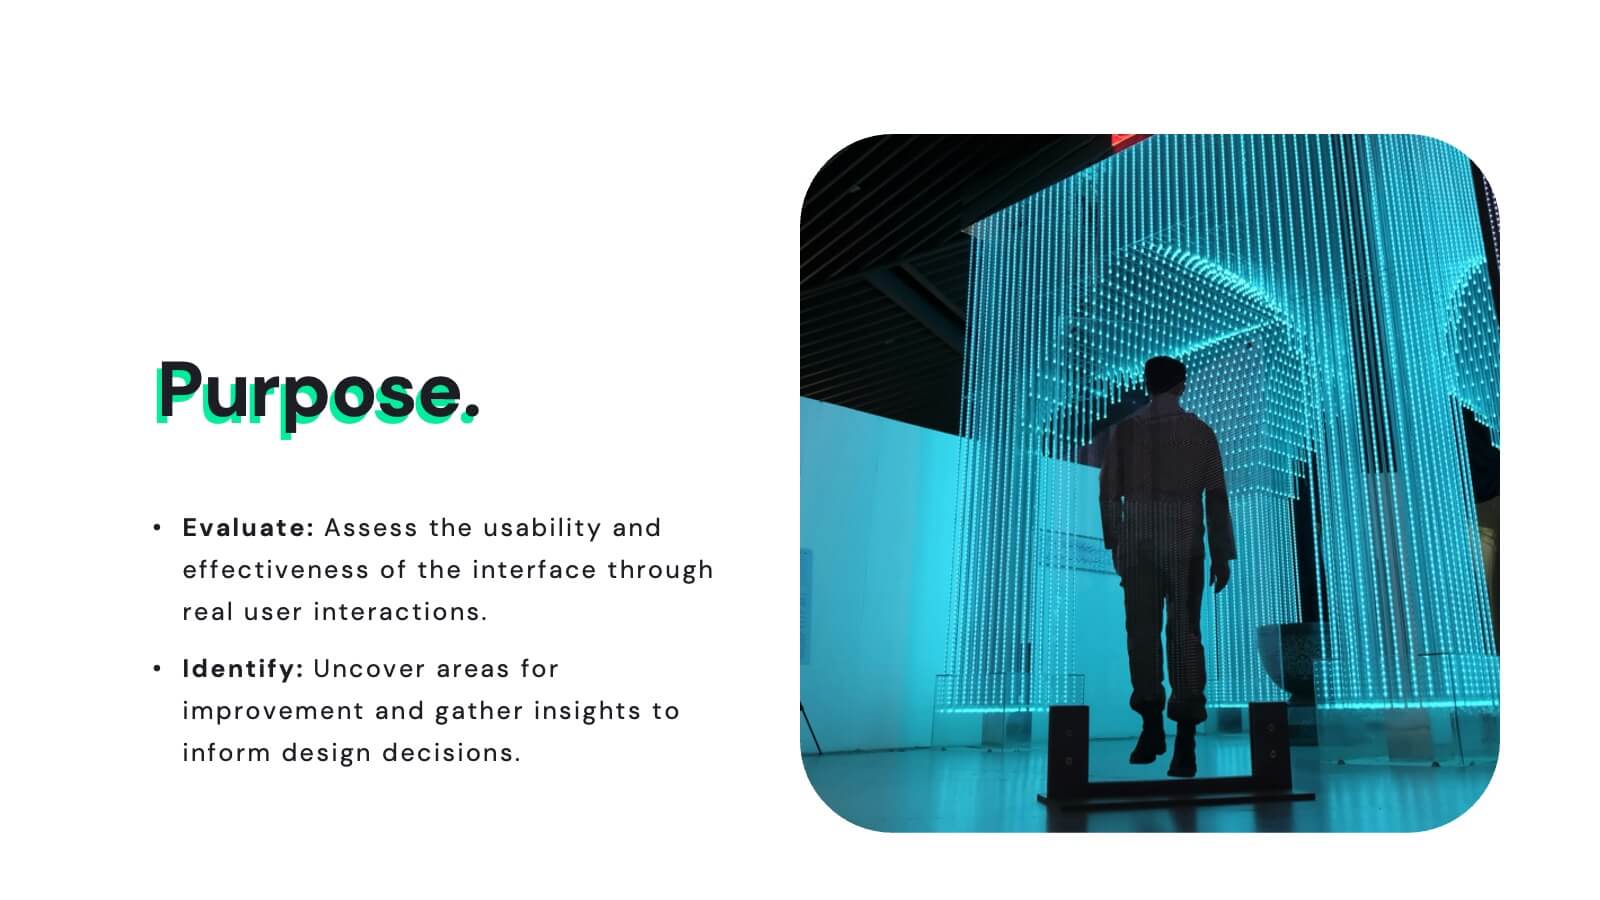
Enhance your UX presentations with this sleek, user-friendly template designed for showcasing detailed case studies and user research. With a modern layout and clear sections for user journey mapping, prototyping, and usability guidelines, this template ensures a professional and engaging presentation. Compatible with PowerPoint, Keynote, and Google Slides, it's perfect for any platform.


21 slides
Somnara Full-Service Agency Project Plan Presentation
Present your agency’s expertise with a comprehensive project plan template designed to impress clients and stakeholders. This sleek and professional layout allows you to outline your mission and vision, highlight team strengths, and showcase core services with clarity. Use the client testimonials and case studies sections to establish credibility and trust. Visualize your strategic approach with dedicated slides for market analysis, creative process, and execution strategy. The template also includes detailed sections for partnership opportunities, social responsibility initiatives, and a future outlook, ensuring a holistic view of your agency’s capabilities and forward-thinking approach. Fully editable and compatible with PowerPoint, Google Slides, and Keynote, this template is perfect for full-service agencies seeking to elevate their presentations. Customize each slide to reflect your unique value and deliver impactful, results-oriented proposals.


6 slides
Sales Funnel Strategy Presentation
Clearly map your marketing efforts with this Sales Funnel Strategy Presentation. Featuring a bold, inverted funnel design with six customizable layers, this slide is perfect for illustrating your lead nurturing stages—from prospecting to conversion. Each segment includes editable titles and icons, making it ideal for PowerPoint, Keynote, or Google Slides. Great for sales teams, marketers, and strategists looking to drive results.


5 slides
Strategic Budget Planning Forecasting
Tired of messy spreadsheets? This clean and creative template makes budget forecasting easier to visualize and share. Centered around a playful piggy bank illustration, it lets you outline strategic goals, savings plans, and key metrics in a format that’s easy to follow. Fully compatible with PowerPoint, Keynote, and Google Slides.


3 slides
Hierarchy of Needs Pyramid Visual Presentation
Simplify complex priorities with this Hierarchy of Needs Pyramid Visual presentation. Designed to illustrate layered structures or business priorities, this editable 3D-style pyramid highlights three distinct tiers with customizable text and bold letter labels. Perfect for strategy slides or organizational models in Canva, PowerPoint, or Google Slides.


26 slides
Managing Work-Life Balance Presentation
Find harmony between career and personal life with this insightful presentation on managing work-life balance. Covering key strategies like time management, stress reduction, remote work efficiency, and self-care practices, this template helps promote productivity and well-being. Fully customizable and compatible with PowerPoint, Keynote, and Google Slides for a seamless and engaging presentation experience.


20 slides
Miragyn Project Proposal Presentation
Showcase your project proposal with confidence using this visually appealing and structured template. Featuring a clear layout, it includes slides for project summaries, problem statements, and proposed solutions, allowing you to effectively communicate your vision and strategy. This template highlights essential details such as objectives and goals, timeline and milestones, and budget breakdown, making it ideal for delivering concise and impactful proposals. It also includes dedicated sections for team expertise, client testimonials, and terms and conditions, ensuring every aspect of your project is covered. Fully editable and compatible with PowerPoint, Google Slides, and Keynote, this template is perfect for professionals aiming to leave a lasting impression with their project presentations.


8 slides
Agriculture Business Model Presentation
Turn your ideas into growth with this vibrant and modern presentation design. Perfect for explaining market strategies, production cycles, or investment models in agriculture, it helps visualize key stages from concept to harvest. Fully customizable and compatible with PowerPoint, Keynote, and Google Slides for a seamless presentation experience.


23 slides
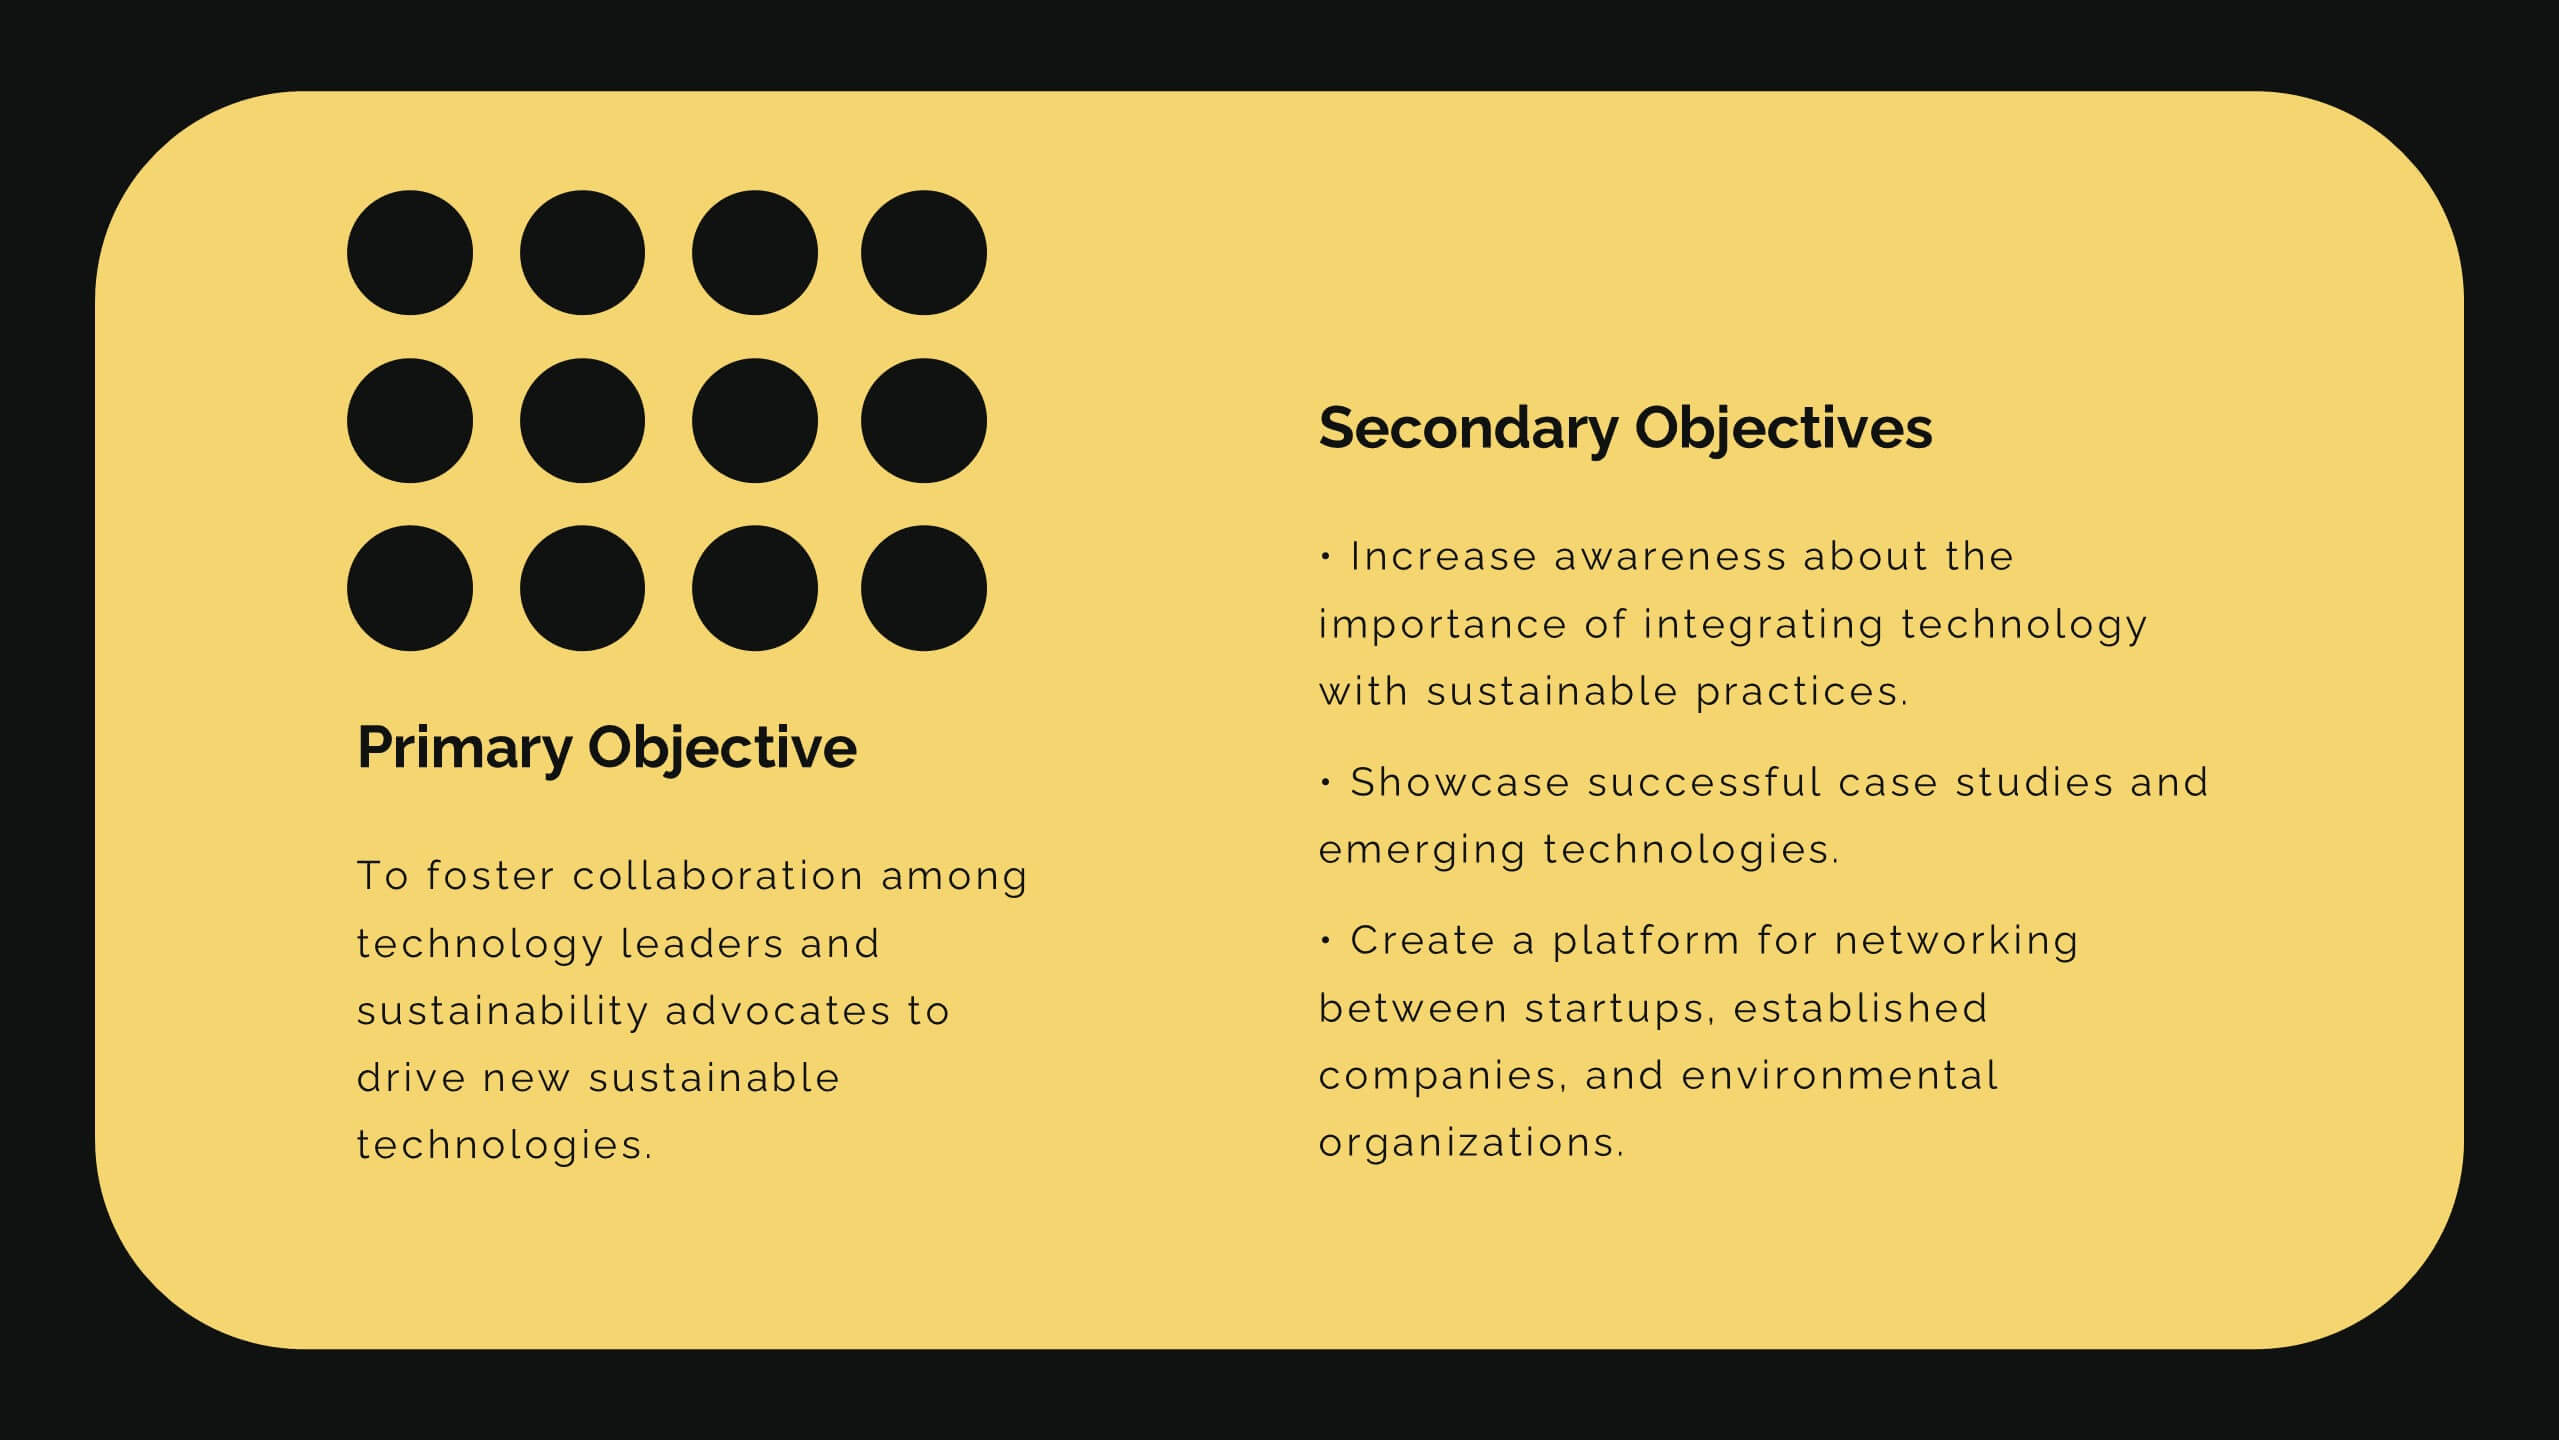
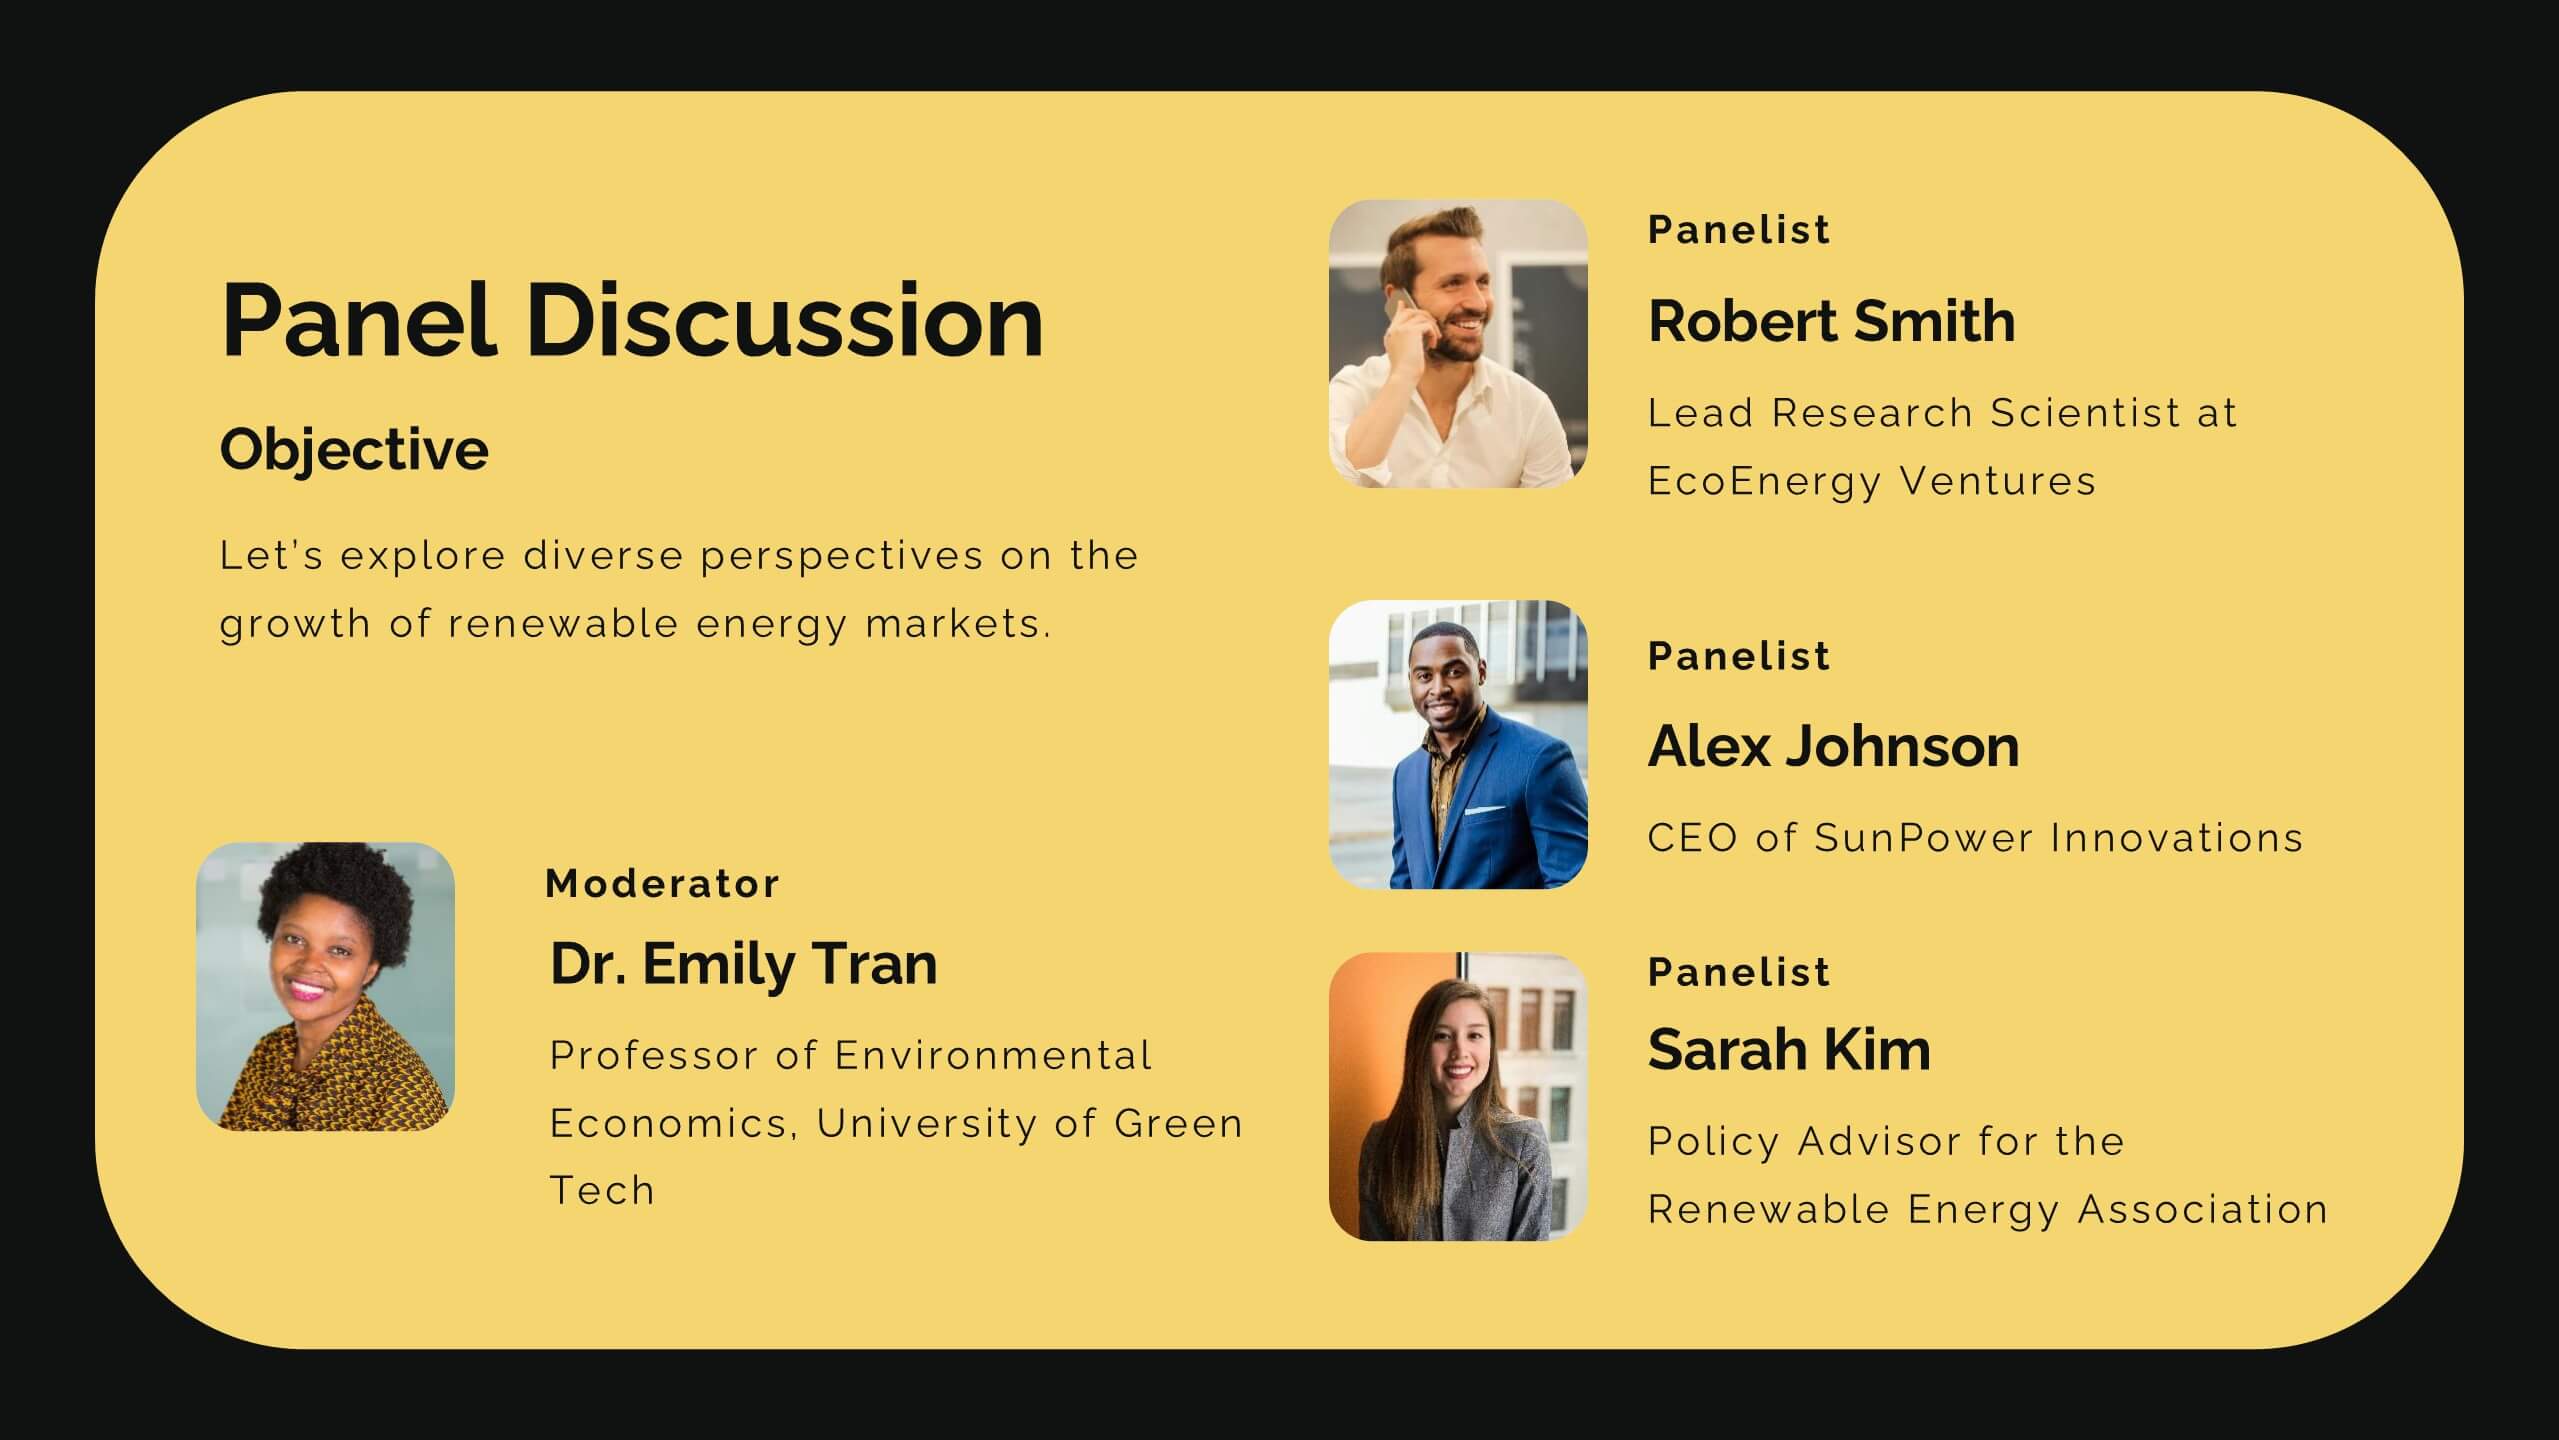
Diamond Business Development Proposal Presentation
Unlock the potential of your business proposals with this bold and engaging presentation template! Perfect for business development pitches, conferences, and workshops, it includes sections for speaker introductions, panel discussions, and session breakdowns. With its clean and professional design, this template ensures clarity and impact. Fully customizable and compatible with PowerPoint, Keynote, and Google Slides.


10 slides
Market Trends and Expansion in Oceania Map Presentation
Unlock new opportunities with the Market Trends and Expansion in Oceania Map template, which visualizes economic growth across the region while highlighting key market trends and expansion potentials.This essential business tool is designed for clarity and impact, compatible with PowerPoint, Keynote, and Google Slides, making it versatile for diverse presentation needs.


7 slides
Process Solution Infographic
Streamline intricate workflows with our process solution infographic. Anchored in a pristine white base and infused with varying shades of professional blue, our template elegantly delineates step-by-step solutions and systematic approaches. Decked with meticulous infographics, representative icons, and versatile image placeholders, it transforms complexities into a navigable visual journey. Masterfully curated for Powerpoint, Keynote, or Google Slides. An invaluable asset for process managers, business analysts, strategists, or any organization keen on optimizing workflows. Navigate processes with confidence; let each slide chart the path to optimized solutions.


26 slides
Casey Presentation Template
Casey is a professionally designed modern, clean, and bold PowerPoint template that’s a great way to show off your data or highlight your services. This product is perfect for corporate customers who need an easy-to-edit template with bold colors and clean designs. With its easy to read charts, visible text, and bright colors this template will really captivate your audience. A perfect way to visualize your data and present your company in style to keep your audience engaged. Whether you are trying to get attention or just make your business stand out, this template will help you achieve that.


6 slides
Brain Vector Infographic
This Brain Vector Infographic is an imaginative tool for presenting complex concepts and ideas in an easy-to-digest visual format. The design employs brain imagery to symbolize various aspects of thought processes, intelligence, brainstorming, or mental health. Its sections are strategically placed to reflect different cognitive areas, making it perfect for educational settings or business workshops focused on innovation. Fully editable and compatible with PowerPoint, Google Slides, and Keynote, this template allows for full customization, from colors to text, adapting to your unique presentation needs. Whether for academic, or personal use, this infographic simplifies conveying intricate information.