


Features
- 5 Unique Slides
- Fully editable and easy to edit in Microsoft Powerpoint, Keynote and Google Slides
- 16:9 widescreen layout
- Clean and professional designs
- Export to JPG, PDF or send by email


Do you have any questions?
Recommend


5 slides
Vegan Guide Infographics
A Vegan Guide is a comprehensive resource that provides information about a plant-based diet that excludes all animal products, including meat, dairy, eggs, and honey. These Vegan Guide Infographics are visual representations of information related to the vegan lifestyle. Cover a wide range of topics, including the benefits of veganism, how to transition to a vegan diet, common misconceptions about veganism, ethical and environmental considerations, and the nutritional requirements of a vegan diet. This can be used by individuals who are interested in adopting a vegan lifestyle, and educators who want to provide information about veganism to their clients and students.

20 slides
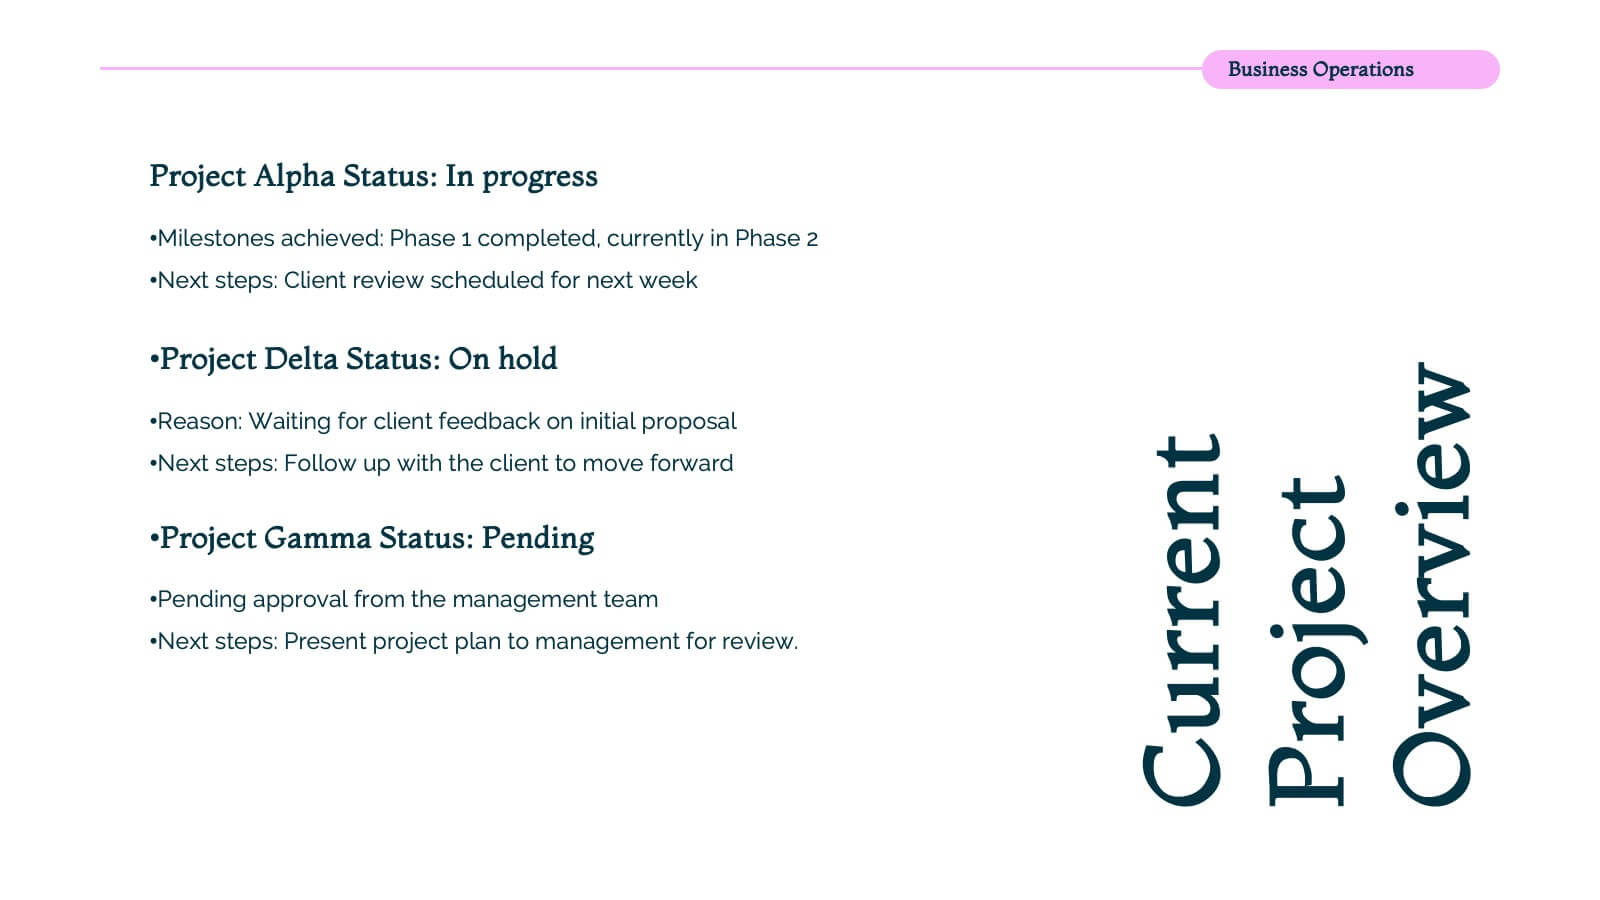
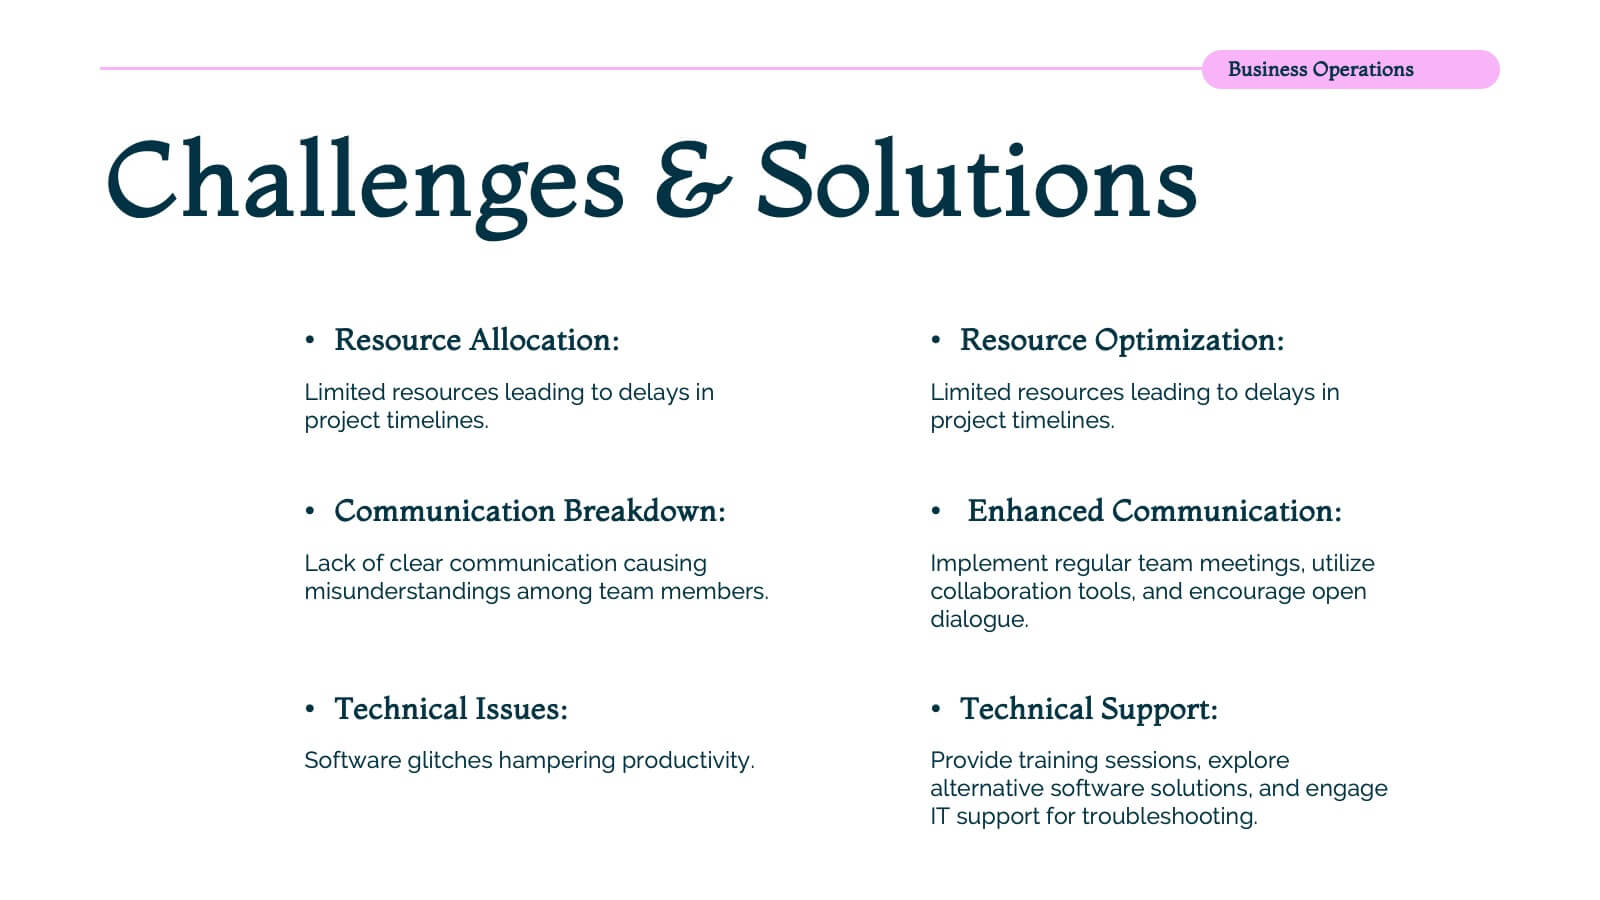
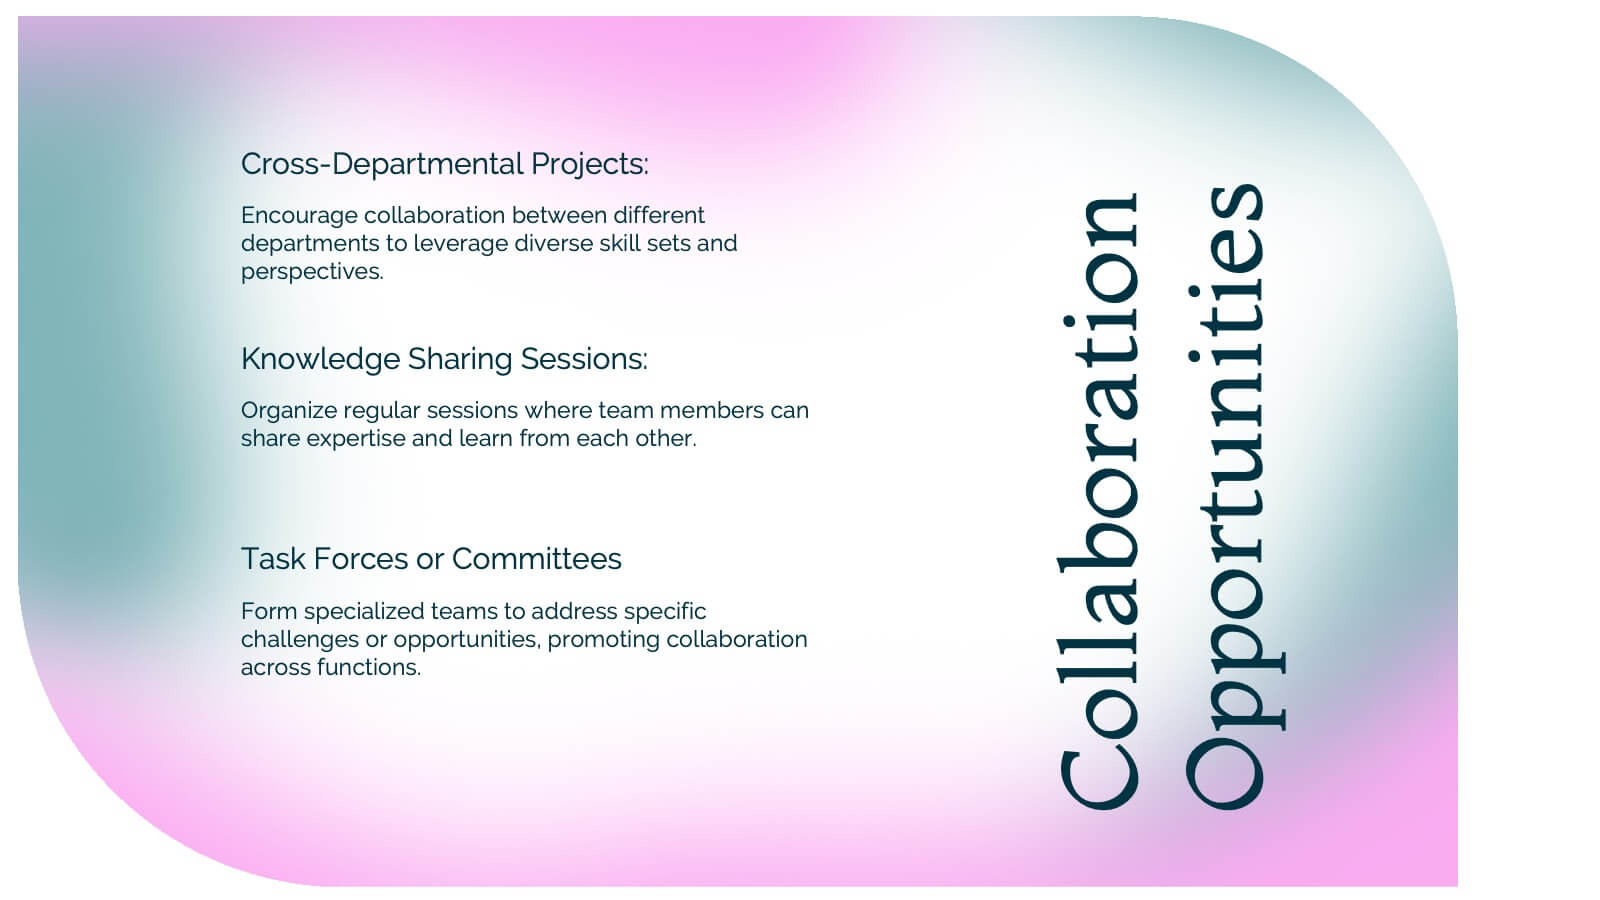
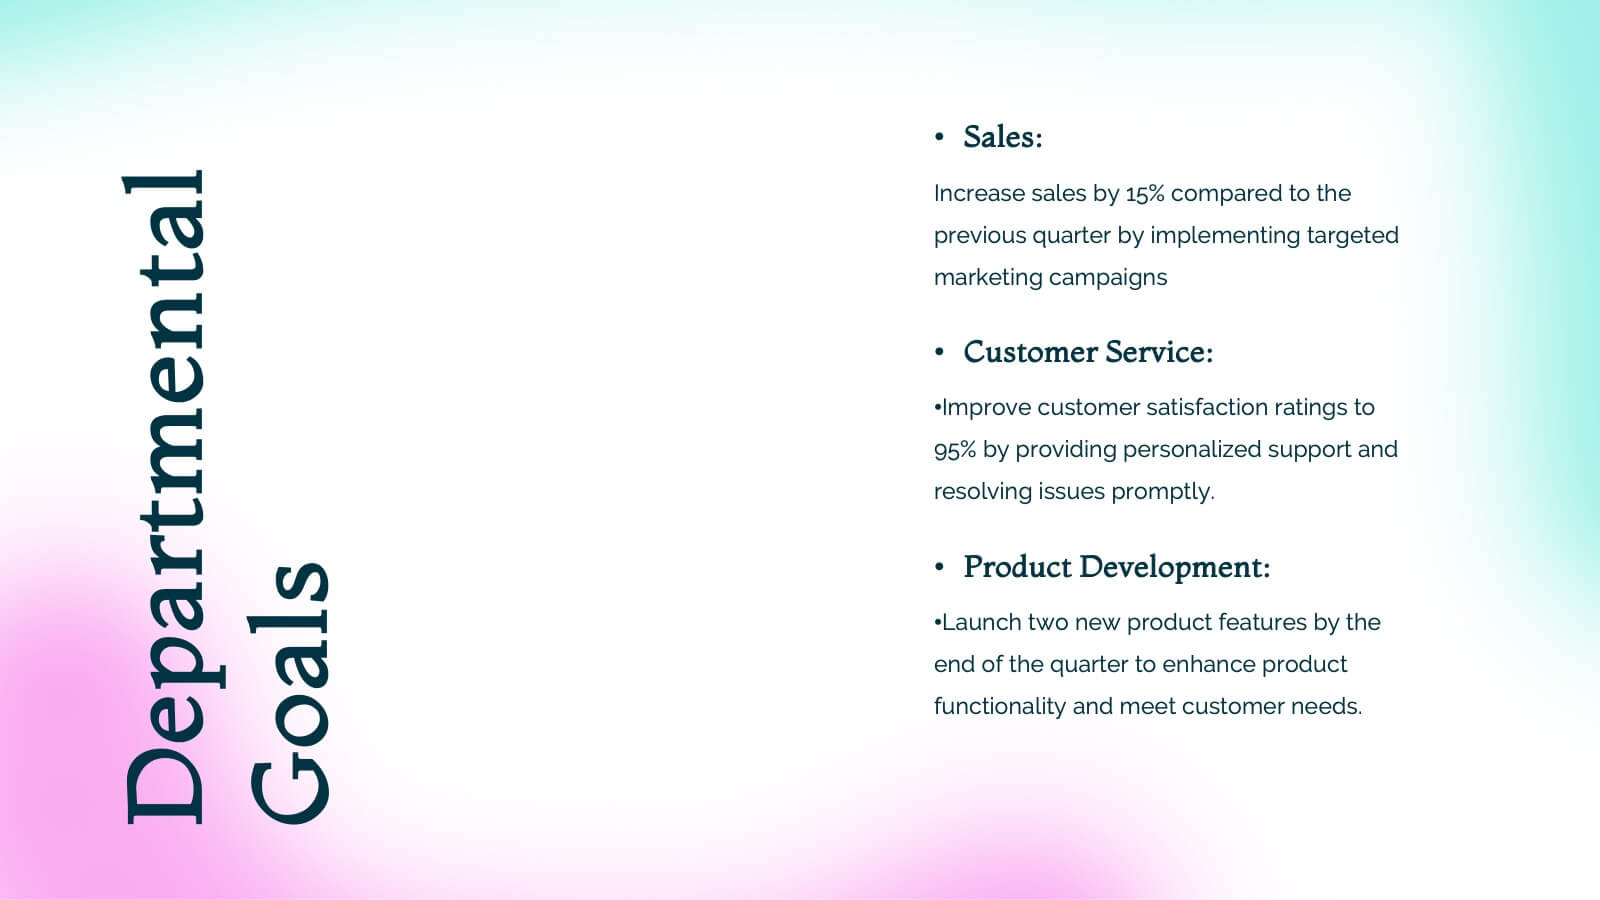
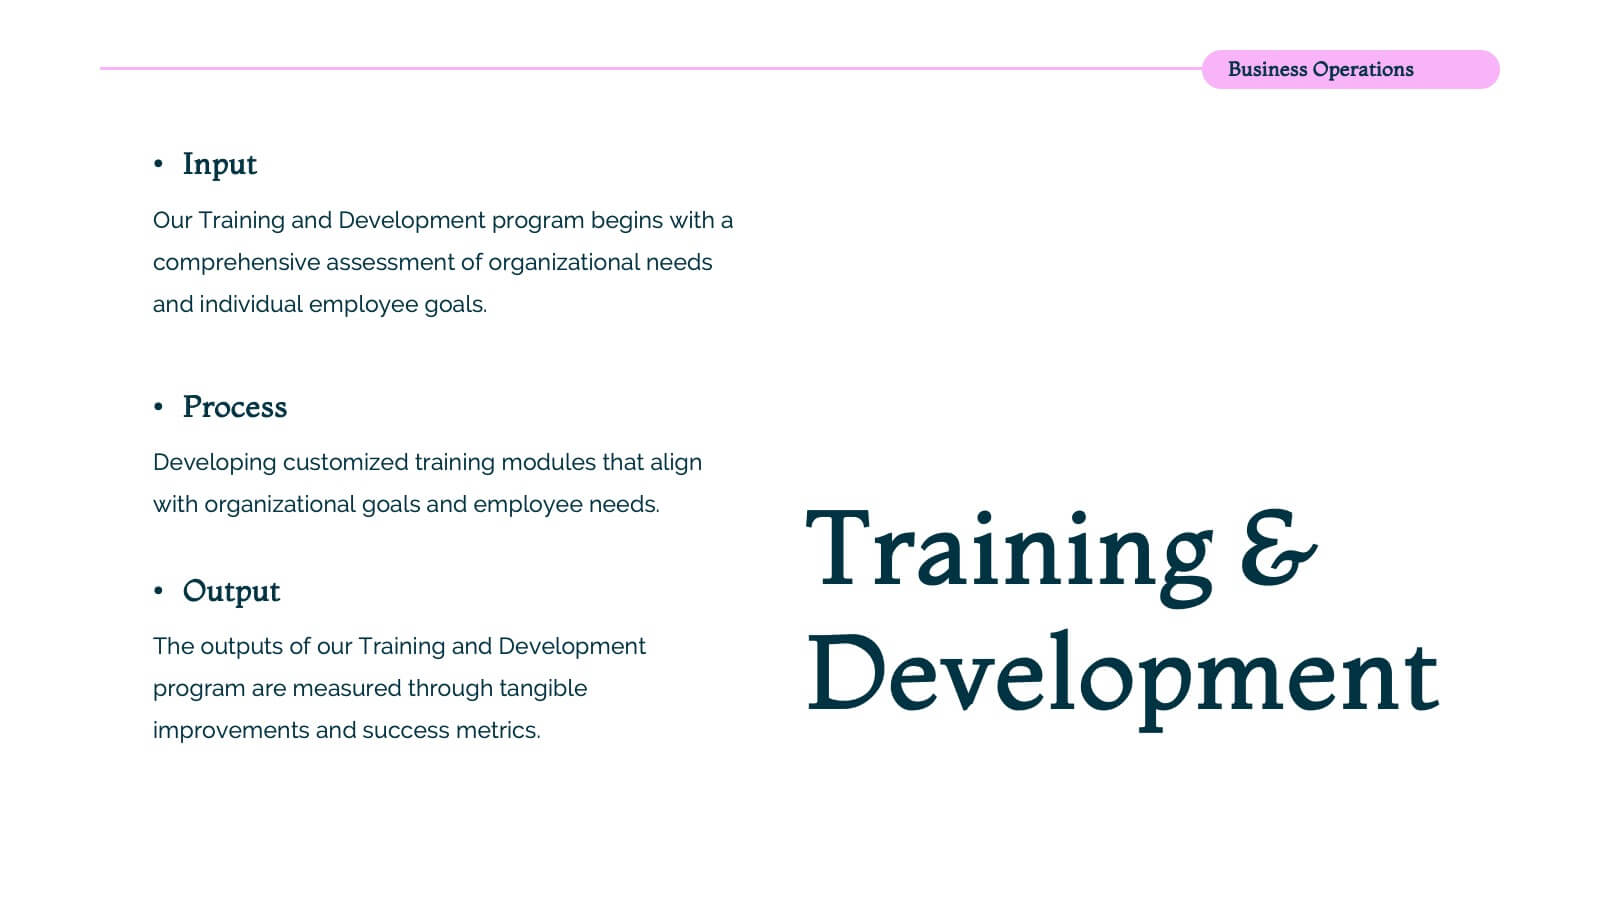
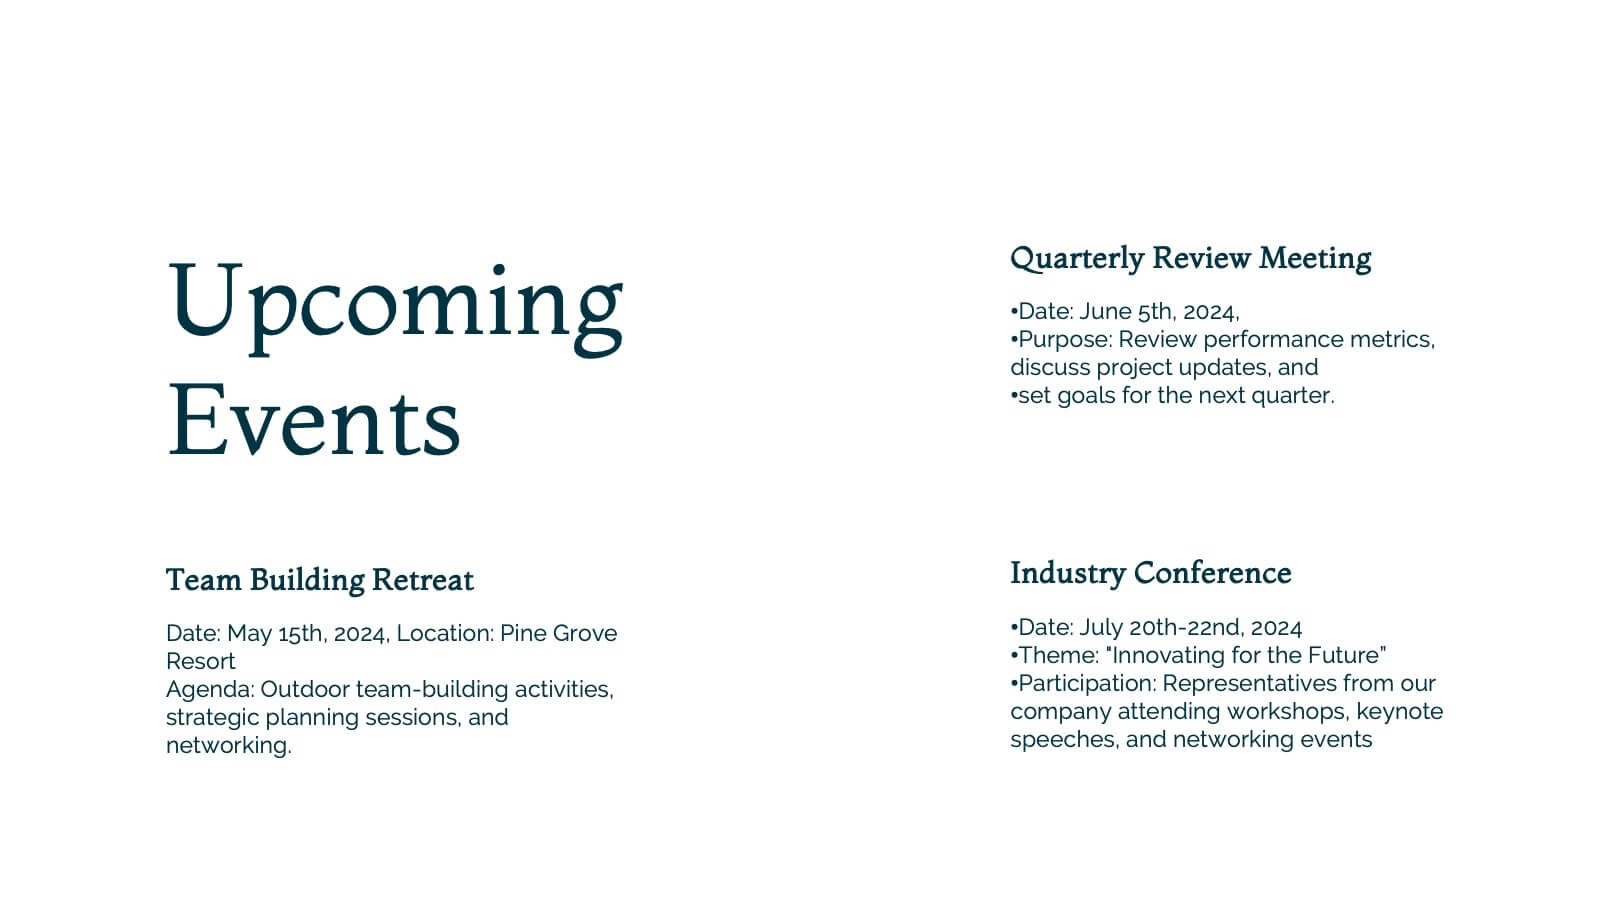
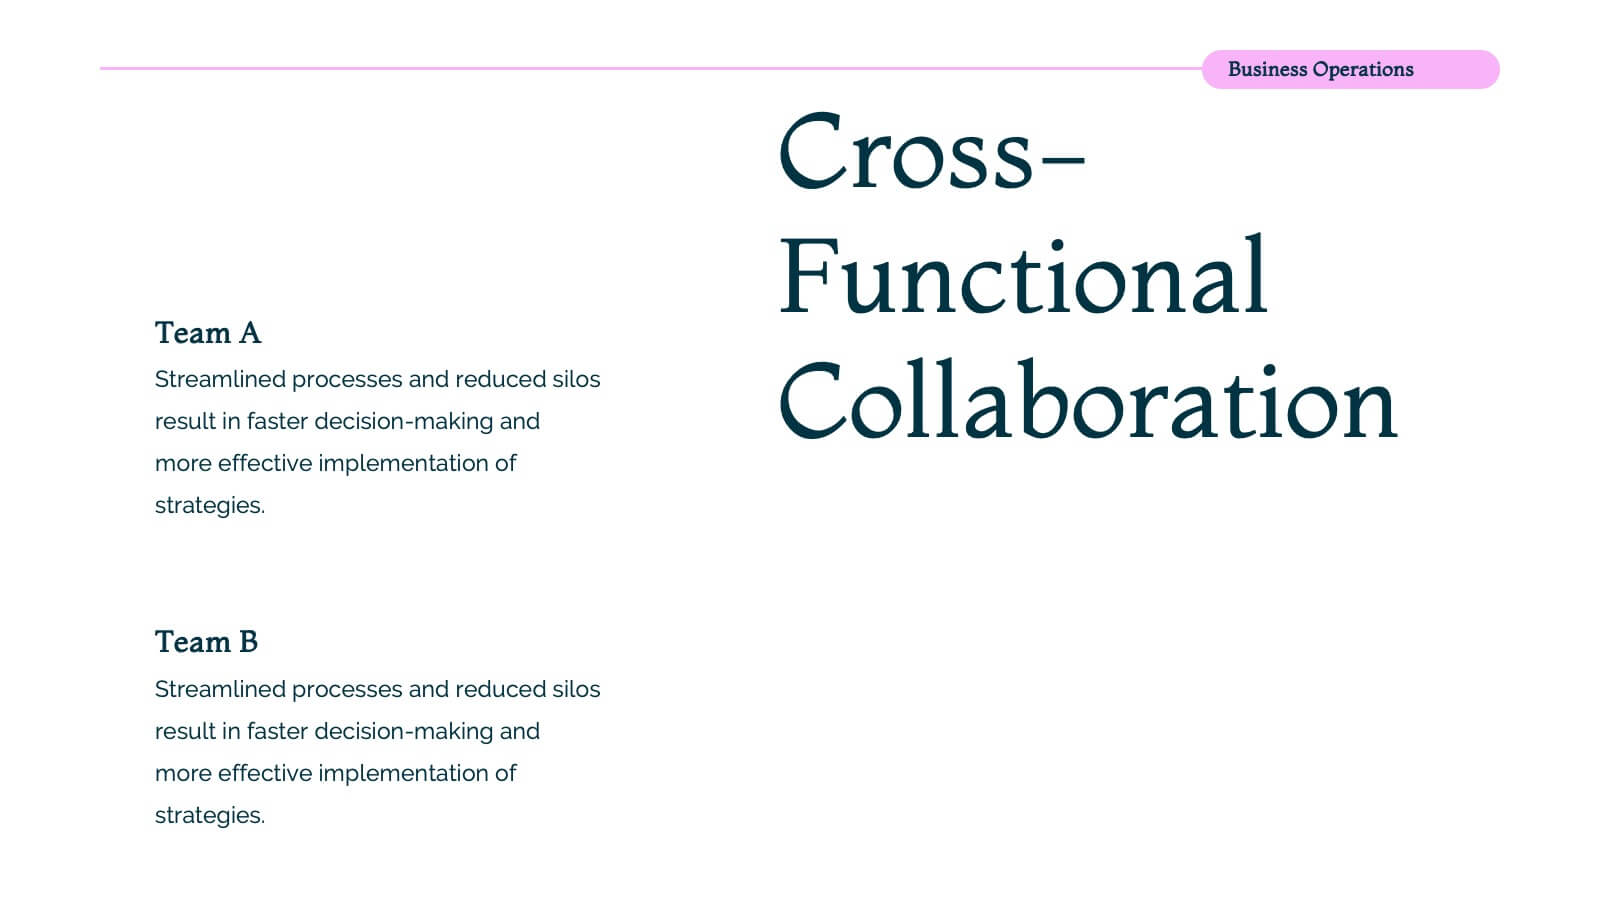
Nova Business Operations Plan Presentation
Create a polished business operations plan with this modern and organized template! It covers everything from team updates and project overviews to resource allocation and collaboration opportunities. Perfect for structuring departmental goals, process improvements, and employee recognition. Compatible with PowerPoint, Keynote, and Google Slides for a seamless, professional presentation.


7 slides
Local Sales Infographic
Local sales refer to transactions or sales activities that occur within a specific geographic area or locality. This infographic template is a visual tour through the vibrant world of neighborhood commerce, where small businesses flourish and community connections thrive. This template is designed to encourage your audience to embrace the local sales experience. This invites them to explore and support their community's treasures, fostering a strong local economy. Fully customizable and compatible with Powerpoint, Keynote, and Google Slides. Use visuals like sale tags or a shopping cart to illustrate the concept of attracting shoppers through offers.


7 slides
Project Management Infographic Presentation Template
Project management is the process of leading a team of people to plan, organize, and complete a project within a specific timeframe and budget. It involves defining project goals, determining tasks and responsibilities, and tracking progress to ensure the project is completed on time and within budget. This template works with Powerpoint, keynote, and google slides, so you can use it on any device. Use this template for effective project management to ensure that resources are used efficiently, risks are minimized, and stakeholders are satisfied with the outcome of the project.


5 slides
Yoga Poses Infographics
Yoga Poses, also known as asanas, are physical postures practiced in the discipline of yoga. They are designed to promote strength, flexibility, balance, and mindfulness. These infographic templates focuses on illustrating various yoga poses and their benefits. It is designed to help individuals understand and practice different yoga poses effectively. This template features beautifully designed infographics with icons and illustrations that showcase different yoga poses. These covers a wide range of yoga, including balancing poses, Chakra yoga, standing poses, and yoga for pregnancy.


5 slides
Recycling Basics Infographics
Recycling is the process of converting waste materials into new products to reduce the consumption of raw materials, energy usage, and environmental pollution. These infographic templates are designed to educate and motivate individuals to embrace recycling as a sustainable practice. With its eye-catching design, concise information, and visually appealing graphics, this template will help raise awareness and inspire positive recycling behaviors in your audience. This template allows you to effectively communicate key information about recycling. This is compatible with Powerpoint, Keynote, and Google Slides.


3 slides
TAM SAM SOM Strategy Slide Presentation
Transform data into strategy with a clean, layered visual that helps you present market opportunities with precision and style. Ideal for illustrating market reach and segmentation, this professional layout keeps your insights clear and impactful. Fully compatible with PowerPoint, Keynote, and Google Slides for seamless customization and presentation use.


5 slides
Website SEO Performance Analytics Presentation
Visualize your website’s performance data clearly and professionally with this structured SEO analytics slide. This template features a tiered layout with a central search bar icon and four vertically-aligned data sections—perfect for breaking down KPIs like traffic sources, bounce rates, keyword rankings, and conversion rates. Ideal for digital marketers, SEO analysts, and reporting presentations. Fully editable in PowerPoint, Keynote, and Google Slides.


5 slides
Comparative Assessment Using Harvey Ball Chart
Showcase multiple data points with clarity using this Comparative Assessment Using Harvey Ball Chart presentation template. Designed for visualizing progress, performance, or preference across 5 categories, each slide features Harvey Balls with percentage indicators, icons, and explanatory text sections. Ideal for business reviews, audits, or strategy discussions, this template helps communicate variances in an intuitive, side-by-side format. Fully editable in PowerPoint, Google Slides, and Keynote.


6 slides
Talent Acquisition and Recruitment Presentation
Showcase your hiring process with clarity using this Talent Acquisition and Recruitment slide. Designed with a stack of resumes and a 5-step vertical layout, it's perfect for outlining stages such as job posting, candidate sourcing, interviews, and selection. Each section includes icons and editable titles to match your specific recruitment flow. Compatible with PowerPoint, Keynote, and Google Slides for easy customization.


5 slides
Architecture and Construction Strategy Presentation
Lay the foundation for success with this clean, construction-inspired presentation design. Ideal for showcasing project strategies, development phases, or architectural plans, it helps you communicate structure and vision with clarity. Fully customizable and compatible with PowerPoint, Keynote, and Google Slides for effortless editing and professional results.


26 slides
Film Industry Vintage Presentation
The film industry, also known as the cinema or movie industry, refers to the collection of companies, professionals, and organizations involved in the production, distribution, and exhibition of films. This presentation template has a nostalgic design tailored for film enthusiasts, filmmakers, historians, or anyone looking to delve into the rich history of cinema. This presentation offers a visually appealing and well-curated journey through the evolution of the film industry, highlighting key milestones, iconic films, and the pioneers who shaped its development. Utilize the vintage illustrations and diagrams to illustrate film advancements.


5 slides
Business Threat Risk Assessment Strategy Presentation
Visualize your risk factors clearly with the Business Threat Risk Assessment Strategy Presentation. This X-shaped quadrant layout helps you outline and evaluate four key risk areas at a glance—ideal for threat mapping, vulnerability assessment, or contingency planning. Fully editable in Canva, PowerPoint, Keynote, and Google Slides.


5 slides
Investor-Ready Business Pitch Plan Presentation
Make your business roadmap stand out with this dynamic visual journey, perfect for impressing investors from the first slide. This infographic-style pitch deck helps clearly outline your business strategy across five milestones, using vibrant colors and icons for easy comprehension. Fully compatible with PowerPoint, Keynote, and Google Slides.


10 slides
Financial Dashboard Report Presentation
Stay on top of your financial metrics with the Financial Dashboard Report Presentation. Featuring clean visuals like line charts and icon-labeled KPIs, this layout makes complex data easy to understand. Perfect for monthly reviews, investor updates, or business reports. Fully editable in PowerPoint, Keynote, and Google Slides.


4 slides
Problem-Solving Strategy Presentation
Navigate challenges with confidence using this problem-solving strategy template! Designed to break down complex issues into manageable steps, this structured layout helps teams identify solutions effectively. Perfect for business leaders, project managers, and strategists aiming for clarity and action. Fully customizable and compatible with PowerPoint, Keynote, and Google Slides.


6 slides
Target Market Breakdown Presentation
Turn audience data into a visual story with a clean, layered design that highlights market potential and audience segmentation. Perfect for startups and marketing teams, this layout simplifies complex data for impactful communication. Fully compatible with PowerPoint, Keynote, and Google Slides for seamless editing and professional presentation results.