


Features
- 6 Unique slides
- Fully editable and easy to edit in Microsoft Powerpoint, Keynote and Google Slides
- 16:9 widescreen layout
- Clean and professional designs
- Export to JPG, PDF or send by email


Do you have any questions?
Recommend


6 slides
Break Even Point Presentation
Turn your data into a story of profit and precision with this clean and modern presentation design. Ideal for showcasing financial performance, cost analysis, or revenue forecasts, it helps visualize where your business meets success. Fully customizable and compatible with PowerPoint, Keynote, and Google Slides for smooth editing.


6 slides
Mind Map Ideas Infographic
A Mind Map is a visual representation of ideas, concepts, and relationships, often created around a central topic or theme. This infographic mind map template offer a versatile and effective method for organizing, analyzing, and visualizing information, making them valuable tools for learning, problem-solving, and creative exploration. The structure of this template consists of the central idea or topic placed at the center of the map. This template provides a structured way to showcase and organize ideas using the mind mapping technique. Compatible with Powerpoint, Keynote, and Google Slides.


5 slides
Messaging Strategy and Flow Presentation
Communicate with clarity using this streamlined messaging strategy and flow presentation template. Designed to visualize the stages of message planning—from audience segmentation to final delivery—this layout helps teams align communication goals and channels. Ideal for marketing, PR, or internal comms presentations. Fully compatible with PowerPoint, Keynote, and Google Slides.


4 slides
Real Estate Business Proposal
Make a lasting impression with this key-and-houses layout, perfect for unlocking your property pitch. Designed for real estate professionals, agencies, and consultants presenting market strategies or service offerings. Easily customizable in PowerPoint, Keynote, and Google Slides.


8 slides
Dynamic Pricing Strategies Presentation
Navigate market complexities with our 'Dynamic Pricing Strategies' presentation template, perfect for outlining variable pricing models that respond to market demands. This versatile tool is ideal for businesses looking to adapt and thrive, with designs compatible with PowerPoint, Keynote, and Google Slides.


5 slides
Demographic and Psychographic Segments Presentation
Break down your audience with clarity using the Demographic and Psychographic Segments Presentation. This slide is ideal for showcasing four key consumer dimensions through a centered circular layout and quadrant icons. Perfect for marketing campaigns, branding strategies, and audience targeting. Fully editable in Canva, PowerPoint, Keynote, or Google Slides.


6 slides
Mission and Values Overview Presentation
Your company's purpose deserves a visually stunning story! This infographic presentation template helps you clearly outline core values and mission statements with an engaging, structured design. Ideal for business strategy meetings, corporate presentations, and branding discussions, it keeps your content professional and impactful. Fully customizable and compatible with PowerPoint, Keynote, and Google Slides.


6 slides
Internal and External Communication Plan Presentation
Enhance your Internal and External Communication Plan with this professional infographic template. Designed to illustrate key communication strategies, this slide ensures clear and effective collaboration within teams and with external stakeholders. Fully customizable in PowerPoint, Keynote, and Google Slides, making it ideal for corporate meetings, business strategy presentations, and workflow planning.


22 slides
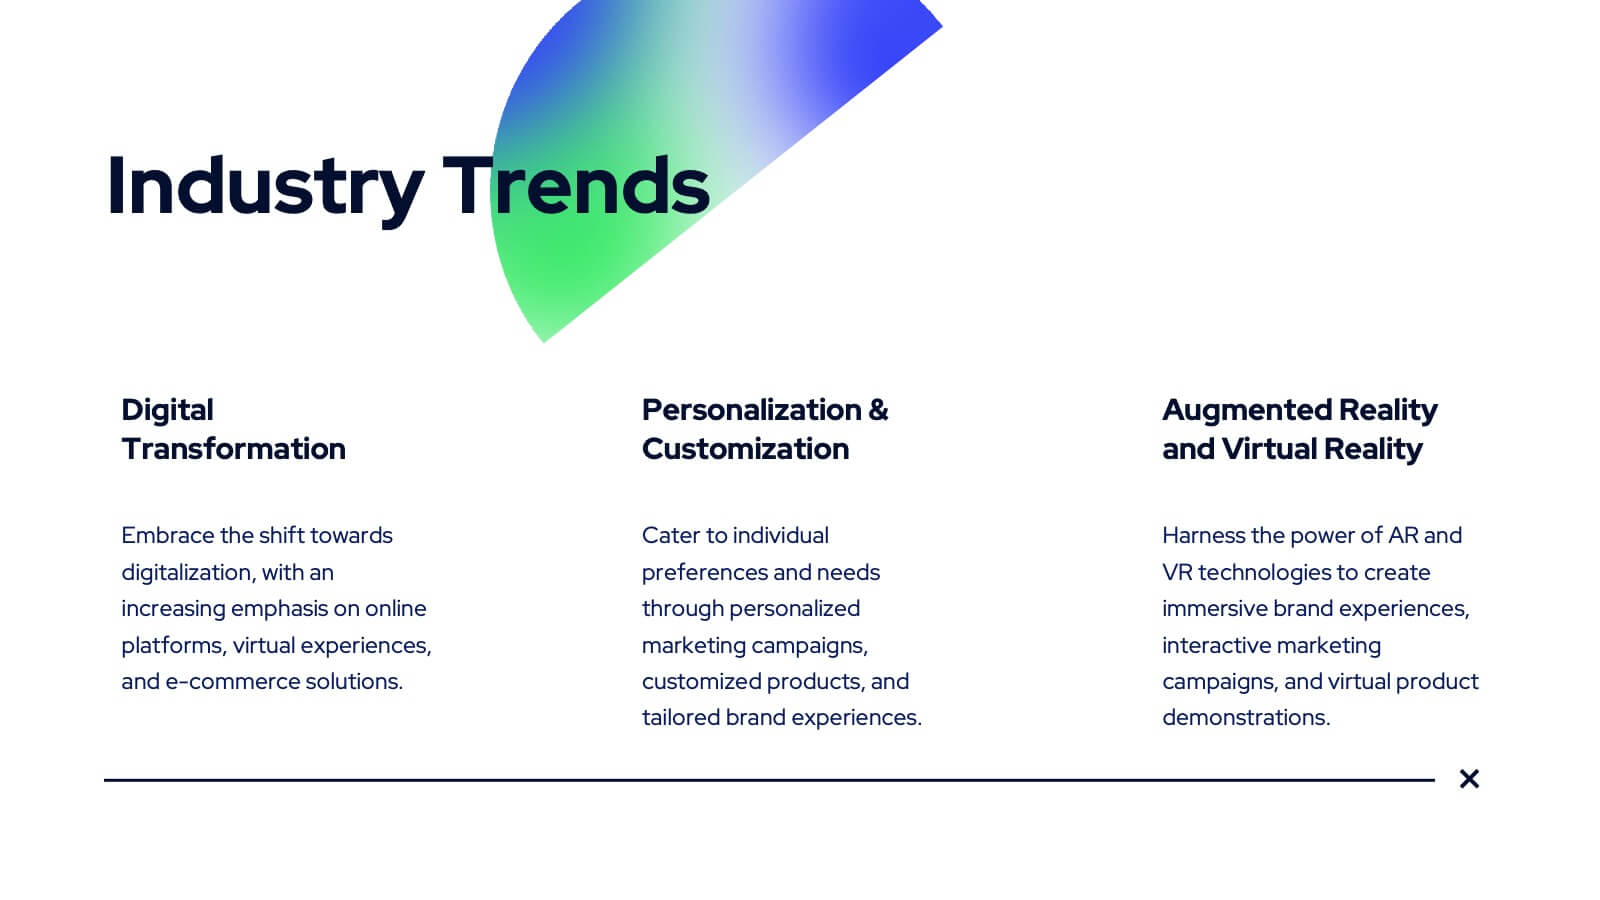
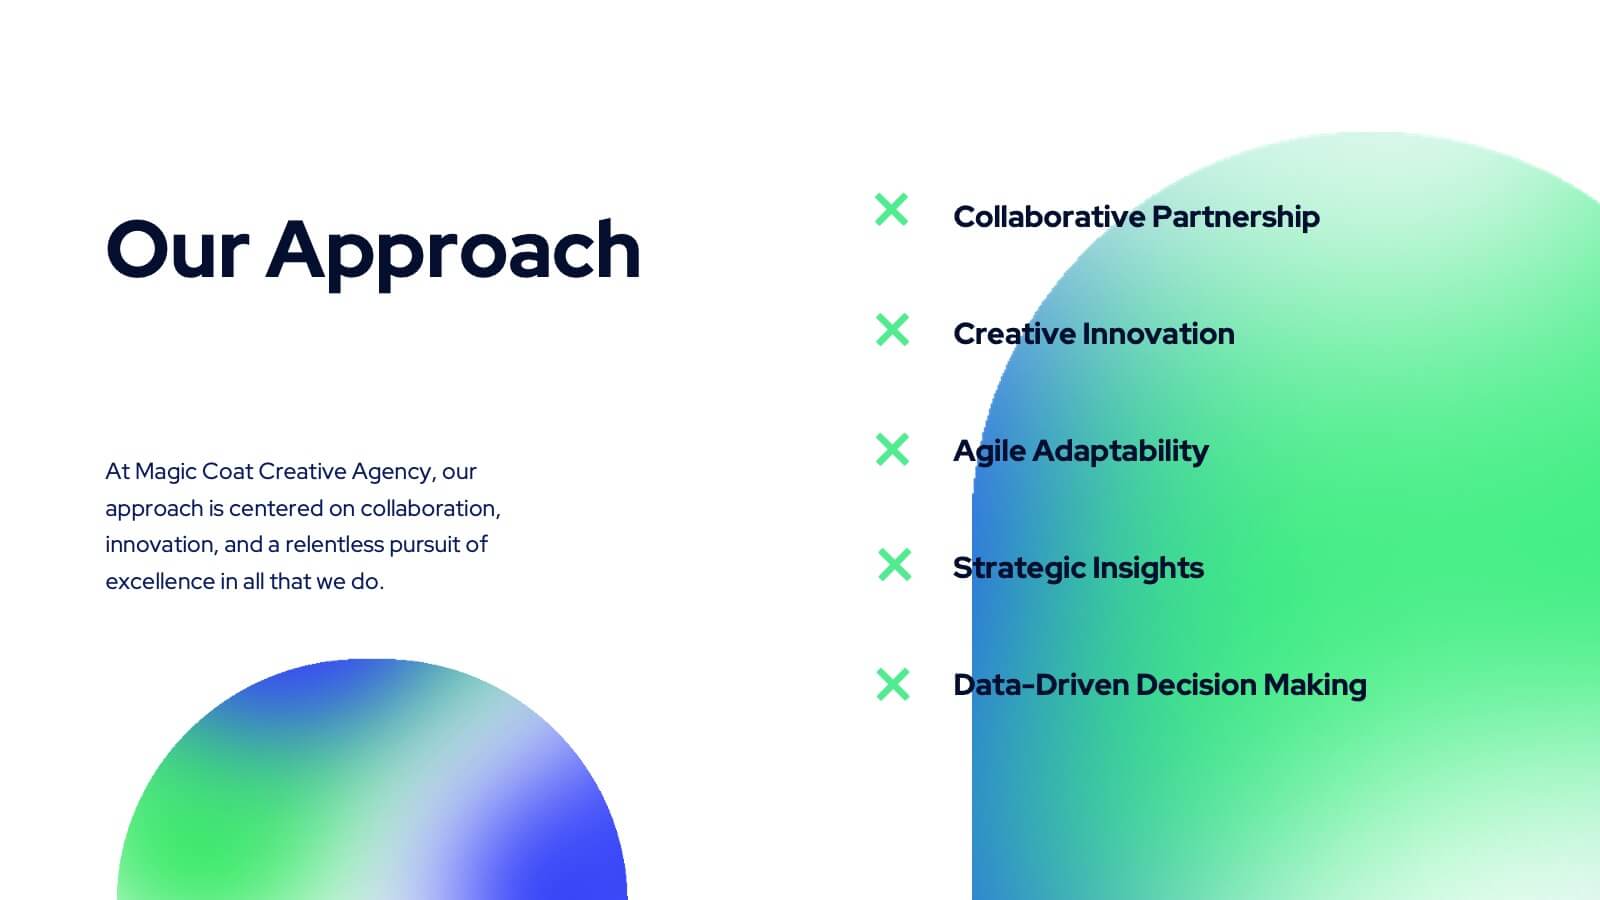
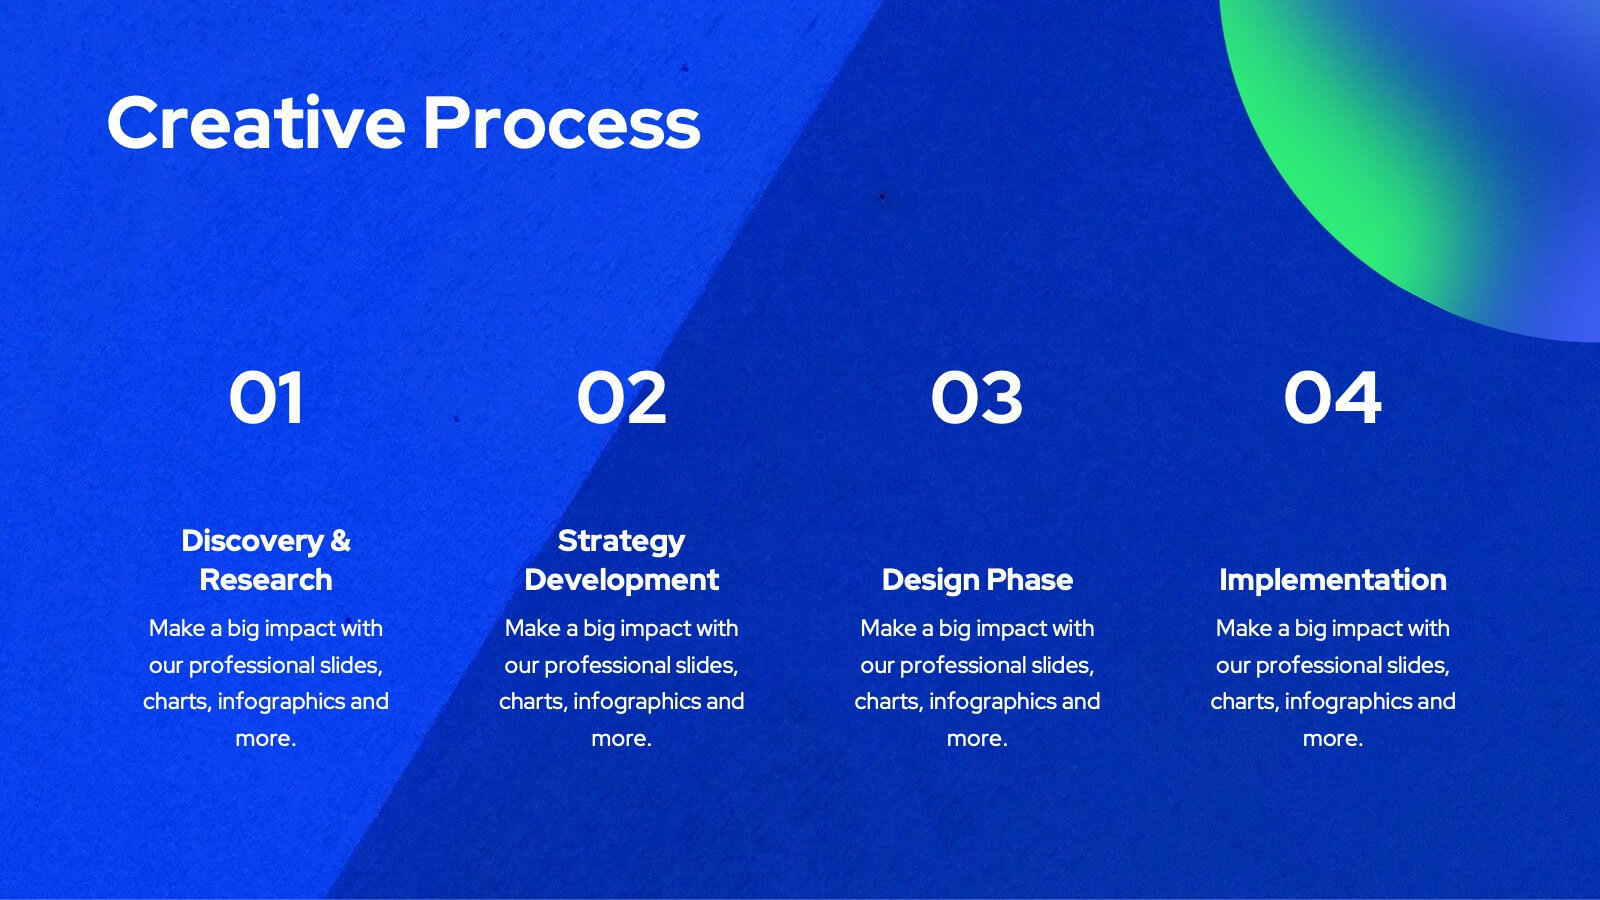
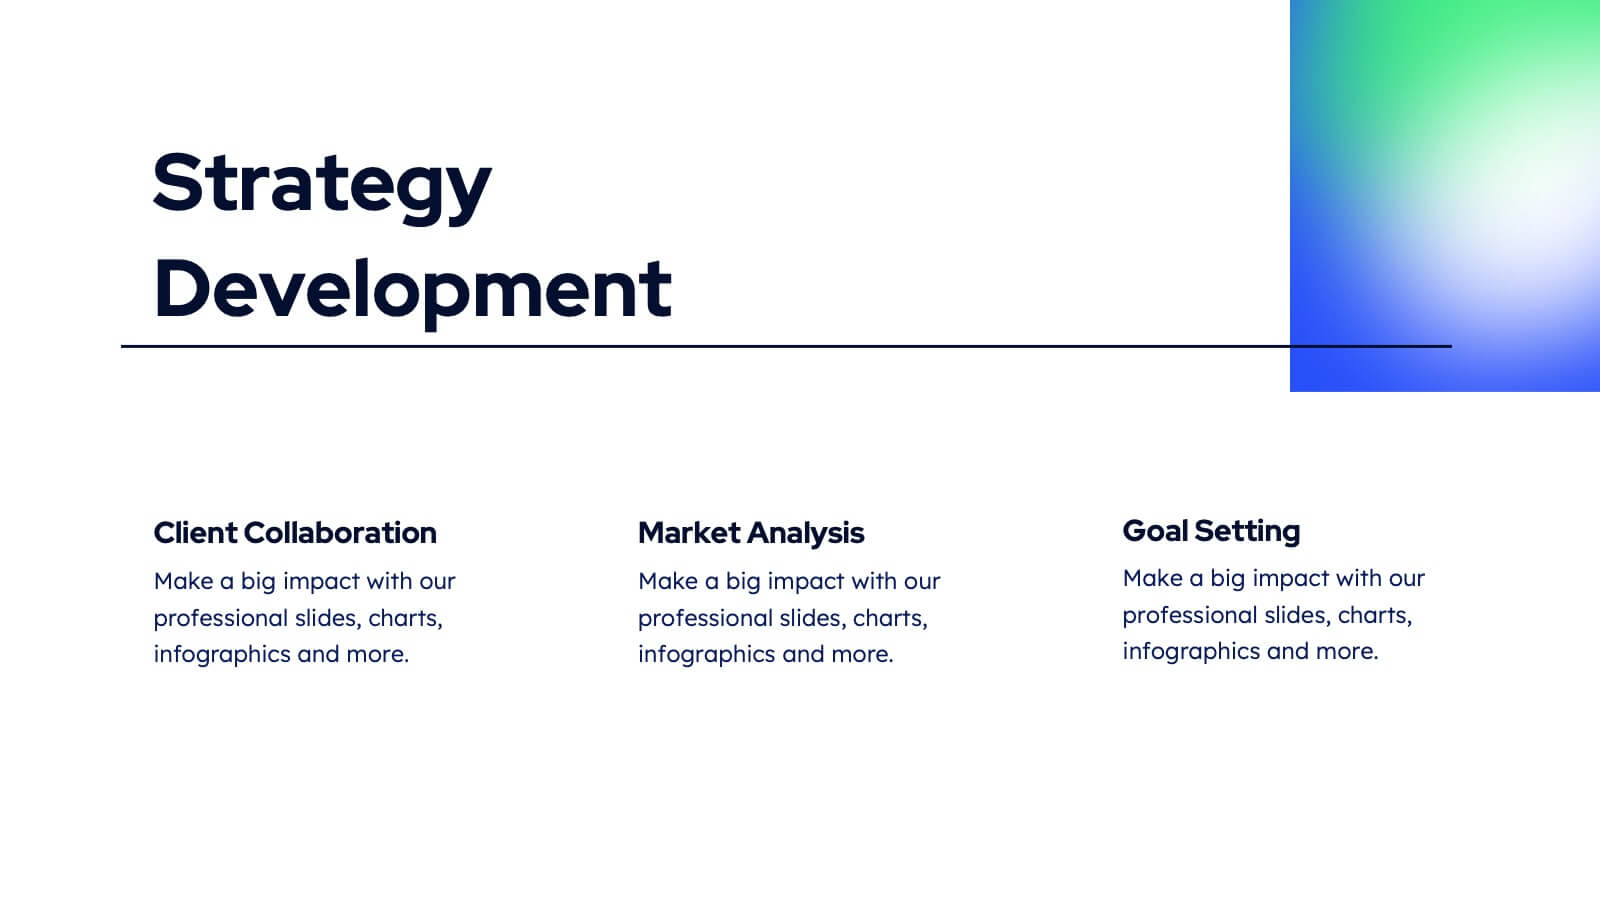
Tanzanite Full-Service Agency Project Plan Presentation
Showcase your agency's strengths with this bold and modern portfolio presentation template! From client success stories and case studies to market analysis and strategy development, this template highlights your expertise and approach. Perfect for agencies looking to present their services, creative processes, and partnerships. Compatible with PowerPoint, Keynote, and Google Slides, making it easy to impress any audience.


22 slides
Leviathan Sales Pitch Deck Presentation
This sales pitch deck template is designed to captivate your audience with a sleek, modern design. It features key slides like problem statement, solution, business model, and financials, ensuring a comprehensive presentation. Compatible with PowerPoint, Keynote, and Google Slides, it's perfect for showcasing your business's unique value proposition and growth strategy.


5 slides
Business Comparison Infographics
Elevate your business presentations with our business comparison infographics, the perfect tool for showcasing competitive analysis. In a striking array of orange and red tones, these infographics are designed to command attention. Entrepreneurs, business analysts, and students of business studies can leverage this template. Compatible with Powerpoint, Keynote, and Google Slides. Its creative style integrates compelling graphics and icons, simplifying complex data into digestible, engaging visuals. Ideal for meetings, or educational content, these infographics offer a clear, comparative insight, empowering informed business decisions.


10 slides
North America Editable Map Presentation
Transform your regional insights into a visually striking map that highlights data points and key locations across the United States. Ideal for showcasing market reach, demographic trends, or regional performance, this design blends clarity with professionalism. Fully compatible with PowerPoint, Keynote, and Google Slides for effortless editing and use.


4 slides
Simple and Effective Steps Presentation
Guide your audience through a seamless workflow with this "Simple and Effective Steps" template. Designed for clarity and impact, this layout breaks down processes into four distinct steps, making it ideal for project planning, decision-making, and strategy execution. Fully customizable and compatible with PowerPoint, Keynote, and Google Slides.


21 slides
Literati Research Proposal Presentation
Present your research proposal with confidence using this professionally crafted template, designed to streamline complex ideas into a cohesive, engaging narrative. With a modern design and dynamic visuals, it ensures your research objectives and findings are communicated effectively. The template includes sections for your introduction, background, methodology, data collection, analysis, and key findings, giving your proposal a logical structure. Use the literature review and data visualization slides to back up your arguments with credible sources and compelling graphics. Dedicated slides for conclusions, recommendations, and implications allow you to outline the impact of your research clearly. Fully editable in PowerPoint, Google Slides, and Keynote, this template adapts effortlessly to your needs. Perfect for academic, corporate, or professional research presentations, it combines sleek design with functionality to ensure your proposal resonates with your audience. Take your research to the next level with a template that reflects your dedication to excellence.


4 slides
Business Planning Framework Presentation
Turn big ideas into actionable strategies with this modern and structured presentation layout. Perfect for mapping goals, aligning priorities, and showcasing step-by-step planning processes, it helps you communicate strategy with clarity and confidence. Fully editable and compatible with PowerPoint, Keynote, and Google Slides for easy customization and professional results.


22 slides
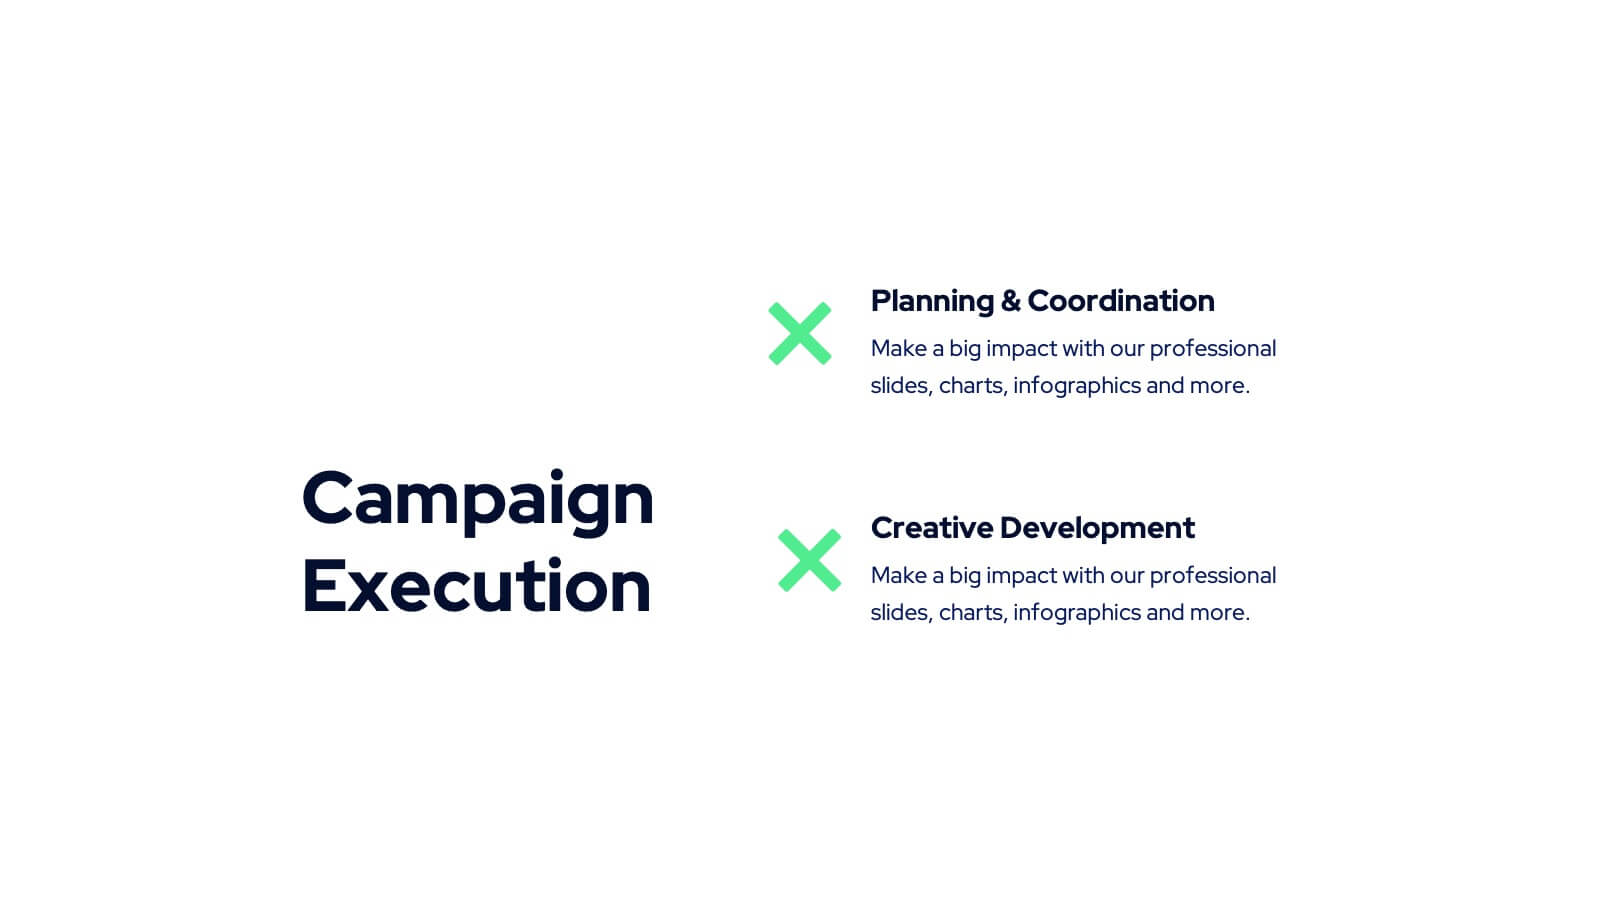
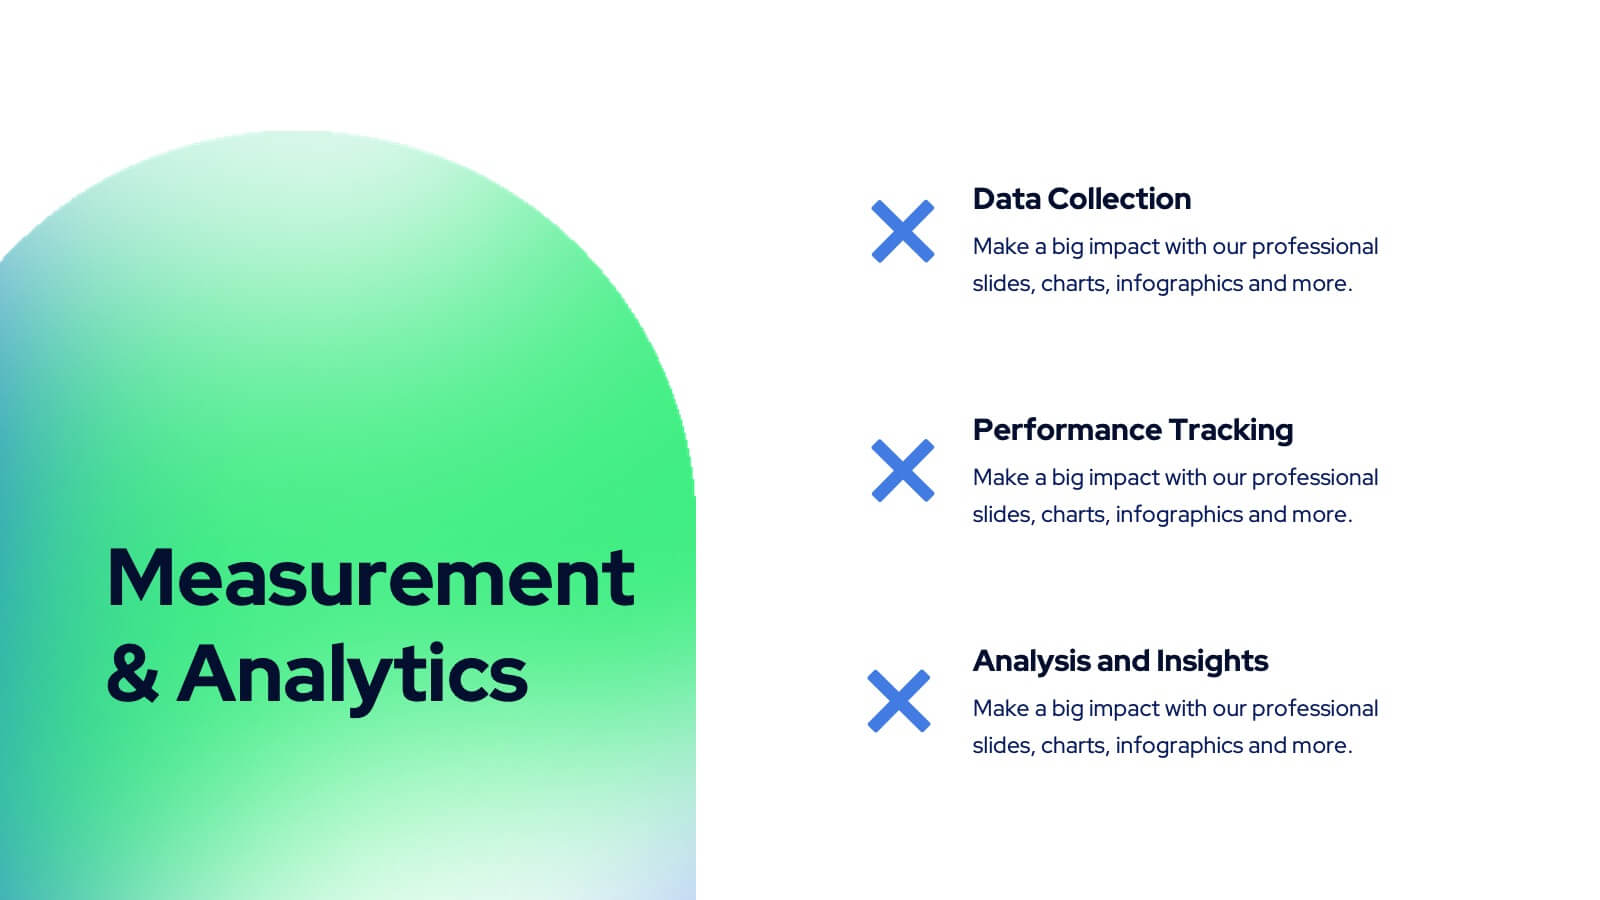
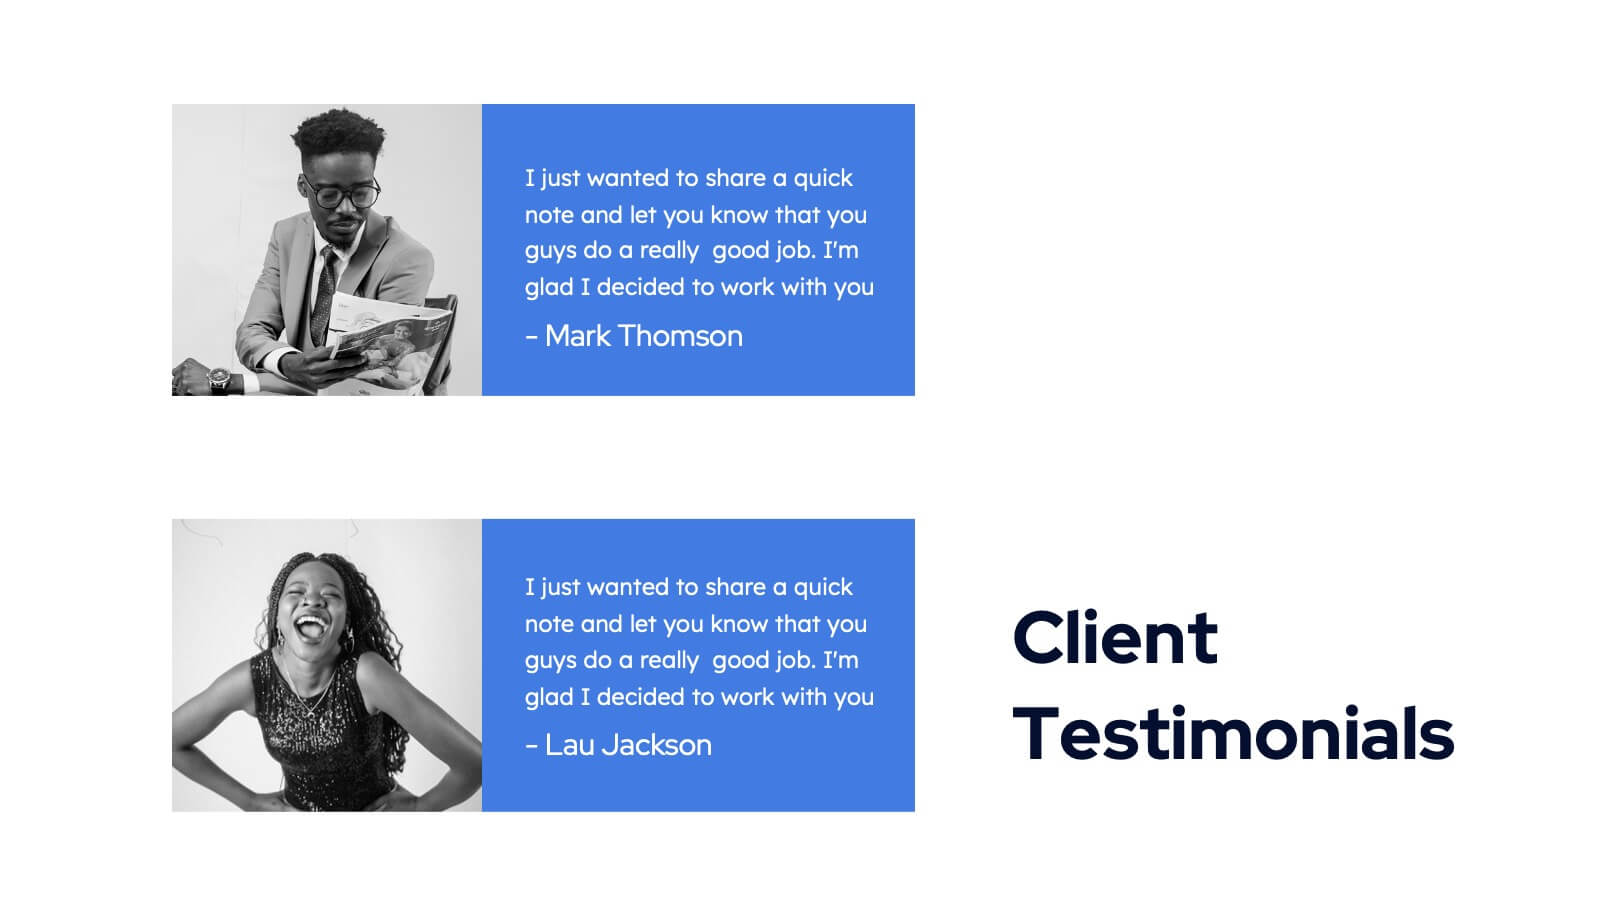
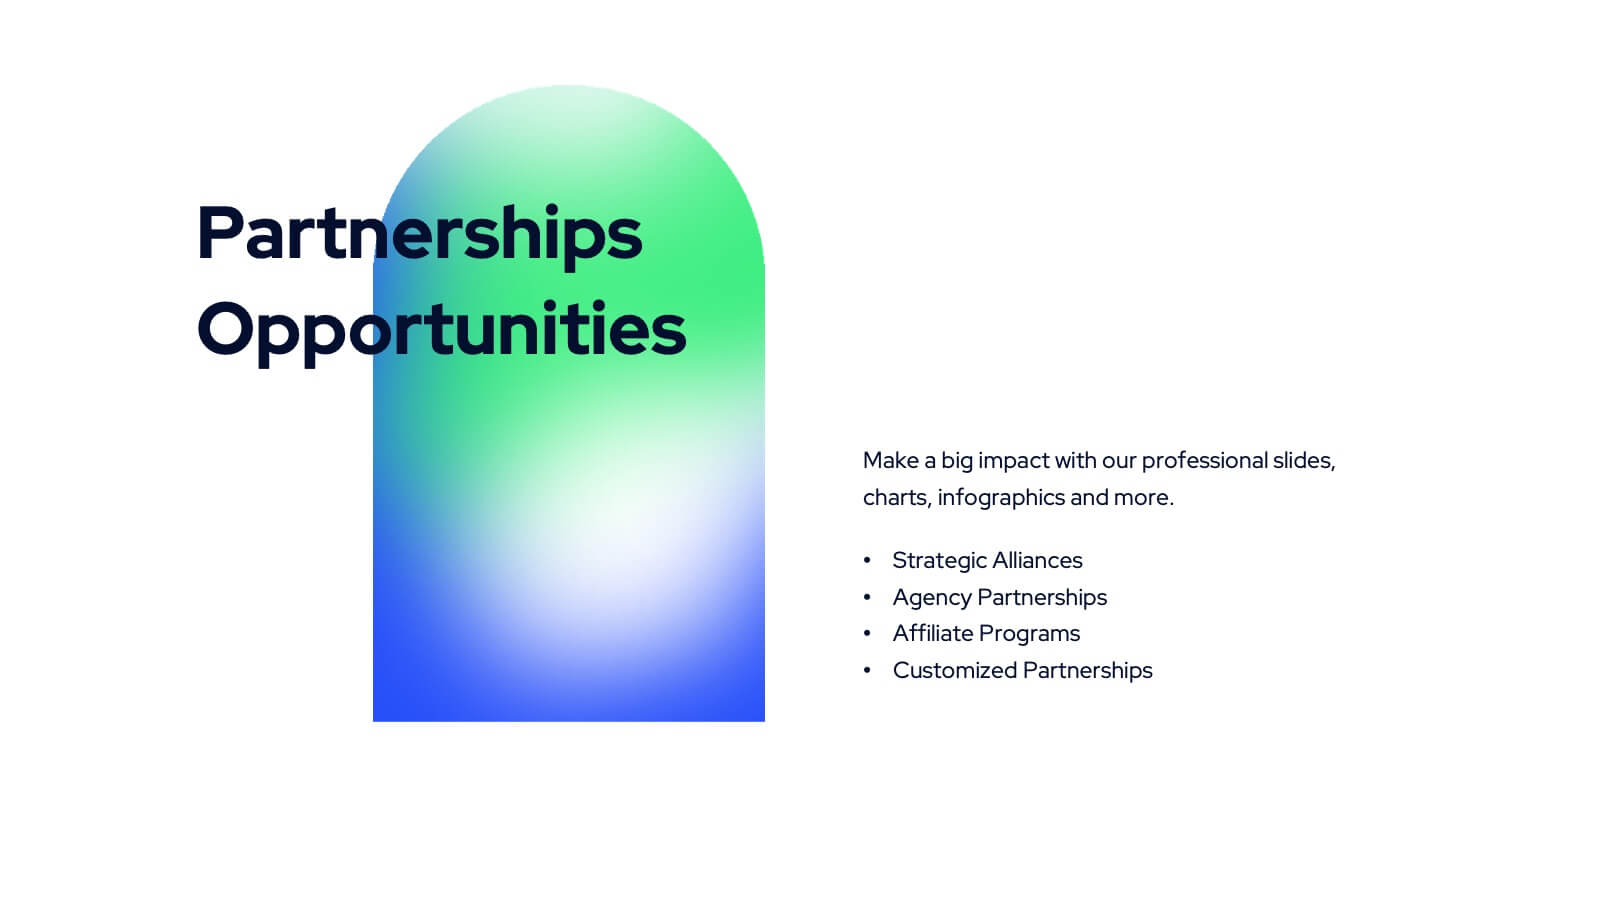
Diana Digital Agency Strategy Plan Presentation
Set your agency’s strategy in motion with this sleek and professional presentation! Featuring essential sections like market analysis, service offerings, campaign execution, and client success stories, it’s built to align your vision and goals. Ideal for client pitches or internal meetings, it’s fully compatible with PowerPoint, Keynote, and Google Slides.


22 slides
Sublimix Business Operations Plan Presentation
Streamline your company’s workflow with this bold and modern business operations plan presentation. Covering key areas like performance metrics, resource allocation, process improvements, and collaboration opportunities, this template helps you optimize efficiency and strategy. Fully customizable and compatible with PowerPoint, Keynote, and Google Slides for a seamless, professional presentation experience.