


Features
- 4 Unique slides
- Fully editable and easy to edit in Microsoft Powerpoint, Keynote and Google Slides
- 16:9 widescreen layout
- Clean and professional designs
- Export to JPG, PDF or send by email


Do you have any questions?
Recommend


5 slides
Innovative Concept Pitch Presentation
Present your big ideas with impact using this lightbulb puzzle infographic. Perfect for concept development, product ideation, or startup pitches. The layered segments help structure your content clearly. Fully customizable in PowerPoint, Keynote, and Google Slides—ideal for innovation roadmaps, creative planning, or visualizing business concepts.


6 slides
Project Timeline Calendar Presentation
Kick your planning into high gear with a clean, colorful layout that makes tracking progress feel effortless. This presentation helps you map tasks across the week, visualize timelines, and communicate project schedules with absolute clarity. It’s fully editable and works seamlessly in PowerPoint, Keynote, and Google Slides.


20 slides
Faelight Project Proposal Presentation
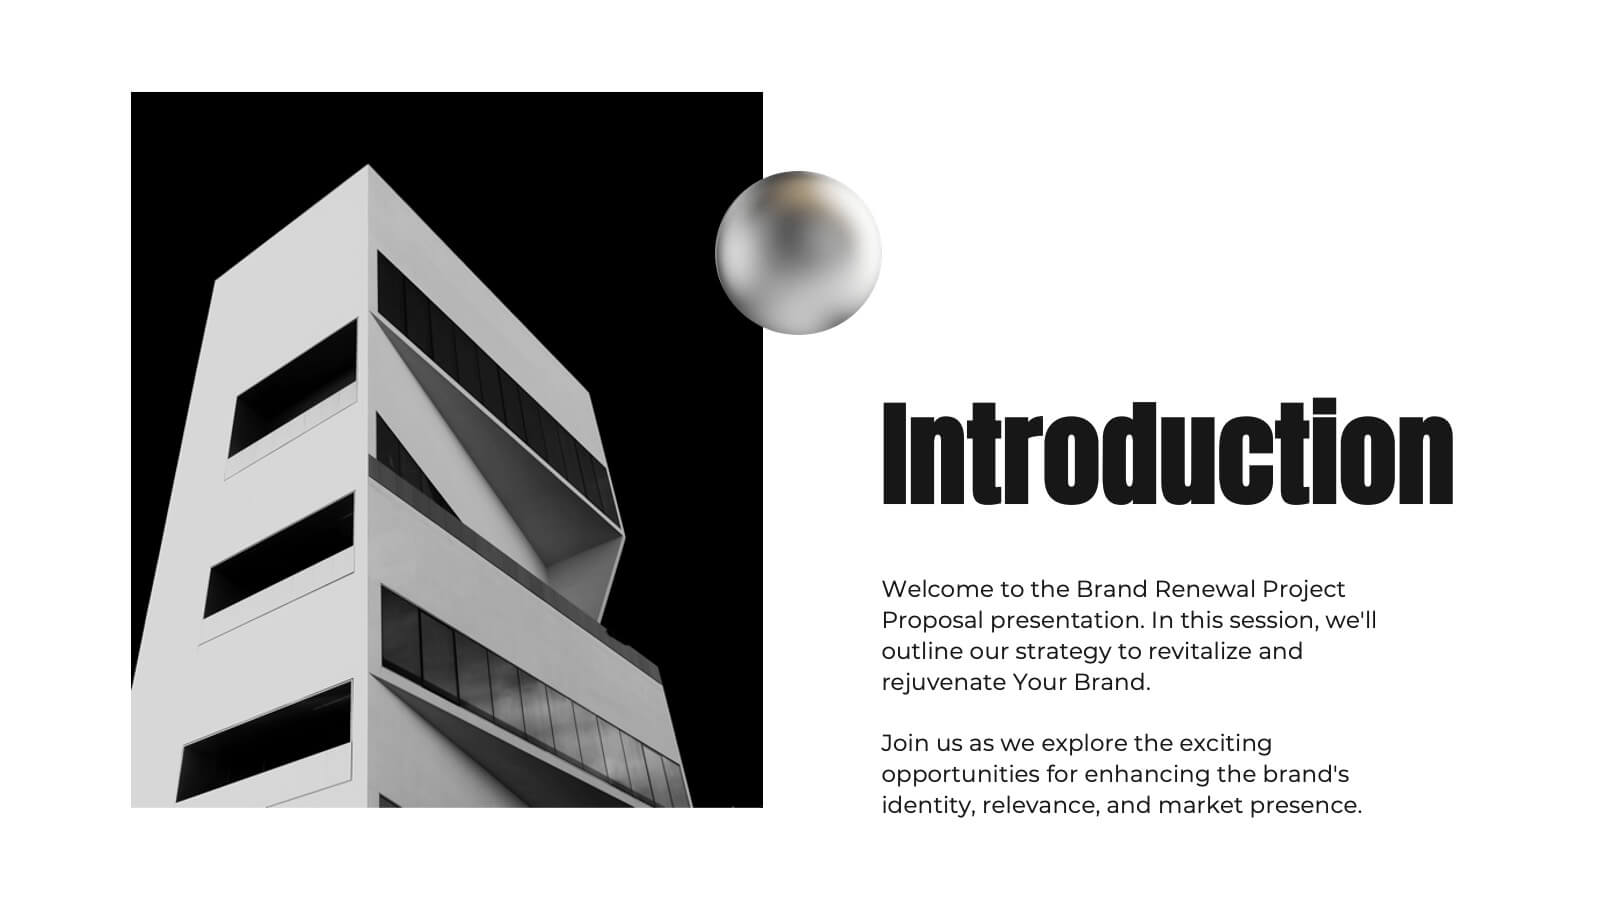
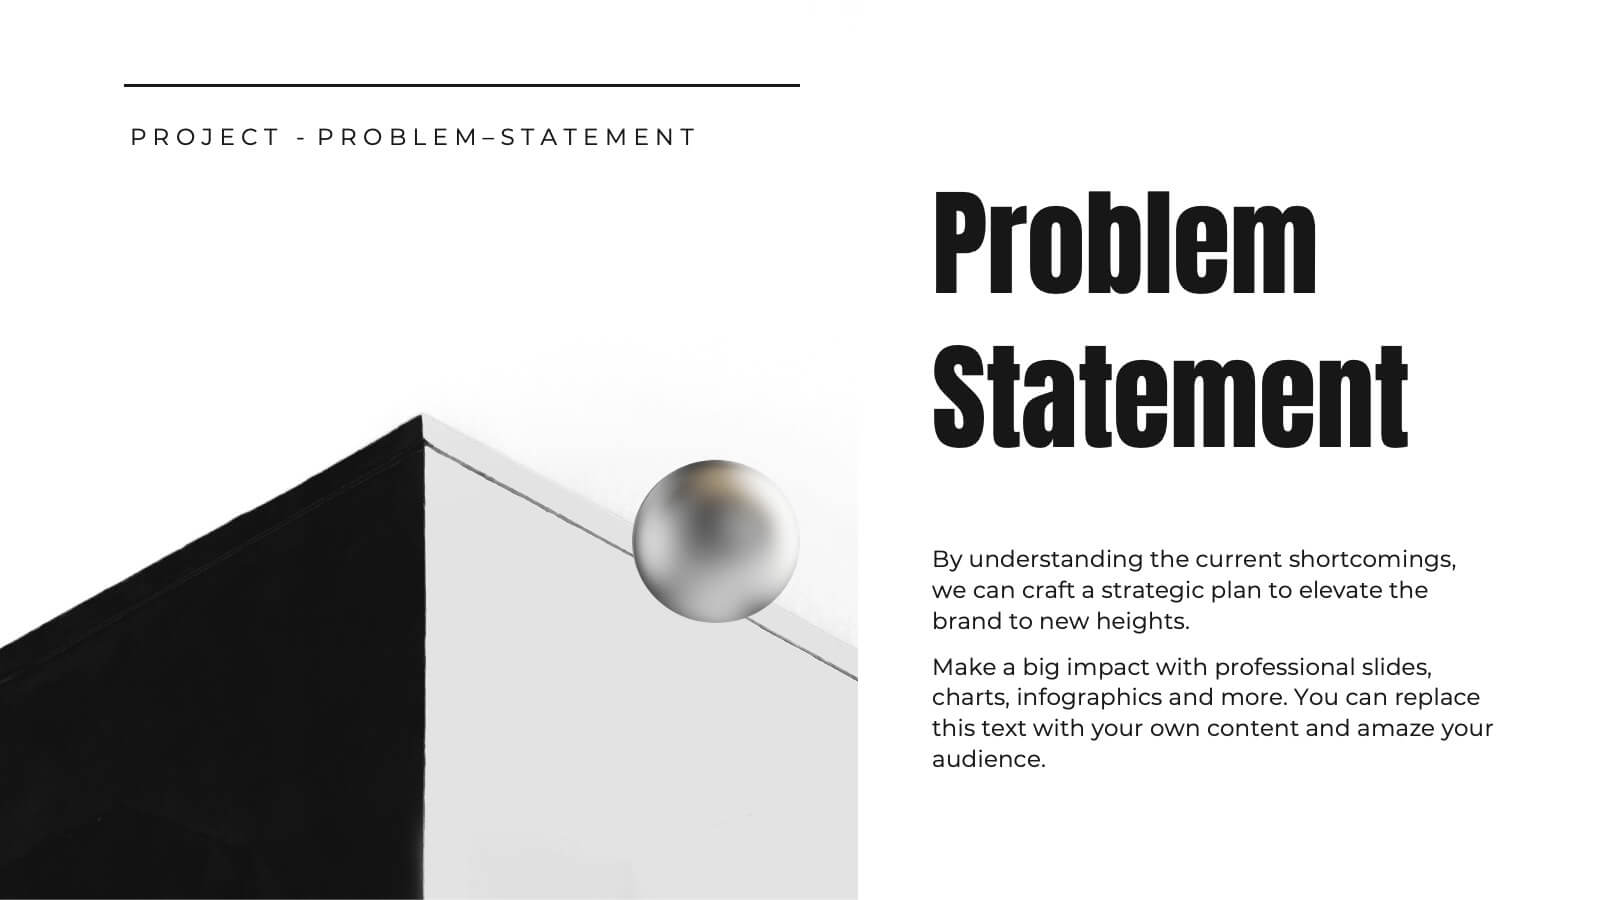
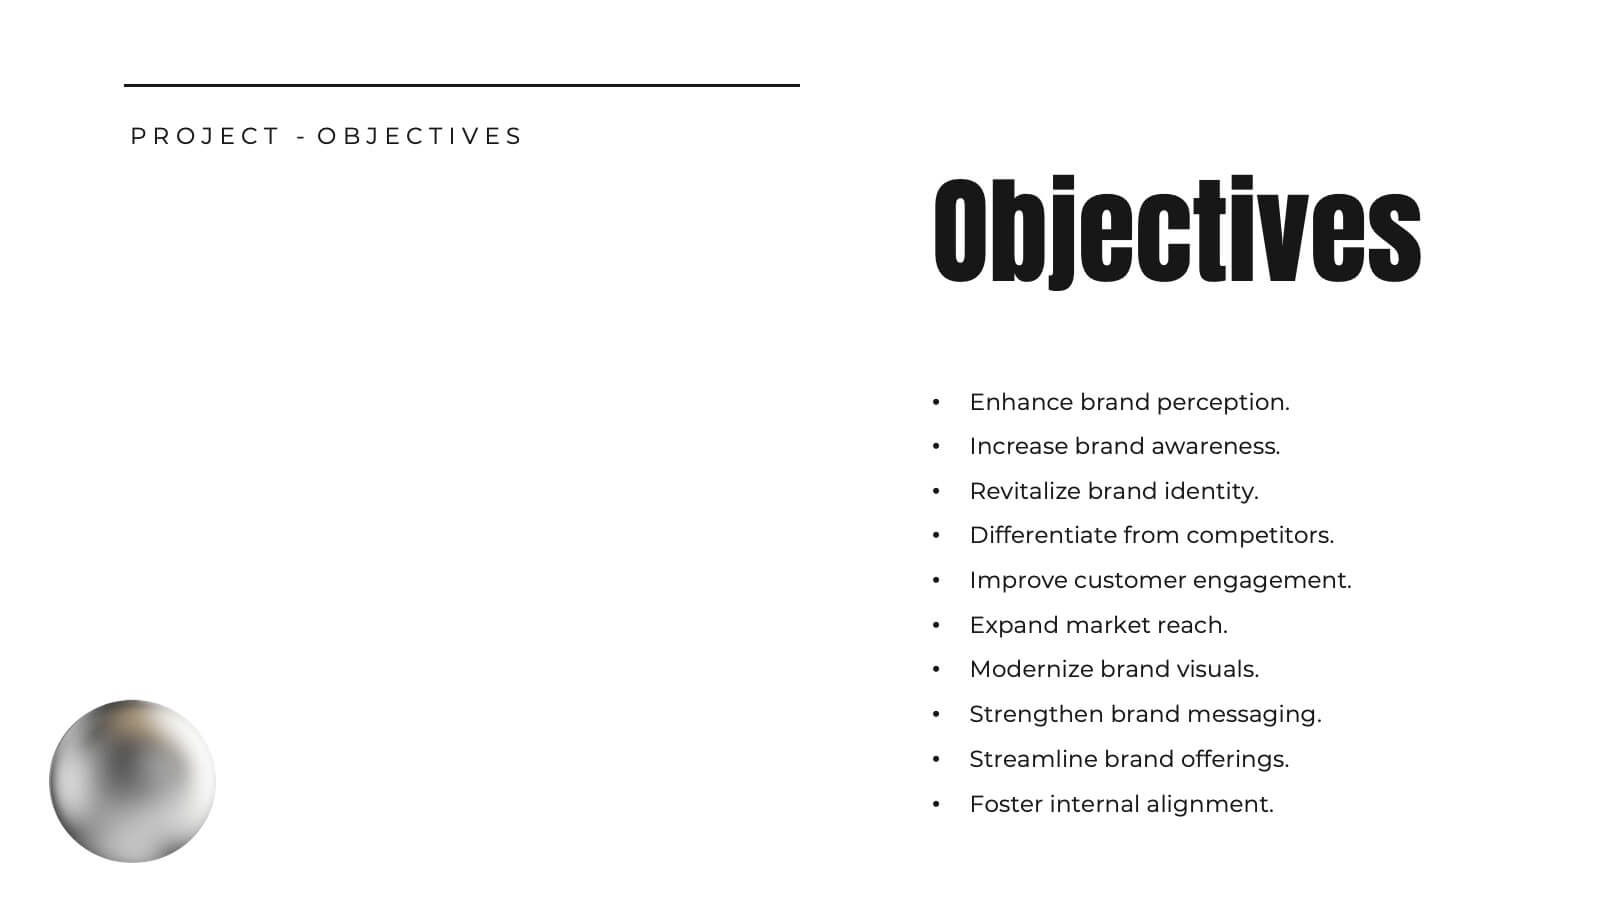
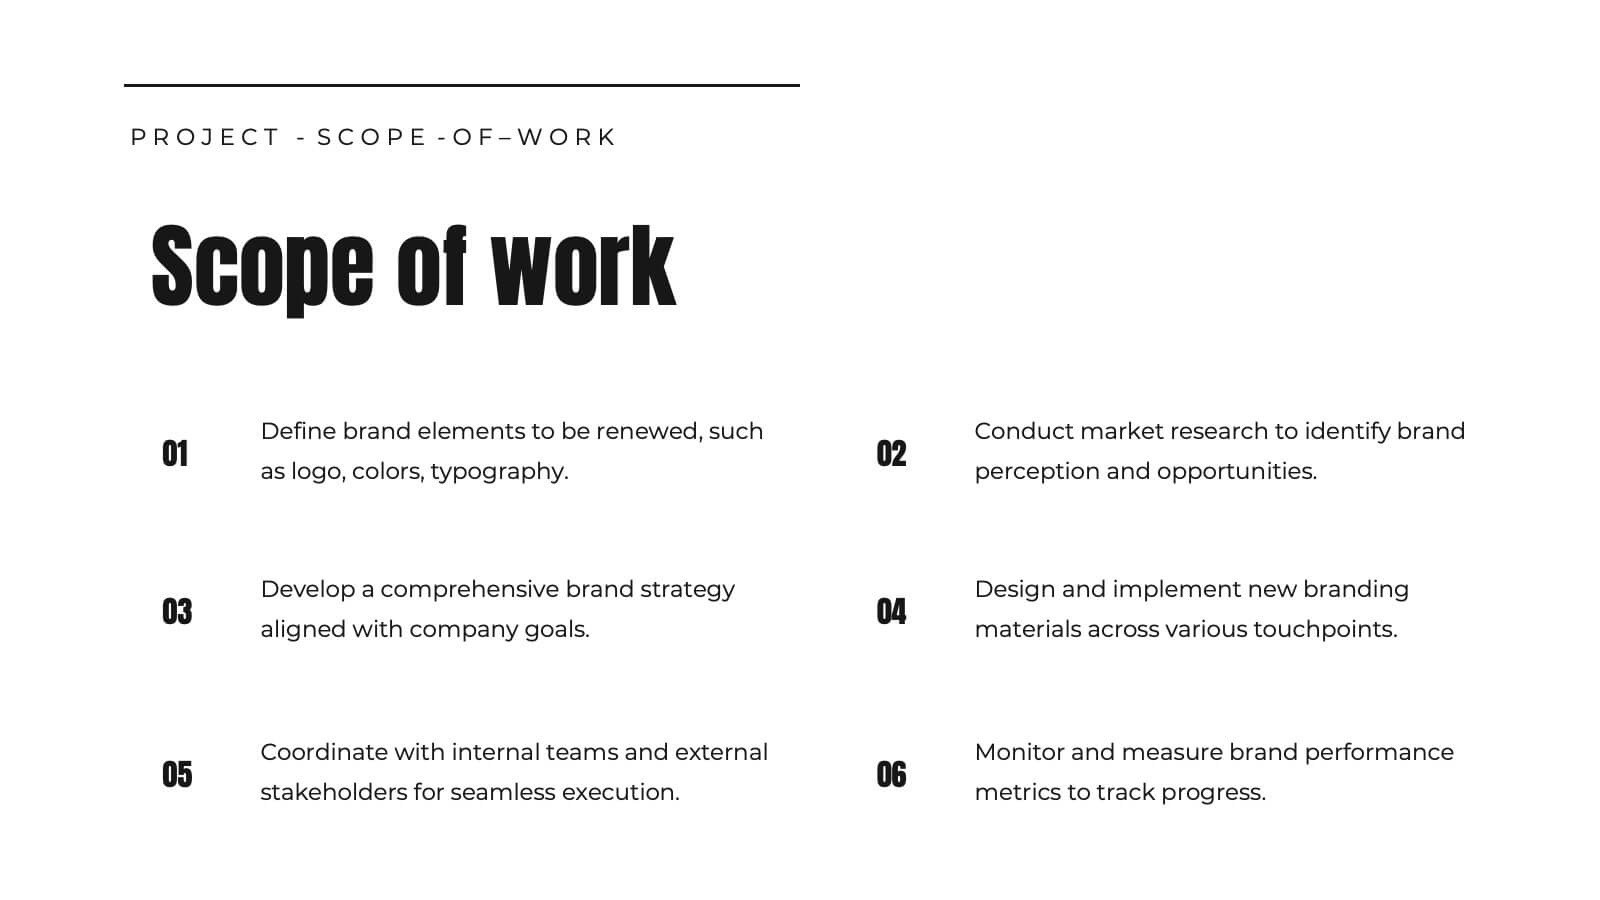
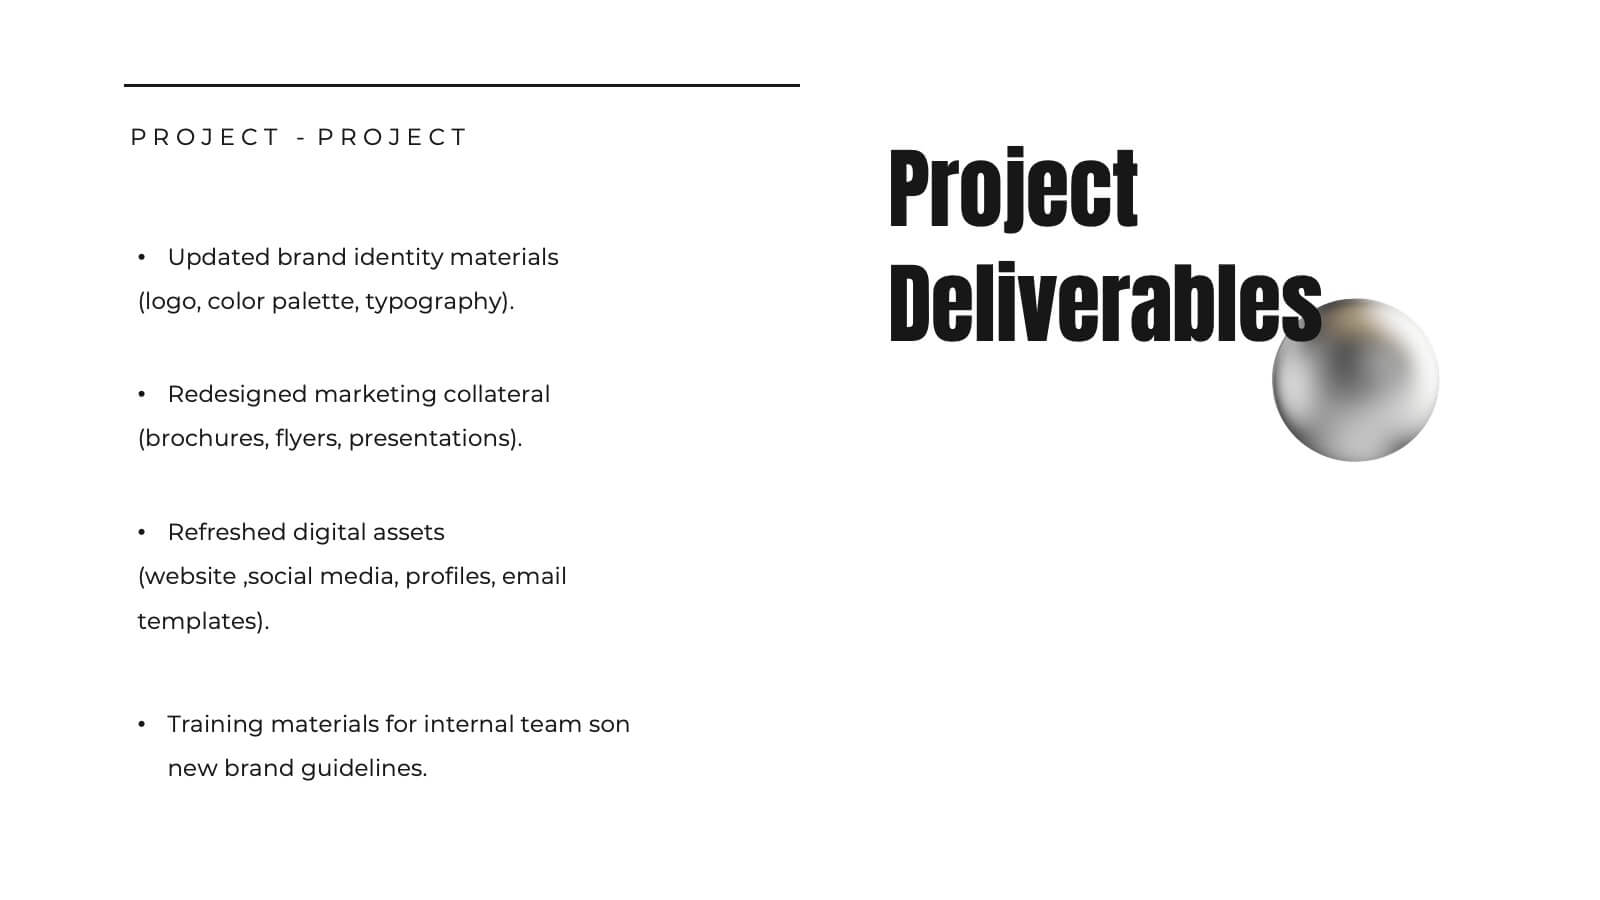
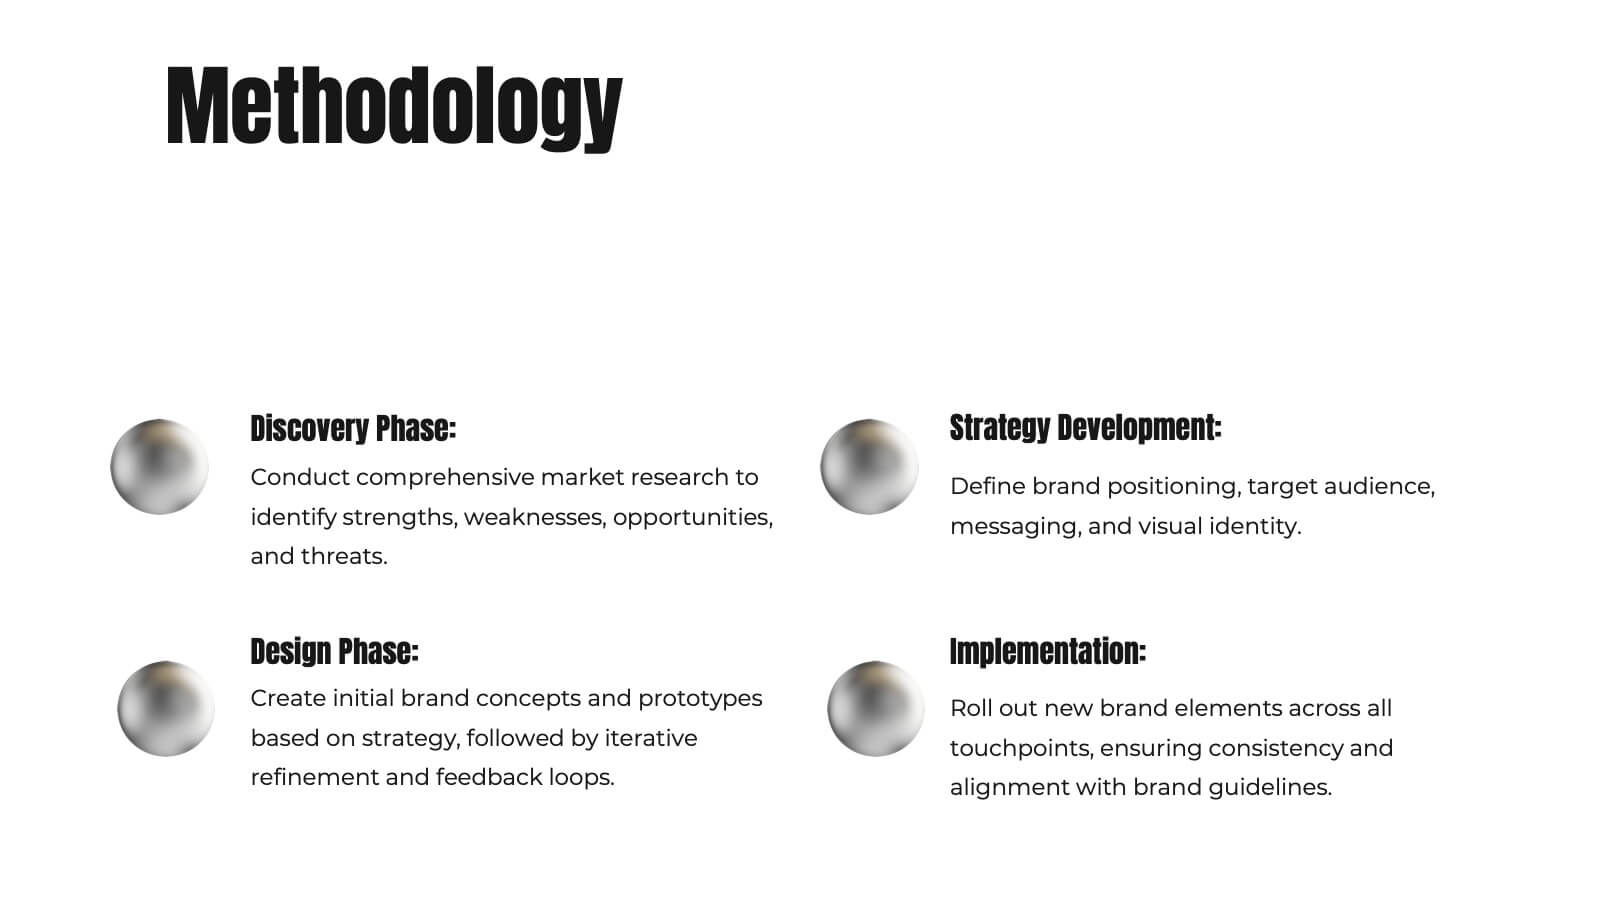
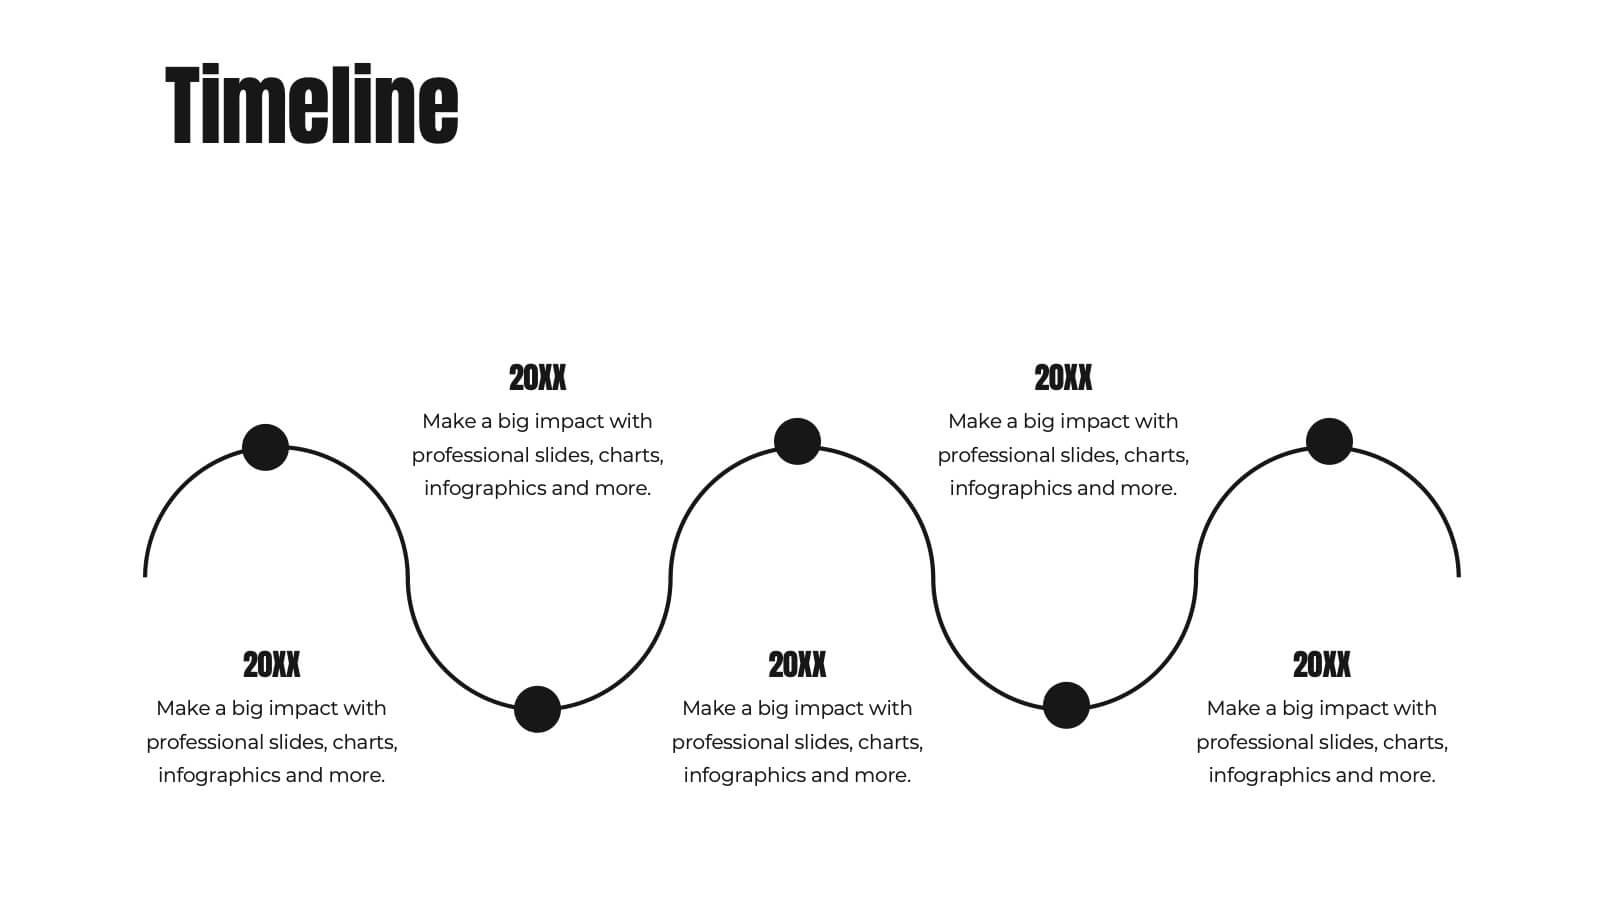
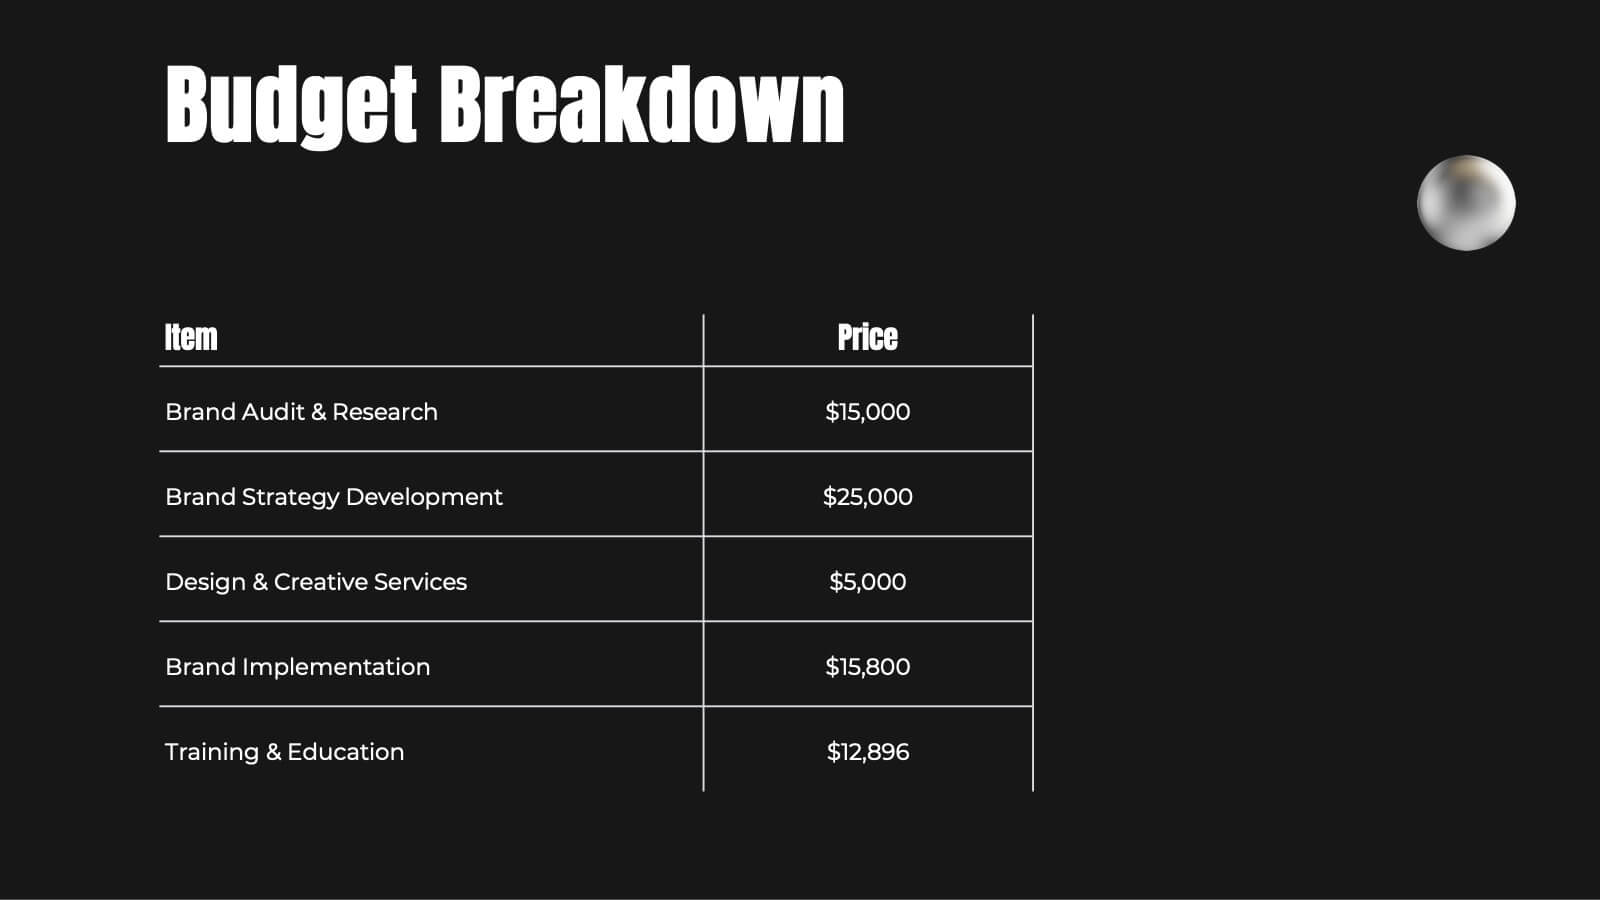
A professional project proposal template for showcasing company overview, objectives, scope of work, timelines, and budget breakdowns. Includes sections for client testimonials, pricing structures, and risk mitigation strategies. Fully customizable for various industries and ideal for pitching new projects. Compatible with PowerPoint, Keynote, and Google Slides for seamless presentations.


6 slides
Design Thinking 5-Stage Model Presentation
Turn creativity into structured innovation with a clean, circular layout that guides your audience through each phase of problem-solving and ideation. Ideal for workshops, strategy sessions, or innovation pitches, this presentation makes complex processes easy to follow. Fully compatible with PowerPoint, Keynote, and Google Slides for seamless editing.


4 slides
Healthcare Trends and Innovations Presentation
Showcase cutting-edge medical insights using this umbrella-themed slide design tailored for healthcare trends and innovations. Ideal for highlighting advancements, protective strategies, or sector forecasts, this template offers a clean, symbolic layout. Fully editable in PowerPoint, Keynote, and Google Slides—perfect for medical professionals, health consultants, and industry analysts alike.


5 slides
Product Life Cycle Strategy Framework Presentation
Bring structure and clarity to your business strategy with this clean circular infographic design. Ideal for showcasing product evolution, performance metrics, and planning stages, it helps visualize complex data in a professional, easy-to-follow format. Fully editable and compatible with PowerPoint, Keynote, and Google Slides for seamless customization.


5 slides
Comparison Table for Feature Mapping Presentation
Compare your product features with ease using this Comparison Table for Feature Mapping presentation. Ideal for highlighting similarities and differences across multiple offerings, this layout uses clean visuals and color-coded elements to show feature availability per product. Perfect for product teams, marketing, or internal decision-making. Compatible with PowerPoint, Canva, and Google Slides.


6 slides
Amortization Schedule Infographic
An amortization schedule is a detailed table that outlines the repayment of a loan over time. This infographic can be a helpful way to visually explain the repayment schedule of a loan or mortgage. Divide it into sections, including an introduction, explanation of terms, example calculations, and key takeaways. Compatible with Powerpoint, Keynote, and Google Slides. Use icons or visuals to represent loan-related concepts, such as a house for mortgages, a money bag for payments, or a graph for interest rates. The line graphs included can show the decreasing principal balance over time, with interest and principal portions highlighted.


8 slides
Customer Demographics Target Market Presentation
Dive into the depths of your audience with the "Customer Demographics Target Market" presentation template. Ideal for marketers and businesses aiming to understand and segment their customer base effectively, this template offers a vibrant, clear visual breakdown of demographic data. Ensure your strategic communications resonate with the right crowd, with compatibility for PowerPoint, Keynote, and Google Slides.


6 slides
Strategic Project Proposal Overview
Present your project priorities with clarity using this bold and colorful Strategic Project Proposal slide. With five stacked segments, it’s ideal for outlining phases, features, or deliverables in a structured format. Fully editable in PowerPoint, Keynote, and Google Slides to suit any industry or workflow.


21 slides
Janus Project Timeline Presentation
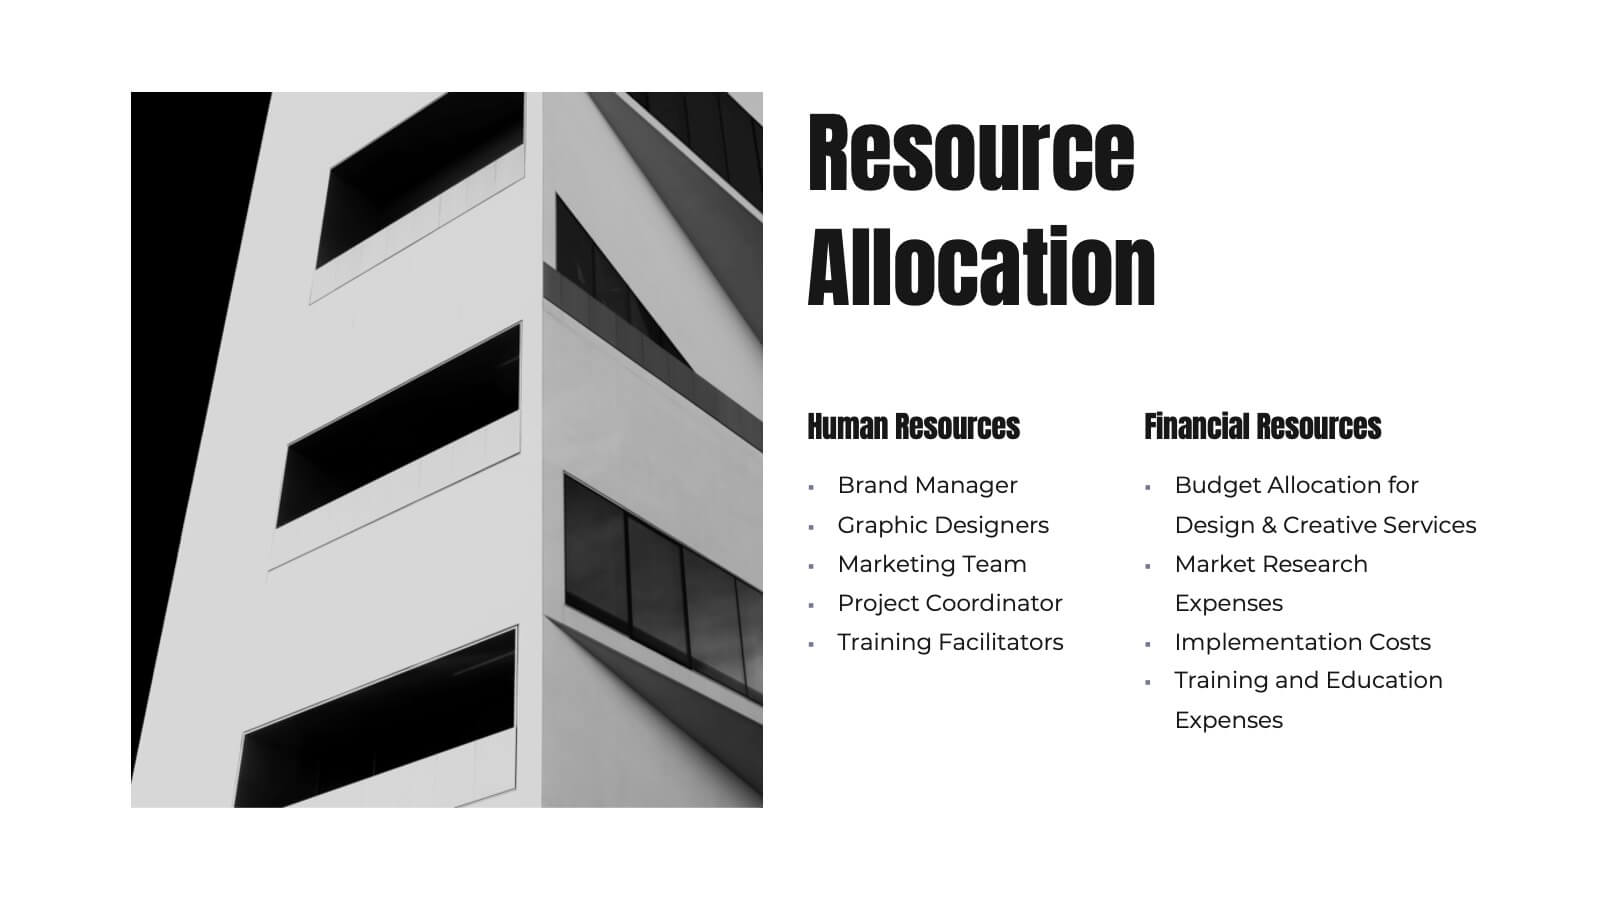
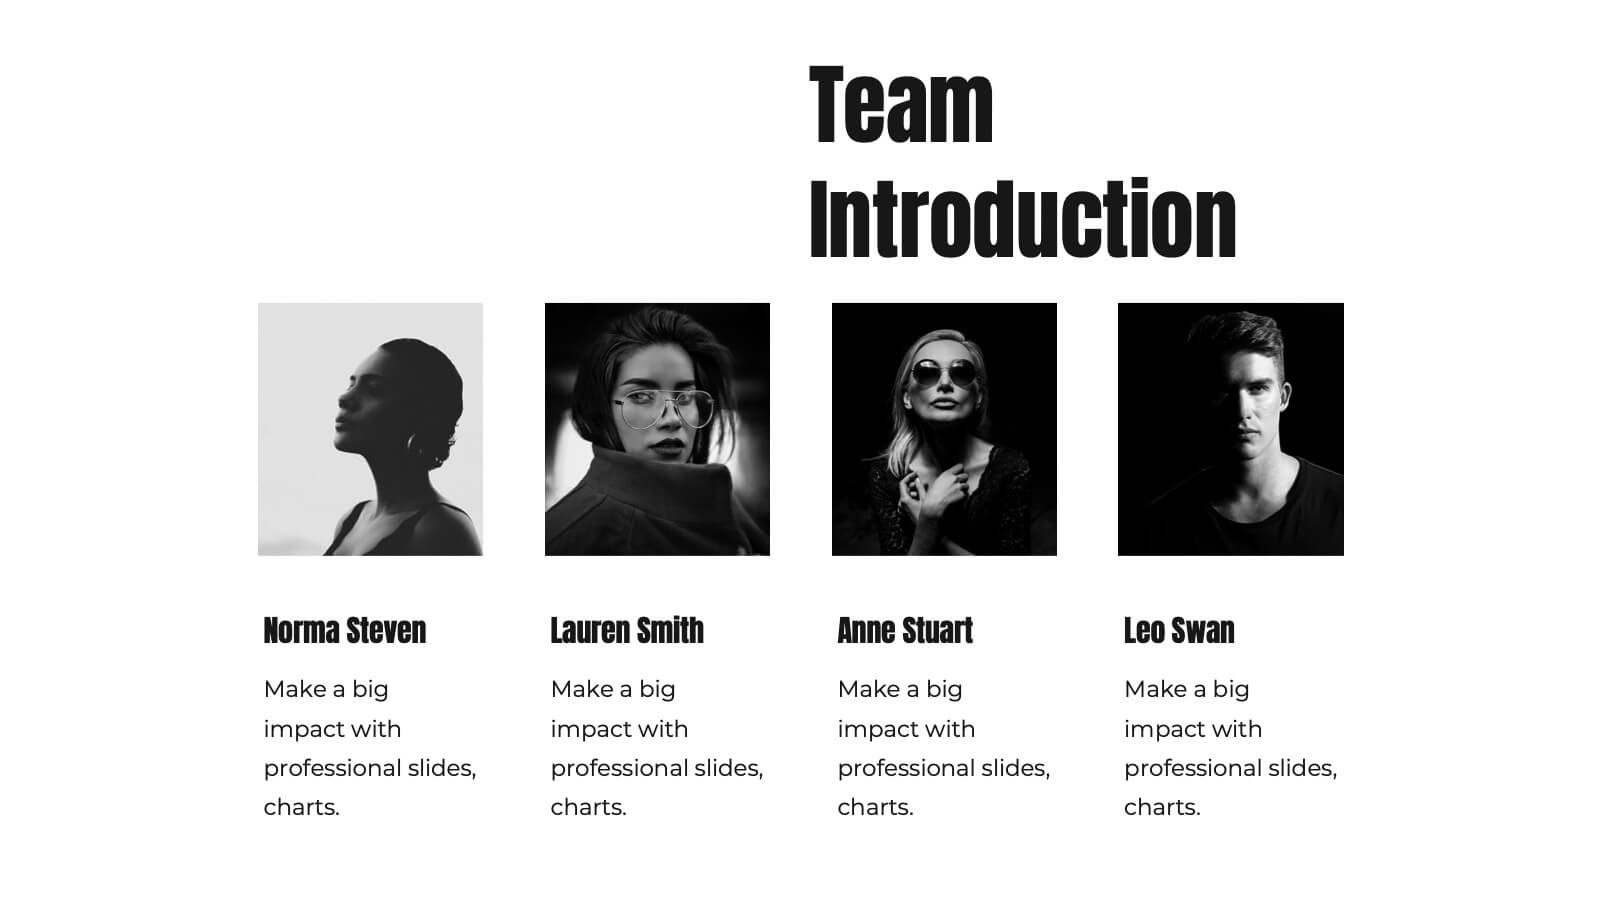
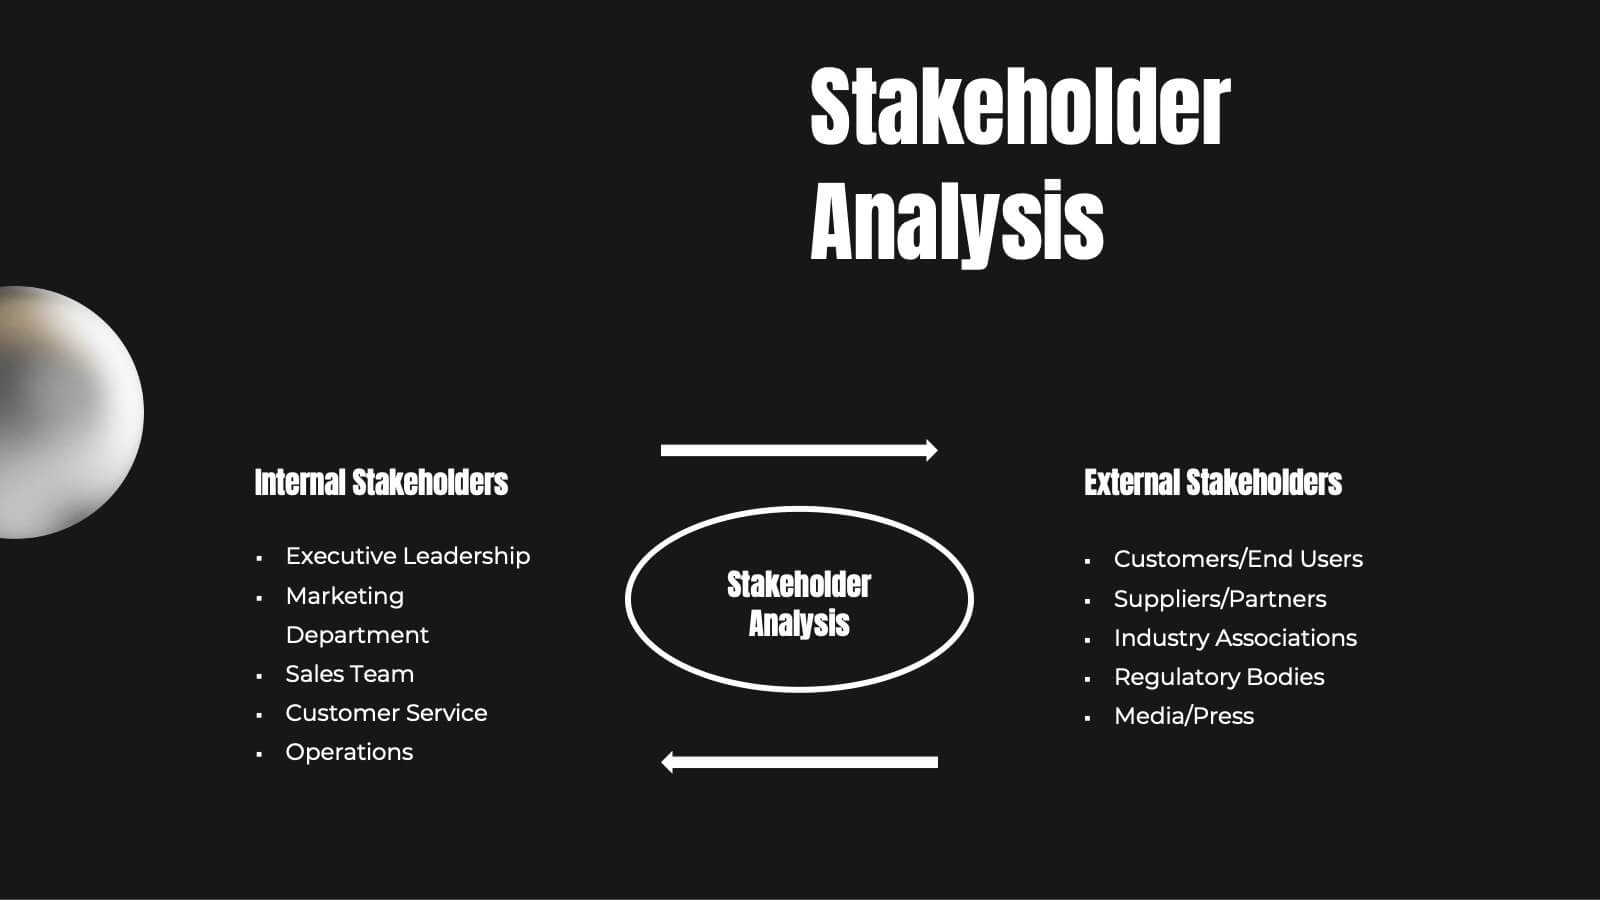
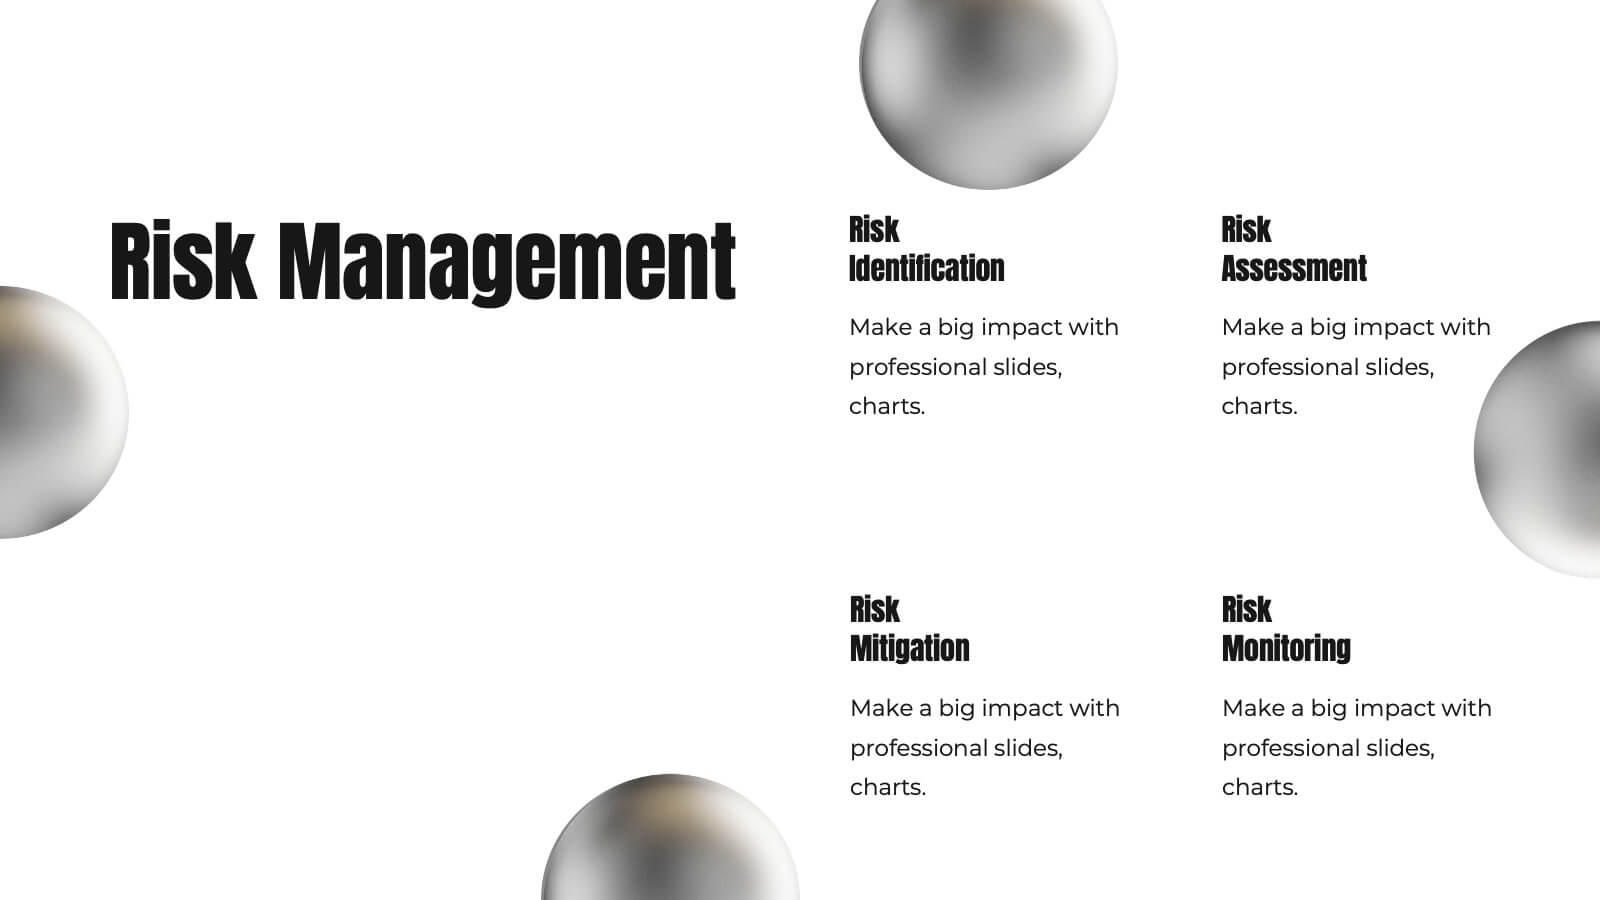
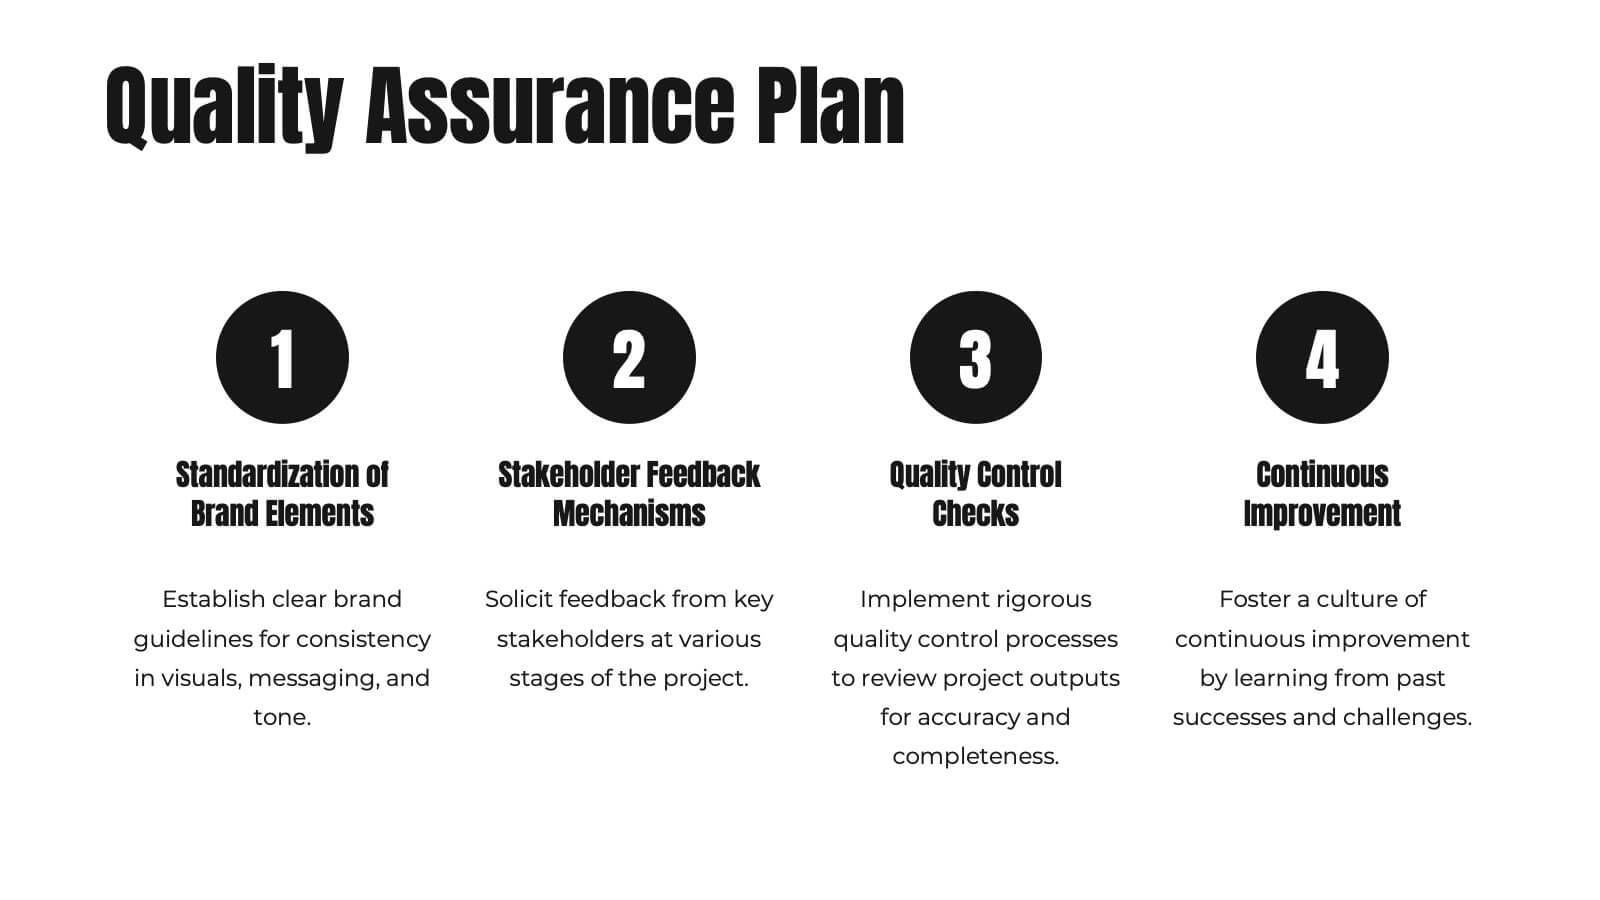
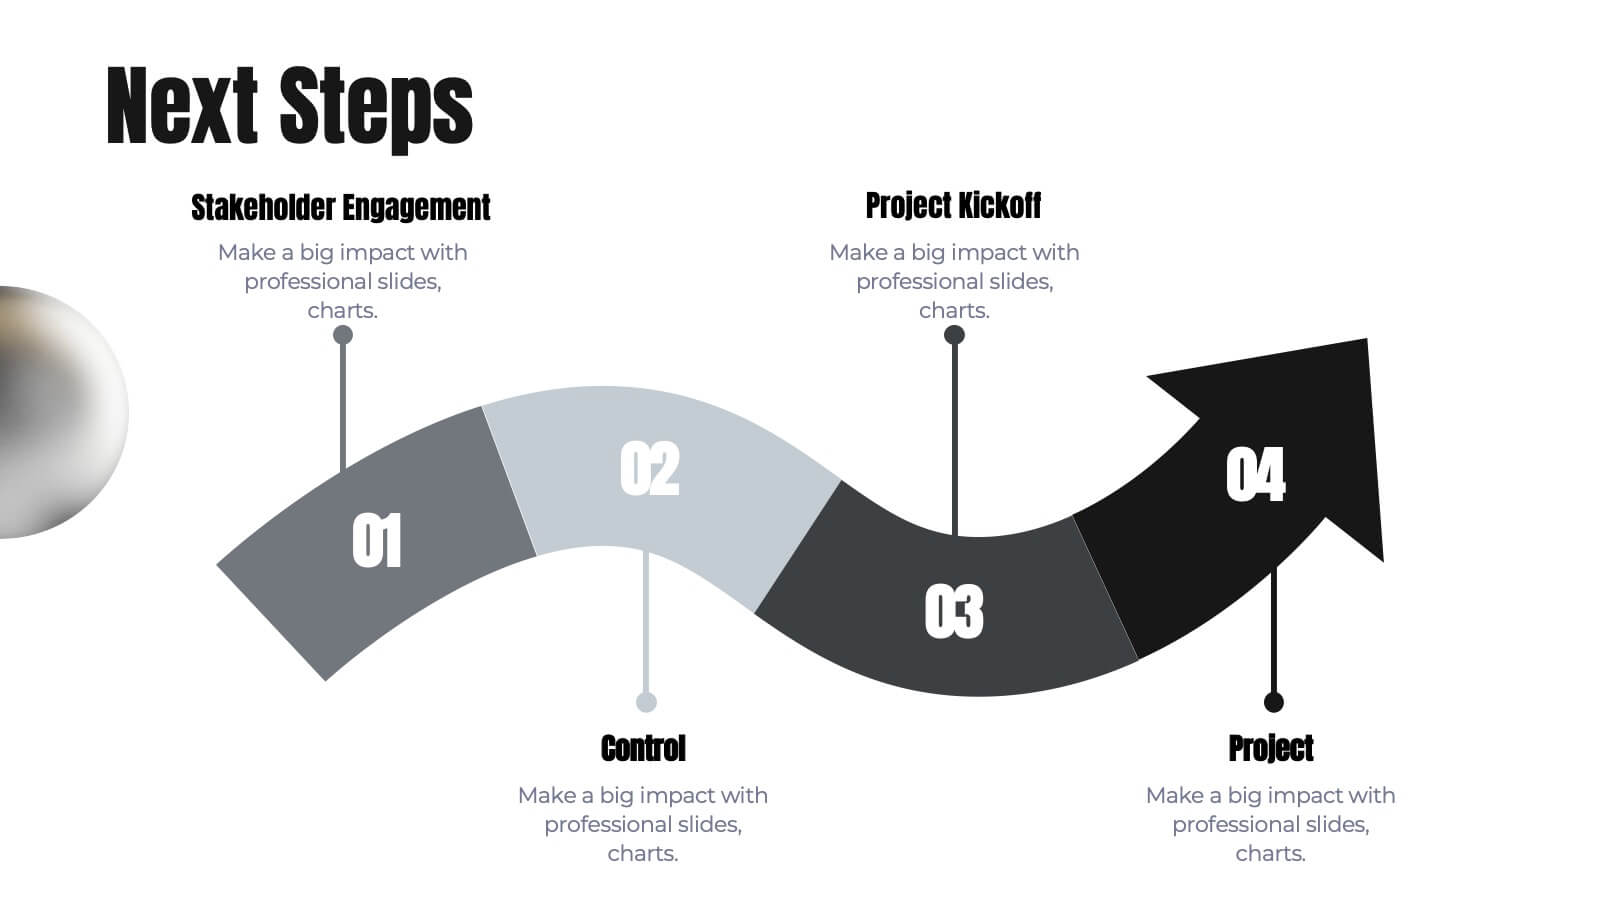
Craft a seamless project plan with this sleek and professional presentation template! Designed to guide you through every step, from project overview and scope of work to risk management and resource allocation, this template covers all the essentials. It's perfect for keeping your team on track with clear deliverables, timelines, and evaluation criteria. Compatible with PowerPoint, Keynote, and Google Slides for effortless presentations.


21 slides
Mystic UX Research Report Presentation
Present your UX research with precision using this sleek and engaging report template! It covers key elements like user research, wireframes, prototyping, testing, and branding guidelines, providing a comprehensive overview of the design process. Ideal for client reviews or team discussions, this template is fully compatible with PowerPoint, Keynote, and Google Slides.


5 slides
Workforce Alignment Strategy Presentation
Energize your strategy conversations with a clean, modern layout that makes team alignment feel clear, structured, and actionable. This presentation helps you break down goals, track priorities, and visualize key initiatives in a simple, intuitive flow. Ideal for planning sessions and leadership updates. Fully compatible with PowerPoint, Keynote, and Google Slides.


7 slides
Bowtie Risk Management Diagram Presentation
Visualize cause and consequence with a clean, symmetrical flow that simplifies complex risk scenarios. This presentation helps you illustrate threats, controls, and outcomes in one cohesive framework, making decision-making clear and impactful. Fully customizable and compatible with PowerPoint, Keynote, and Google Slides for professional risk analysis presentations.


4 slides
Key Pillar Infographic Slide Presentation
Make your ideas stand tall with this modern pillar-themed infographic layout. Perfect for illustrating strategies, business foundations, or organizational principles, it transforms complex data into visually clear, structured visuals. Fully editable and compatible with PowerPoint, Keynote, and Google Slides for professional and easy-to-customize presentations.


6 slides
3D Diagram Slide Presentation
Bring your ideas to life with this modern 3D visual layout that adds depth and clarity to any concept. Ideal for breaking down complex information into four connected sections, it enhances understanding through visual hierarchy. Fully customizable and compatible with PowerPoint, Keynote, and Google Slides for effortless use.


6 slides
TAM SAM SOM for Target Reach Forecasting Presentation
Break down your market reach with clarity using the TAM SAM SOM for Target Reach Forecasting Presentation. This sleek, layered circle diagram is ideal for illustrating your total addressable market, serviceable market, and obtainable market. Customize easily in PowerPoint, Keynote, or Google Slides to align with your brand and business strategy.