


Features
- 5 Unique slides
- Fully editable and easy to edit in Microsoft Powerpoint, Keynote and Google Slides
- 16:9 widescreen layout
- Clean and professional designs
- Export to JPG, PDF or send by email


Do you have any questions?
Recommend


6 slides
Profit Threshold Break-Even Calculation Presentation
Illustrate financial performance with this profit threshold timeline. The layout spans from big loss to high profit, marking each stage with flag icons and editable labels. Ideal for break-even analysis, sales strategies, or ROI comparisons. Easily customizable in PowerPoint, Keynote, and Google Slides to match your brand’s visual identity.


7 slides
Supply Chain Infographic Presentation Template
A Supply Chain is a strategic business process that can help organizations improve capacity, reduce cost and risk, attain growth potential and create value. A supply chain consists of these activity points: Suppliers, Manufacturing, Distribution, retailer, Customers. This template will help you to create a supply chain that meets your needs. It includes six clear steps, fill each box with details about what you want in each part of the supply chain. With this template, you’ll get a clear picture of what’s working in your supply chain and where there are opportunities for improvement.


4 slides
Neuroscience-Inspired Concept Mapping Presentation
Visualize abstract ideas with clarity using the Neuroscience-Inspired Concept Mapping Presentation. Featuring a head silhouette and four labeled concept nodes, this layout is perfect for connecting ideas, frameworks, or steps in a thought process. Fully editable in PowerPoint, Canva, and Google Slides for seamless customization and presentation.


5 slides
History of Vaccine Infographics
The History of Vaccines is a fascinating journey that spans centuries and has significantly impacted human health and disease prevention. With these infographic templates, you can effectively communicate the importance of vaccines, highlight their role in disease prevention, and debunk common misconceptions. It serves as an educational tool to promote understanding and appreciation for the significant advancements in vaccine development that have saved countless lives throughout history. Use these to provide a comprehensive overview of the history of vaccine and help individuals understand the importance and impact of vaccines.


6 slides
Six-Sided Strategy with Hexagon Infographic Presentation
Present your six-point plan with clarity using the Six-Sided Strategy with Hexagon Infographic Presentation. This geometric layout highlights each core element in a balanced, easy-to-follow format—ideal for frameworks, business models, or strategy steps. Fully customizable in Canva, PowerPoint, Keynote, and Google Slides for seamless integration.


6 slides
Framework Architect Infographics
Explore the role of a Framework Architect with our customizable infographic template. This template is fully compatible with popular presentation software like PowerPoint, Keynote, and Google Slides, allowing you to easily customize it to illustrate and communicate the responsibilities and key aspects of a Framework Architect's role. The Framework Architect infographic template offers a visually engaging platform to define and explain the responsibilities, skills, and contributions of a Framework Architect within the field of software development or architecture. Whether you're a software architect, IT professional, or simply interested in understanding this role, this template provides a user-friendly canvas to create informative presentations and educational materials. Deepen your understanding of the Framework Architect role with this SEO-optimized infographic template, thoughtfully designed for clarity and ease of use. Customize it to highlight key responsibilities, architectural frameworks, collaboration methods, and the importance of this role in software development projects. Ensure that your audience gains valuable insights into the world of Framework Architecture. Start crafting your personalized infographic today to explore the role of a Framework Architect in greater depth.


21 slides
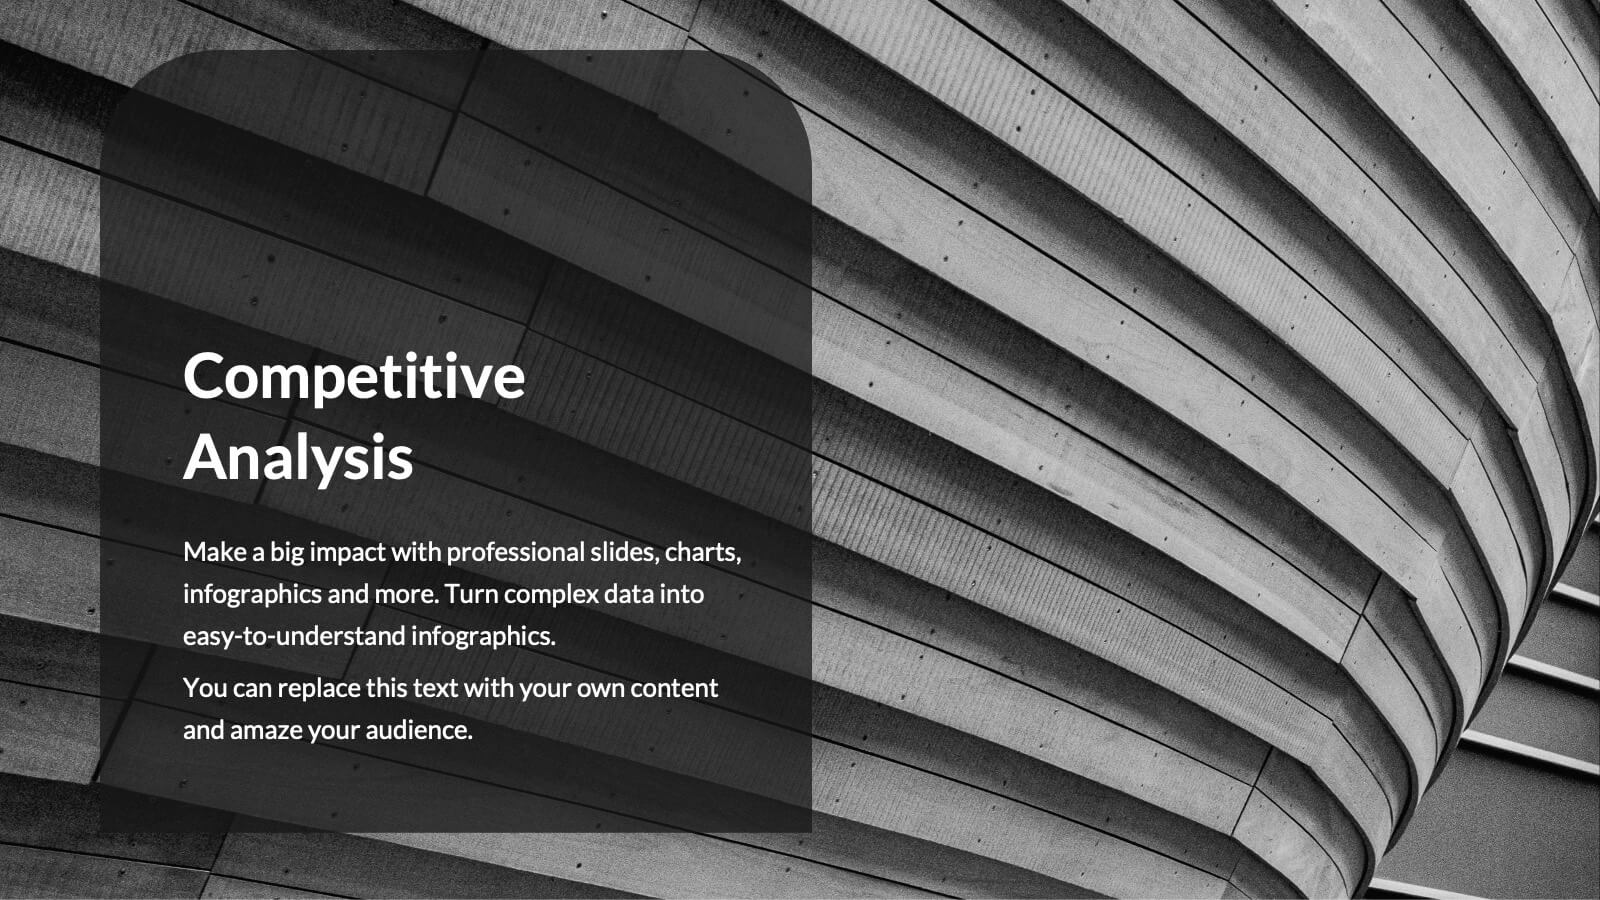
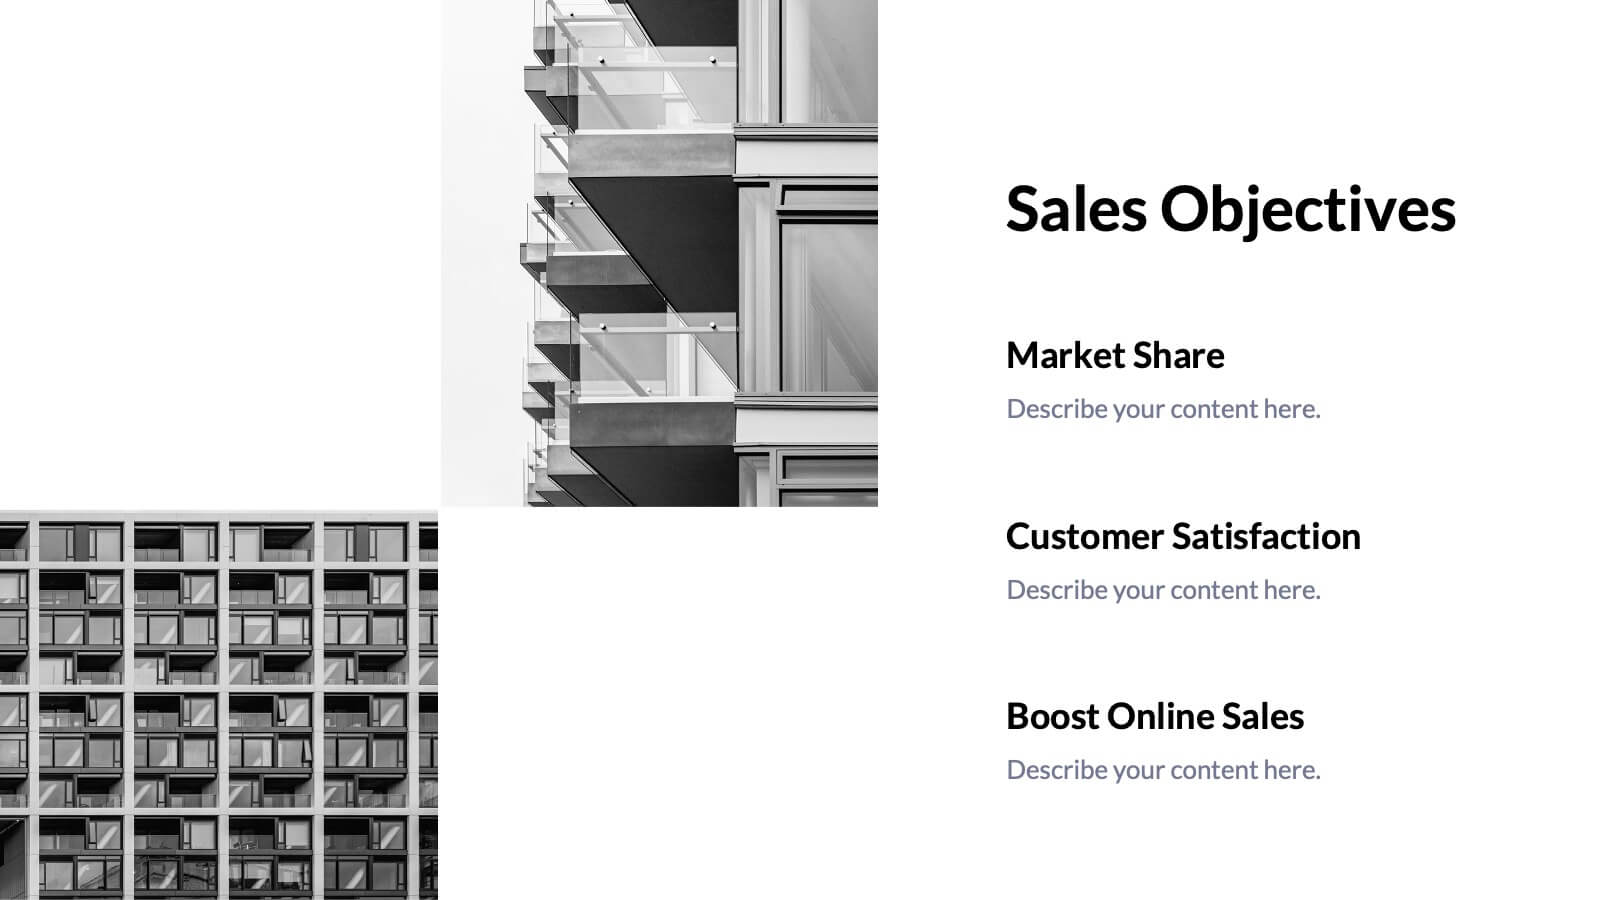
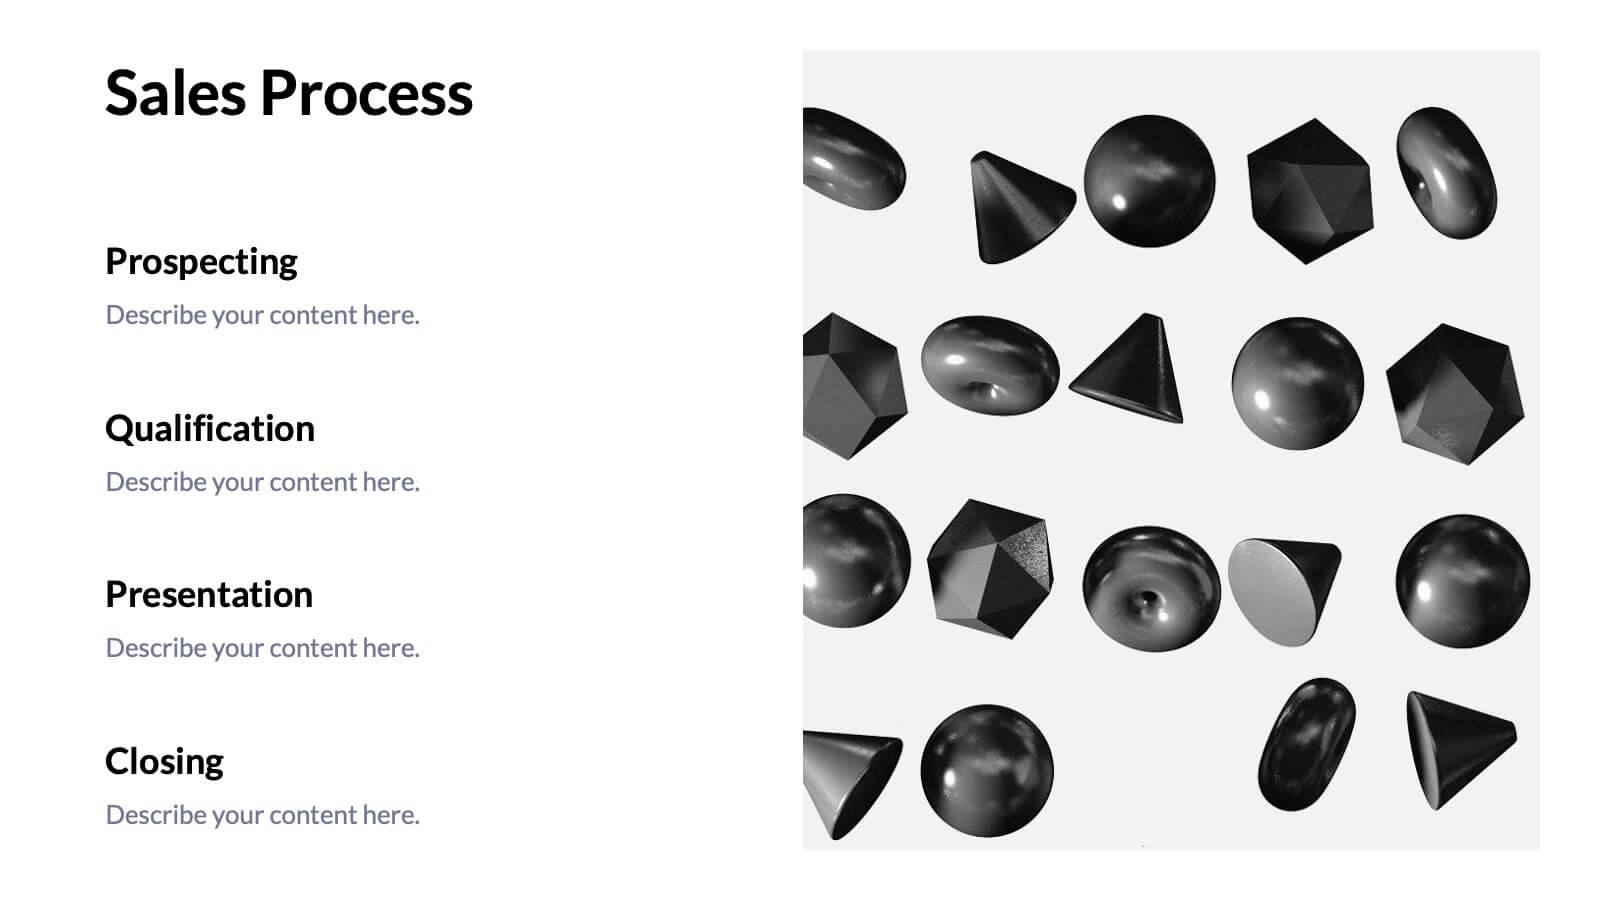
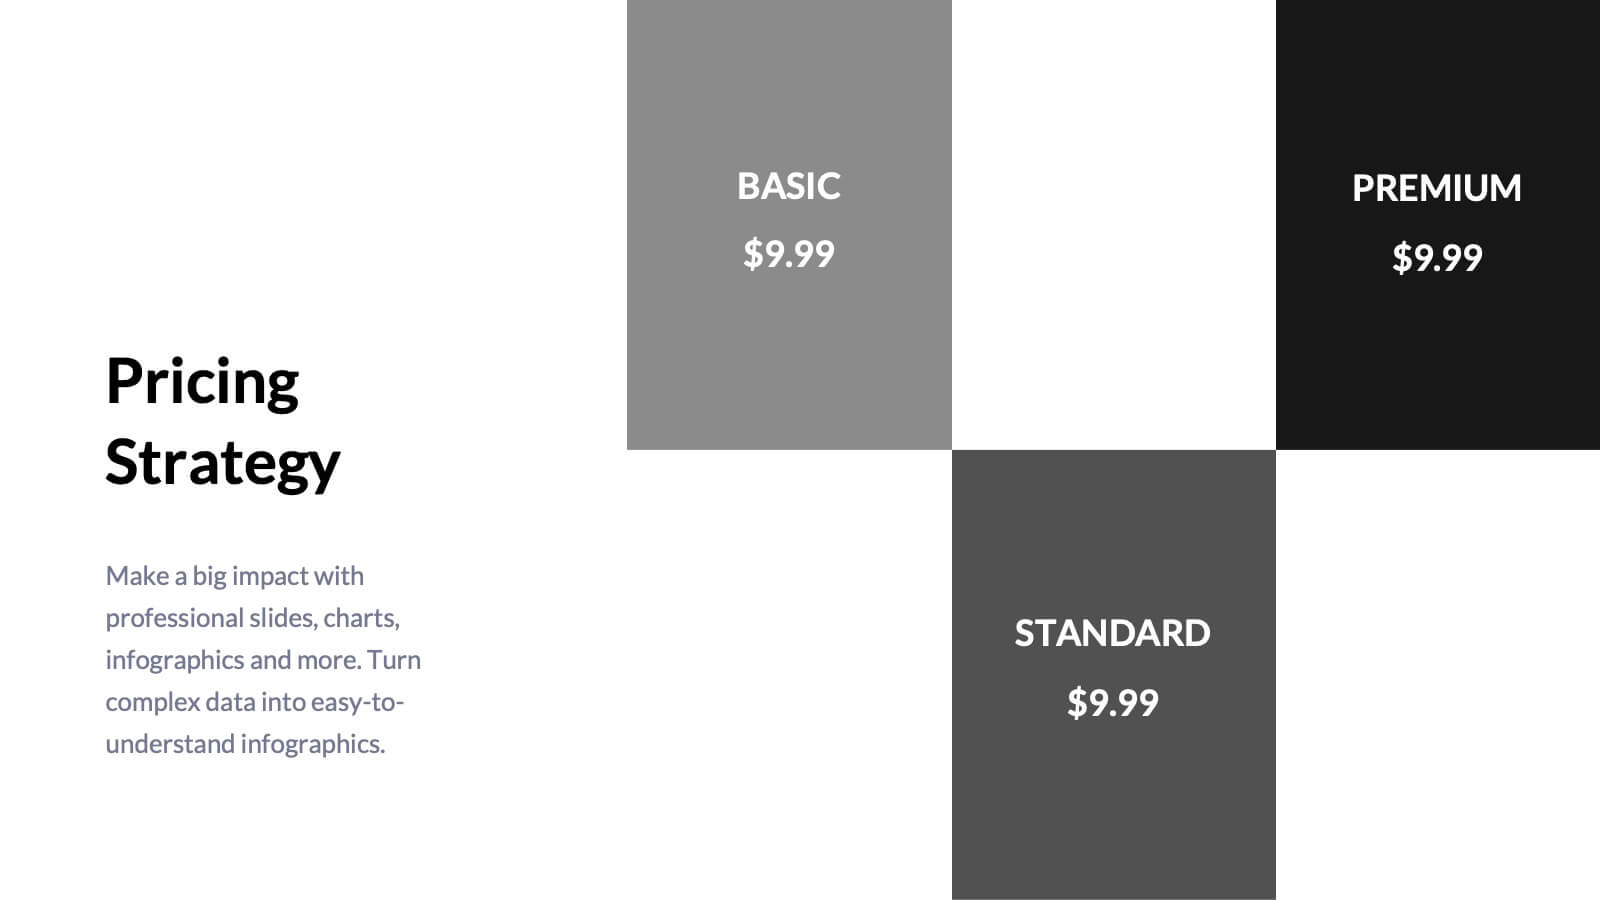
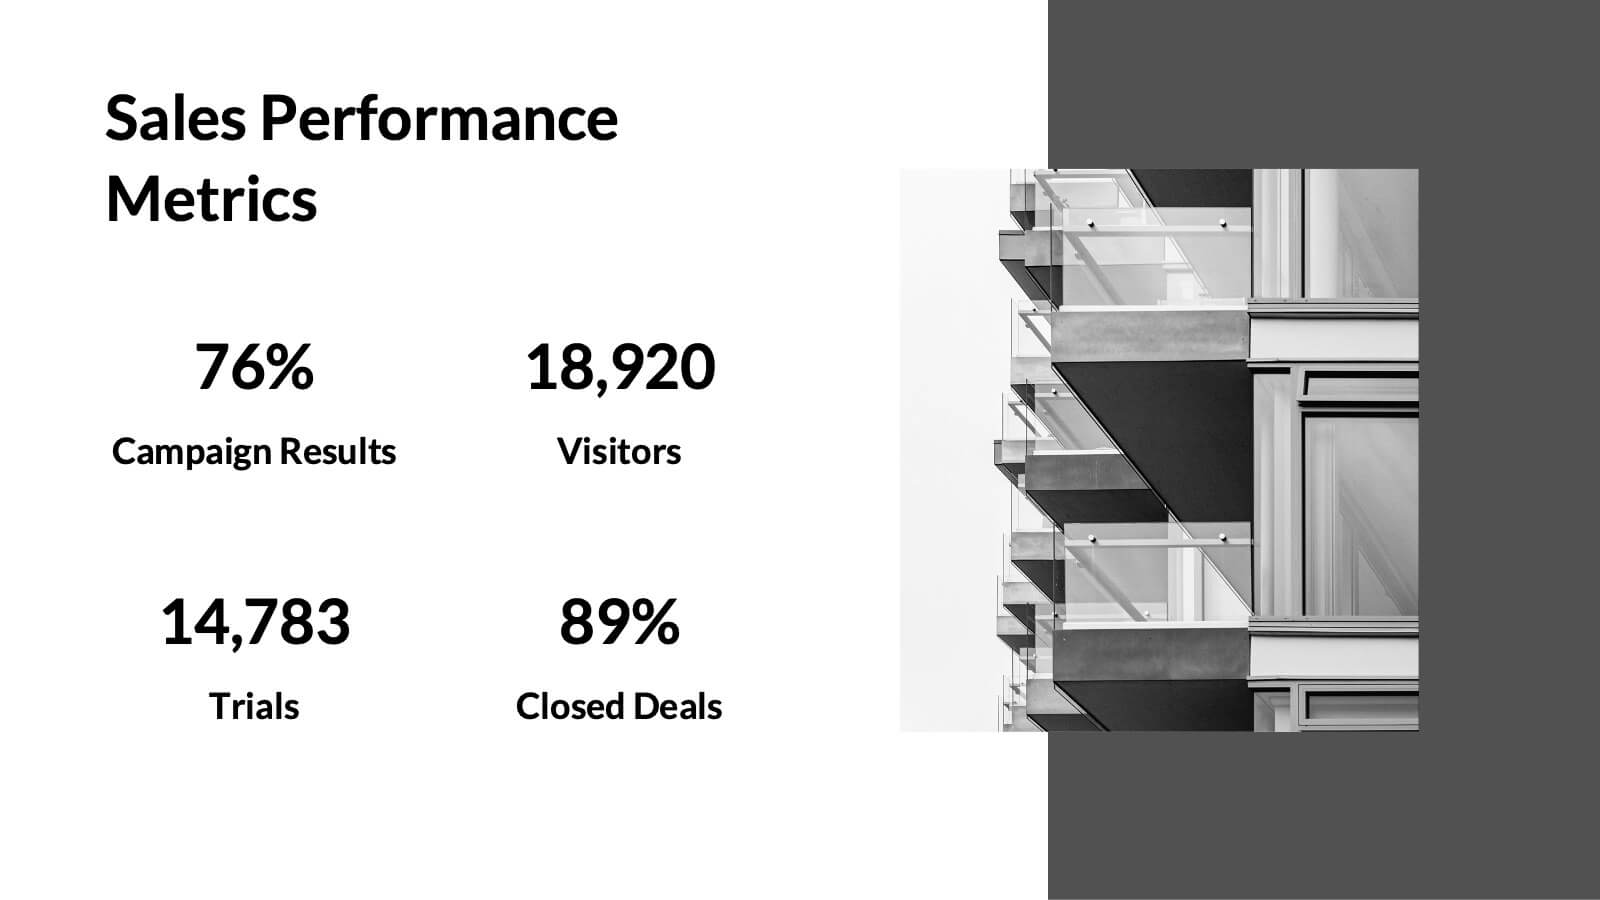
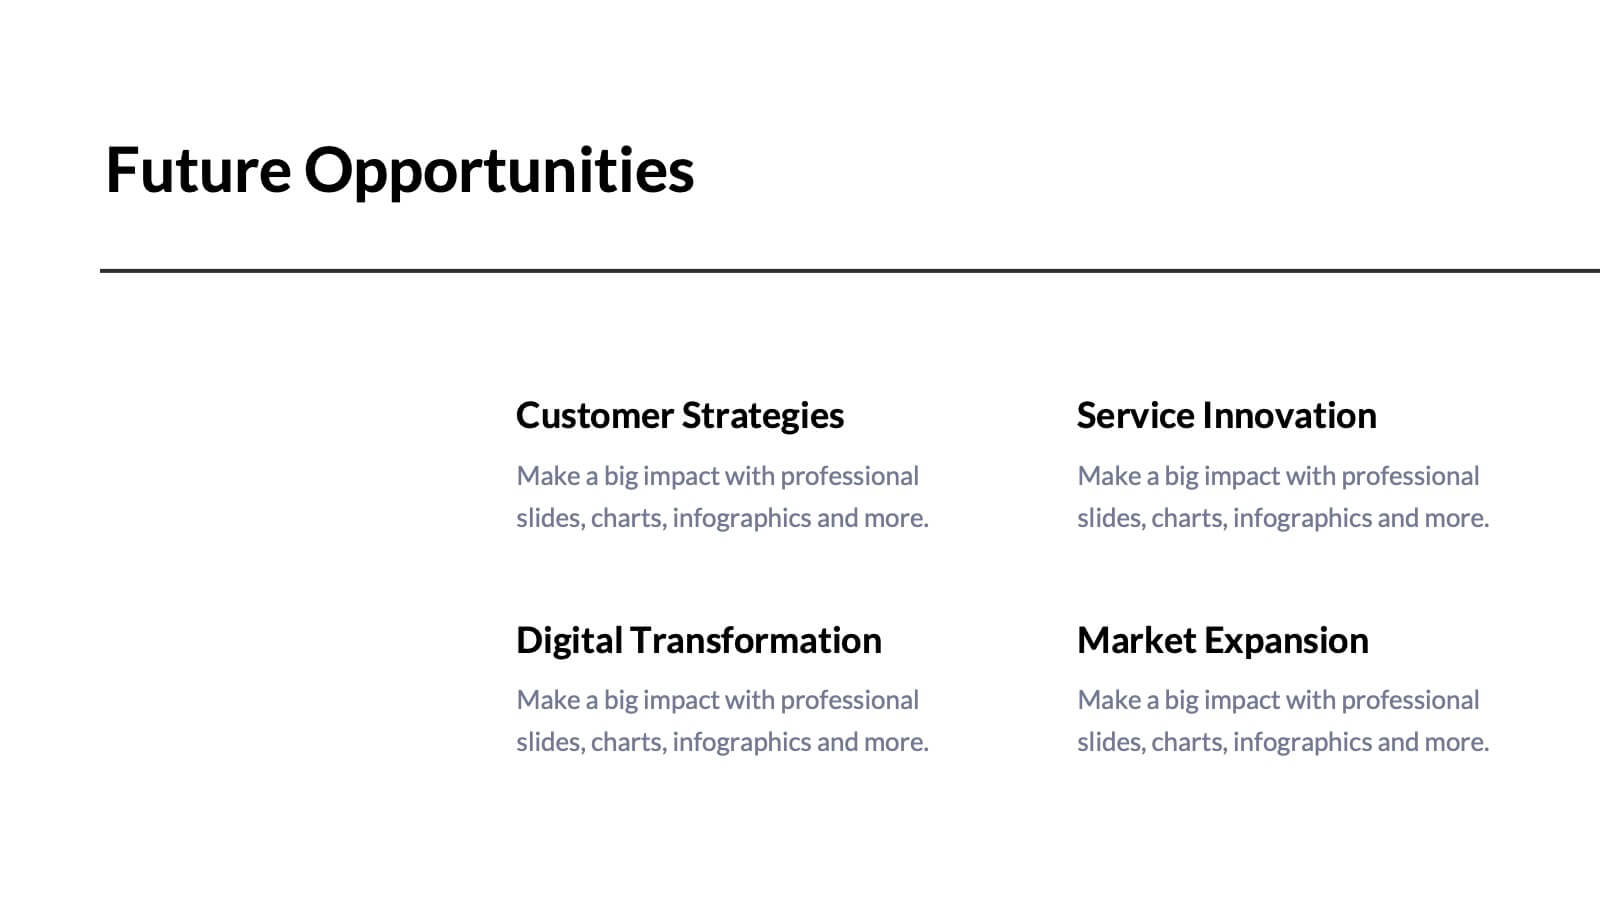
Tempest Sales Performance Report Presentation
Supercharge your sales presentations with this sleek, professional template. Perfect for outlining sales objectives, processes, and performance metrics, it features a clean, minimalist design that enhances clarity and impact. Highlight key elements like competitive analysis, pricing strategy, and future opportunities to captivate your audience. Compatible with PowerPoint, Keynote, and Google Slides, it ensures seamless presentations on any platform.


6 slides
Aviation Safety and Efficiency Presentation
Take your audience to new heights with this modern aviation-themed infographic layout. Perfect for illustrating flight performance, safety systems, and operational improvements, it combines clarity with sleek visual flow to enhance understanding. Fully customizable and compatible with PowerPoint, Keynote, and Google Slides for effortless professional presentations.


4 slides
Social Media Calendar Overview
Stay organized and consistent with your posting schedule using the Social Media Calendar Overview Presentation. This clean, visual weekly planner helps you map out daily content across multiple categories with color-coded bullets and structured columns from Monday to Sunday. Perfect for content teams, marketers, and freelancers managing multi-platform campaigns. Fully customizable in PowerPoint, Keynote, and Google Slides.


21 slides
Terraflare Project Status Report Presentation
Keep stakeholders updated with this comprehensive project status report template, featuring agenda, key highlights, performance metrics, project progress, risk assessments, and goals. Easily track progress, strategic initiatives, and team productivity. Perfect for PowerPoint, Keynote, and Google Slides, ensuring clear communication of project updates and priorities.


3 slides
Supply Chain and Transportation Map Presentation
Navigate the complexities of modern logistics with this engaging visual designed to map out each phase of product movement. This infographic breaks down the supply chain and transportation process into three clear stages—road, lift, and ship—making it easy to explain workflows or illustrate system improvements. Compatible with PowerPoint, Keynote, and Google Slides.


7 slides
Creative Timeline Infographic Presentation Template
A Timeline is an essential tool to illustrate the chronology of events; it also provides a method for organizing and summarizing material. With the timelines provided in this template you will be able to visualize the passage of time, so that you can better understand how influences from the past still impact your life today. This template is designed to assist you with crafting your timeline so that it can be easily understood. The color-coding makes it easy to see daily progress. Use the timelines in this template to create useful visualization, and convey the growth of your business or brand.


7 slides
Market Focus and Demographic Insights Presentation
Present your audience data with clarity using this Market Focus and Demographic Insights presentation. Designed with a central persona and six key data points, this slide helps visualize customer characteristics, behavioral trends, and strategic targets. Great for marketing, branding, or investor decks. Fully editable in Canva, PowerPoint, and Google Slides.


7 slides
Iceberg Infographic Presentation Template
An Iceberg infographic is a powerful and eye-catching way to display information, it is a method for presenting complex information. This template is designed to be fully customizable and include all the elements you need to make an impact on your audience. The Iceberg can be used to visualize any concept that has a direct impact on your performance, from sales to customer retention, from how organizations are staffed to identifying the key players within teams. Use this template to create a detailed iceberg diagram of your business, its customers, and the things that impact them.


6 slides
Executive Summary Slide Deck Presentation
Kick off your message with a slide that instantly pulls everything together in a clean, engaging flow. This presentation helps you highlight key insights, outline major updates, and present essential takeaways with clarity and structure. Ideal for meetings, reports, and leadership briefs. Fully compatible with PowerPoint, Keynote, and Google Slides.


10 slides
Body System Educational Overview Presentation
Dive into anatomy with a slide that makes learning the human body visual, clear, and interactive. This educational overview breaks down key body systems into simple, labeled sections—perfect for classroom teaching, medical training, or health awareness campaigns. Fully editable and compatible with PowerPoint, Keynote, and Google Slides for seamless customization.


6 slides
Business Concepts Using Geometric Layouts Presentation
Present your key business ideas with this structured, modern layout featuring six colorful geometric segments. Ideal for showcasing strategies, goals, or processes with visual clarity. Each section allows for brief insights with clean iconography. Fully editable in PowerPoint, Google Slides, Keynote, and Canva—perfect for professional, client-facing presentations.