


Features
- 3 Unique slides
- Fully editable and easy to edit in Microsoft Powerpoint, Keynote and Google Slides
- 16:9 widescreen layout
- Clean and professional designs
- Export to JPG, PDF or send by email


Do you have any questions?
Recommend


6 slides
Financial Report and Charts Presentation
Deliver financial insights with impact using this Financial Report and Charts Presentation Template. Featuring a clean layout with a money bag visual and percentage breakdowns, it’s perfect for showcasing profit distribution, investment categories, or budget summaries. Fully customizable in PowerPoint, Keynote, and Google Slides.


5 slides
Collaboration Tools for Team Efficiency Presentation
Visualize teamwork like never before with the Collaboration Tools for Team Efficiency Presentation. Featuring a puzzle-style layout, this slide highlights four interconnected ideas or steps—perfect for team workflows, project milestones, or tool comparisons. Easy to customize in Canva, PowerPoint, or Google Slides.


7 slides
Female Anatomy Infographic
Anatomy is the branch of biology that focuses on the structure and organization of living things. Step into a world of discovery with our infographic template, this is an enlightening visual guide that celebrates the intricate beauty and functionality of the female body. This infographic is designed to educate and empower, offering a clear and artistic representation of the anatomy that defines women. This template will take your audience through an educational journey through the various systems that make up a woman's body. This is fully customizable and compatible with Powerpoint, Keynote, and Google Slides.


5 slides
Construction Processes Infographics
Dive into the construction industry with this detailed infographic template that provides a comprehensive overview of construction processes, careers, and competitive strategies. Ideal for professionals, educators, and students involved in construction, this resource offers a clear and structured presentation of various aspects of the field. The infographic is divided into sections detailing key areas such as industry sectors, job roles, and strategic approaches for sustainable competitiveness. It highlights important segments like planning, finance, legal aspects, and on-site construction activities, all designed to give a well-rounded view of the construction process. Additionally, it includes data on job growth, employment statistics, and future projections, which are crucial for understanding labor market trends within the construction sector. Vibrant colors and easy-to-understand layouts make this template not only informative but also visually appealing. Whether used in training sessions, academic courses, or professional presentations, this infographic is a valuable tool for conveying the dynamic and multifaceted nature of the construction industry.


4 slides
Market Expansion Strategy in South America Map Presentation
Visualize growth opportunities with this South America market expansion map. Designed with directional arrows and regional color highlights, it helps communicate entry strategies, investment plans, or operational shifts. Ideal for business reports or strategy decks. Easily customizable and compatible with PowerPoint, Google Slides, and Keynote for seamless editing.


4 slides
Action Plan and Next Phase Outline Presentation
Stay organized and move forward with confidence using the Action Plan and Next Phase Outline Presentation. This slide features a clear four-step vertical roadmap with alternating color-coded blocks and icons, perfect for project milestones, implementation steps, or strategic priorities. Easily editable in PowerPoint, Keynote, and Google Slides.


6 slides
3D Technologies Infographics
Dive into the world of 3D Technologies with our customizable infographic template. This template is fully compatible with popular presentation software like PowerPoint, Keynote, and Google Slides, allowing you to easily customize it to showcase various aspects and applications of 3D technologies. The 3D Technologies infographic template provides a visually engaging platform to explore and explain the world of three-dimensional technology, from 3D printing and modeling to virtual reality and augmented reality. Whether you're an enthusiast, educator, or industry professional, this template offers a user-friendly canvas to create informative presentations and educational materials. Elevate your understanding of 3D Technologies with this SEO-optimized infographic template, thoughtfully designed for clarity and ease of use. Customize it to highlight the key principles, applications, and innovations within the 3D technology landscape, making complex concepts accessible to your audience. Start crafting your personalized infographic today to delve into the exciting realm of 3D Technologies.


7 slides
5G Benefits Infographic
Step into the ultra-fast world of 5G with our vibrant 5G benefits infographic. Set against a lively pink backdrop with bursts of other vivid colors, this infographic captures the essence of dynamism and speed. Sleek icons paired with concise descriptions highlight the myriad advantages of 5G, from lightning-fast downloads to broader bandwidth. This modern, innovative infographic is ideal for telecom companies, tech enthusiasts, businesses leveraging 5G, and educators discussing modern communication technologies. Designed for adaptability, it's compatible with PowerPoint, Keynote, and Google Slides.


5 slides
Strategic Matrix Grid Analysis Presentation
Clarify your strategic insights with the Strategic Matrix Grid Analysis Presentation. This layout uses a 2x2 quadrant design to showcase four key categories or scenarios—ideal for SWOT, risk vs. reward, product positioning, or capability mapping. Clean labels, icons, and text areas help break down each quadrant’s significance. Fully editable in PowerPoint, Google Slides, Keynote, and Canva.


22 slides
Vivid Market Research Presentation
Unveil the insights that drive decisions with the Vivid Market Research Presentation template! This sleek and professional template is crafted to help you present complex data in an engaging and easy-to-understand format. Whether you're analyzing market trends, exploring customer behavior, or evaluating competitive landscapes, this template provides a clear structure to convey your findings. It includes sections for research objectives, methodologies, key findings, and recommendations, ensuring you cover every aspect of your market research comprehensively. With a clean design that emphasizes clarity and visual appeal, your audience will stay focused and intrigued throughout the presentation. Perfect for business analysts, marketers, and researchers, the Vivid template is fully customizable and works seamlessly with PowerPoint, Keynote, and Google Slides. Elevate your market research presentations and make your data come to life with Vivid!


3 slides
Risk Assessment Spider Chart
Evaluate risks across key criteria with the Risk Assessment Spider Chart Presentation. This template showcases a multi-dimensional radar chart, ideal for comparing variables like probability, impact, and preparedness. Use this to present security assessments, project vulnerabilities, or business exposure insights. Fully editable in PowerPoint, Keynote, and Google Slides.


20 slides
Illumira Design Proposal Presentation
Impress clients with this modern and professional design proposal presentation template. It covers key sections such as project summary, objectives, budget breakdown, and action plans. Fully customizable with clean layouts and engaging visuals, perfect for showcasing your design solutions effectively. Compatible with PowerPoint, Keynote, and Google Slides.


5 slides
Effects of Cyberbullying Infographics
Cyberbullying refers to the use of electronic communication platforms, such as social media, text messages, or online forums, to harass, intimidate, or target individuals. With these infographics, you can effectively communicate the seriousness of cyberbullying and its detrimental effects on individuals. Whether you're delivering a presentation, creating educational materials, or sharing information online, this template provides a visually impactful way to raise awareness and promote conversations about cyberbullying prevention and support for victims. They incorporate eye-catching visuals, icons, and color schemes to effectively convey information and engage your audience.


21 slides
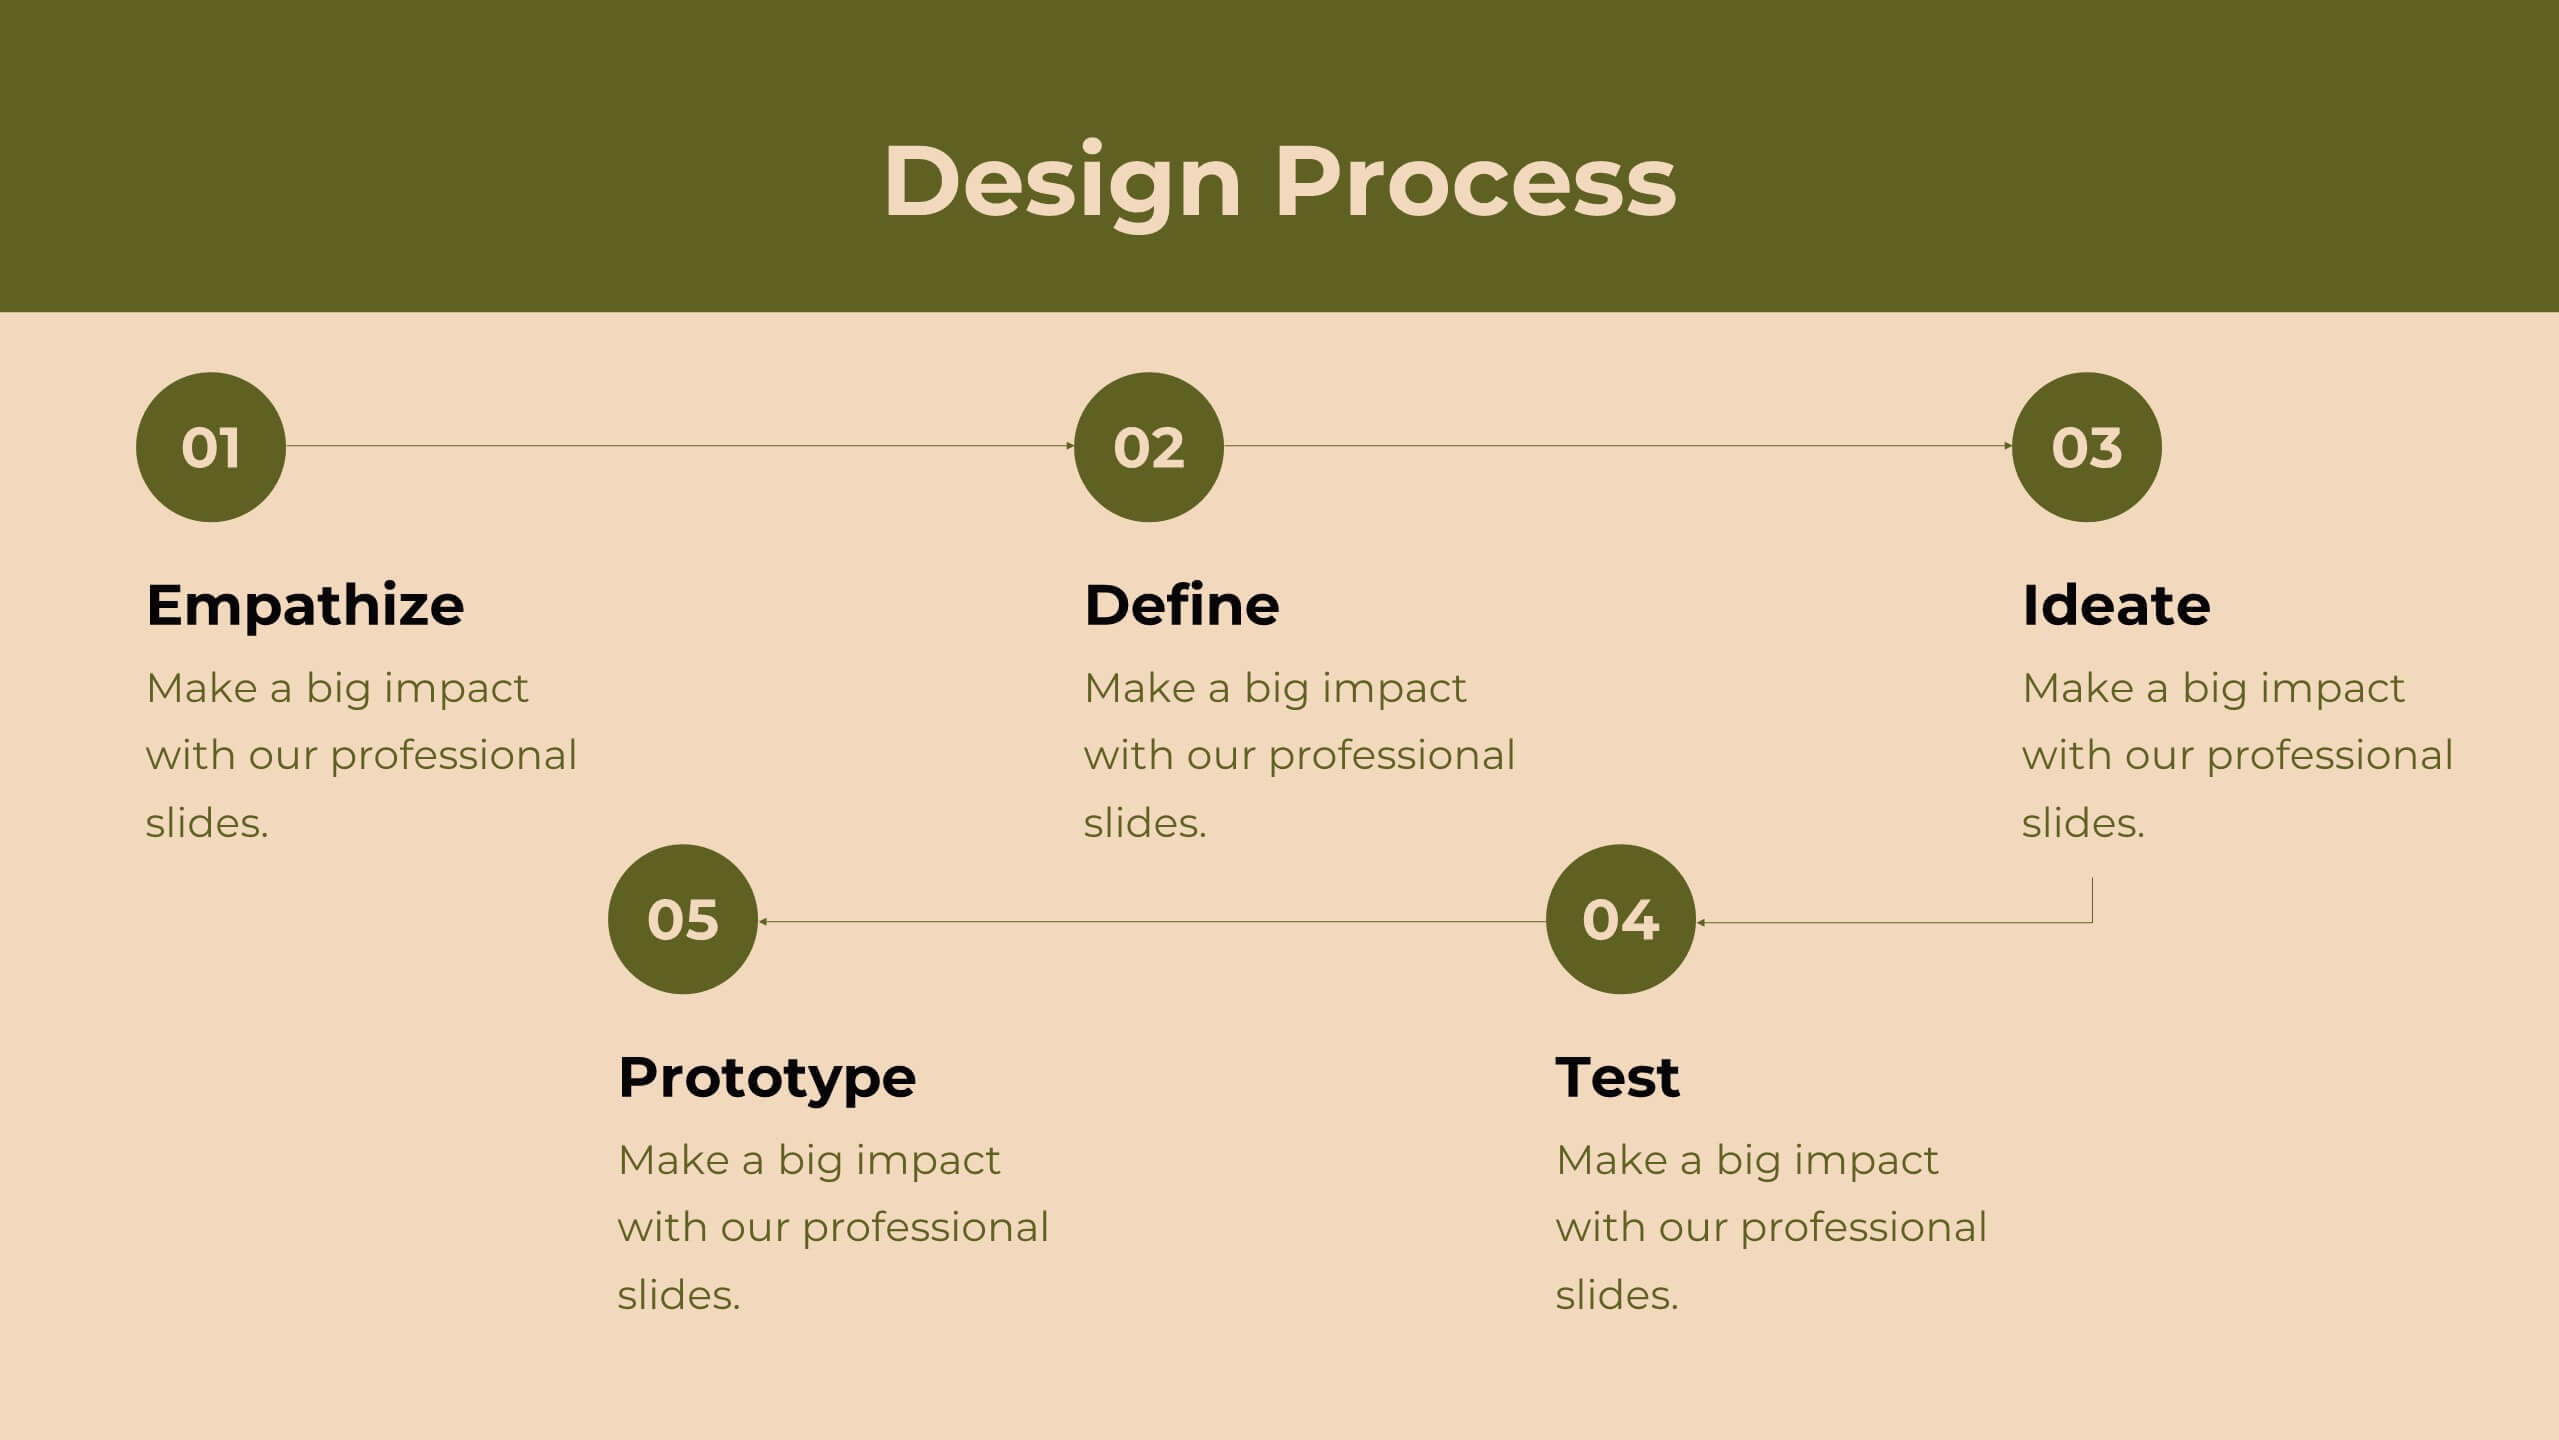
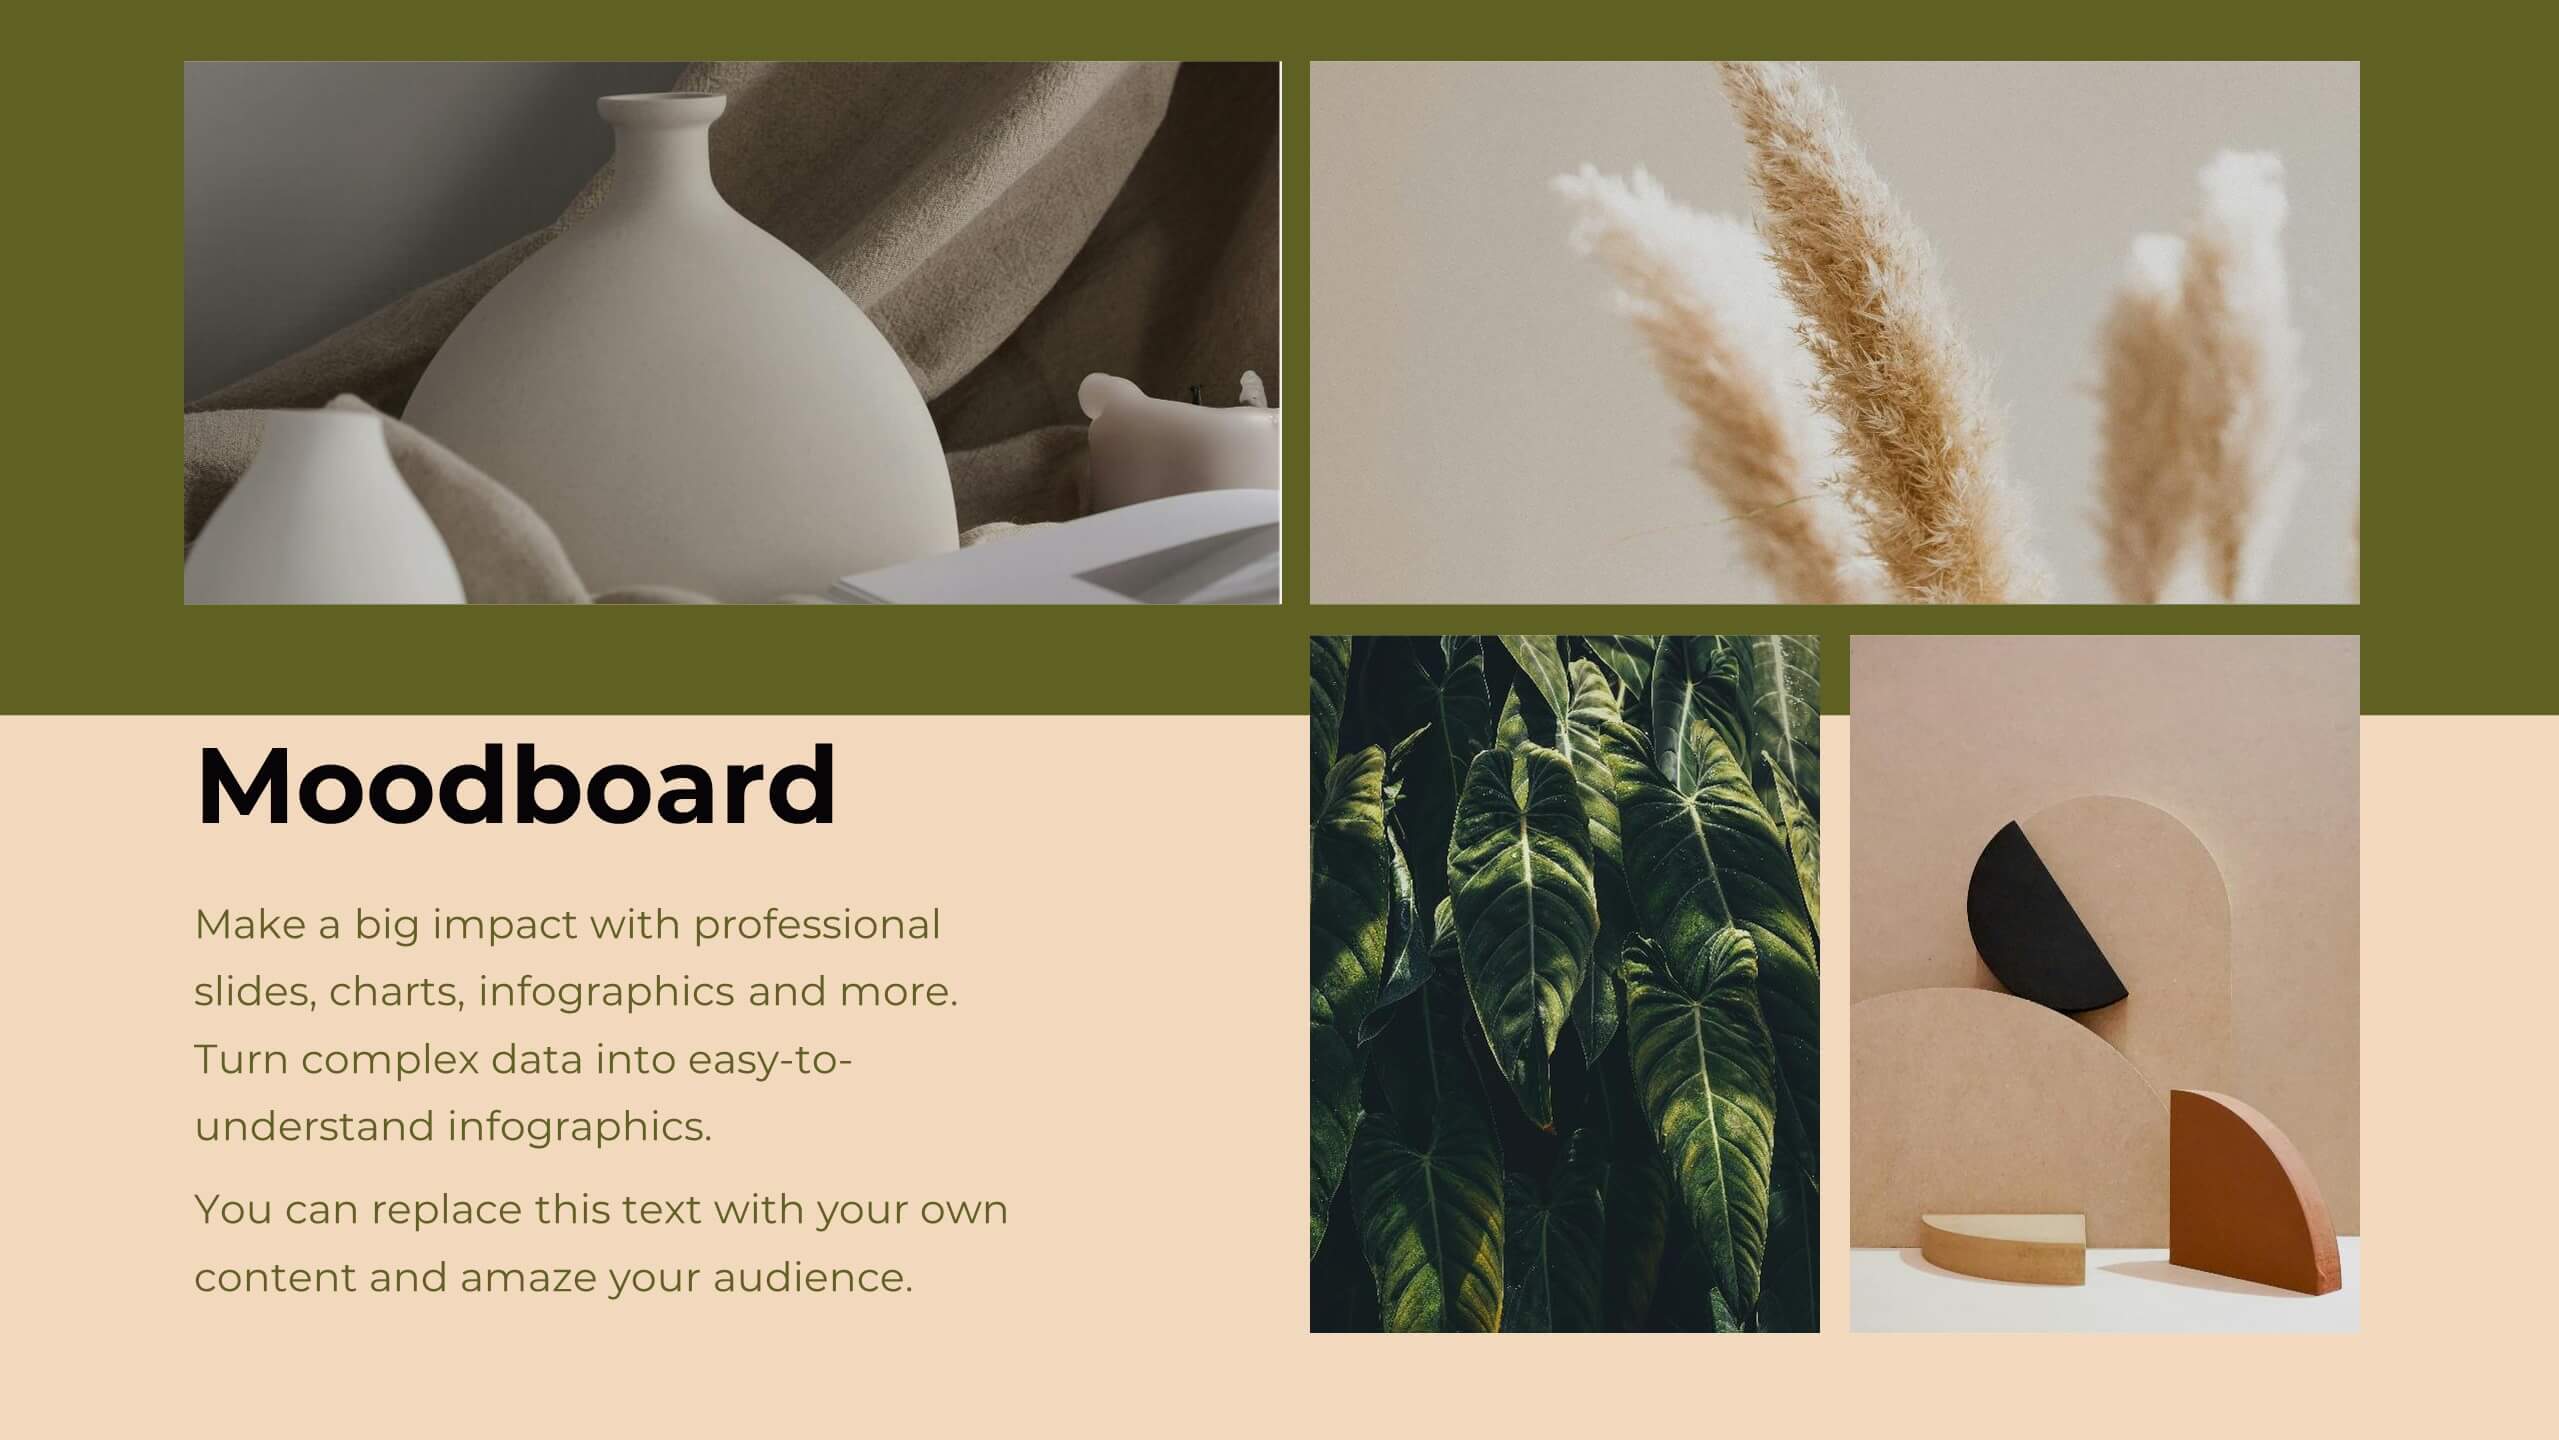
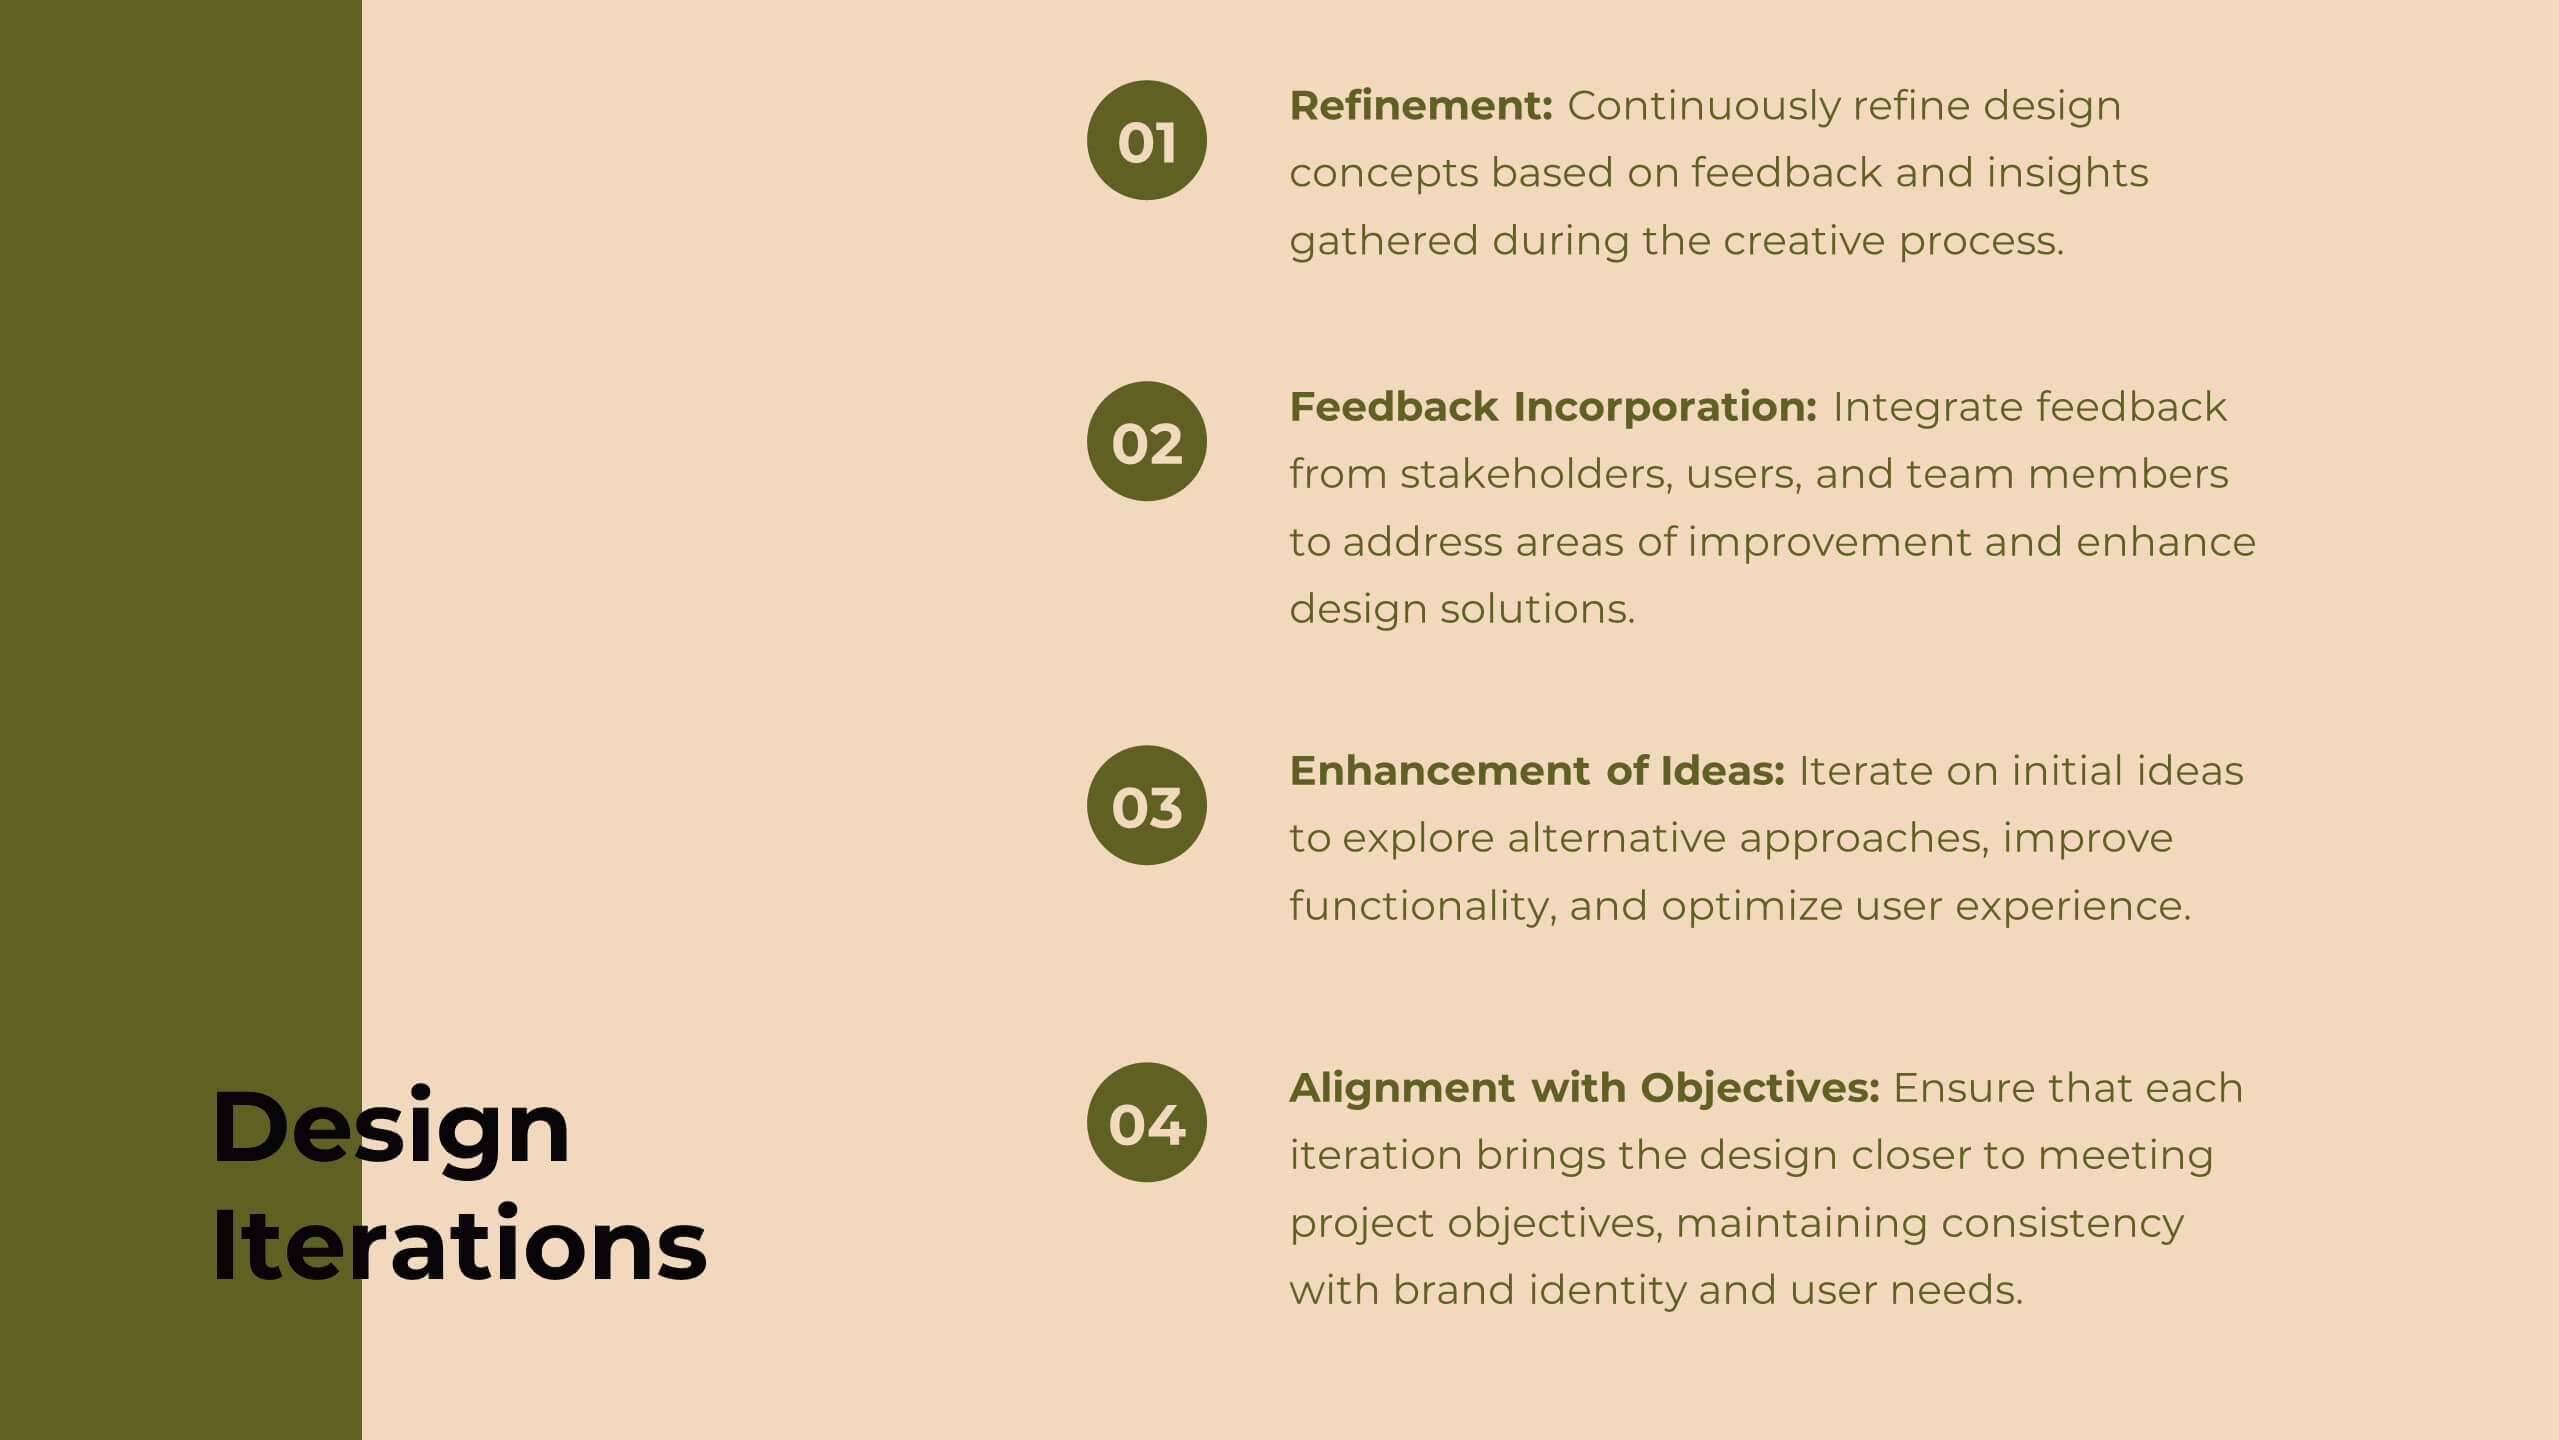
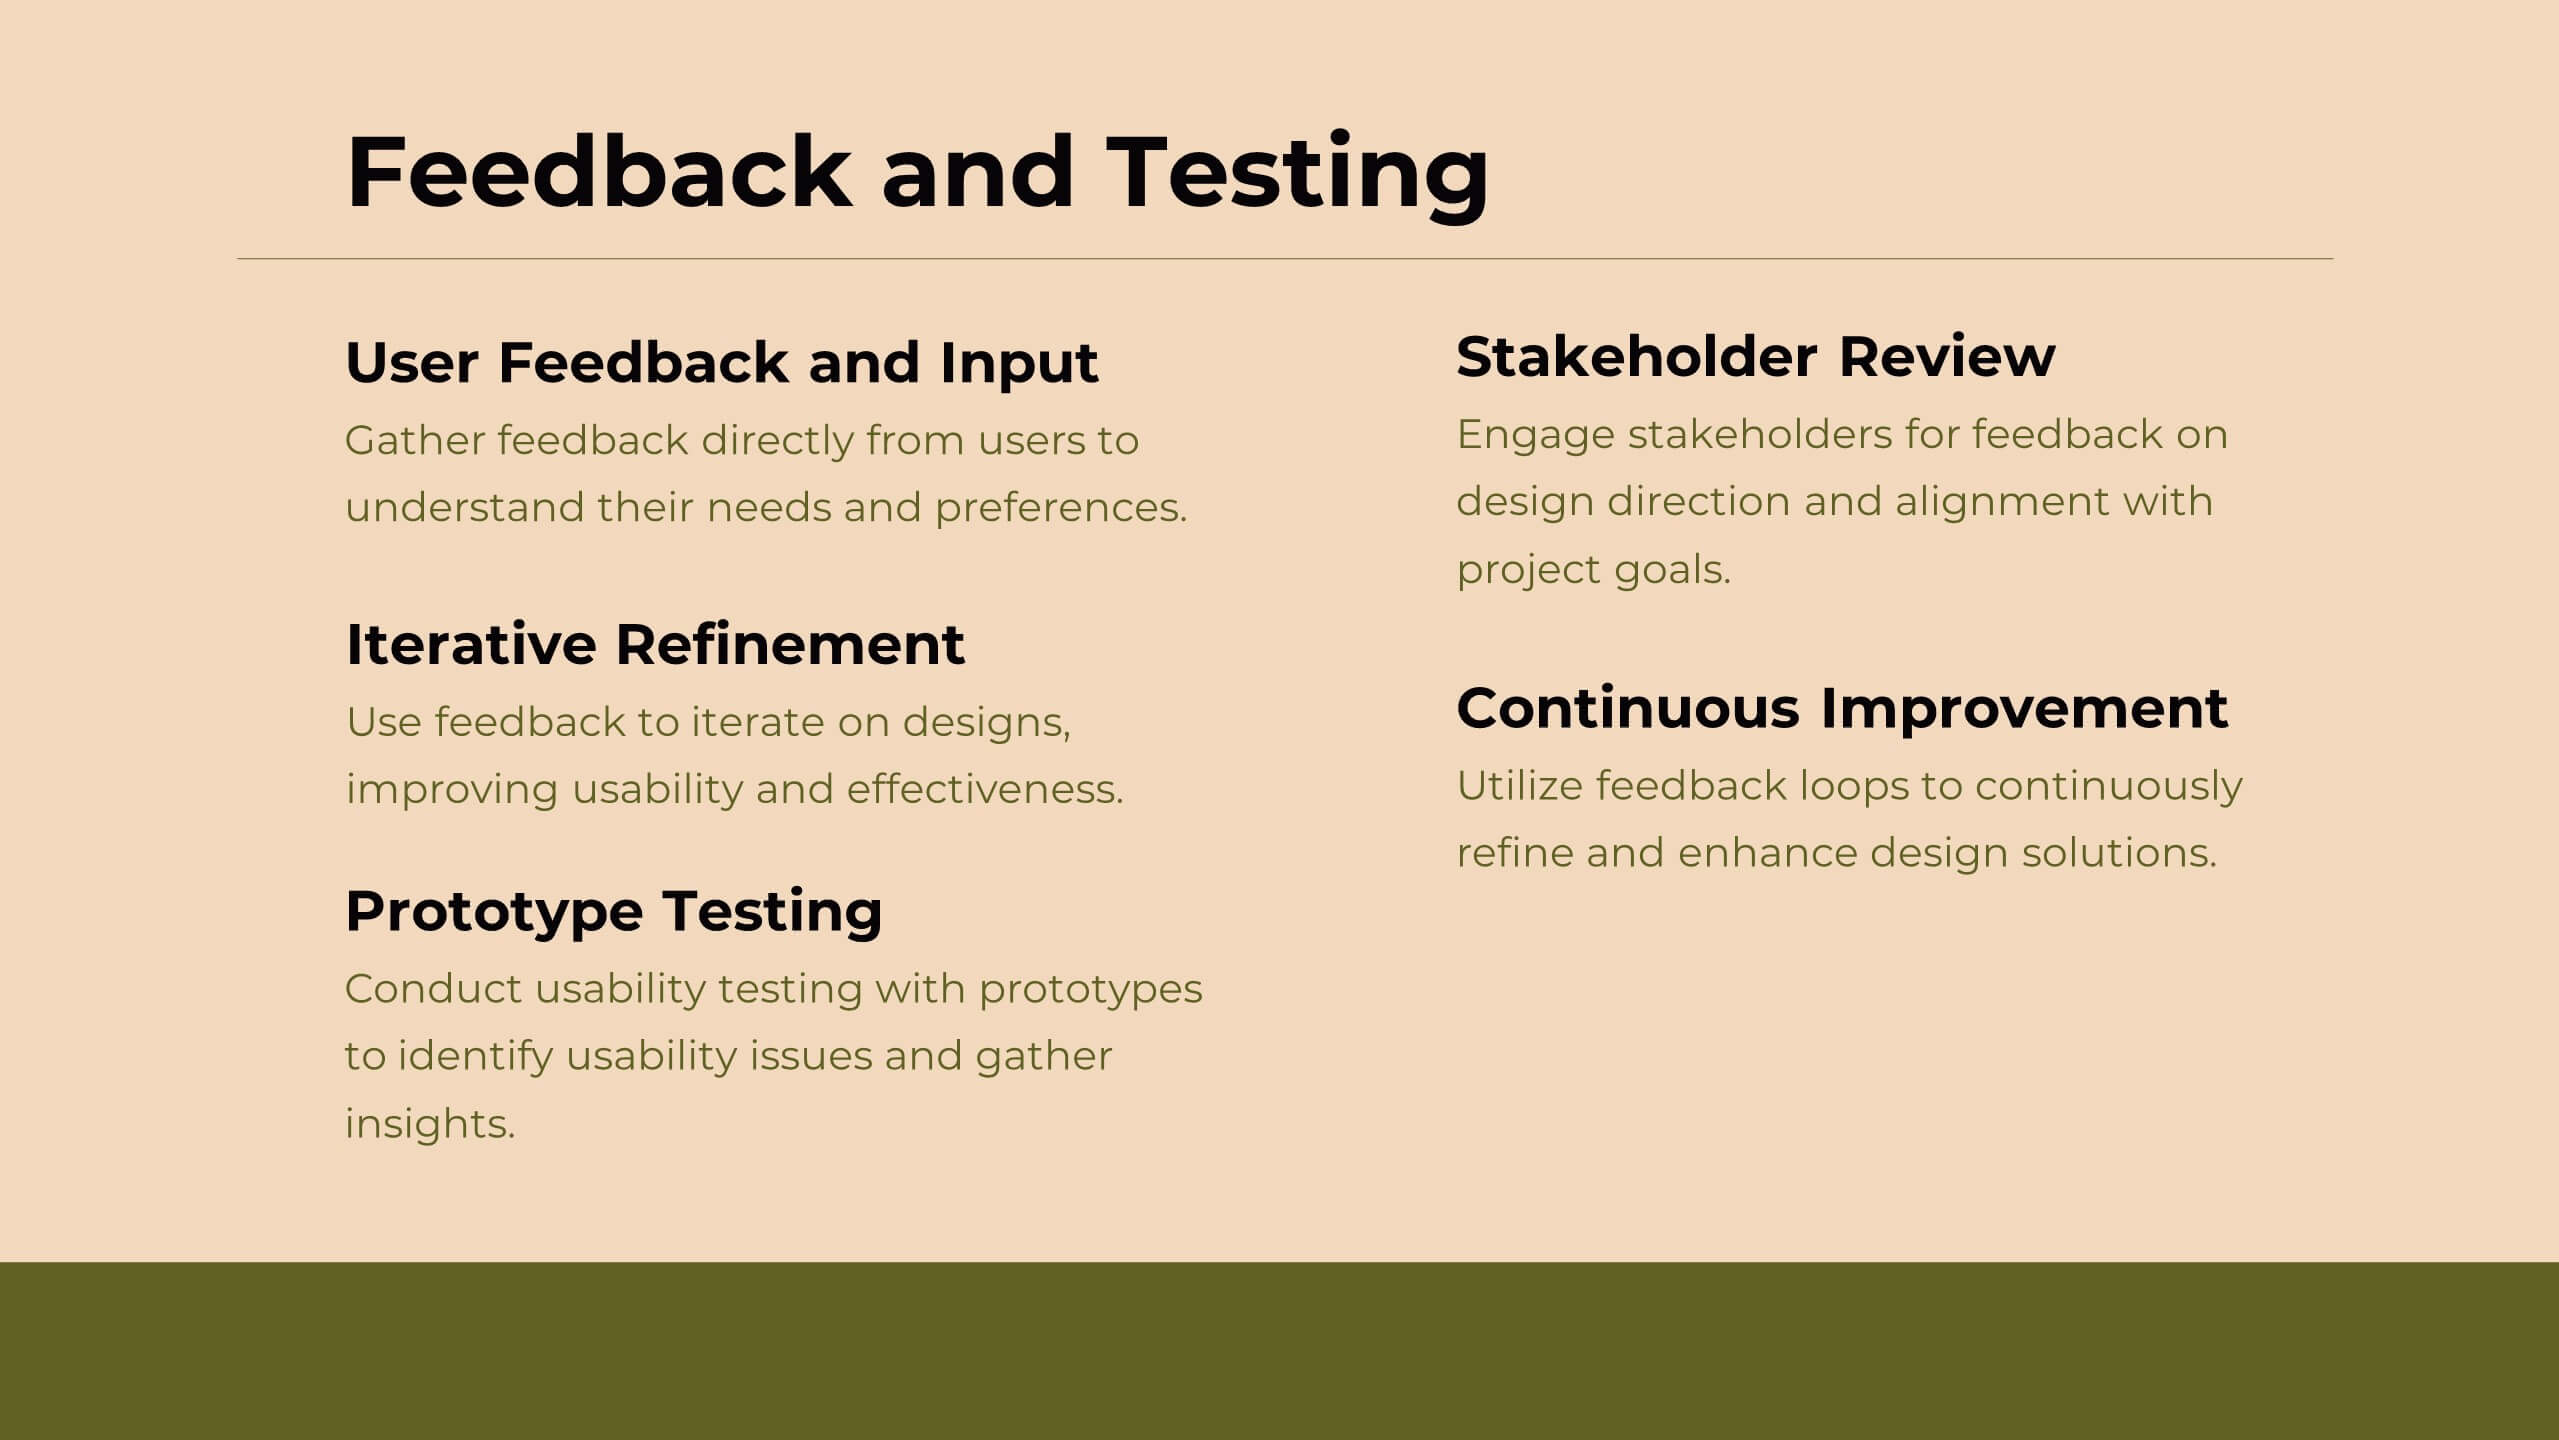
Delta Design Strategy Proposal Presentation
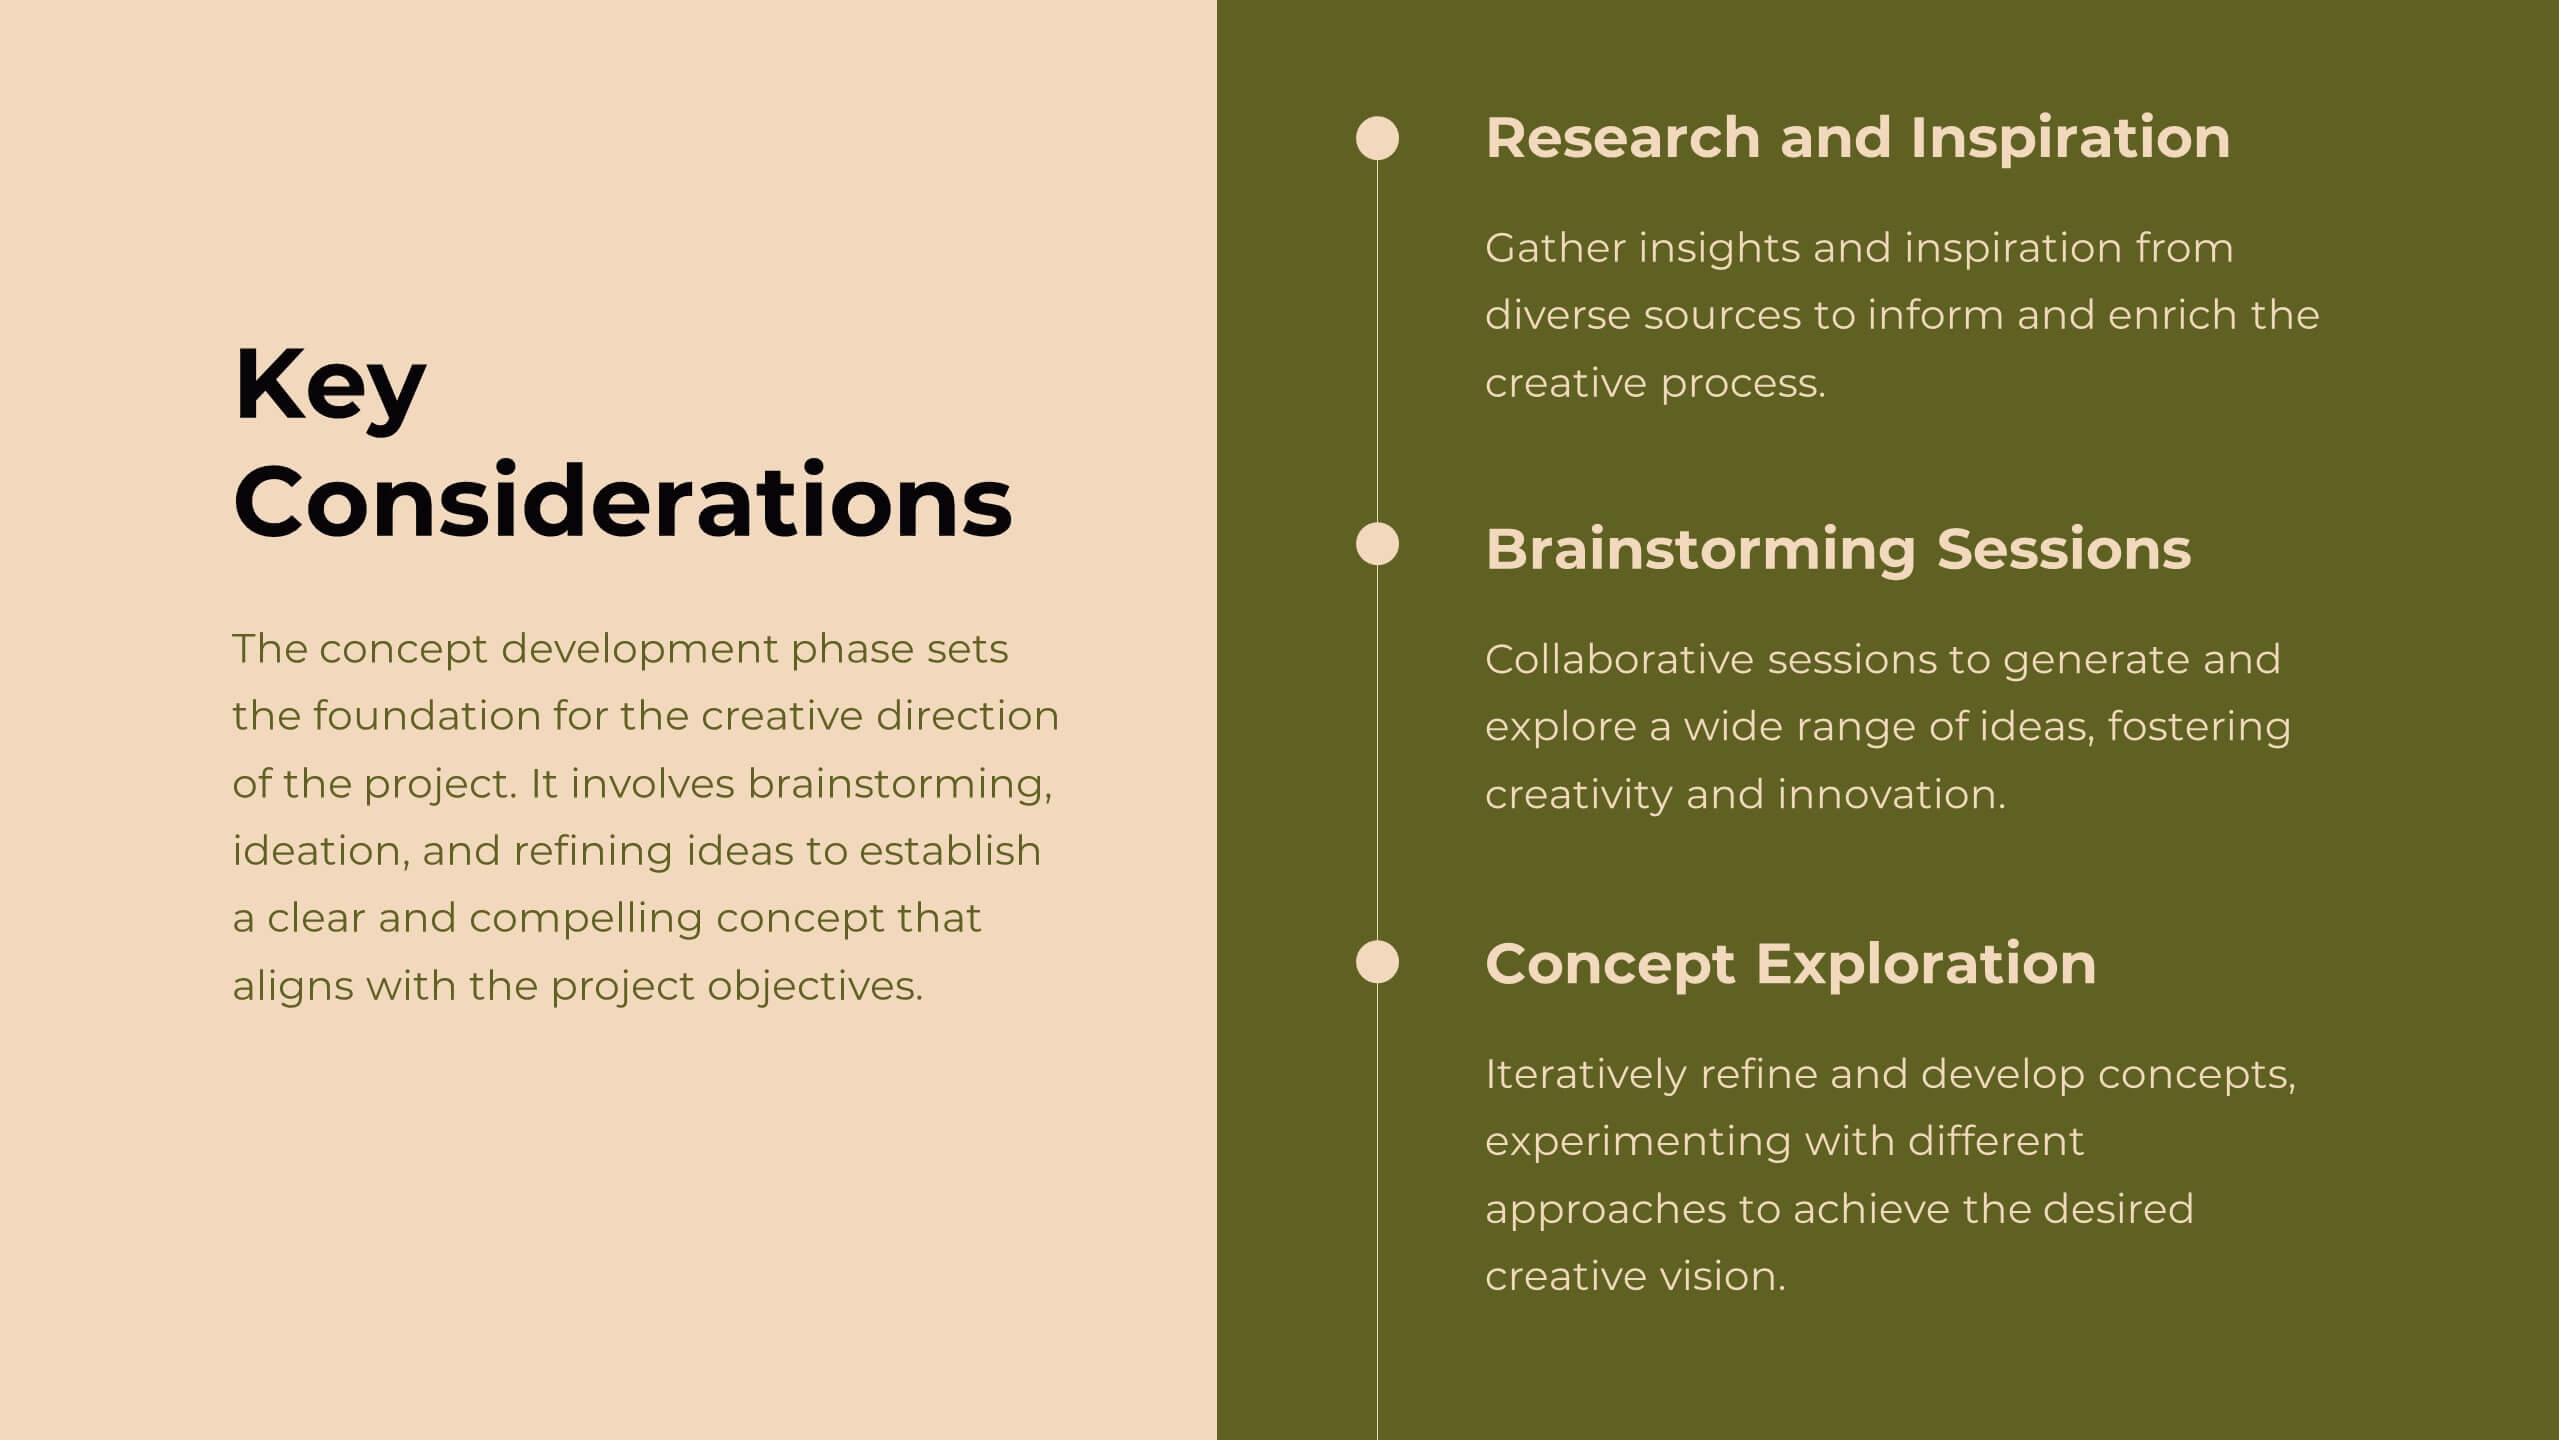
Transform your design strategy with this elegant proposal template! Perfect for presenting design briefs, target audience insights, and concept development. Ideal for designers and creative teams aiming to align vision and execution. Compatible with PowerPoint, Keynote, and Google Slides, this template ensures your design strategy is clear, professional, and compelling. Elevate your projects today!


4 slides
Corporate Hierarchy Levels Diagram Presentation
Visualize organizational structures clearly with this Corporate Hierarchy Levels Diagram Presentation. Designed for showcasing leadership flow, team divisions, or reporting relationships, each slide features a simple tiered layout with editable icons and placeholders. Great for business planning, team introductions, or org chart overviews. Fully customizable in PowerPoint, Keynote, Canva, and Google Slides.


4 slides
Investor-Ready Pitch for New Ventures Presentation
Make a lasting impression with the Investor-Ready Pitch for New Ventures Presentation. Designed to balance visuals with key stats, this template helps startups clearly communicate value to potential investors. Highlight milestones, team credibility, and market opportunity using bold typography and high-impact imagery. Fully editable in PowerPoint, Keynote, Google Slides, and Canva.


21 slides
Literati Research Proposal Presentation
Present your research proposal with confidence using this professionally crafted template, designed to streamline complex ideas into a cohesive, engaging narrative. With a modern design and dynamic visuals, it ensures your research objectives and findings are communicated effectively. The template includes sections for your introduction, background, methodology, data collection, analysis, and key findings, giving your proposal a logical structure. Use the literature review and data visualization slides to back up your arguments with credible sources and compelling graphics. Dedicated slides for conclusions, recommendations, and implications allow you to outline the impact of your research clearly. Fully editable in PowerPoint, Google Slides, and Keynote, this template adapts effortlessly to your needs. Perfect for academic, corporate, or professional research presentations, it combines sleek design with functionality to ensure your proposal resonates with your audience. Take your research to the next level with a template that reflects your dedication to excellence.