


Features
- 6 Unique slides
- Fully editable and easy to edit in Microsoft Powerpoint, Keynote and Google Slides
- 16:9 widescreen layout
- Clean and professional designs
- Export to JPG, PDF or send by email


Do you have any questions?
Recommend


5 slides
Healthcare and Wellness Infographics
Healthcare and wellness are interrelated concepts that focus on promoting and maintaining the physical, mental, and emotional well-being of individuals and communities. These vertical infographics are designed to showcase essential healthcare and wellness information. This infographic provides a comprehensive overview of various topics related to healthcare, promoting a better understanding of key concepts and practices that contribute to overall well-being. These infographics offers a series of health tips and guidelines covering different aspects of wellness, such as nutrition, physical activity, mental health, and stress management.


7 slides
SCRUM Roles Infographic
Dive into the agile world with our SCRUM roles infographic. This template is designed to depict the various roles within the SCRUM framework, offering clarity and insight into the collaborative heart of agile methodologies. With a clean white canvas set against hues of blue, it provides a modern yet comprehensive overview of the roles. Ideal for agile coaches, trainers, and organizations transitioning to agile methodologies, this infographic is tailored to showcase the importance of each role. With its compatibility, spanning PowerPoint, Keynote, and Google Slides, presentations are bound to be a breeze, regardless of the platform you favor.


8 slides
3-Layered Circular Logic Presentation
Visualize layered processes with this 3-step circular logic diagram. Perfect for illustrating progressive systems, tiered strategies, or interrelated components. Each ring represents a distinct phase, complete with editable icons and text. Compatible with PowerPoint, Keynote, and Google Slides—ideal for business models, strategic frameworks, or simplified logic breakdowns.


5 slides
Economic Analysis of Europe Map Presentation
Visualize key economic indicators across European regions with this impactful map-based presentation. Use shaded country highlights and accompanying bar charts to present comparative data, performance trends, and regional growth. Ideal for economic reports, investor updates, or strategic planning. Fully editable and works seamlessly with PowerPoint, Keynote, and Google Slides.


23 slides
Orbit Corporate Strategy Report Presentation
Elevate your strategic planning and reporting with a sleek and dynamic template that exudes professionalism and clarity! This Strategy Report template is designed to empower your organization’s vision, highlighting the core elements that drive success. From a powerful agenda slide that sets the tone to a detailed team update, this template ensures every aspect of your business is showcased with precision. The design is streamlined yet impactful, perfect for conveying key achievements, current projects, and future goals. Performance metrics, departmental goals, and training & development sections are laid out to emphasize your organization’s strengths and areas of focus. The template also includes slides dedicated to employee recognition, process improvement, and cross-functional collaboration, ensuring all facets of your business are covered. With a clean, modern aesthetic, this template is perfect for executives and team leaders alike, and is compatible with PowerPoint, Keynote, and Google Slides. Get ready to make your strategy presentations unforgettable!


4 slides
Workplace Collaboration and Team Scenes Presentation
Bring your teamwork story to life with this vibrant, arrow-based layout that guides the viewer through four clear steps. Perfect for visualizing collaboration strategies, team roles, or task flow, this template balances clean design with helpful icons. Easily customize it in PowerPoint, Keynote, or Google Slides for a polished presentation.


6 slides
Business Investment Market in Africa Map Presentation
Highlight key investment hotspots across Africa with this clean, location-based map template. Featuring labeled markers, progress bars, and editable data points, it’s ideal for showcasing project focus, regional funding, or development opportunities. Customize easily in PowerPoint, Keynote, or Google Slides to create compelling, data-driven business and finance presentations.


5 slides
Manufacturing in the US Infographics
Delve into the industrial heartbeat of America with the manufacturing in the US infographics. Rendered in patriotic hues of red, blue, and white, this vertical, creative, and informative template is a powerhouse of insight, perfect for industry analysts, educational purposes, or corporate presentations aiming to explore the intricacies of U.S. manufacturing. The infographic doesn’t just present data; it tells the story of American industry, with engaging graphics, intuitive icons, and dedicated spaces for real imagery that bring facts to life. This tool is invaluable for anyone needing to communicate the vast scope of U.S. manufacturing prowess effectively and compellingly.


21 slides
Veridia Academic Research Report Presentation
Present your academic research findings with confidence using this sleek and modern presentation template. Covering essential sections such as research objectives, data analysis, key findings, and recommendations, it provides a structured approach to showcasing your study. Perfect for students and professionals. Compatible with PowerPoint, Keynote, and Google Slides for seamless customization.


5 slides
Team Communication and Info Sharing Presentation
Keep your team aligned and informed with this clear, visual communication flow template. Designed to illustrate how information moves between individuals or departments, it helps teams optimize collaboration and transparency. Great for onboarding, project handoffs, or workflow discussions. Fully compatible with PowerPoint, Keynote, and Google Slides.


5 slides
IT Technology Revolution Infographics
Navigate the digital wave with our IT technology revolution infographics. Crafted in a sleek blue and white palette, this template is a nod to the informational era's sophistication. It's an essential tool for IT professionals, educators, tech enthusiasts, or students stepping into the world of informational technology. Compatible with Powerpoint, Keynote, and Google Slides. With a design that speaks innovation, it features cutting-edge graphics, icons, and image placeholders, tailored to dissect complex tech jargons into digestible visuals. Engage your audience with data and trends that encapsulate the IT landscape's ever-evolving nature.


4 slides
Employee and Team Performance Analysis
Visualize individual and team contributions with this clear and structured performance analysis template. Showcase key metrics, employee growth, and team achievements using easy-to-read layouts and progress indicators. Ideal for HR reports, performance reviews, and team evaluations. Fully editable in PowerPoint, Keynote, and Google Slides.


21 slides
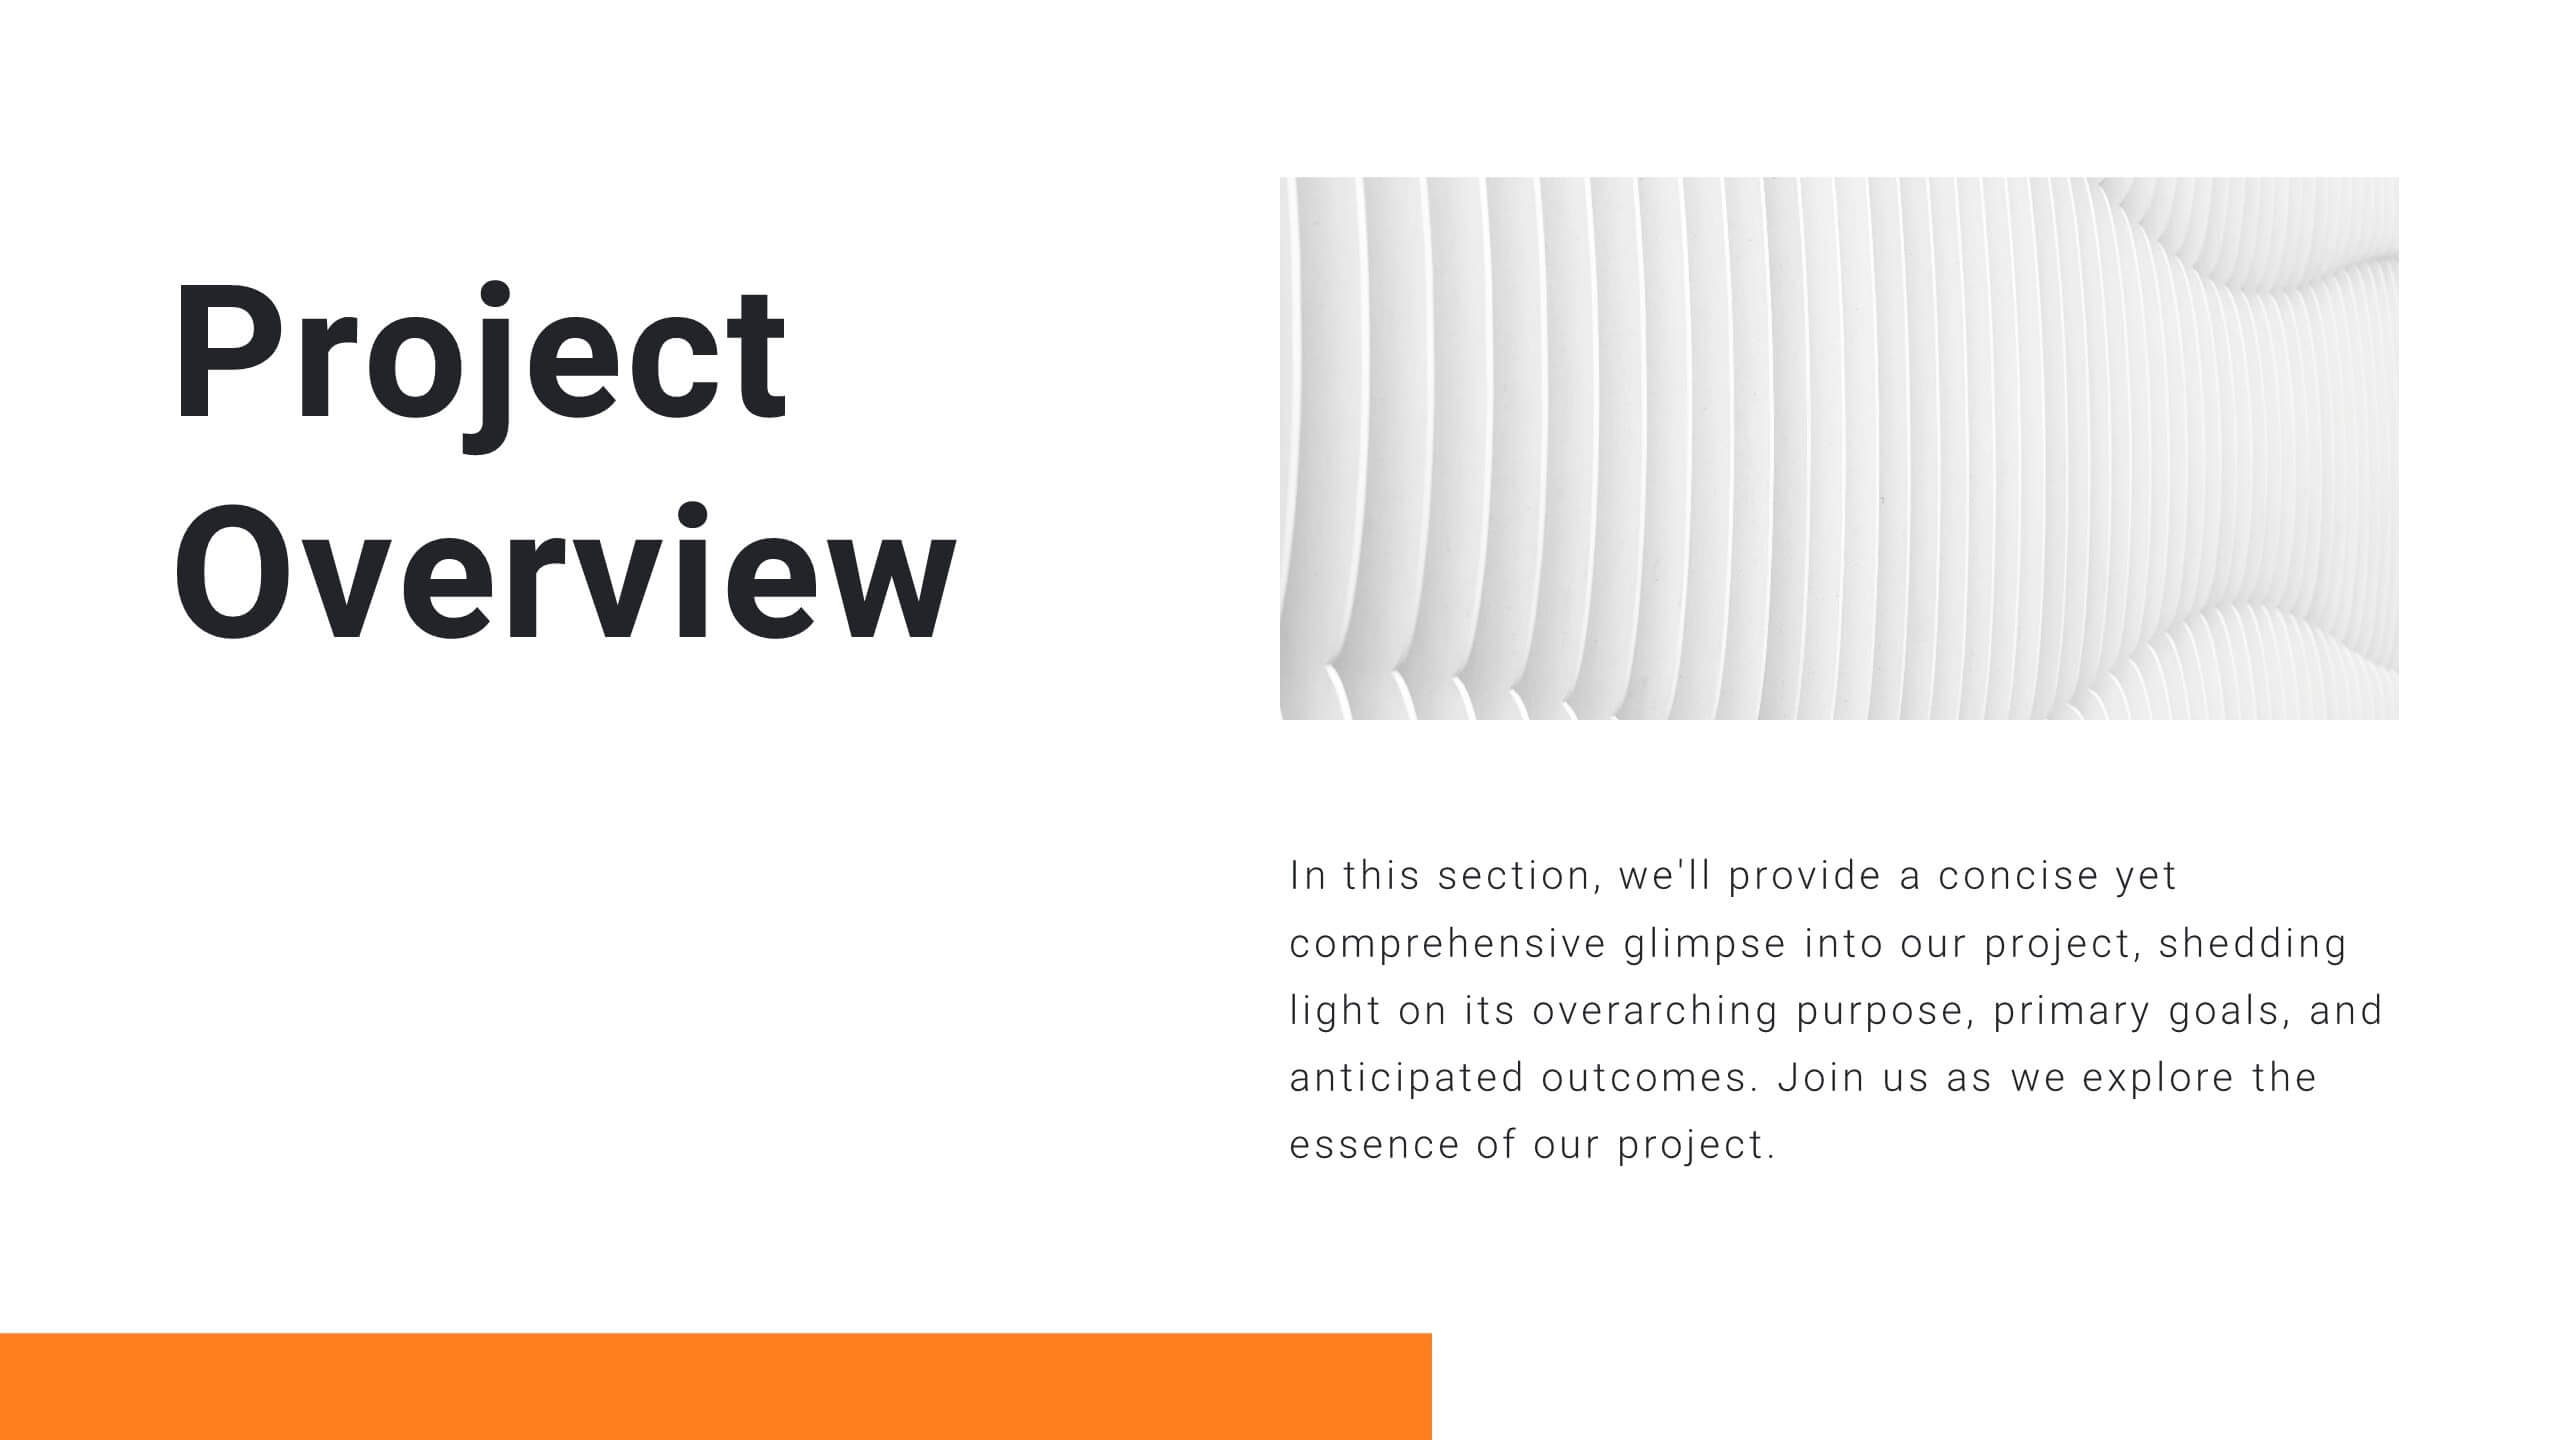
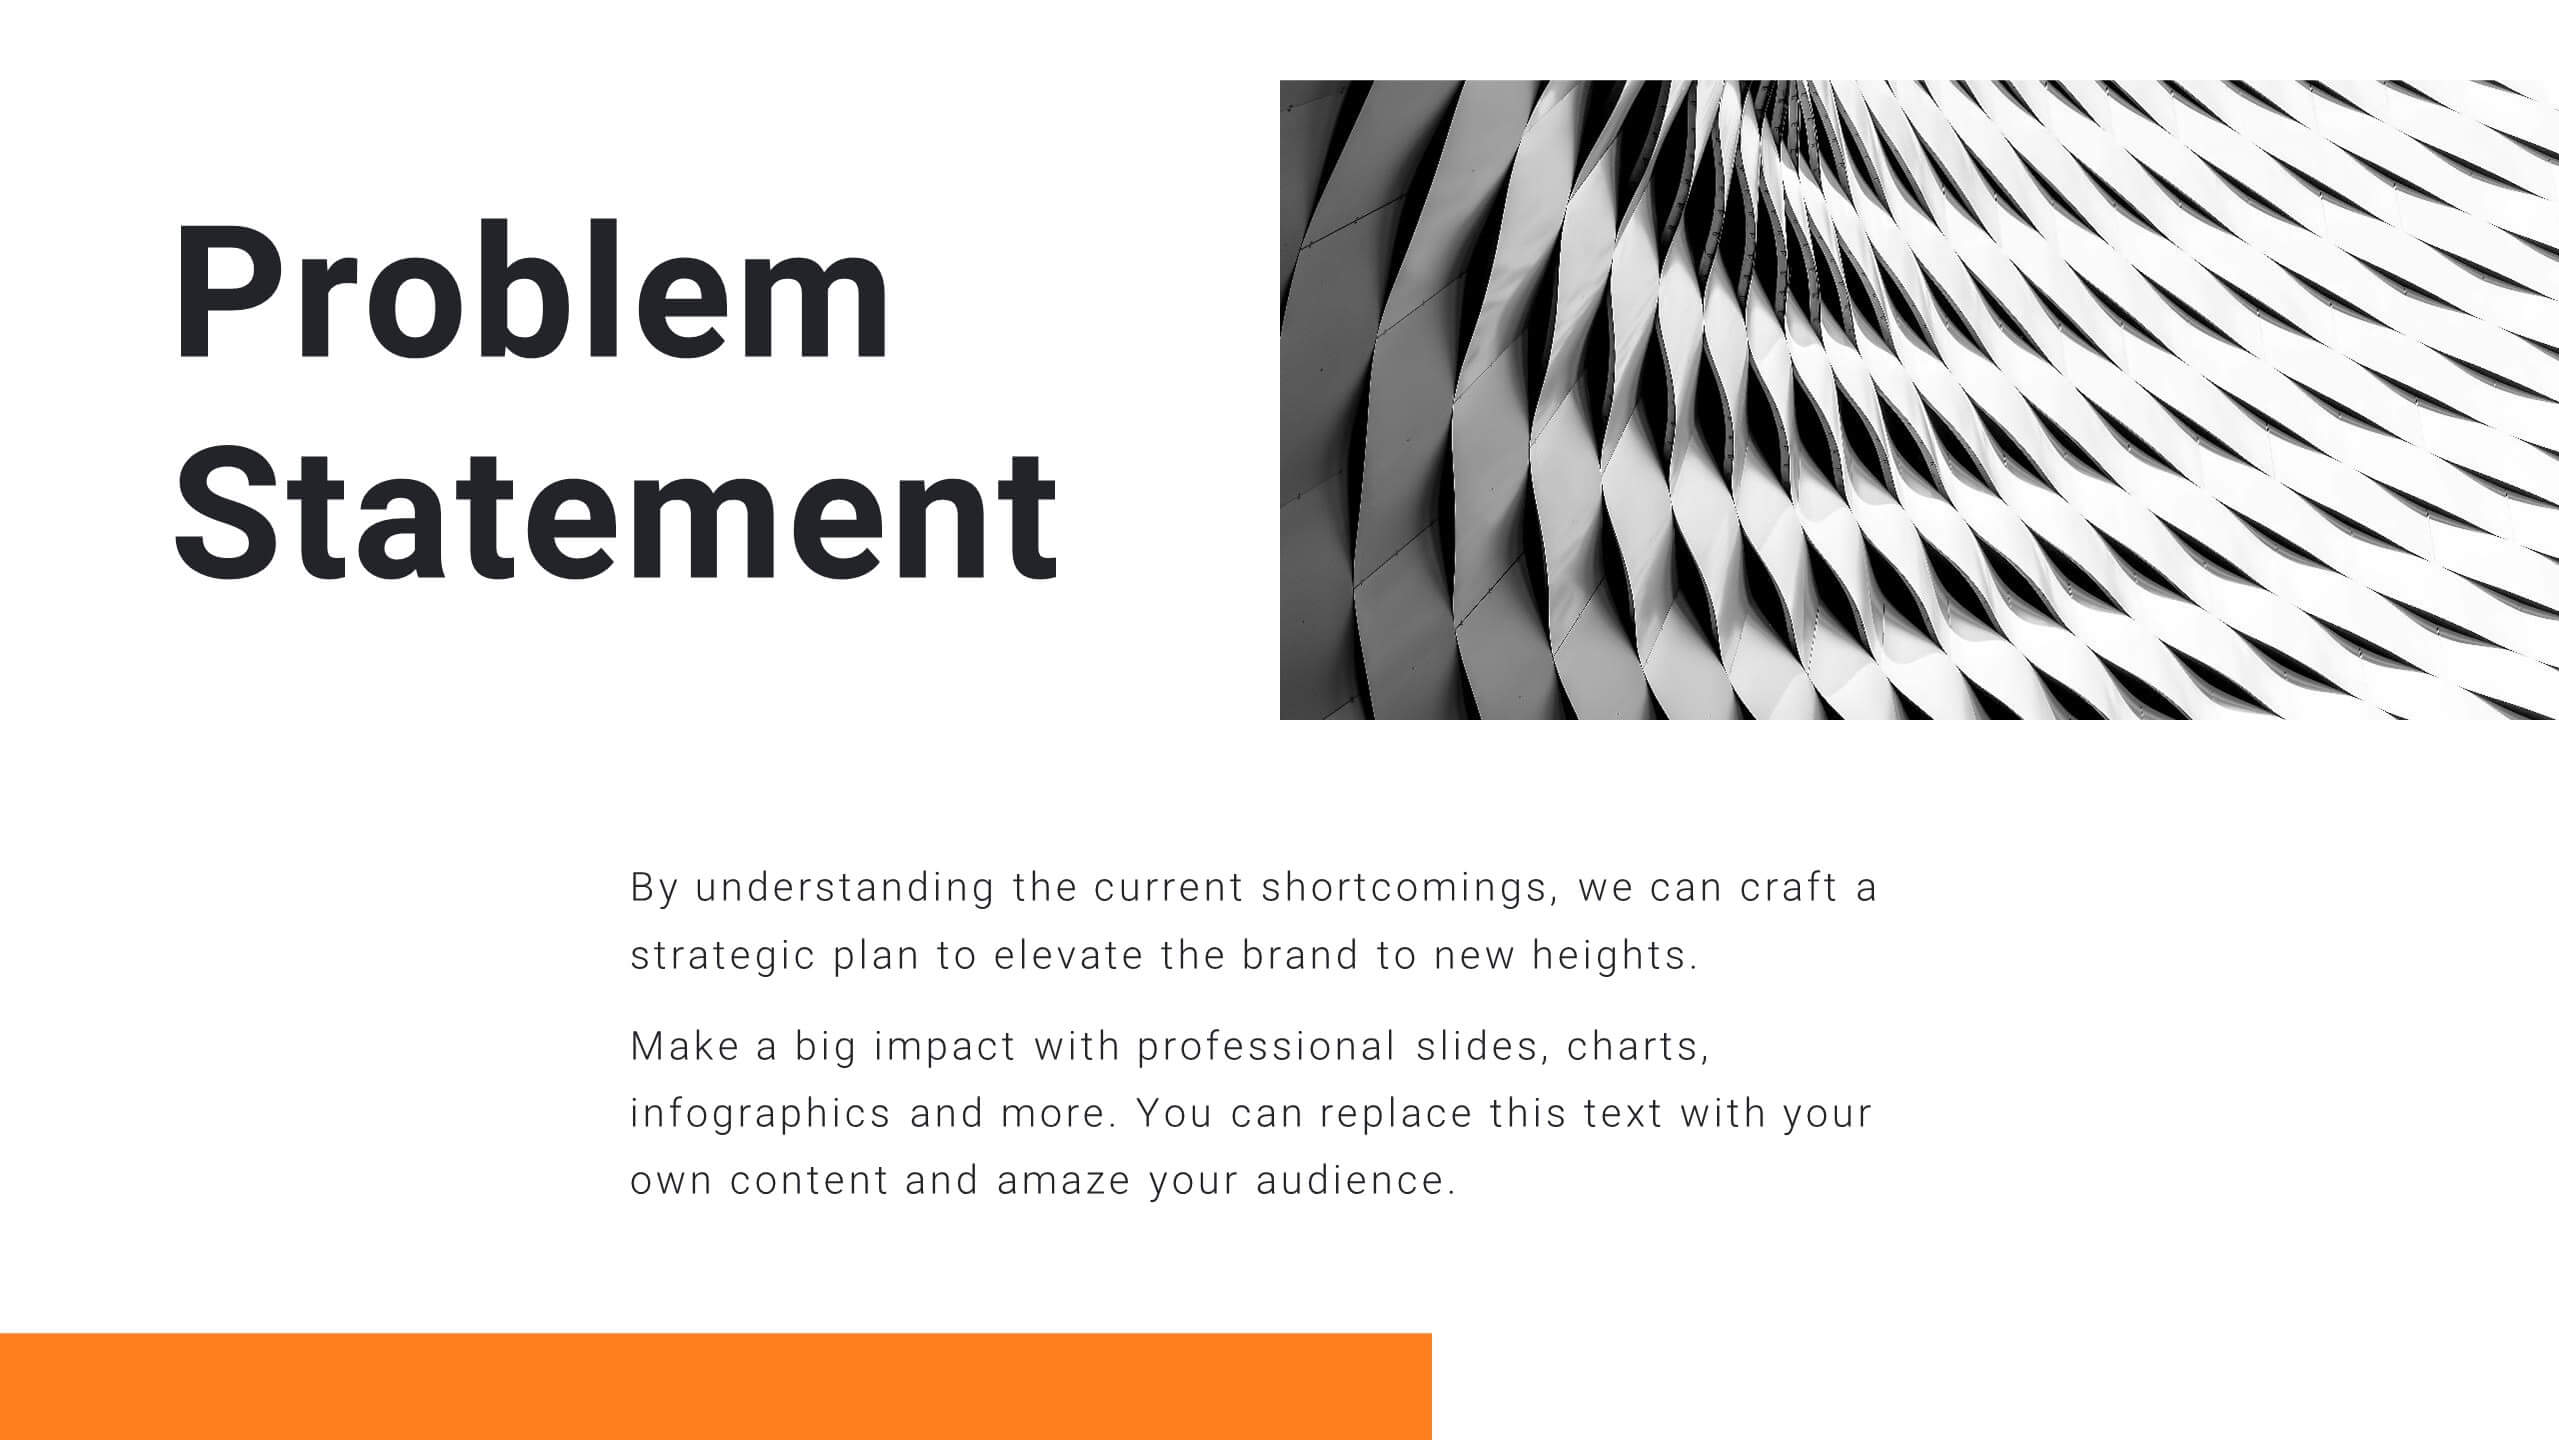
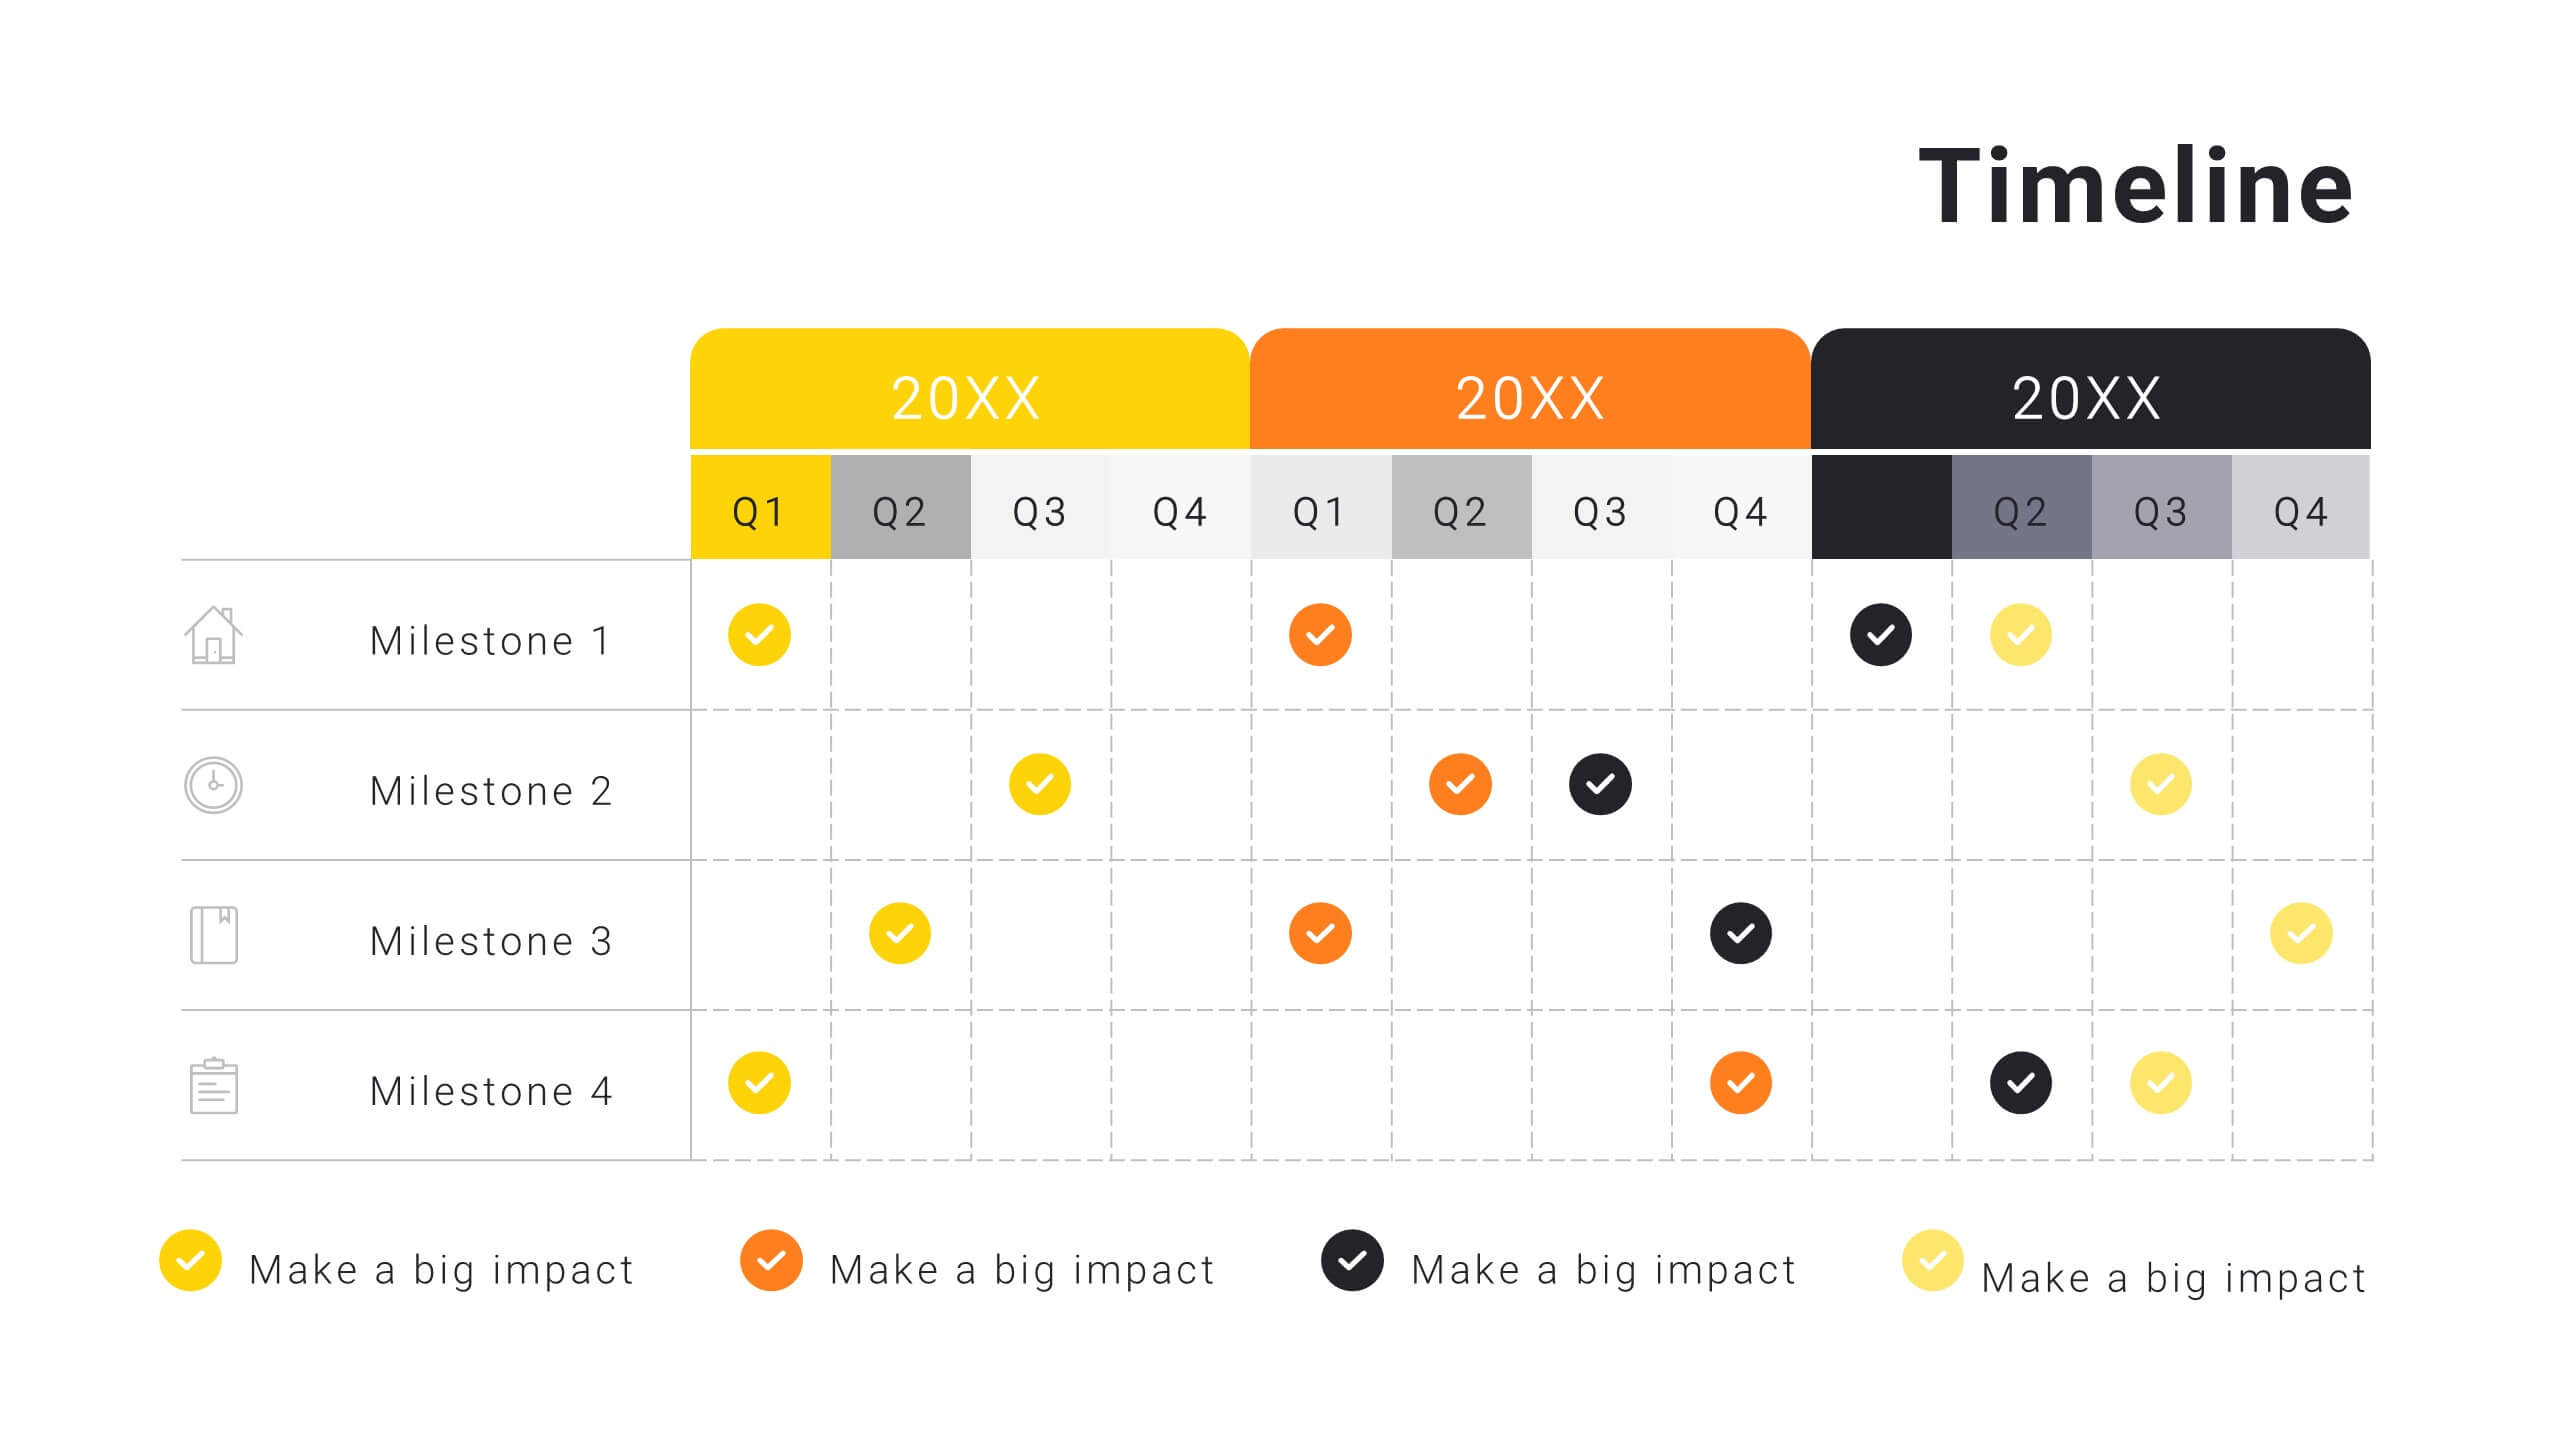
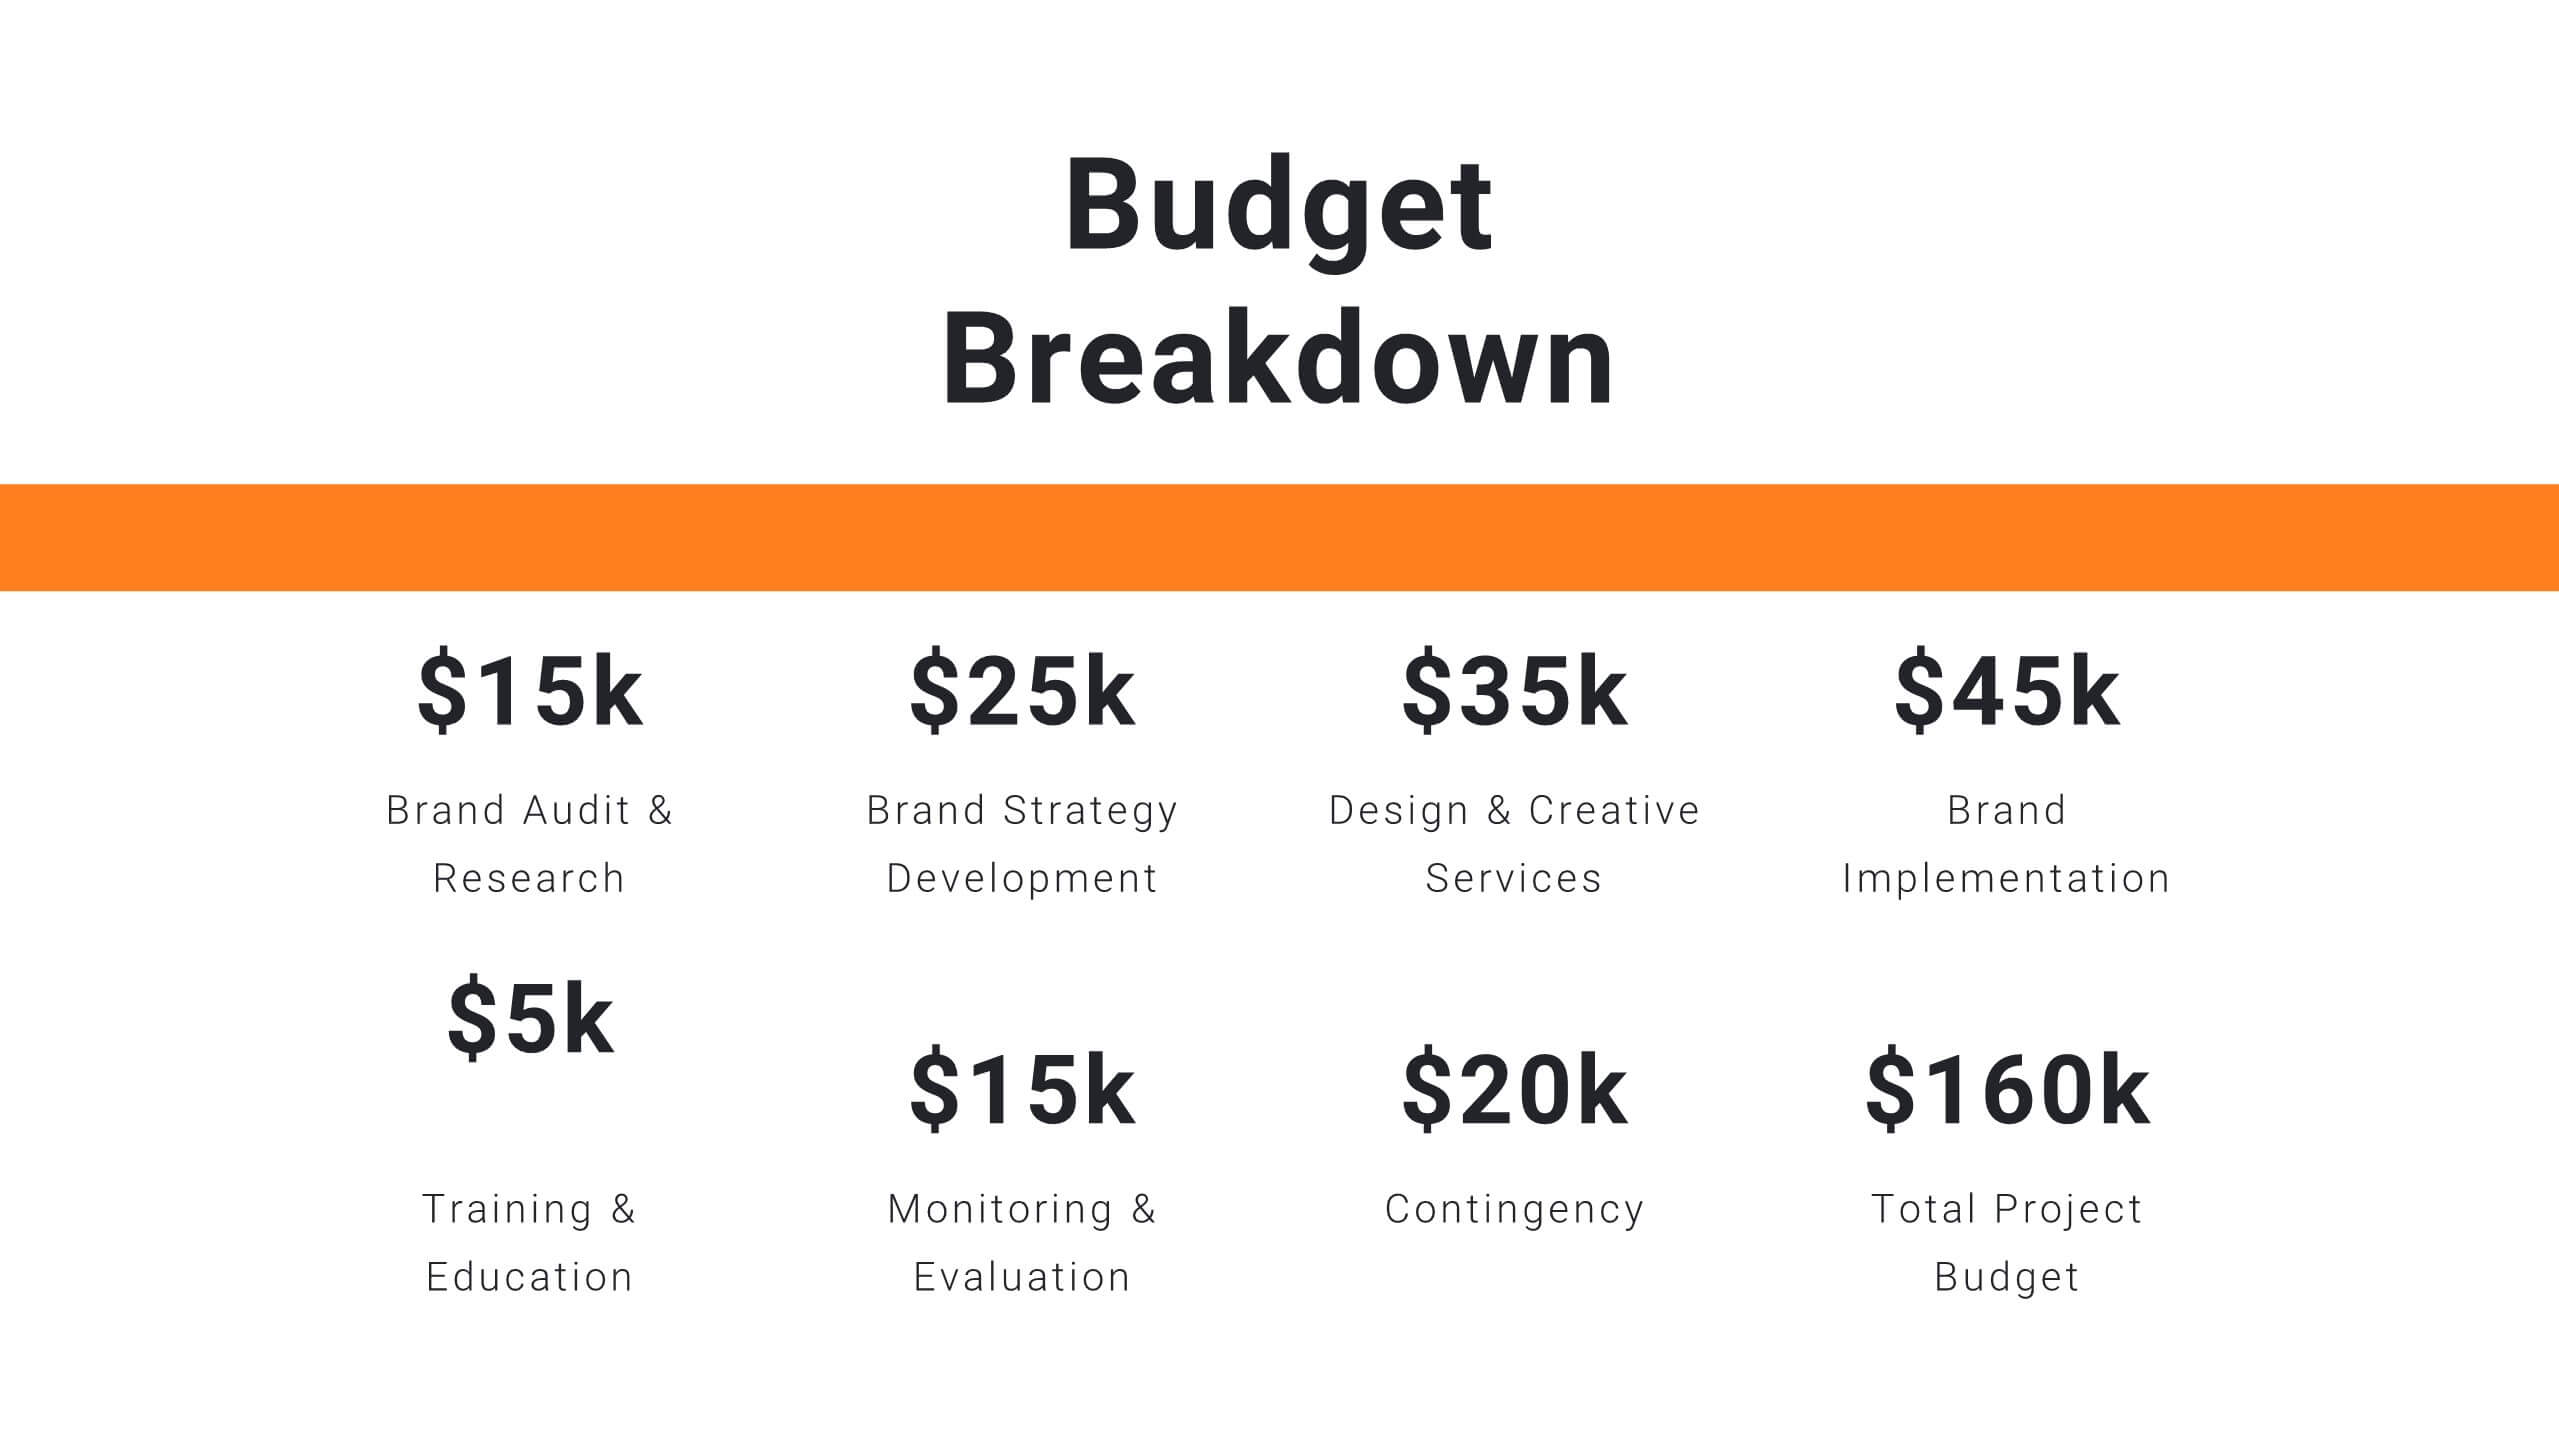
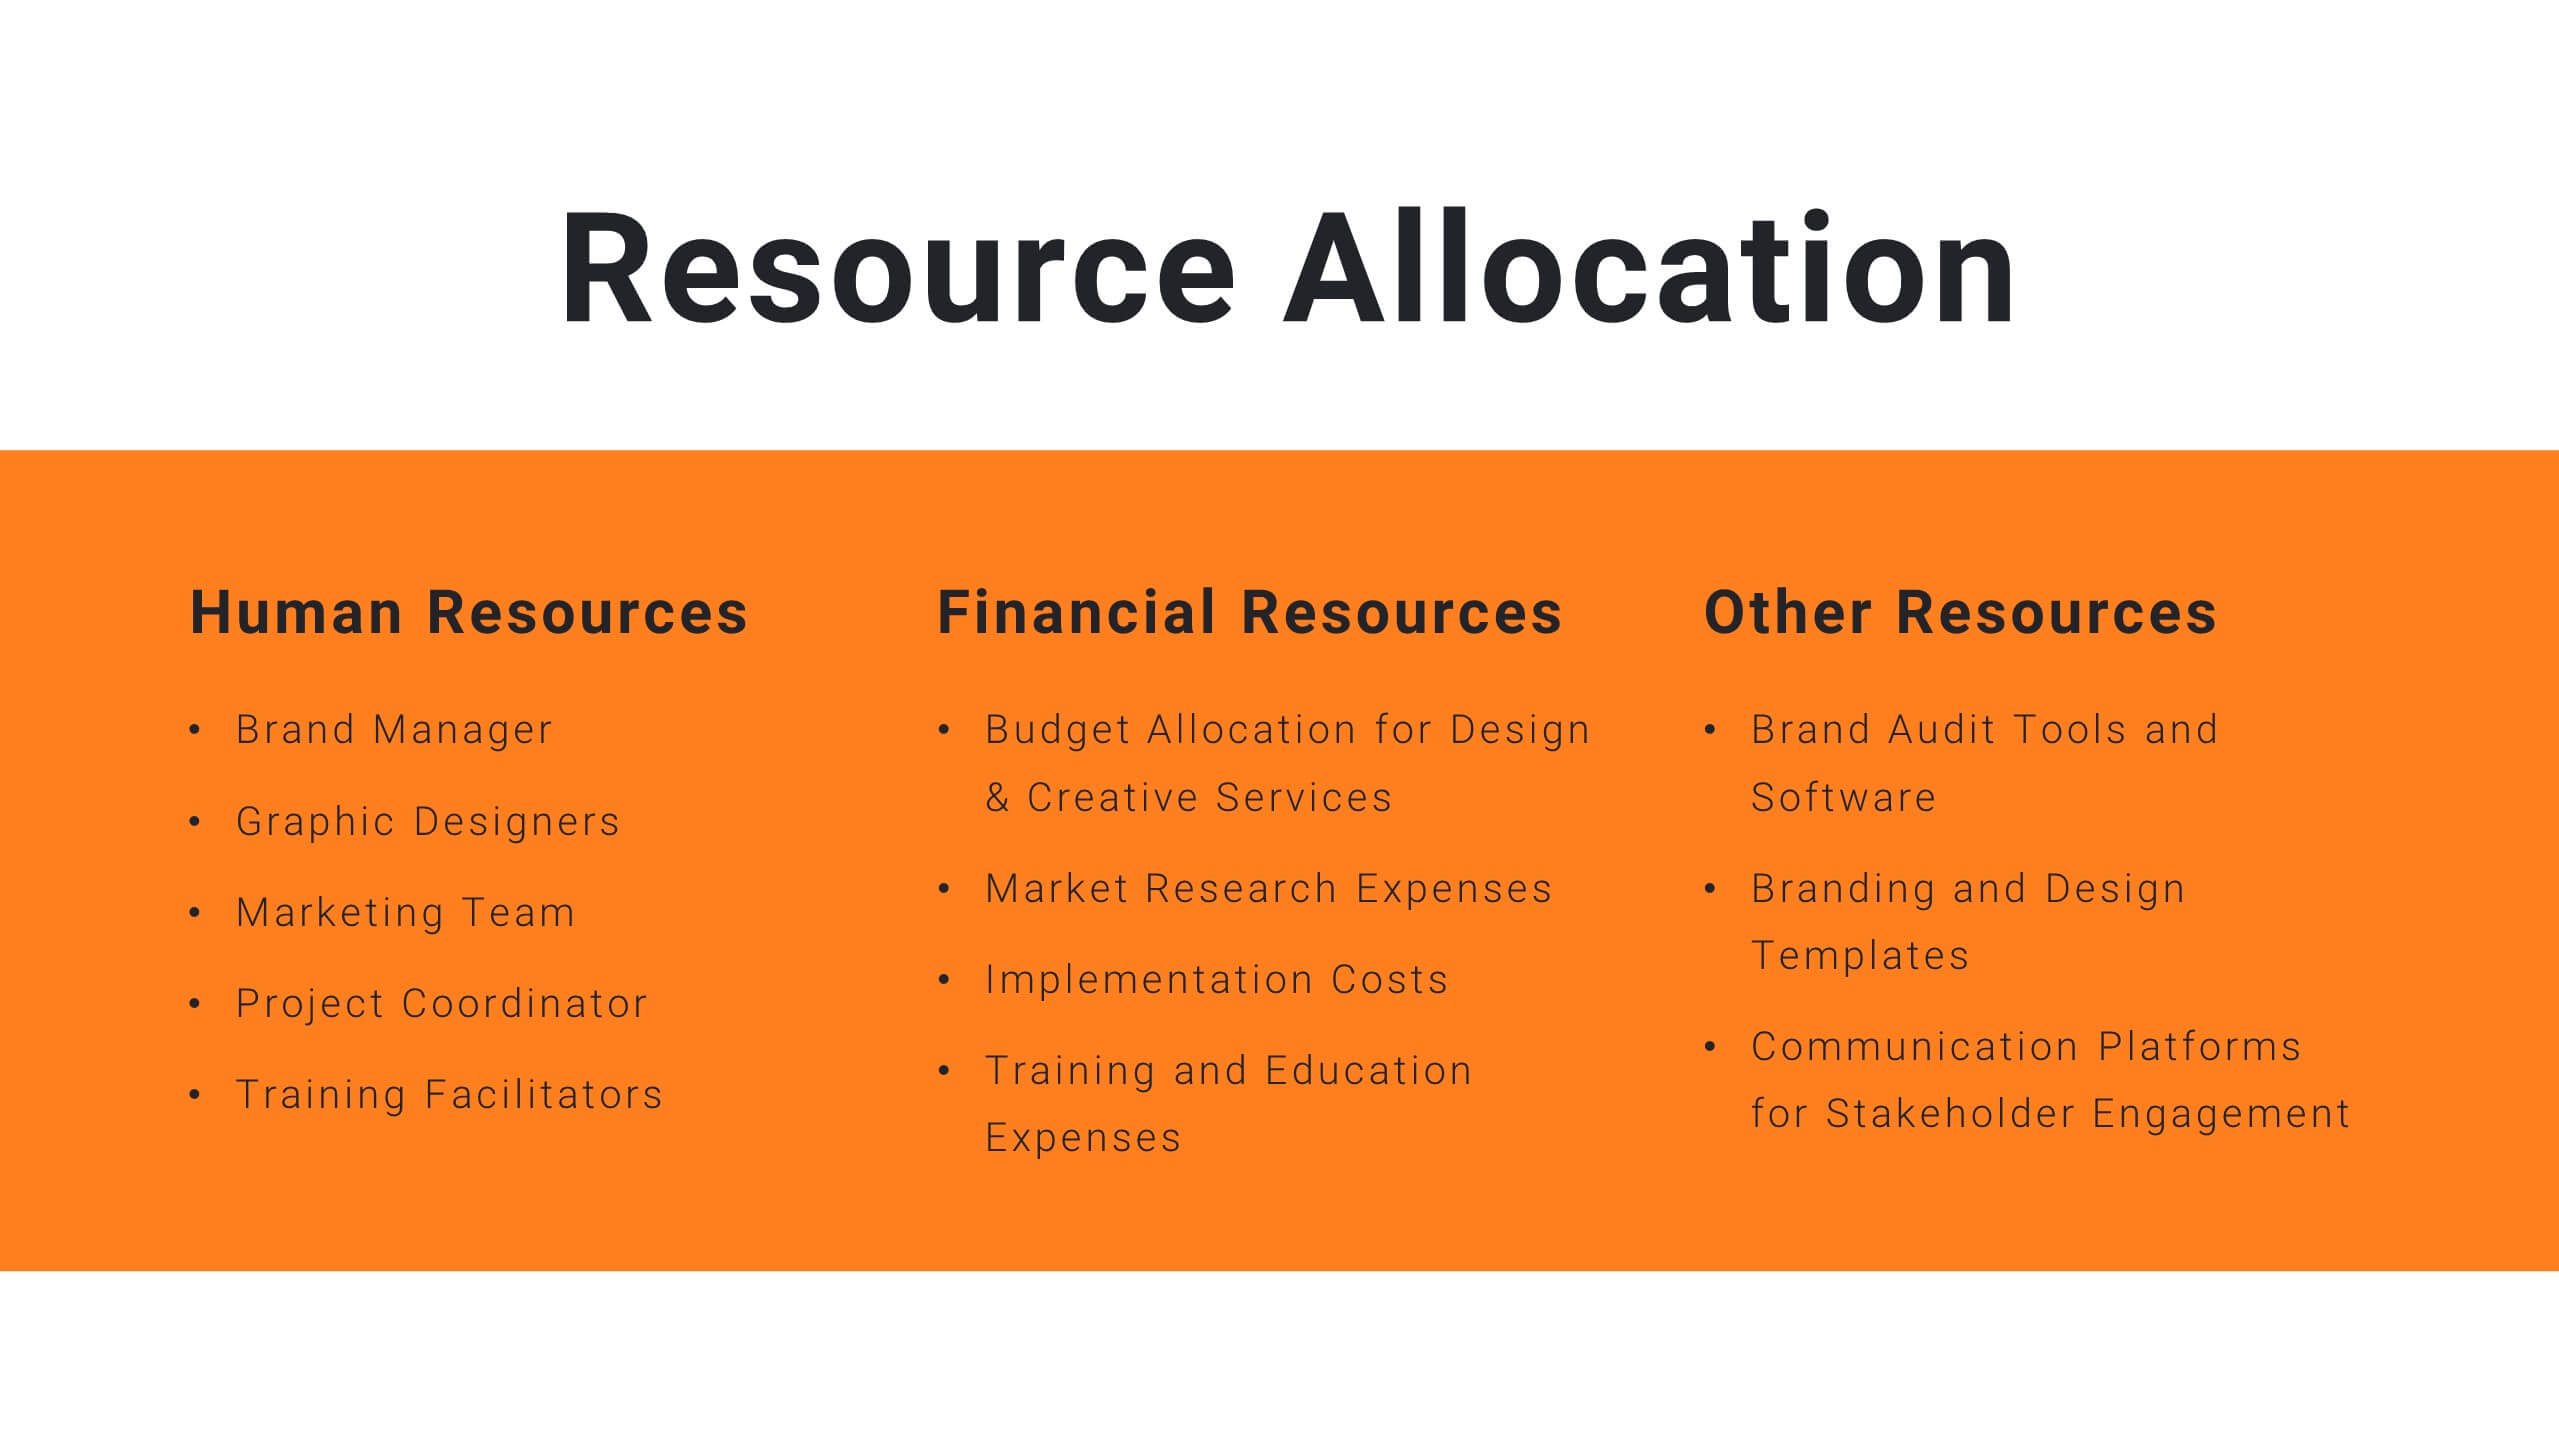
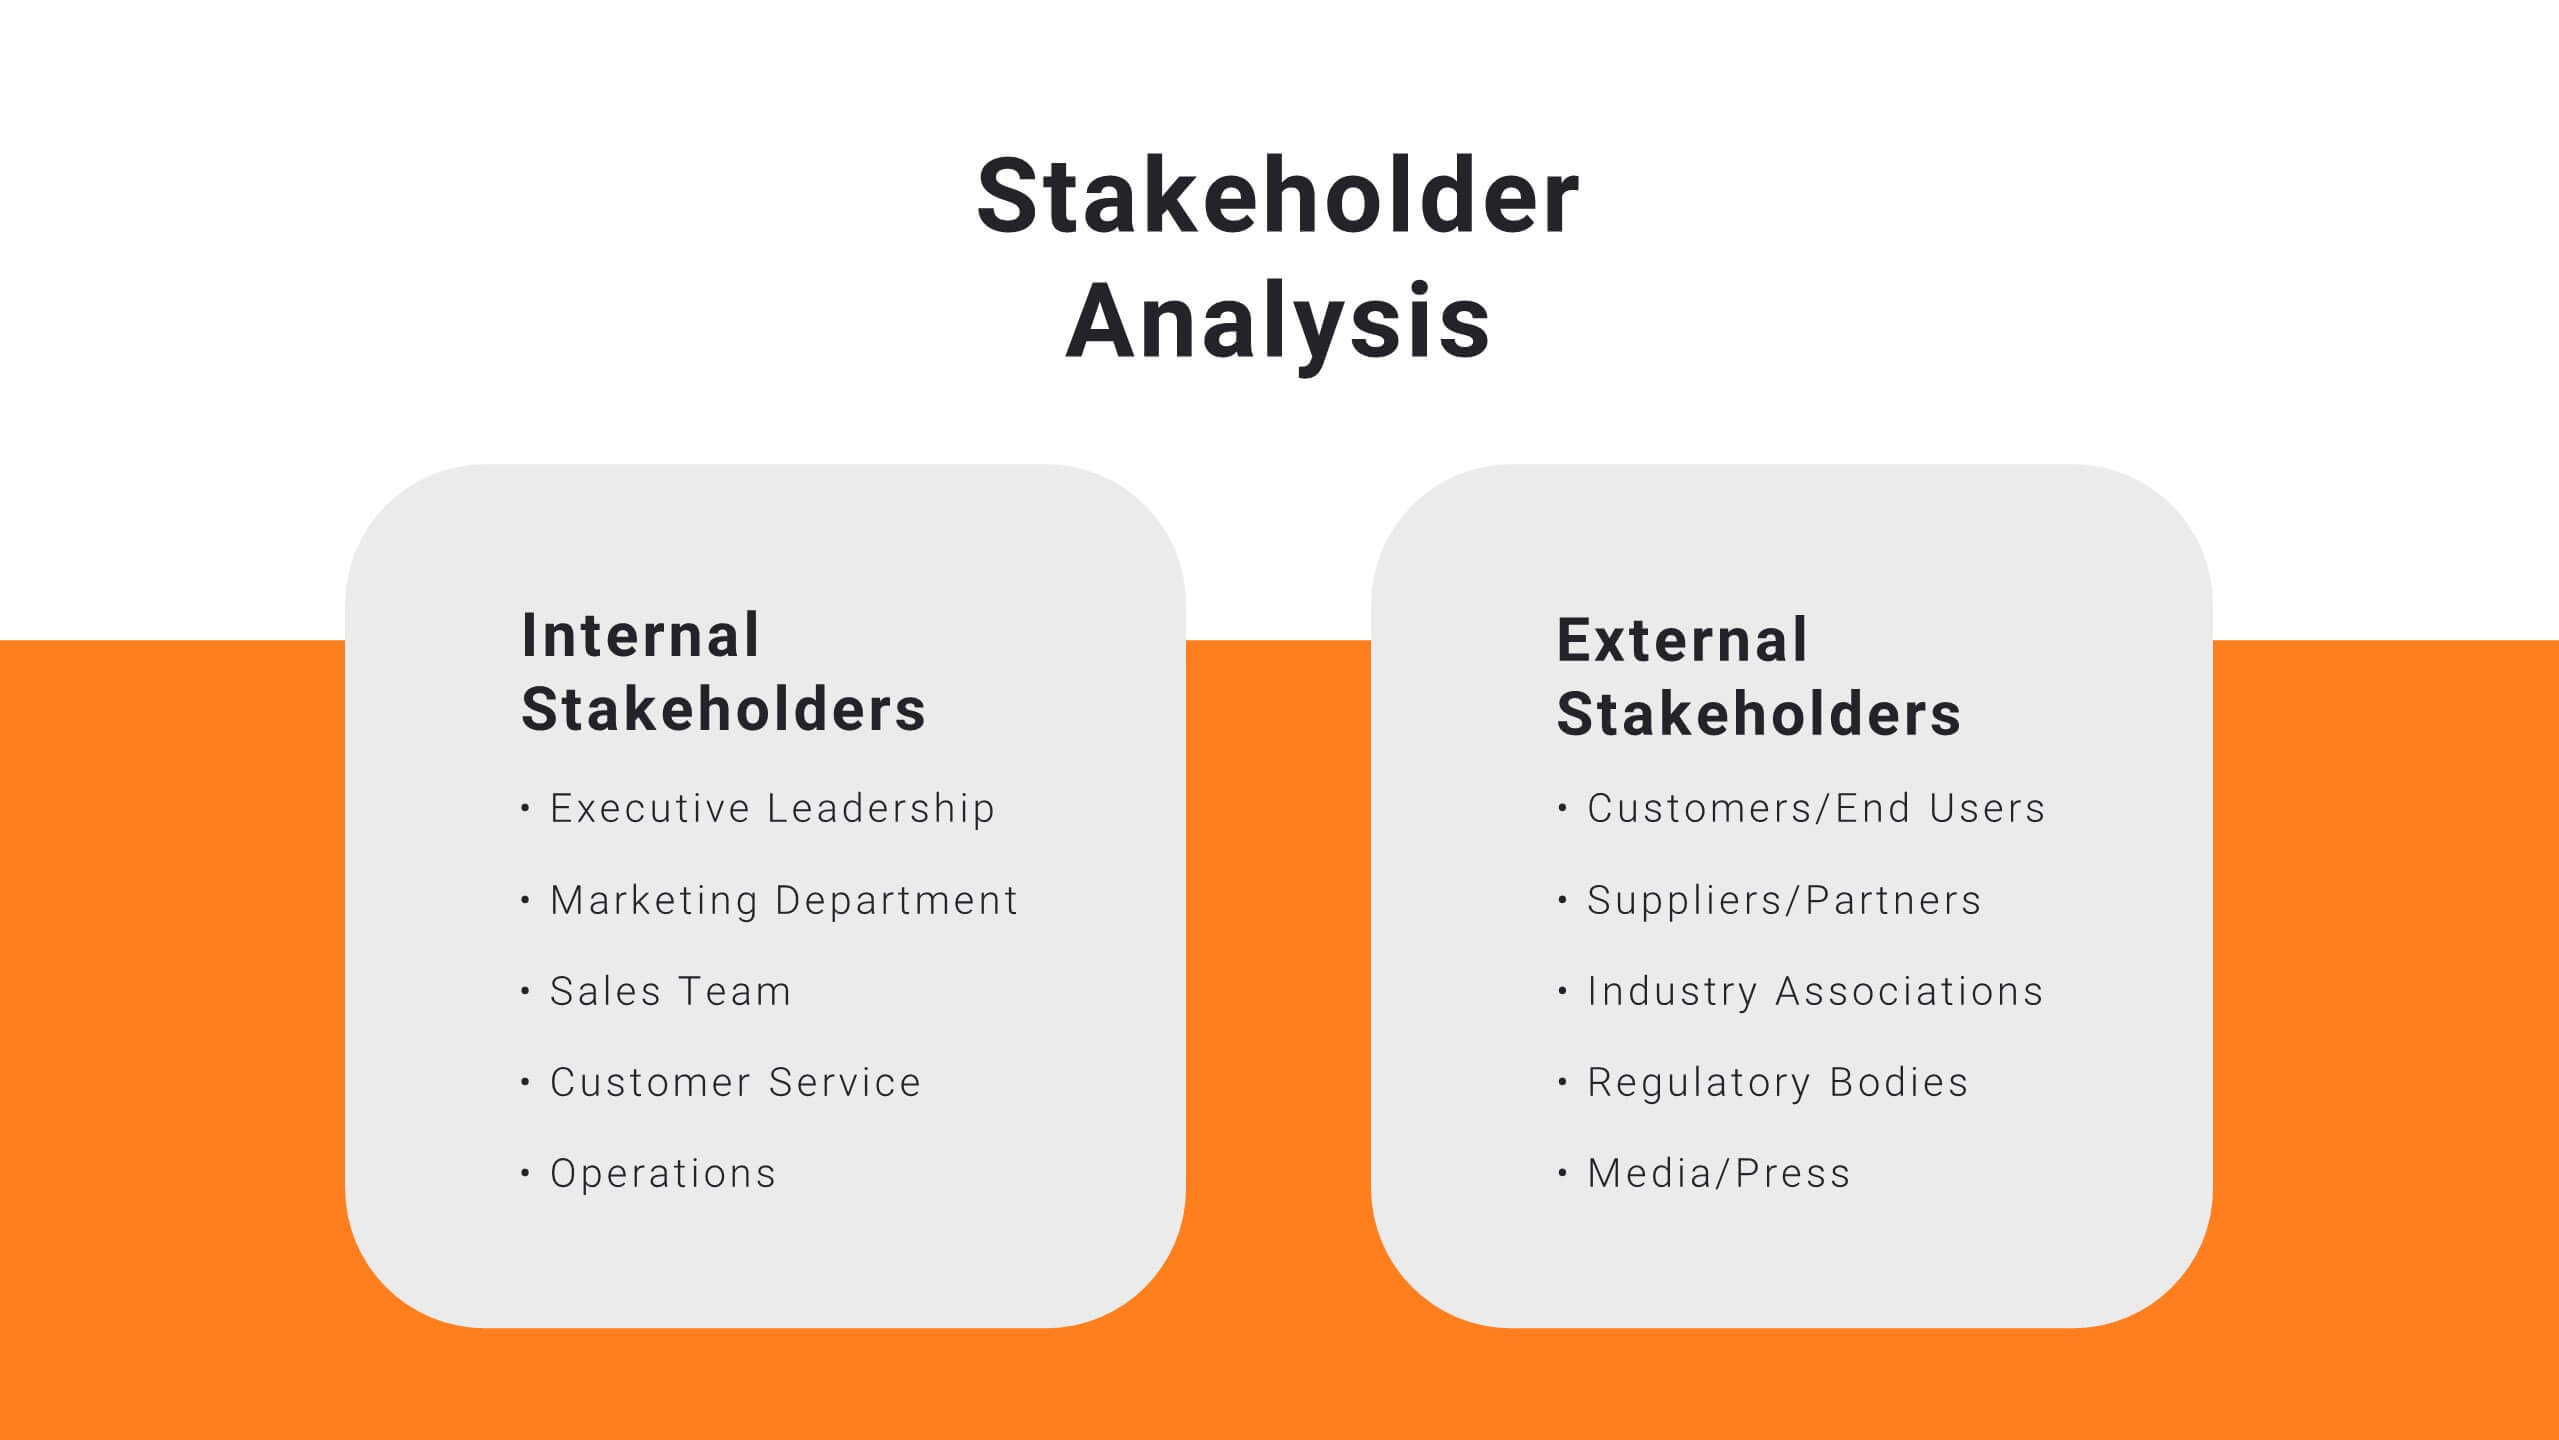
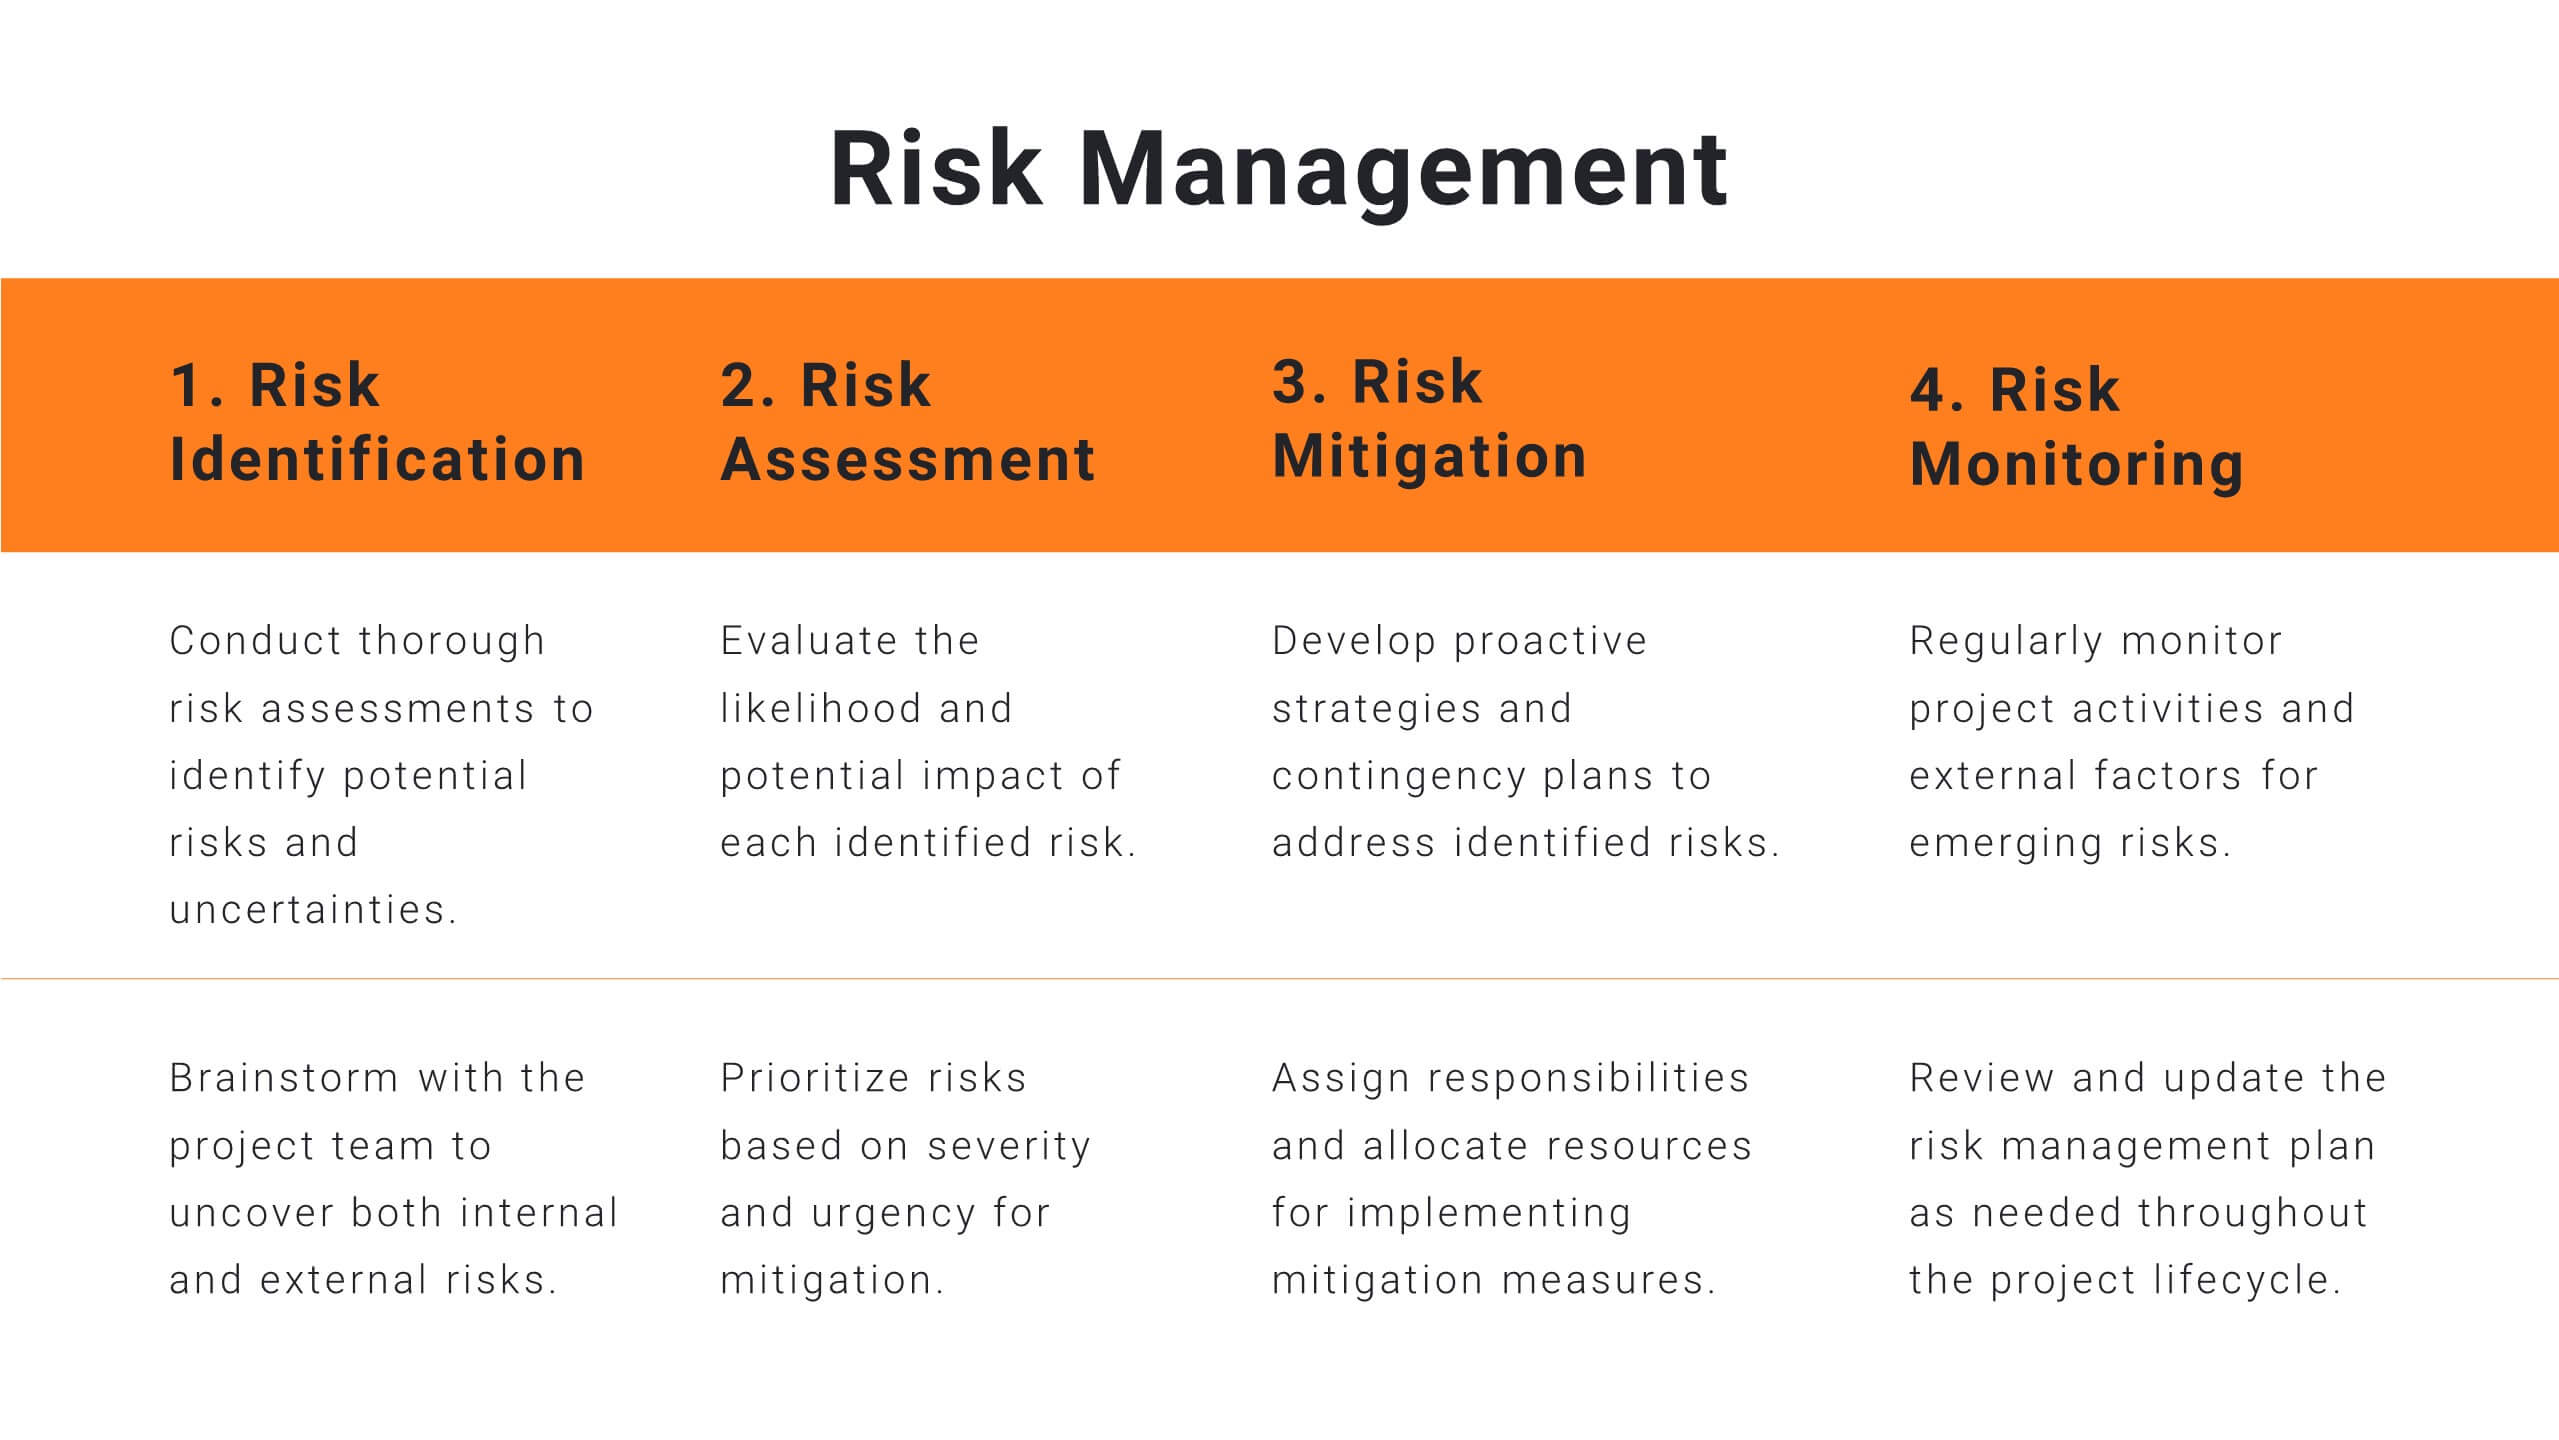
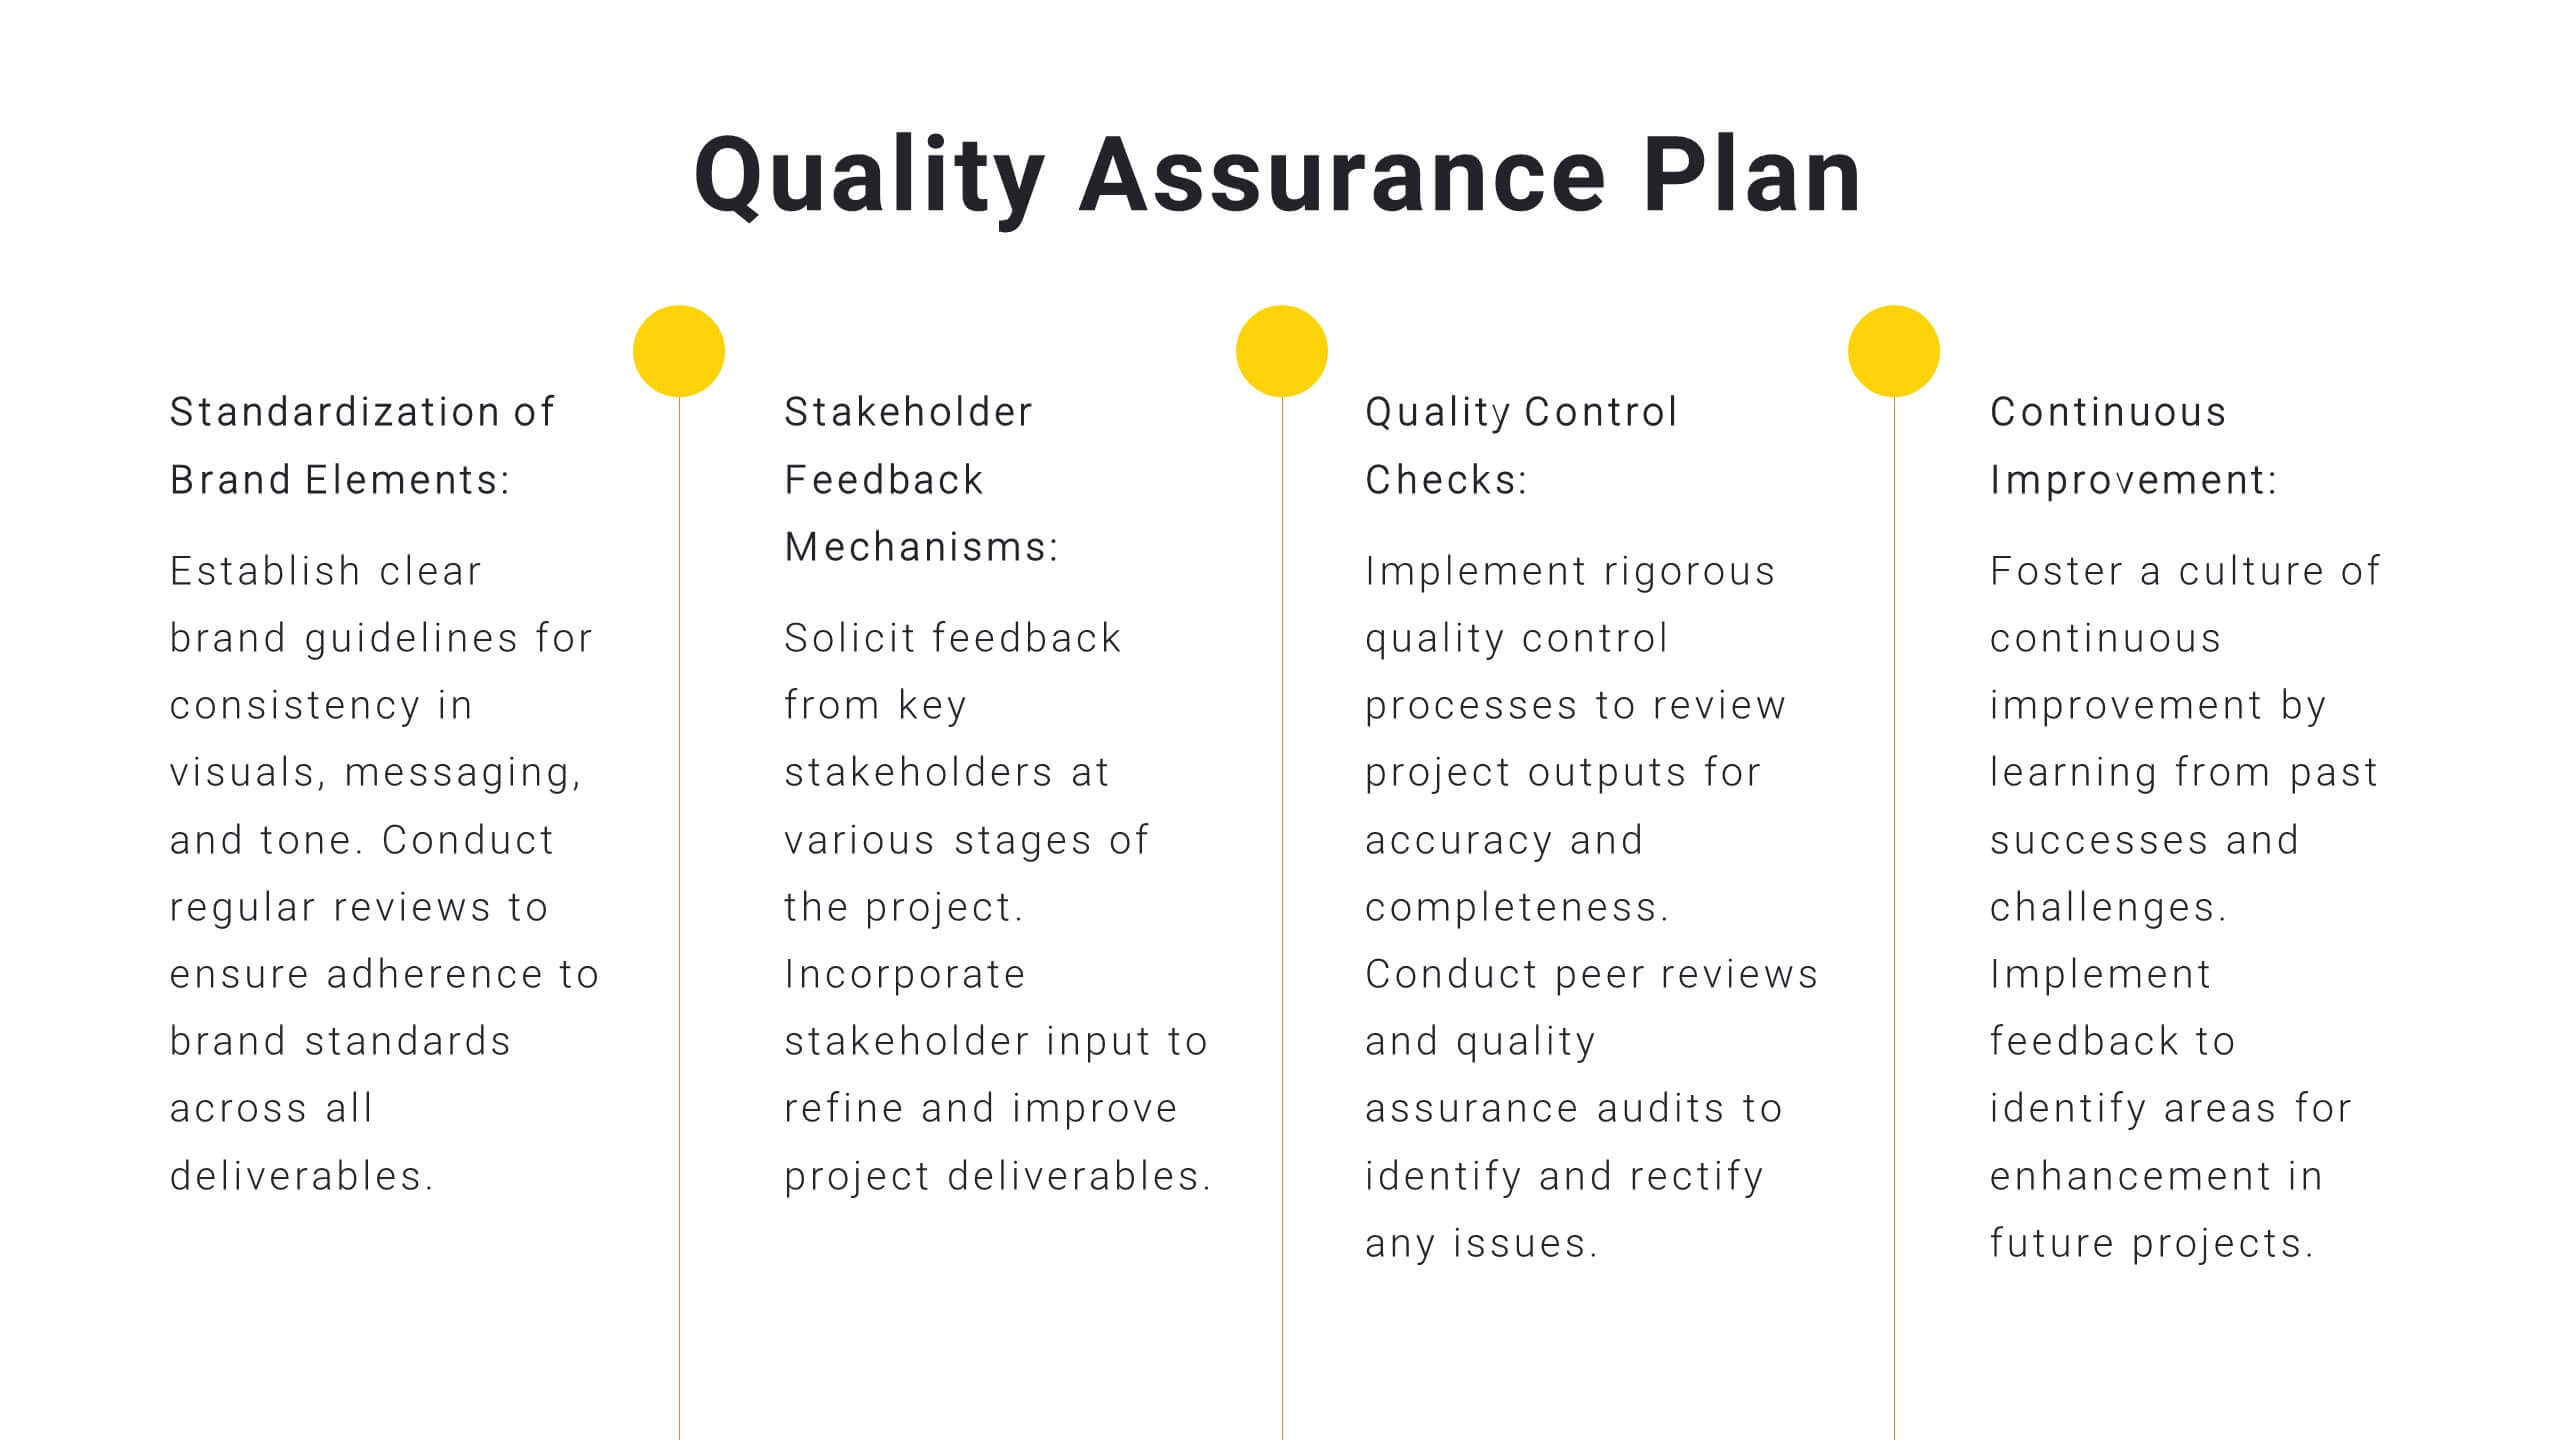
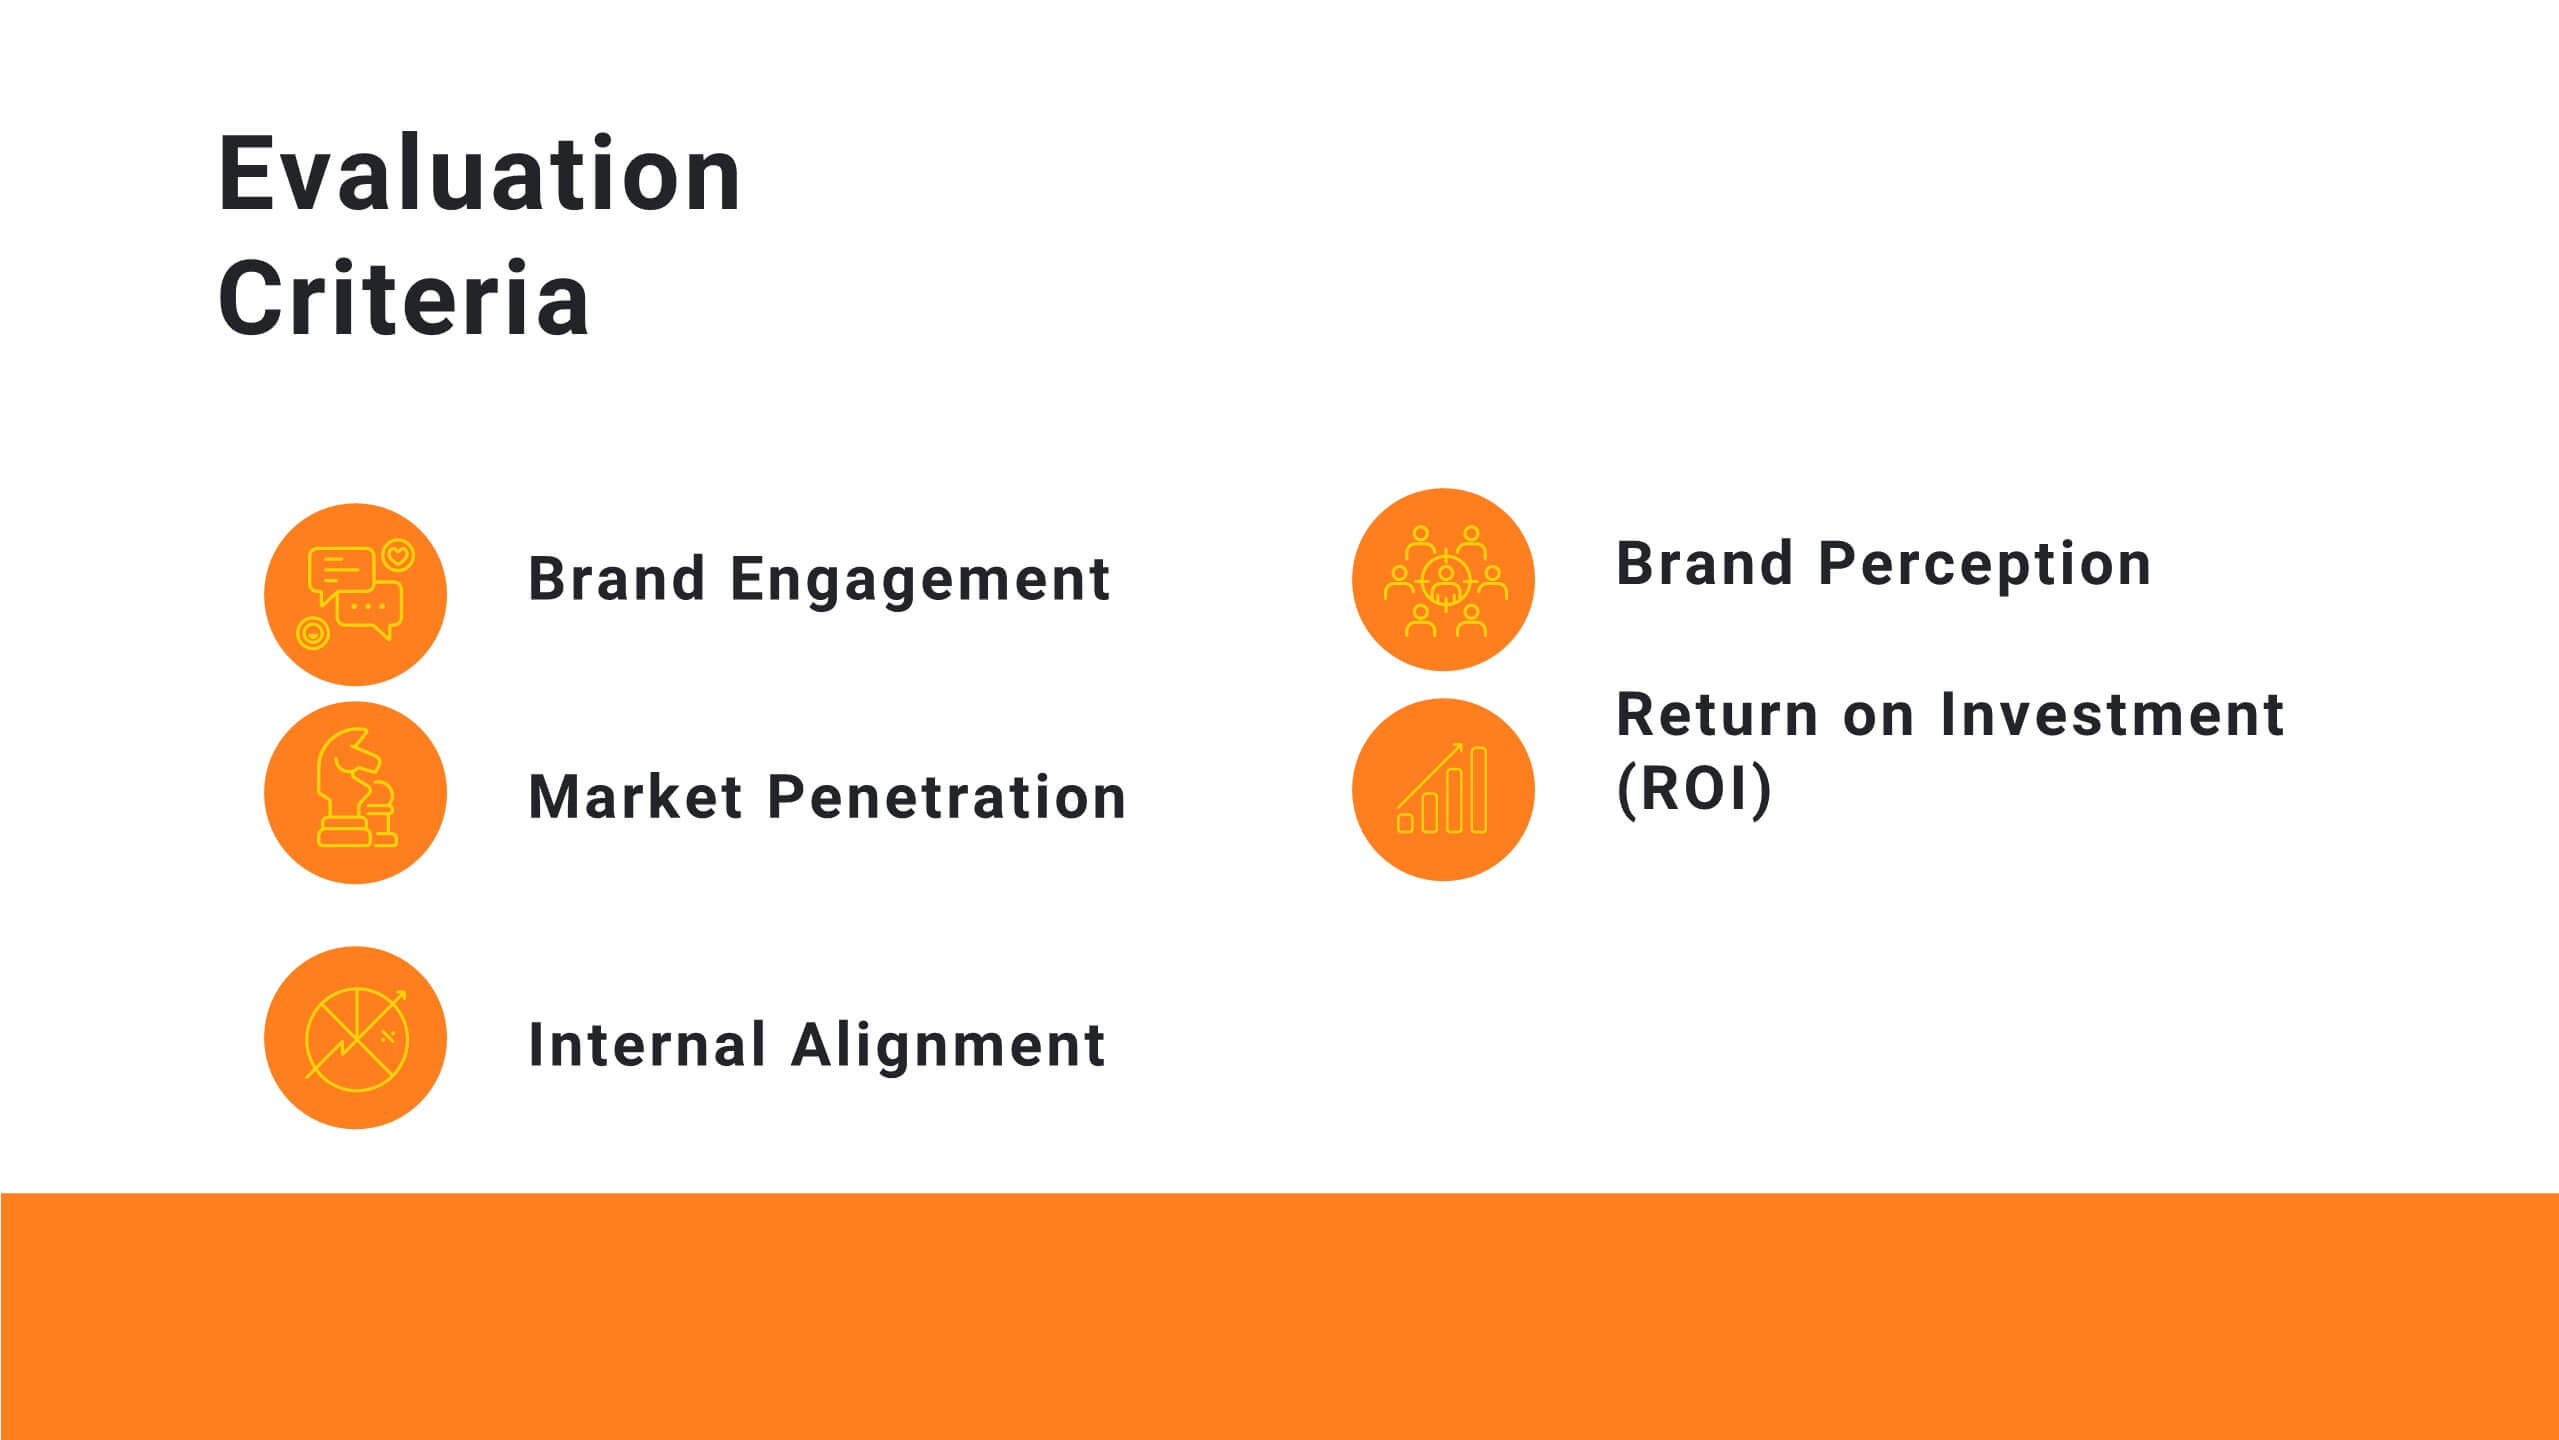
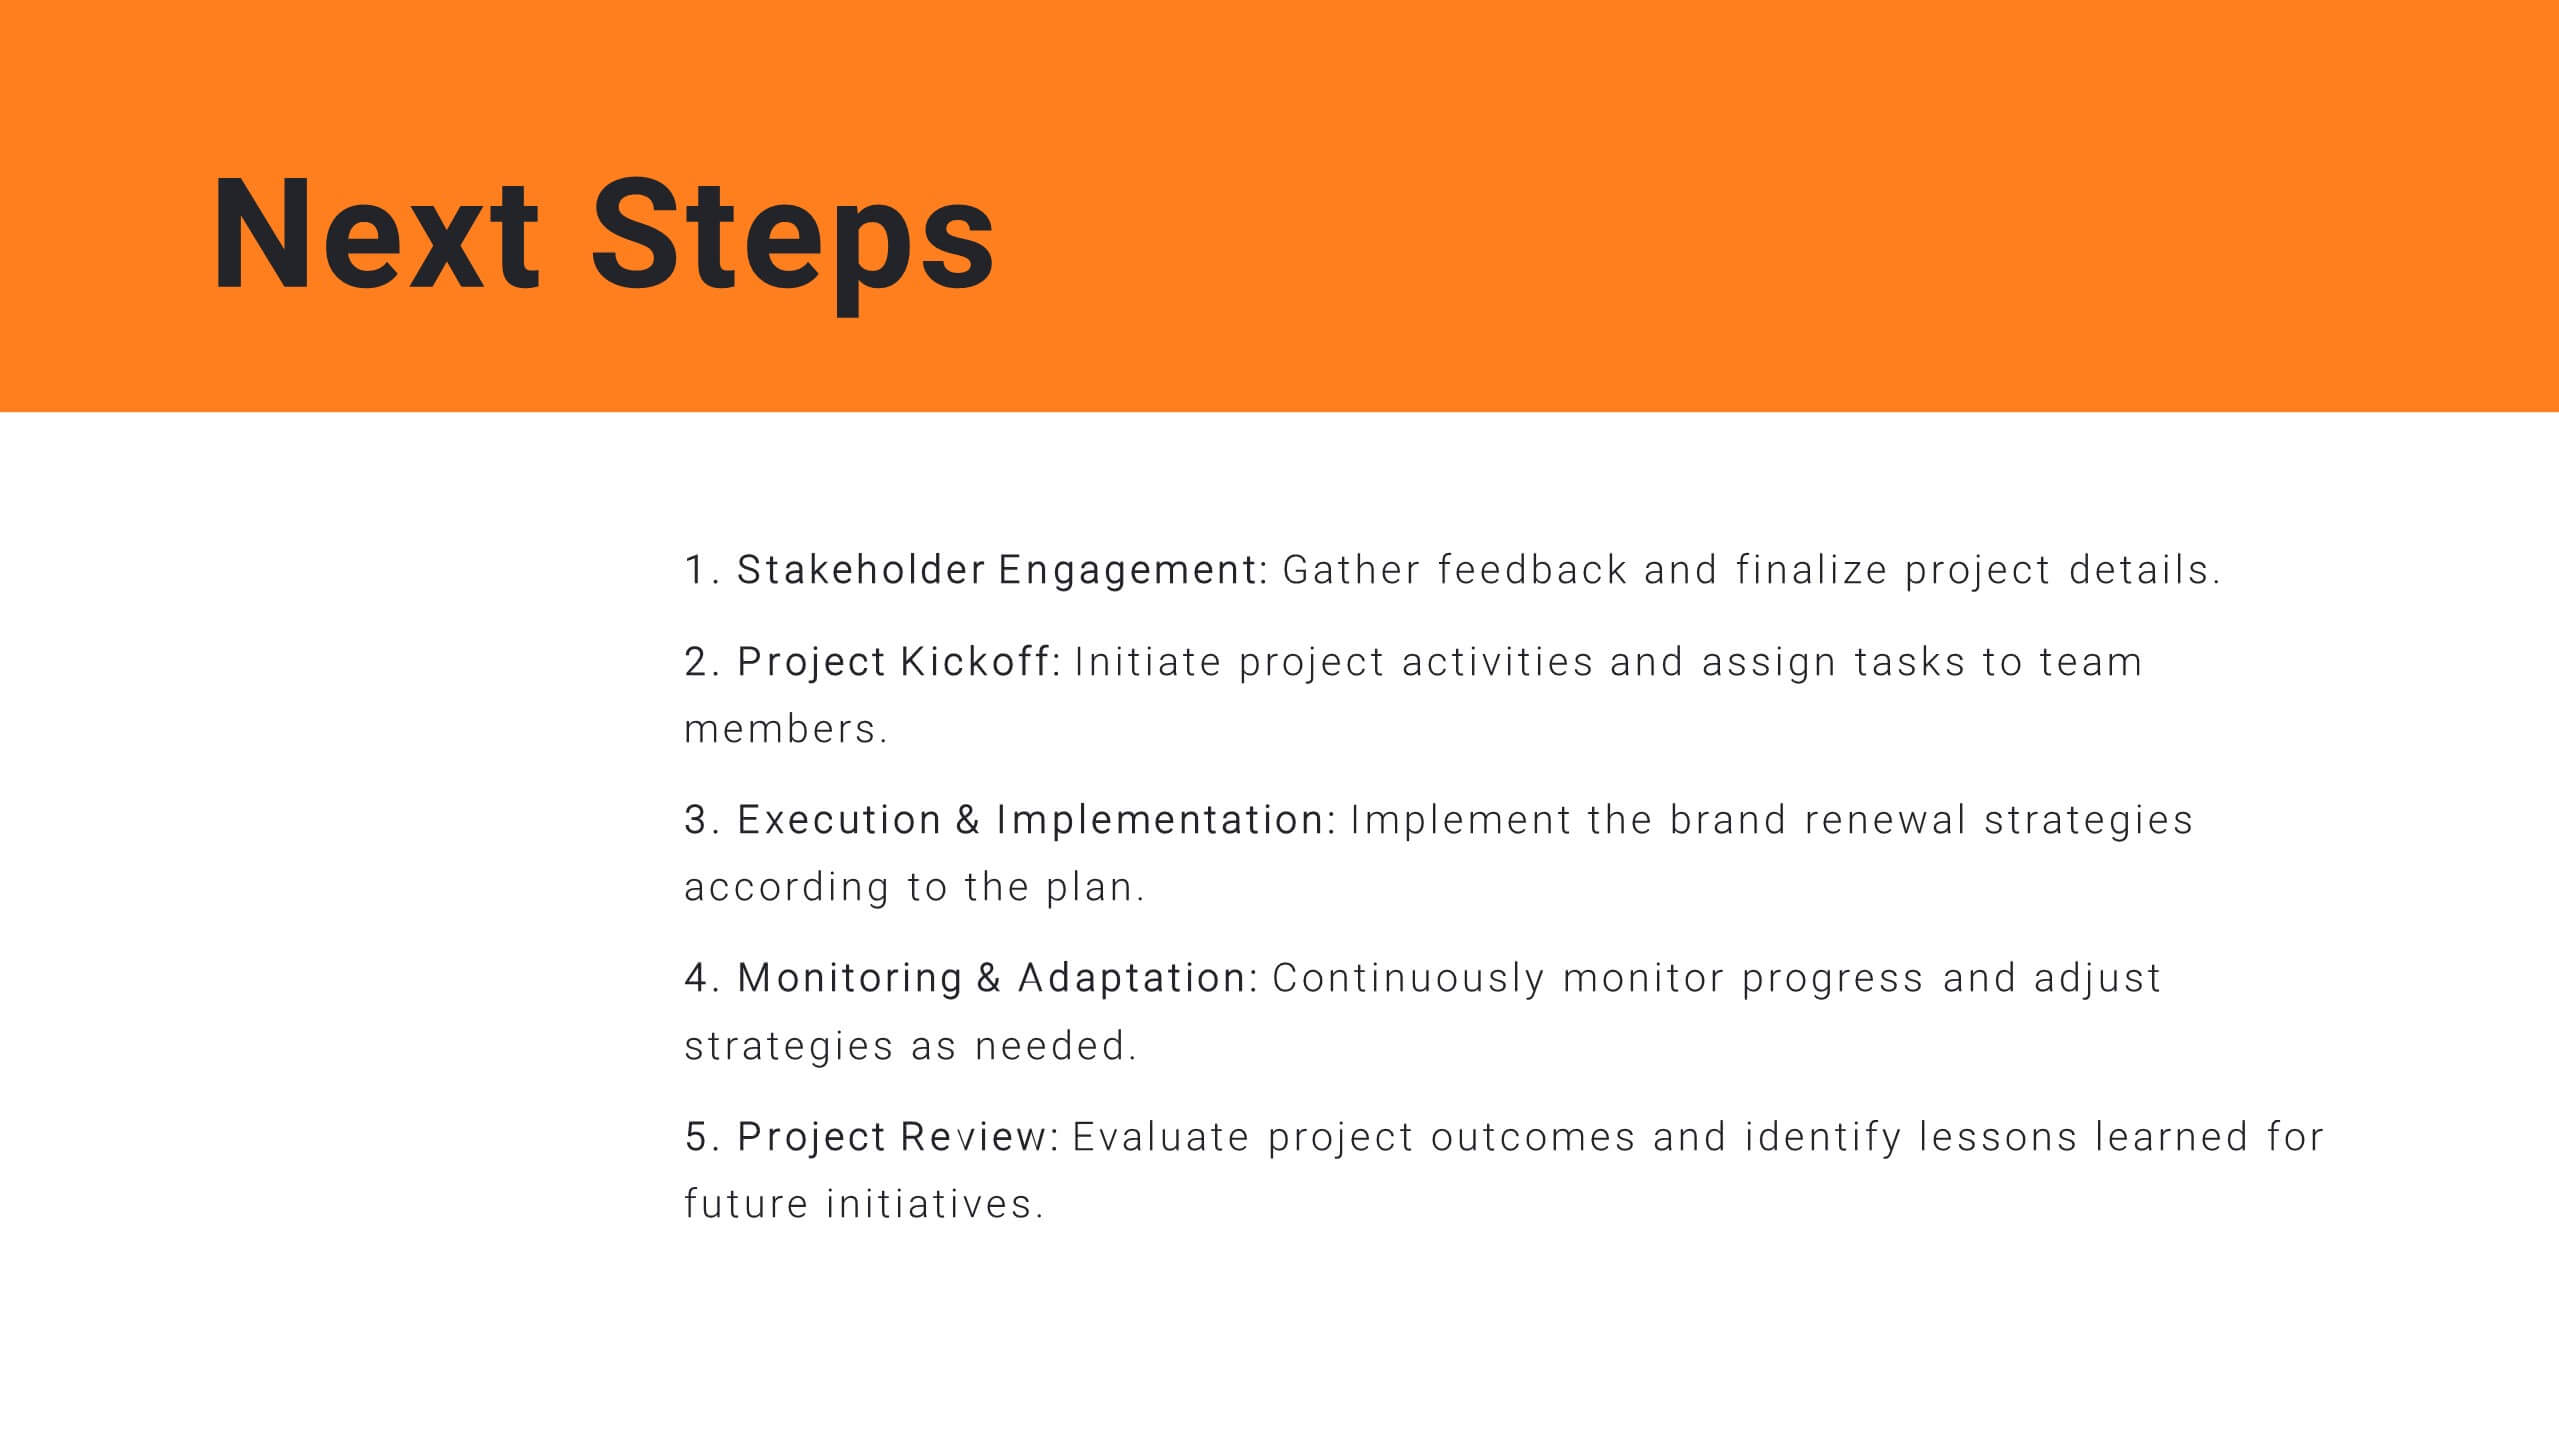
Harmony Project Management Plan Presentation
Plan your project efficiently with this comprehensive project management plan template! It covers all essential aspects including timeline, budget, resource allocation, and risk management. Ensure smooth project execution and achieve your objectives. Compatible with PowerPoint, Keynote, and Google Slides, it's designed to streamline your project planning and management process.


12 slides
Predictive Analytics with Big Data Presentation
Unleash the power of Predictive Analytics with Big Data using this dynamic presentation template. Designed to highlight data-driven insights, AI-powered forecasting, and strategic decision-making, this template is ideal for data scientists, business analysts, and IT professionals. Fully customizable and available for PowerPoint, Keynote, and Google Slides, it ensures a visually compelling and structured presentation.


20 slides
Mythion Business Idea Pitch Deck Presentation
Communicate your business vision with clarity and impact using this comprehensive pitch deck presentation template. Perfect for entrepreneurs, startups, and innovators, this template is designed to help you effectively present your idea to investors, stakeholders, or partners. Cover every essential aspect of your business journey with slides dedicated to the problem statement, solutions, market overview, and target audience. Showcase your business model, revenue projections, and unique selling proposition with visually appealing layouts. Highlight your marketing strategy, growth projections, and funding requirements to build a strong, persuasive case. Fully customizable and compatible with PowerPoint, Google Slides, and Keynote, this template allows you to tailor each slide to suit your business identity and goals. Whether you're pitching a new idea or seeking investment, this template ensures you present with professionalism and confidence.


6 slides
Building High-Performing Teams Presentation
Unlock your team's full potential with this dynamic Building High-Performing Teams template. Featuring a sleek 3-part circular layout, it's perfect for showcasing leadership roles, collaboration pillars, or performance drivers. Use it for HR meetings, training sessions, or team development plans. Fully editable in PowerPoint, Keynote, and Google Slides.


4 slides
Key Business Insights Executive Summary
Present your insights like a pro with this dynamic, timeline-inspired slide that makes key data points easy to follow. Designed to highlight four major takeaways or milestones, this visual format is ideal for summarizing business progress, strategy updates, or operational highlights. Fully editable in PowerPoint, Keynote, and Google Slides.