


Features
- 5 Unique slides
- Fully editable and easy to edit in Microsoft Powerpoint, Keynote and Google Slides
- 16:9 widescreen layout
- Clean and professional designs
- Export to JPG, PDF or send by email


Do you have any questions?
Recommend


22 slides
Sphinx Project Status Report Presentation
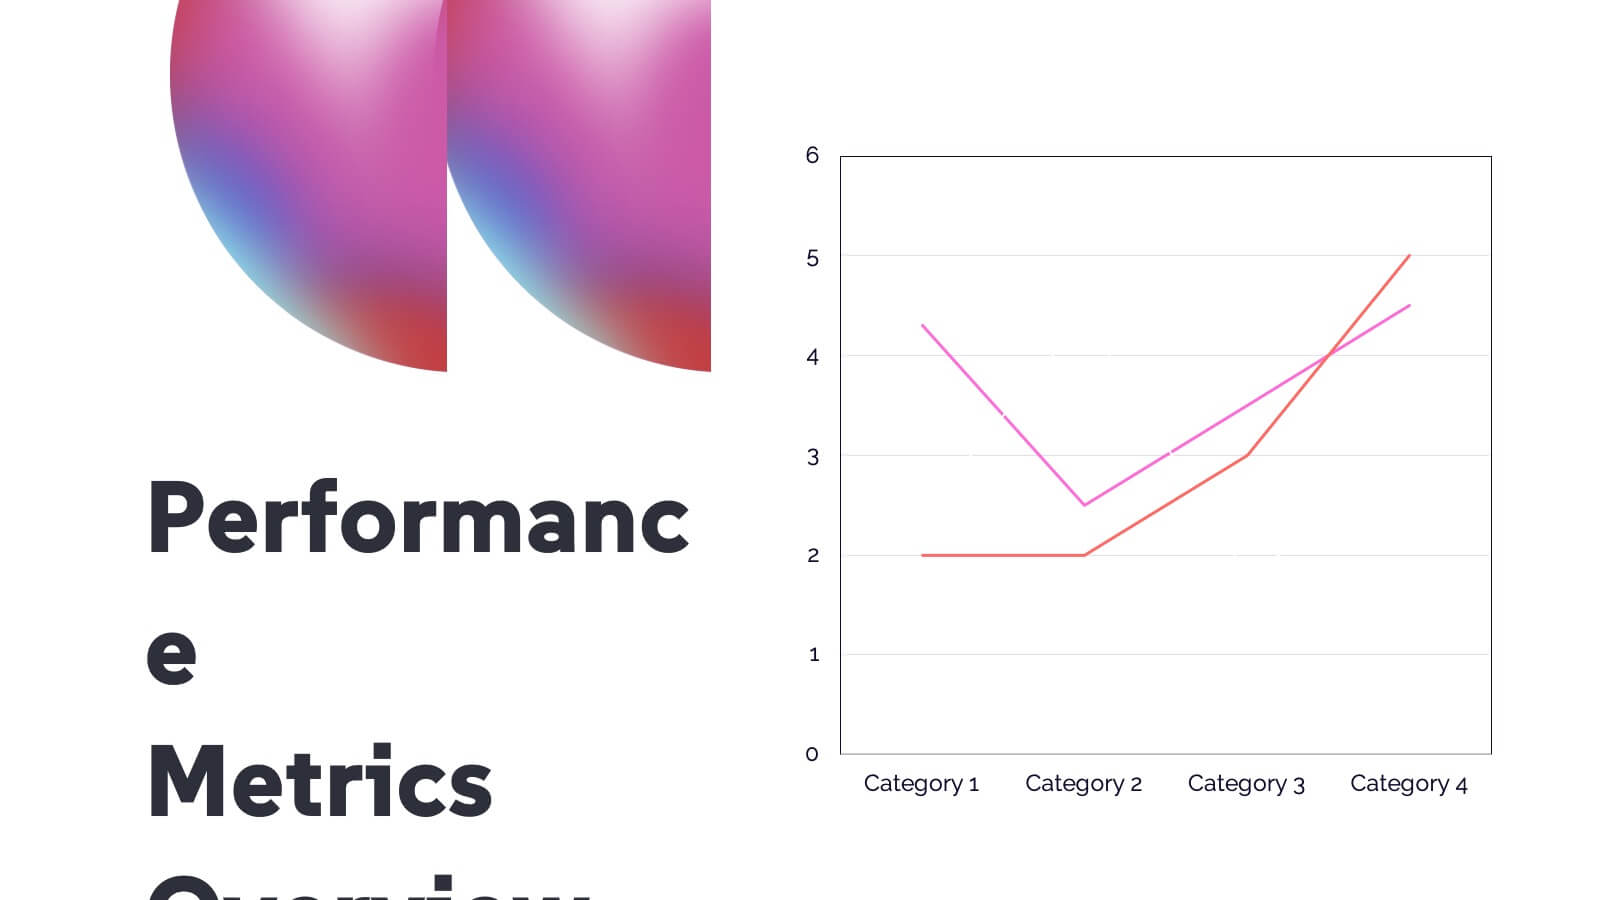
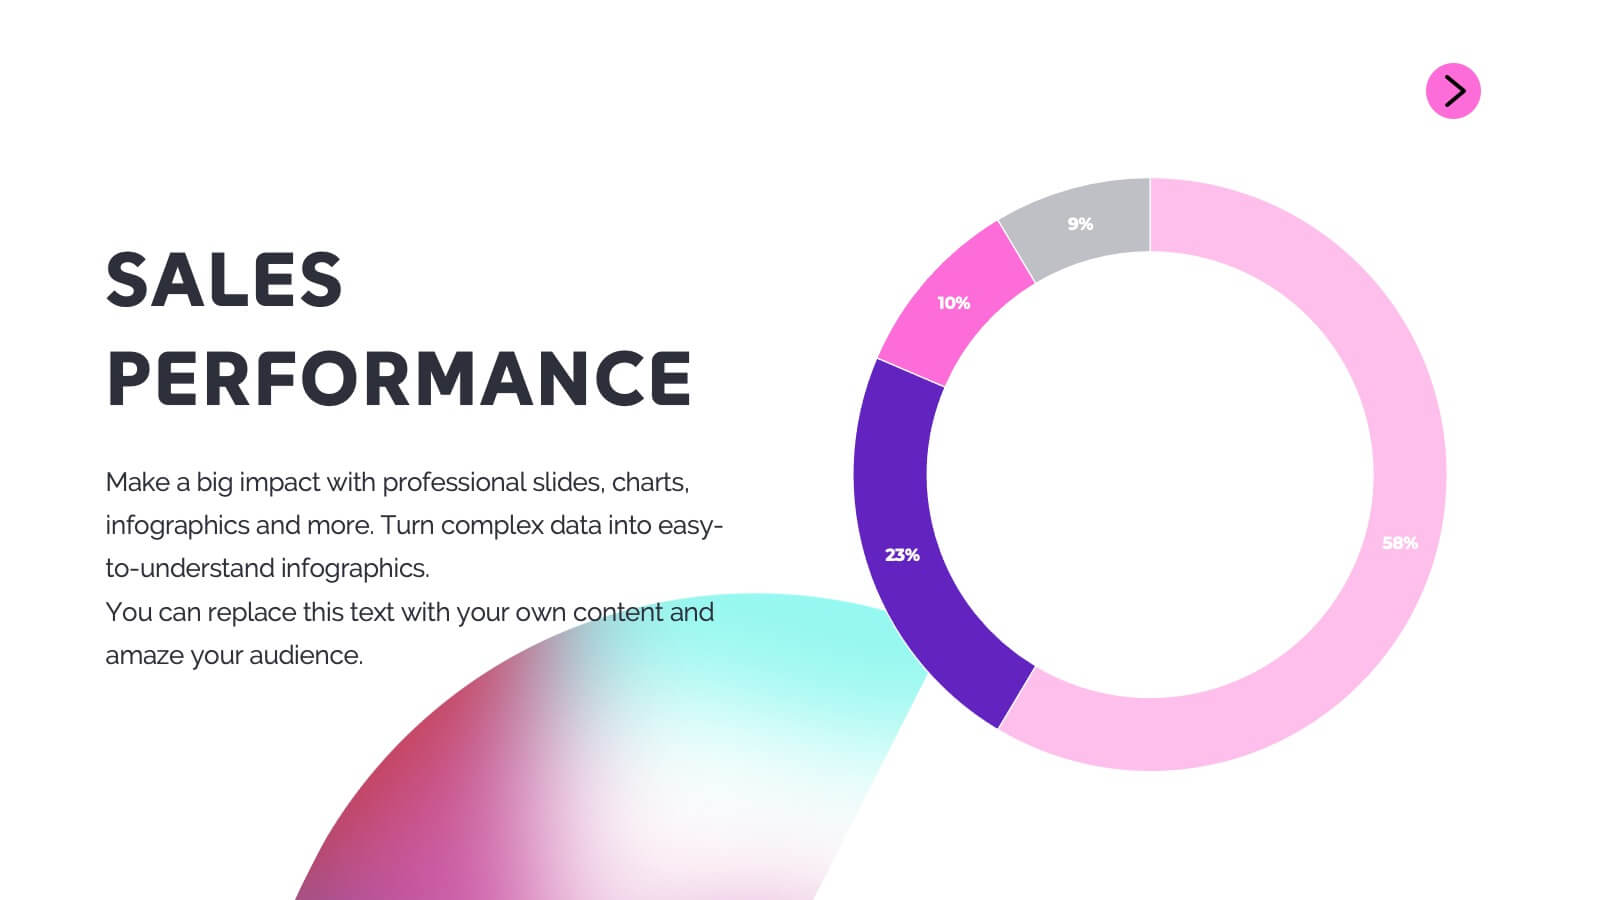
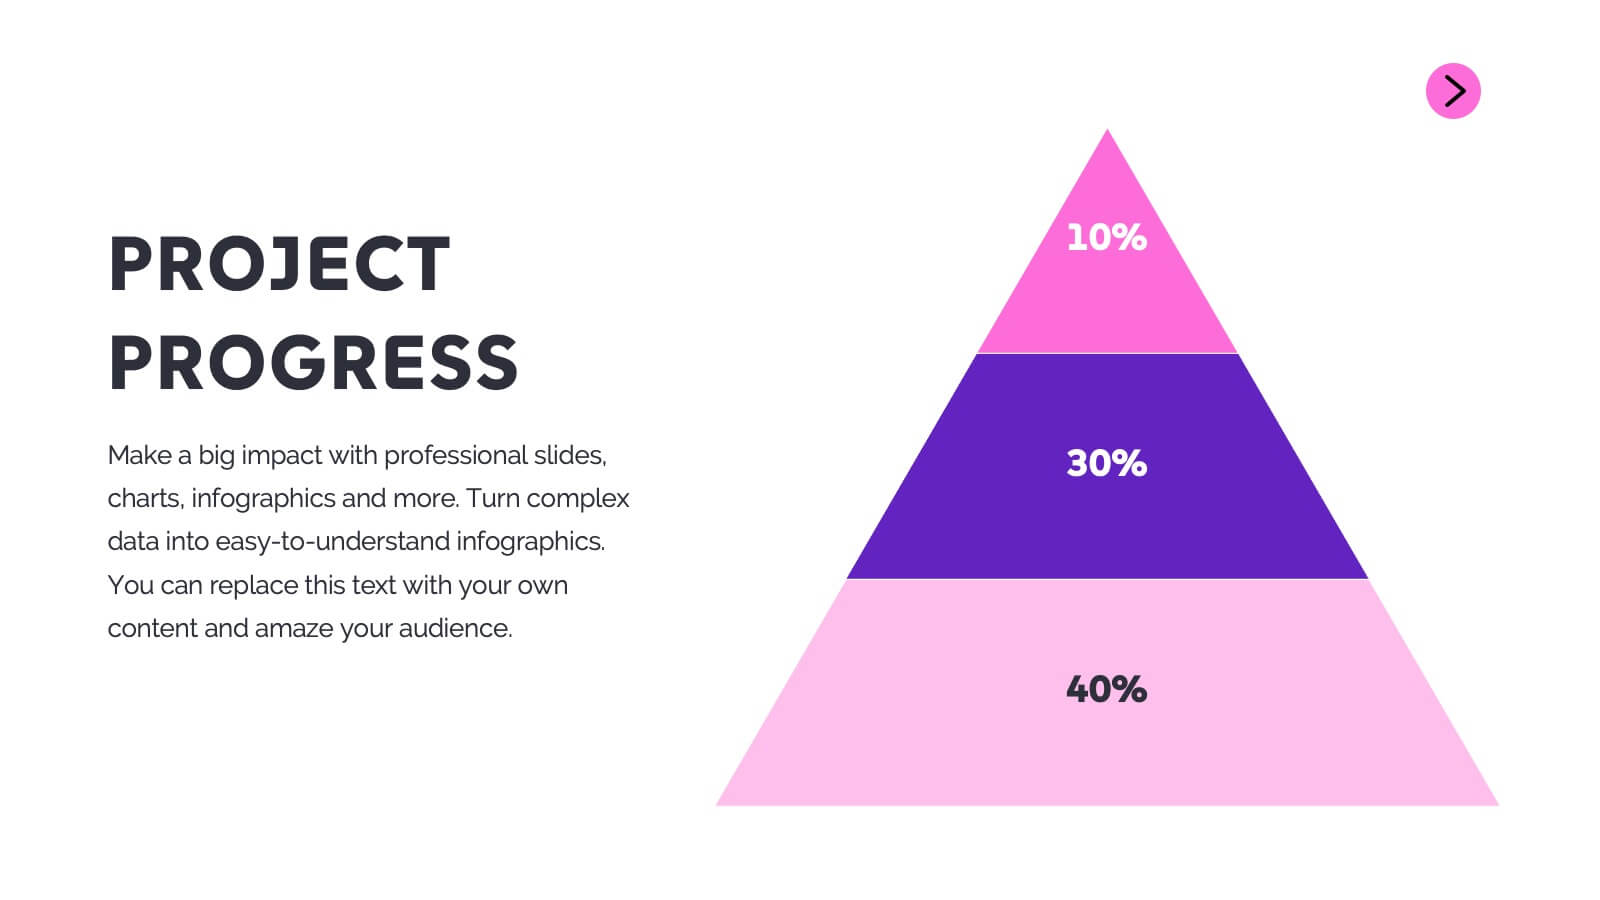
This modern project status report template is perfect for tracking progress and highlighting key achievements. It includes sections for performance metrics, financial summaries, challenges, and strategic initiatives. Keep stakeholders informed with clear, concise updates. Compatible with PowerPoint, Keynote, and Google Slides for easy customization and presentation.


26 slides
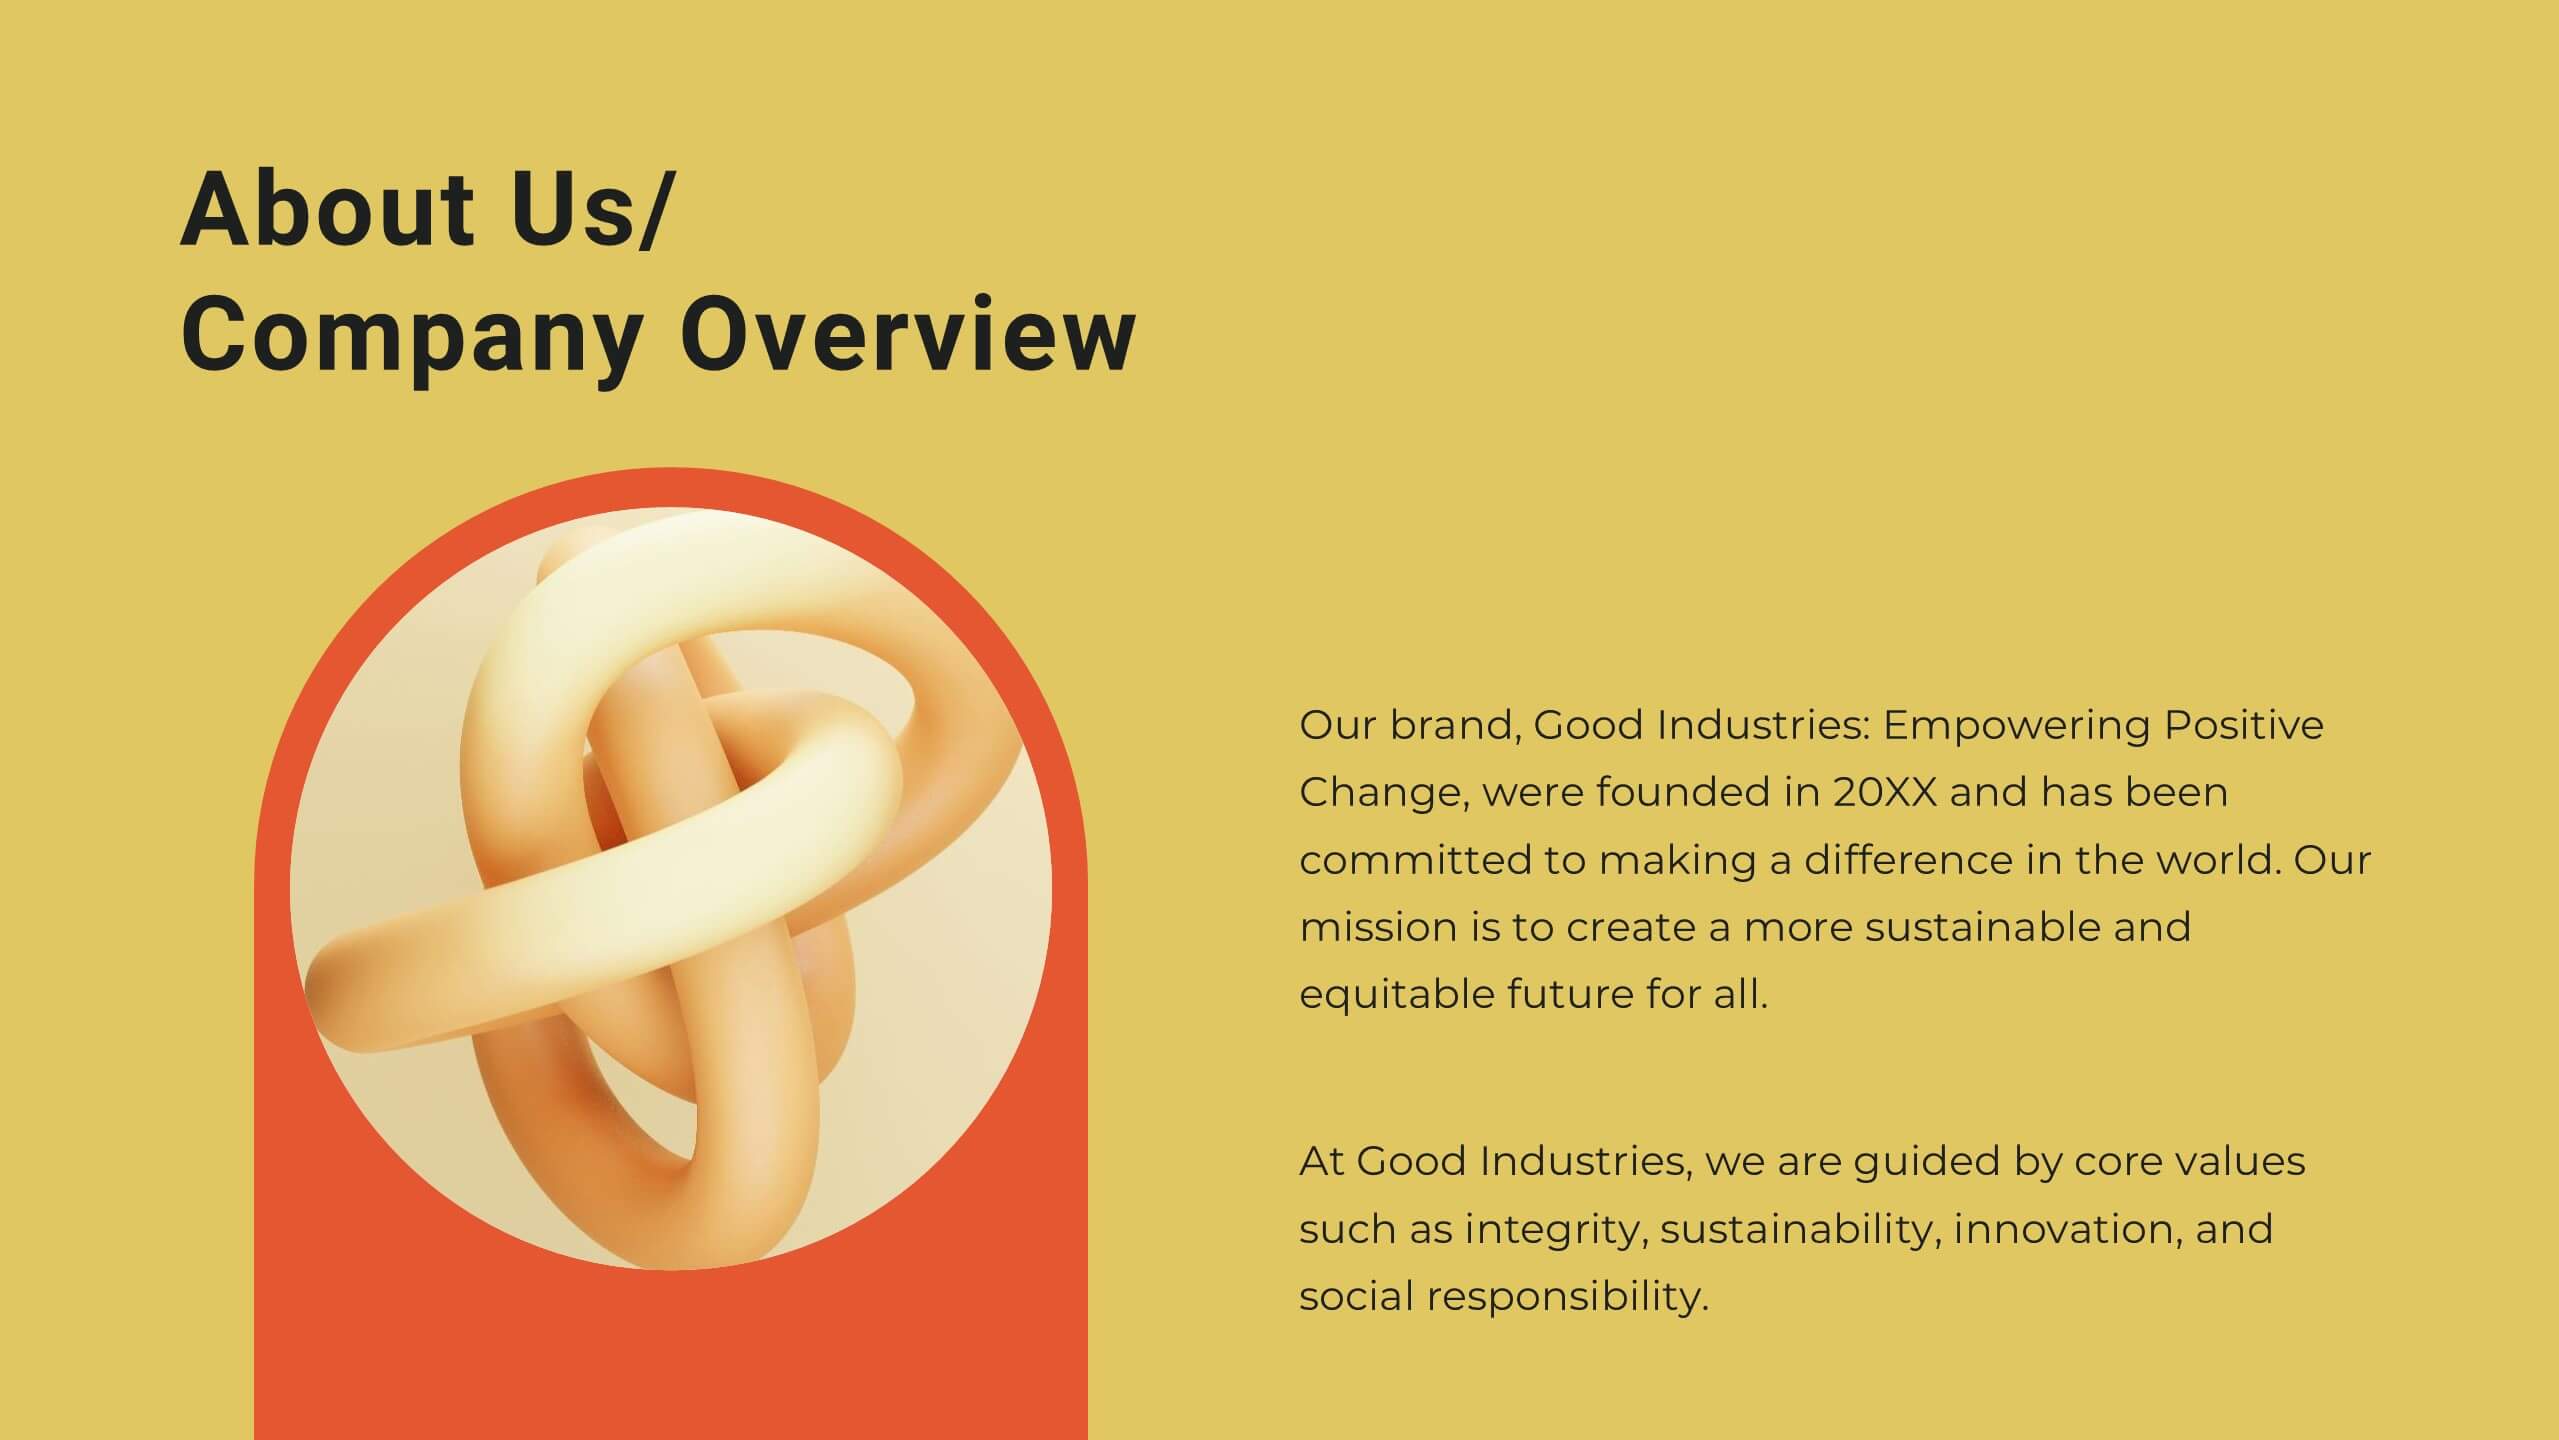
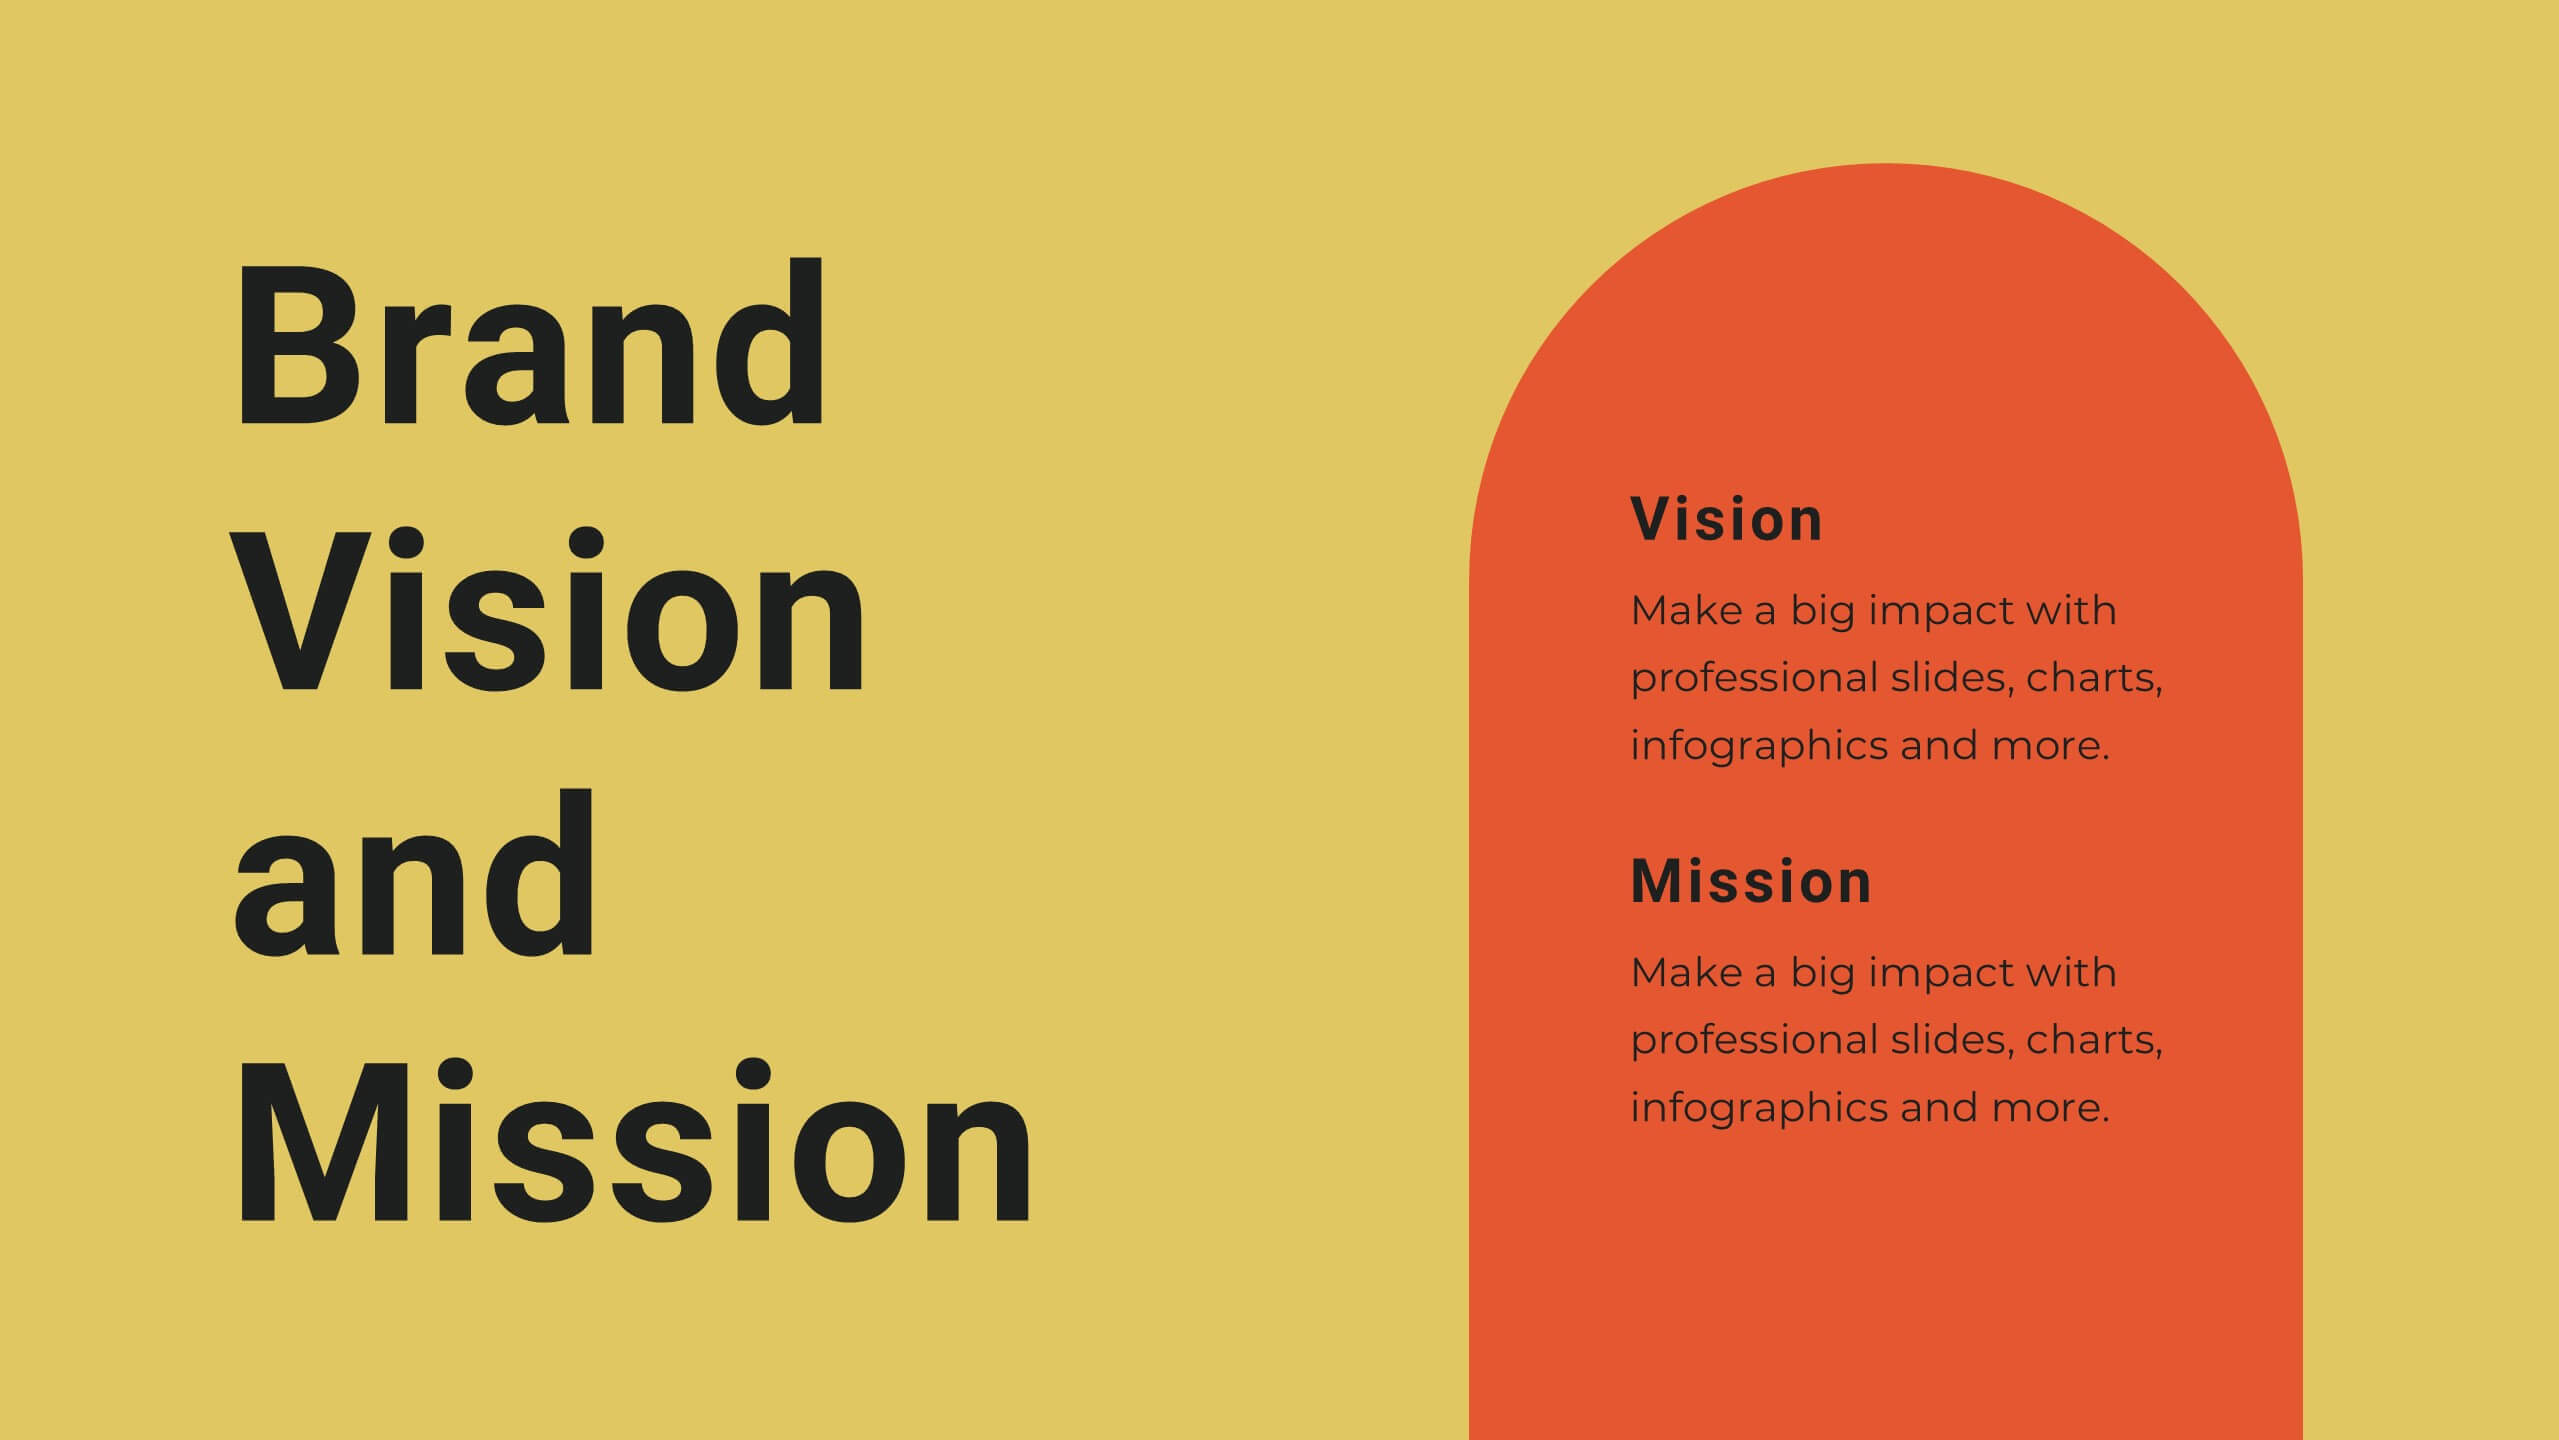
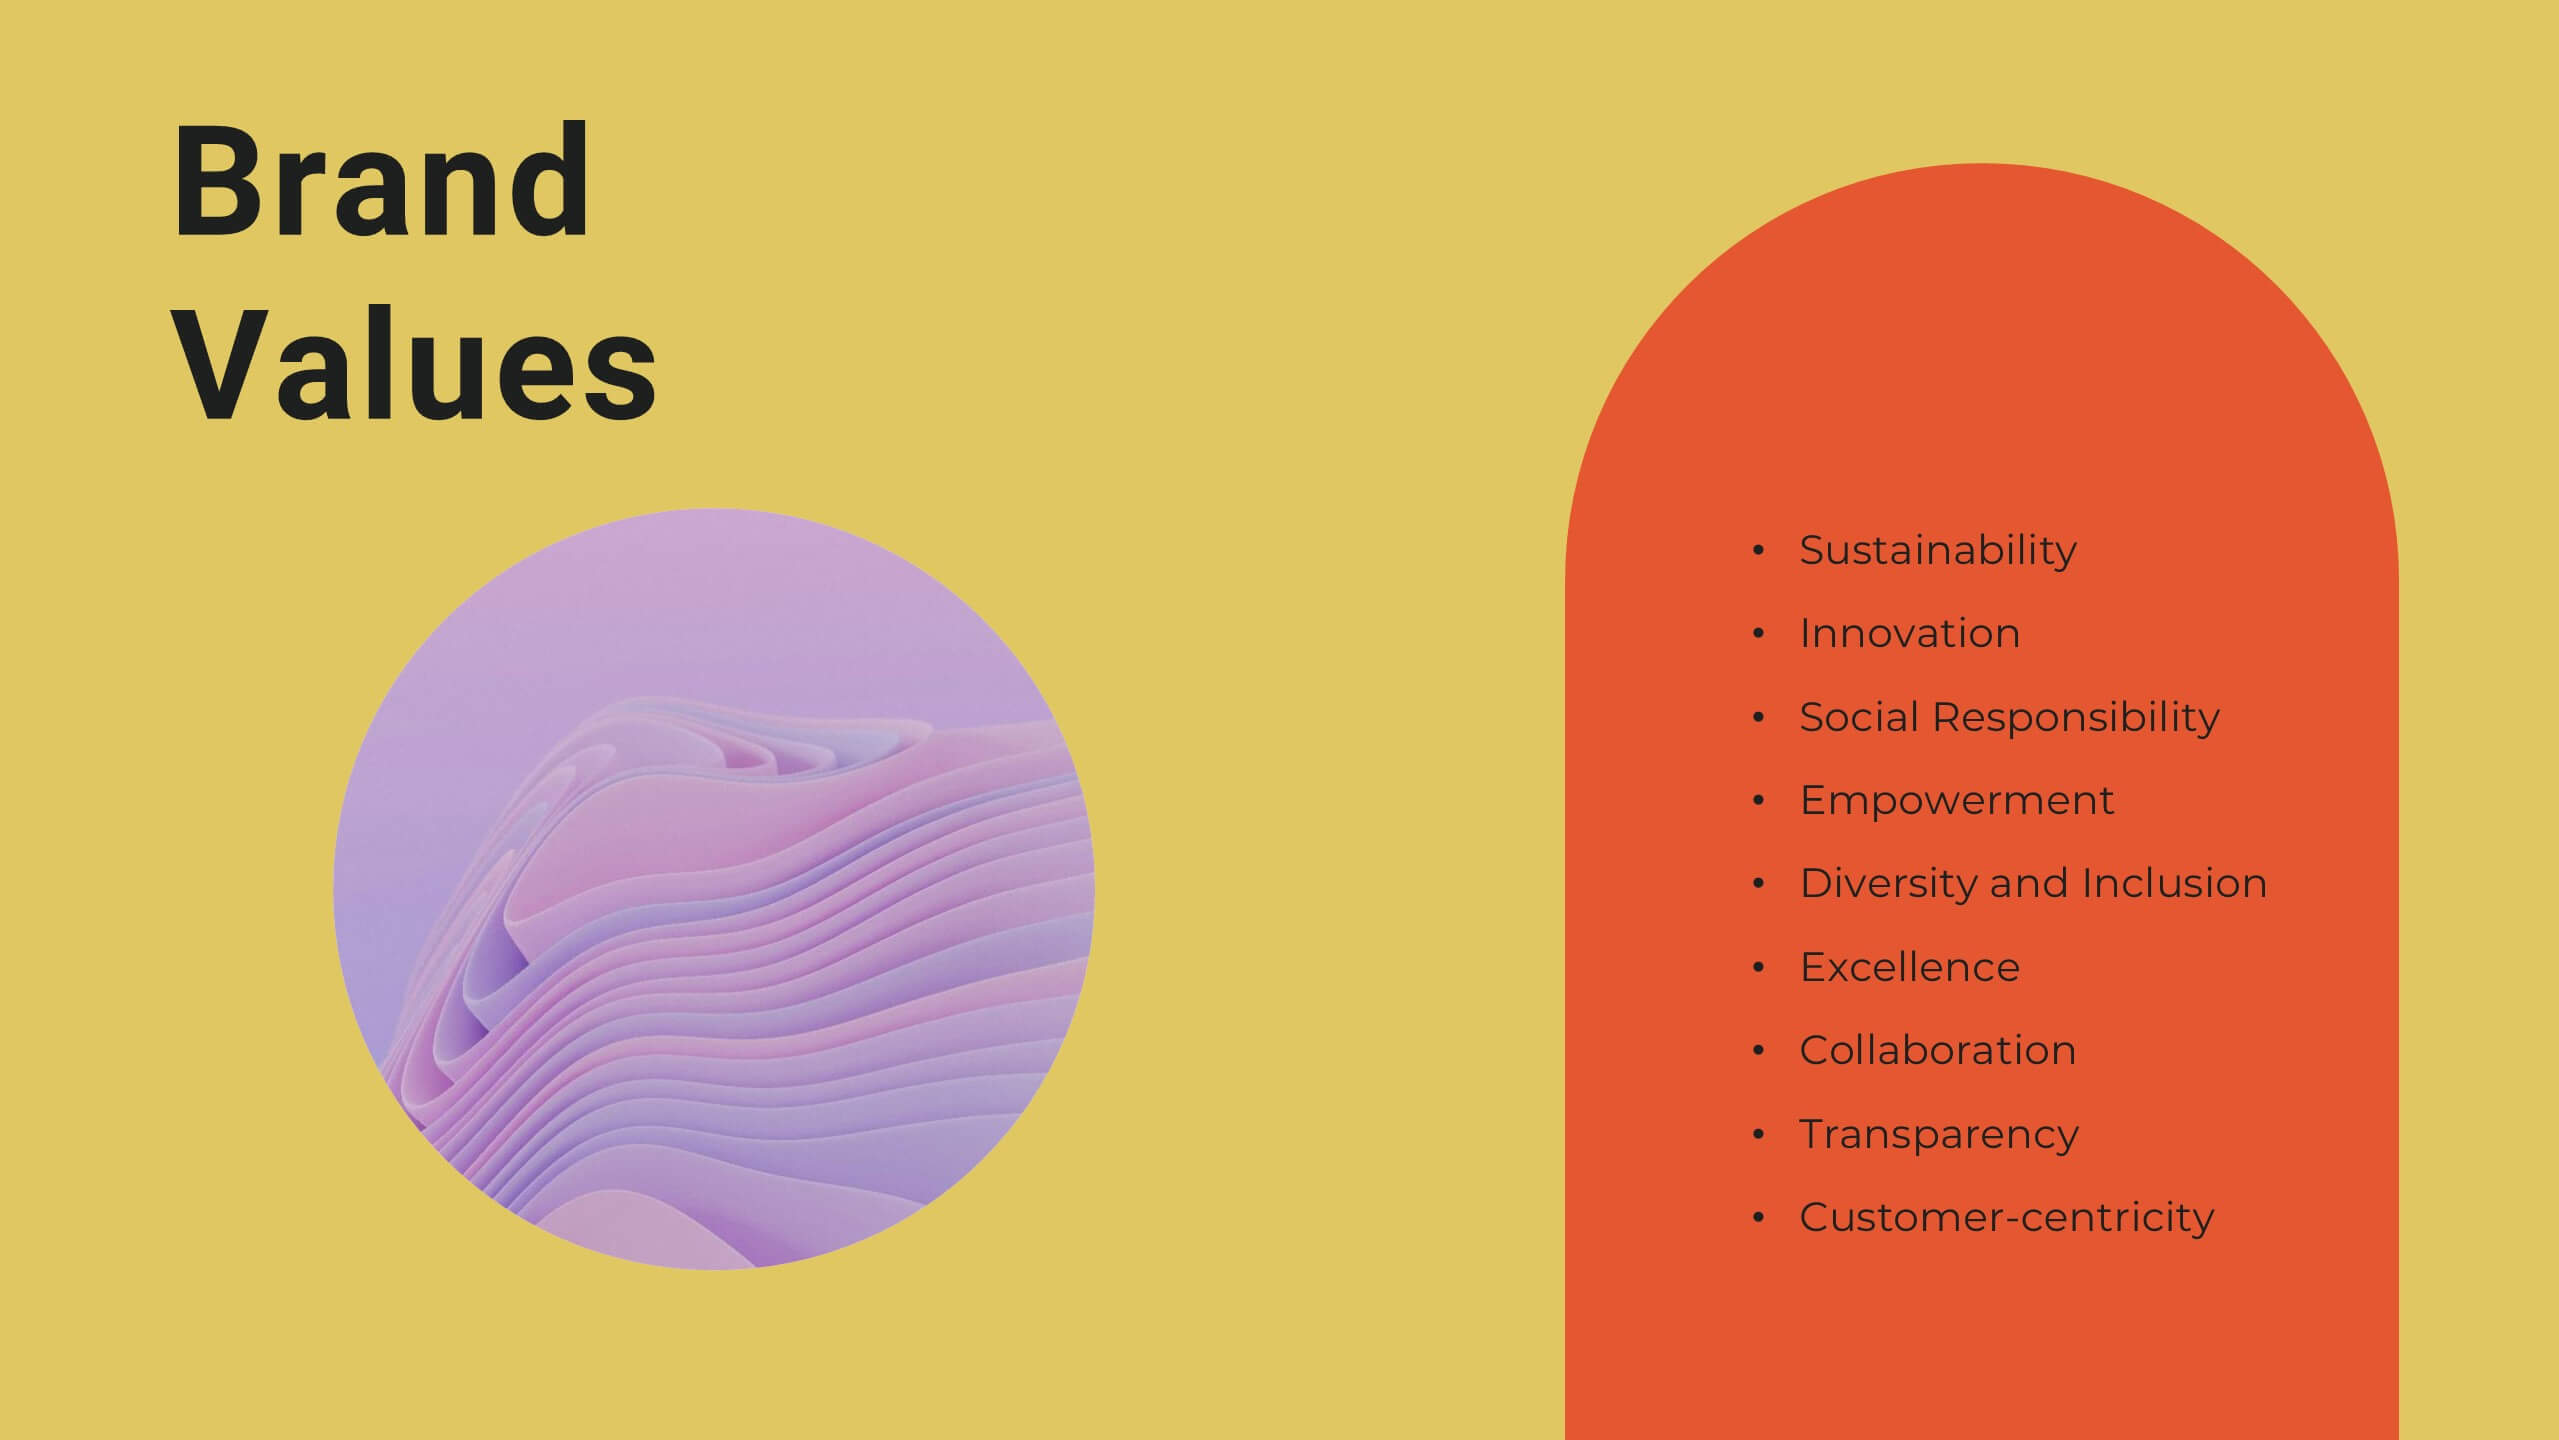
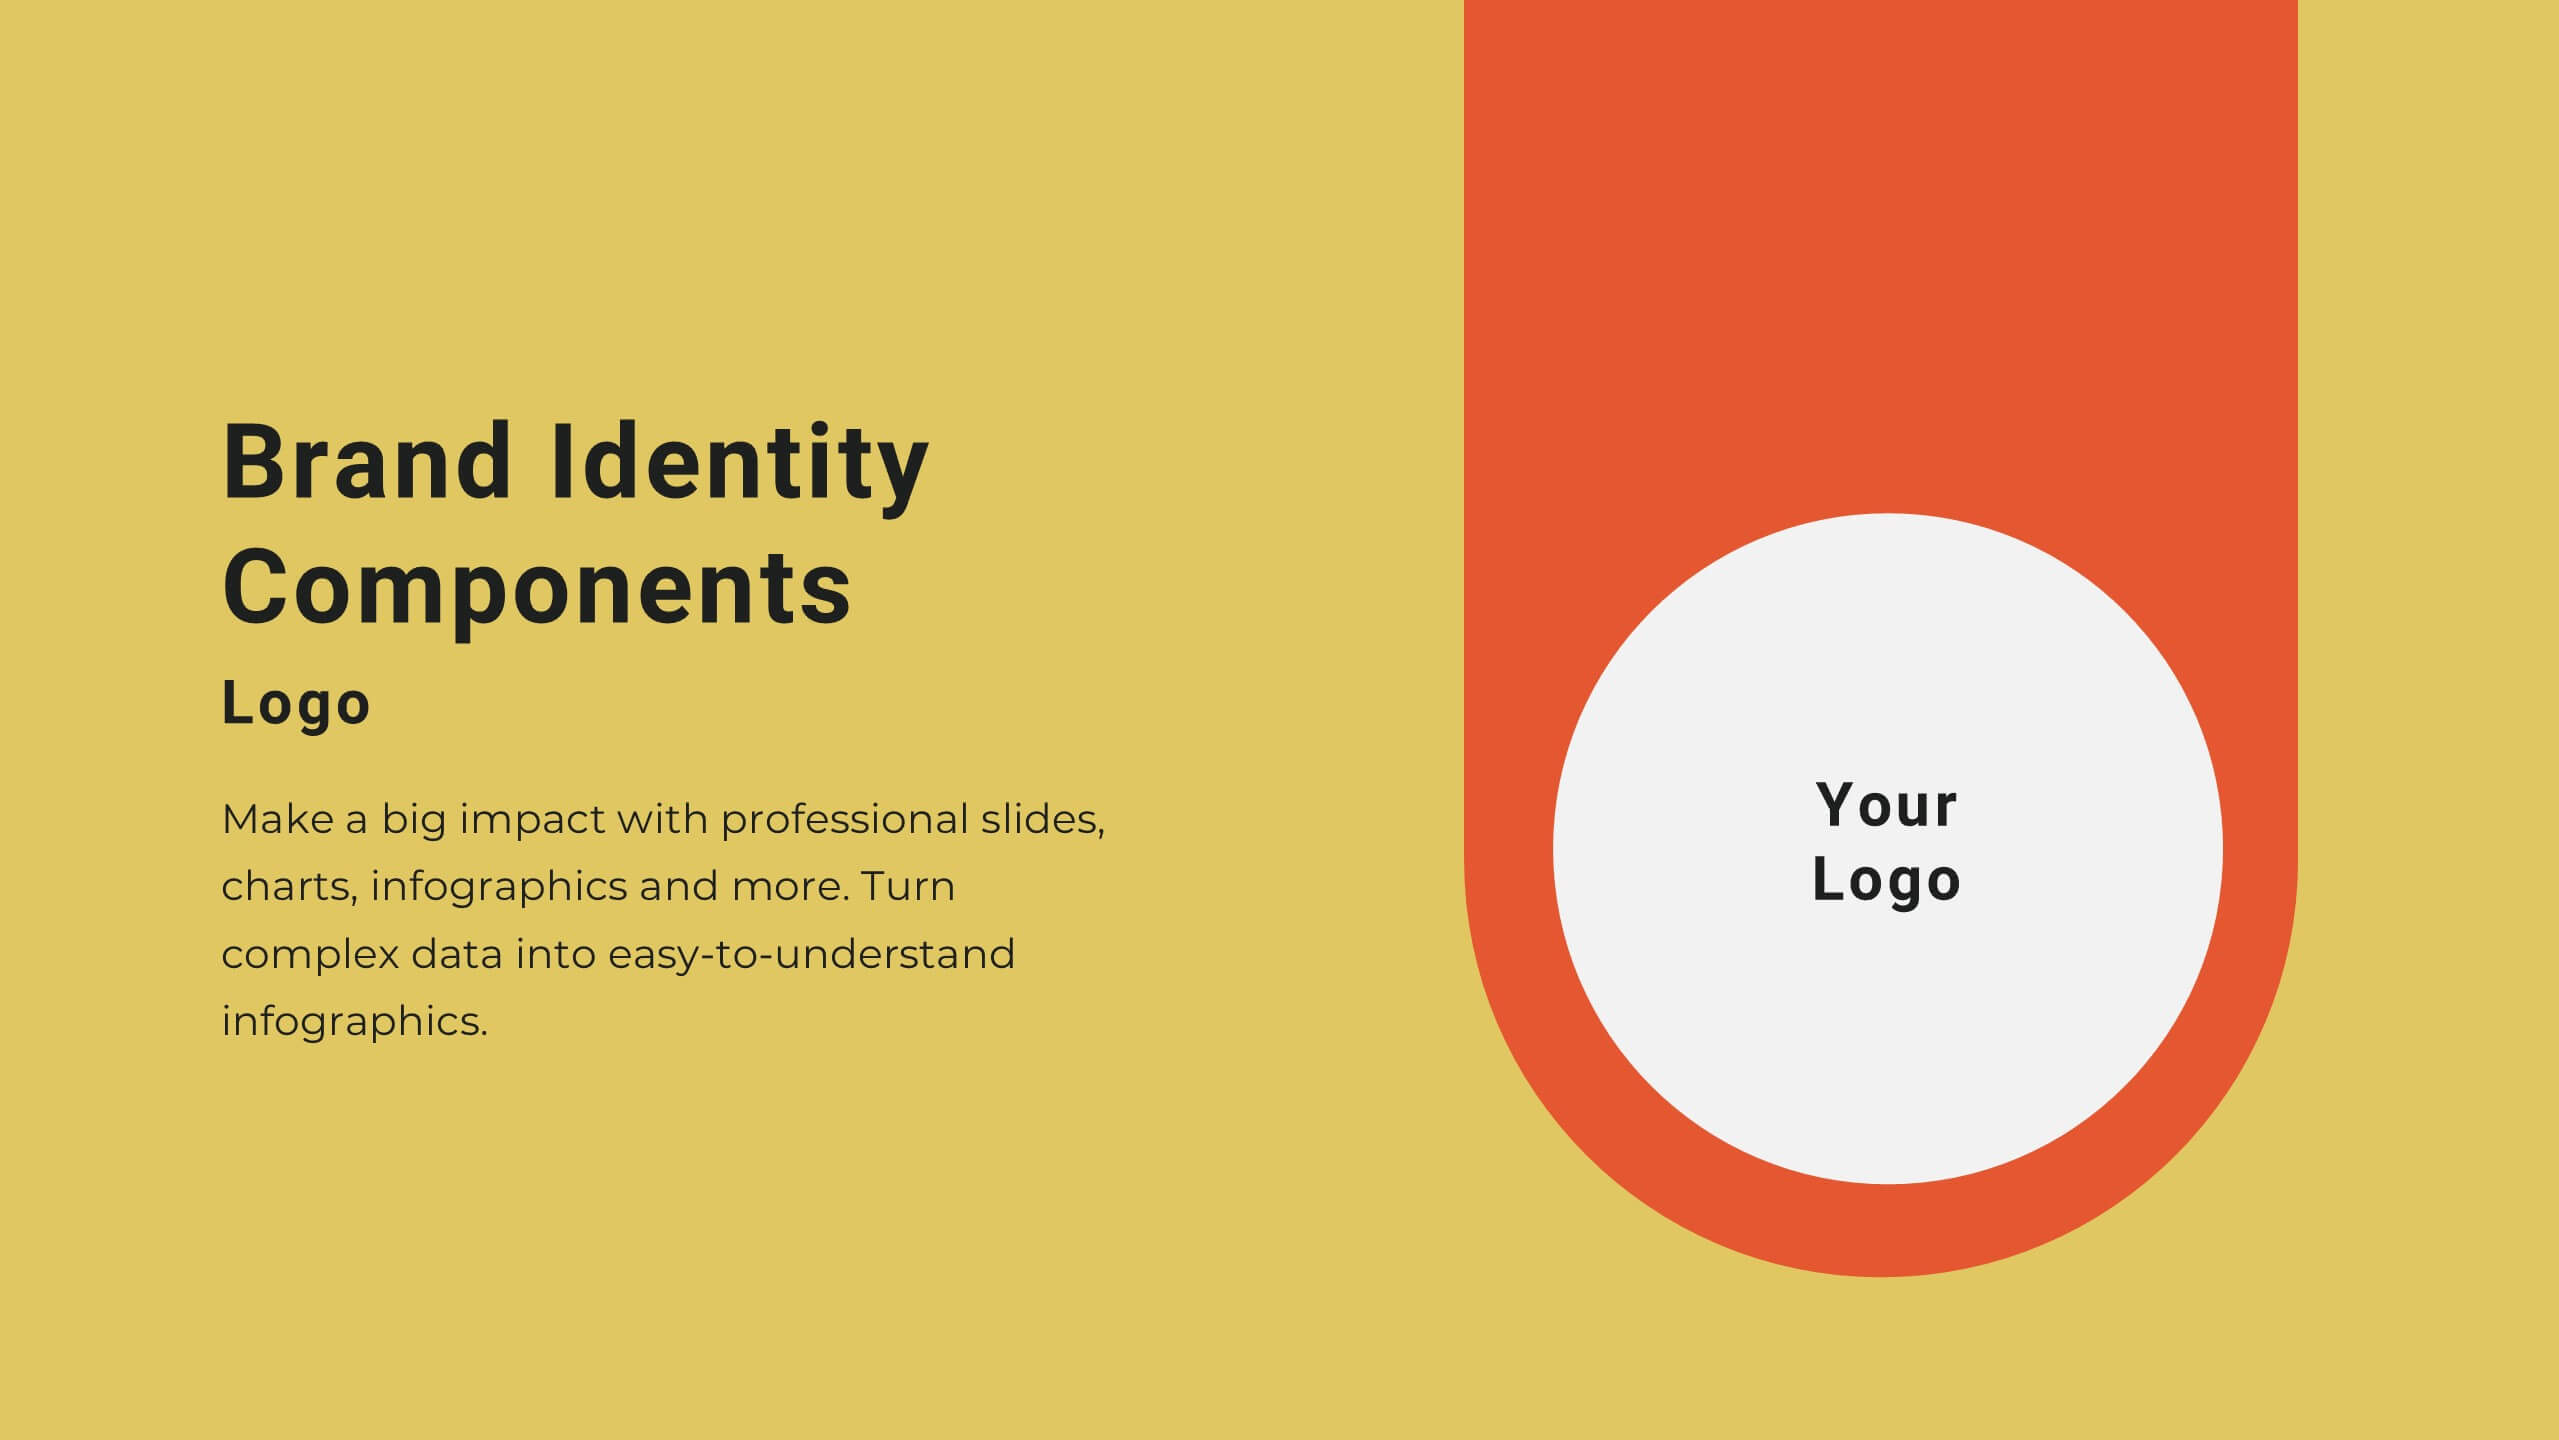
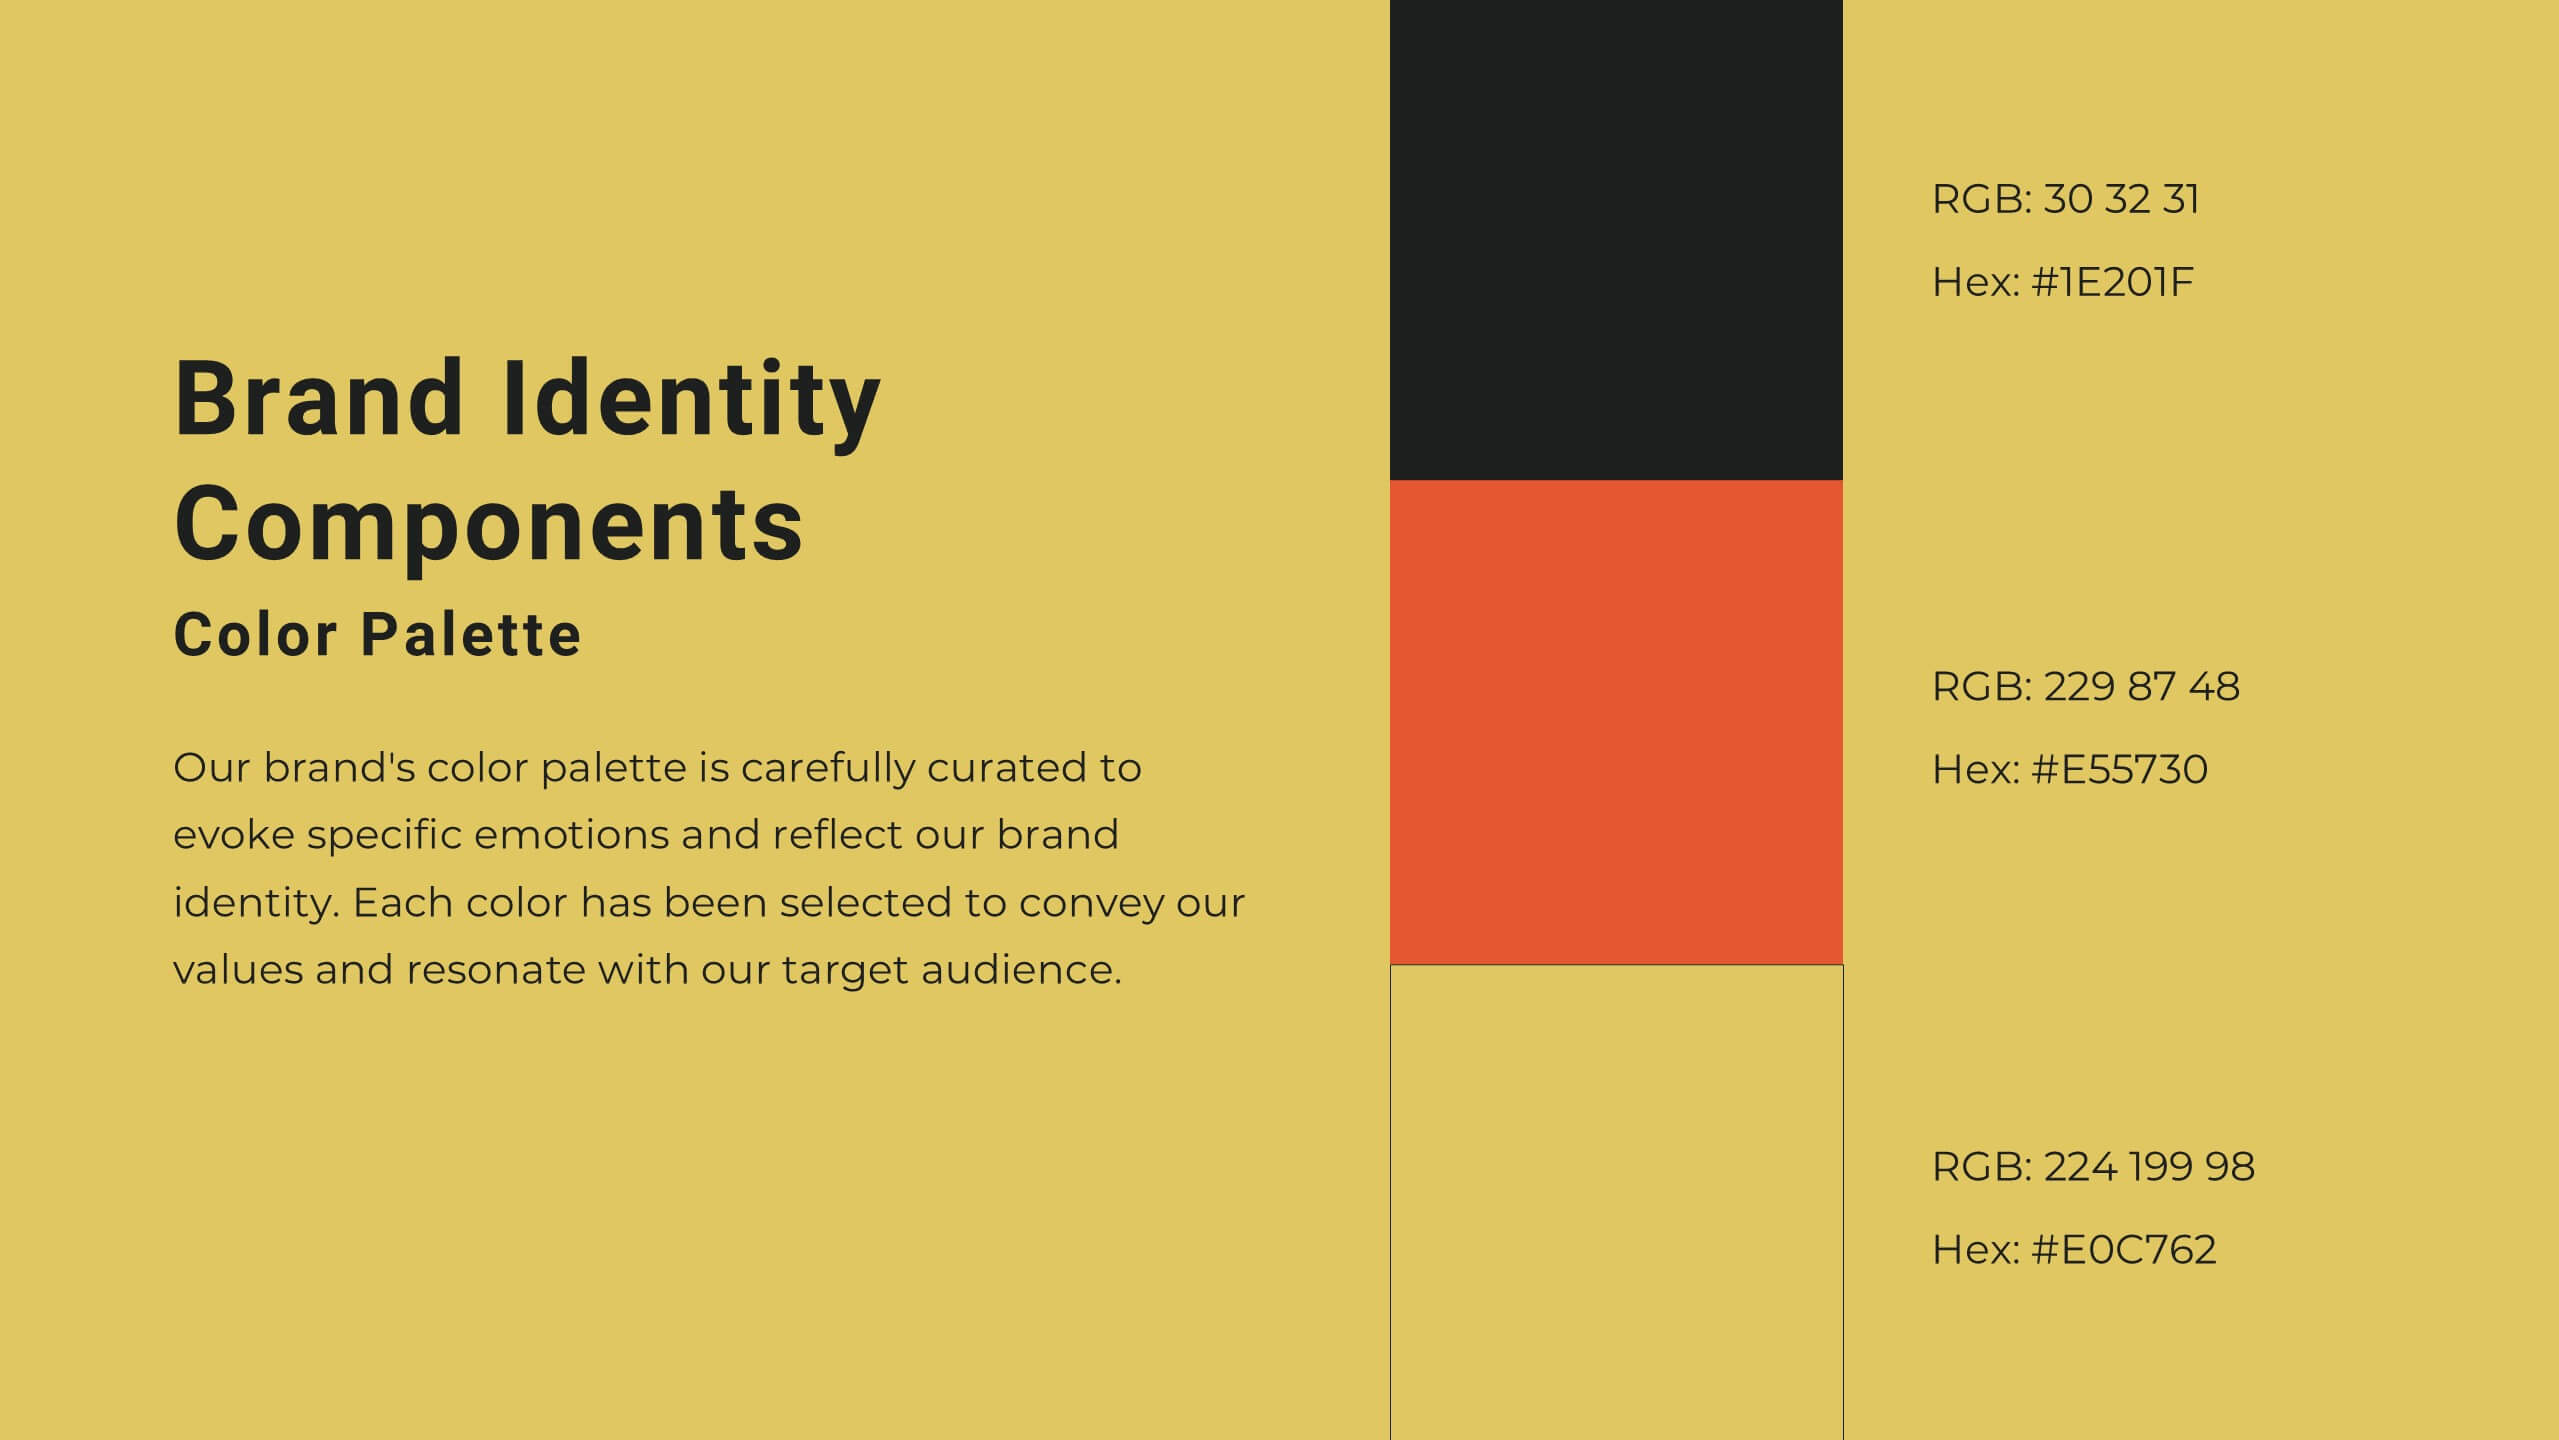
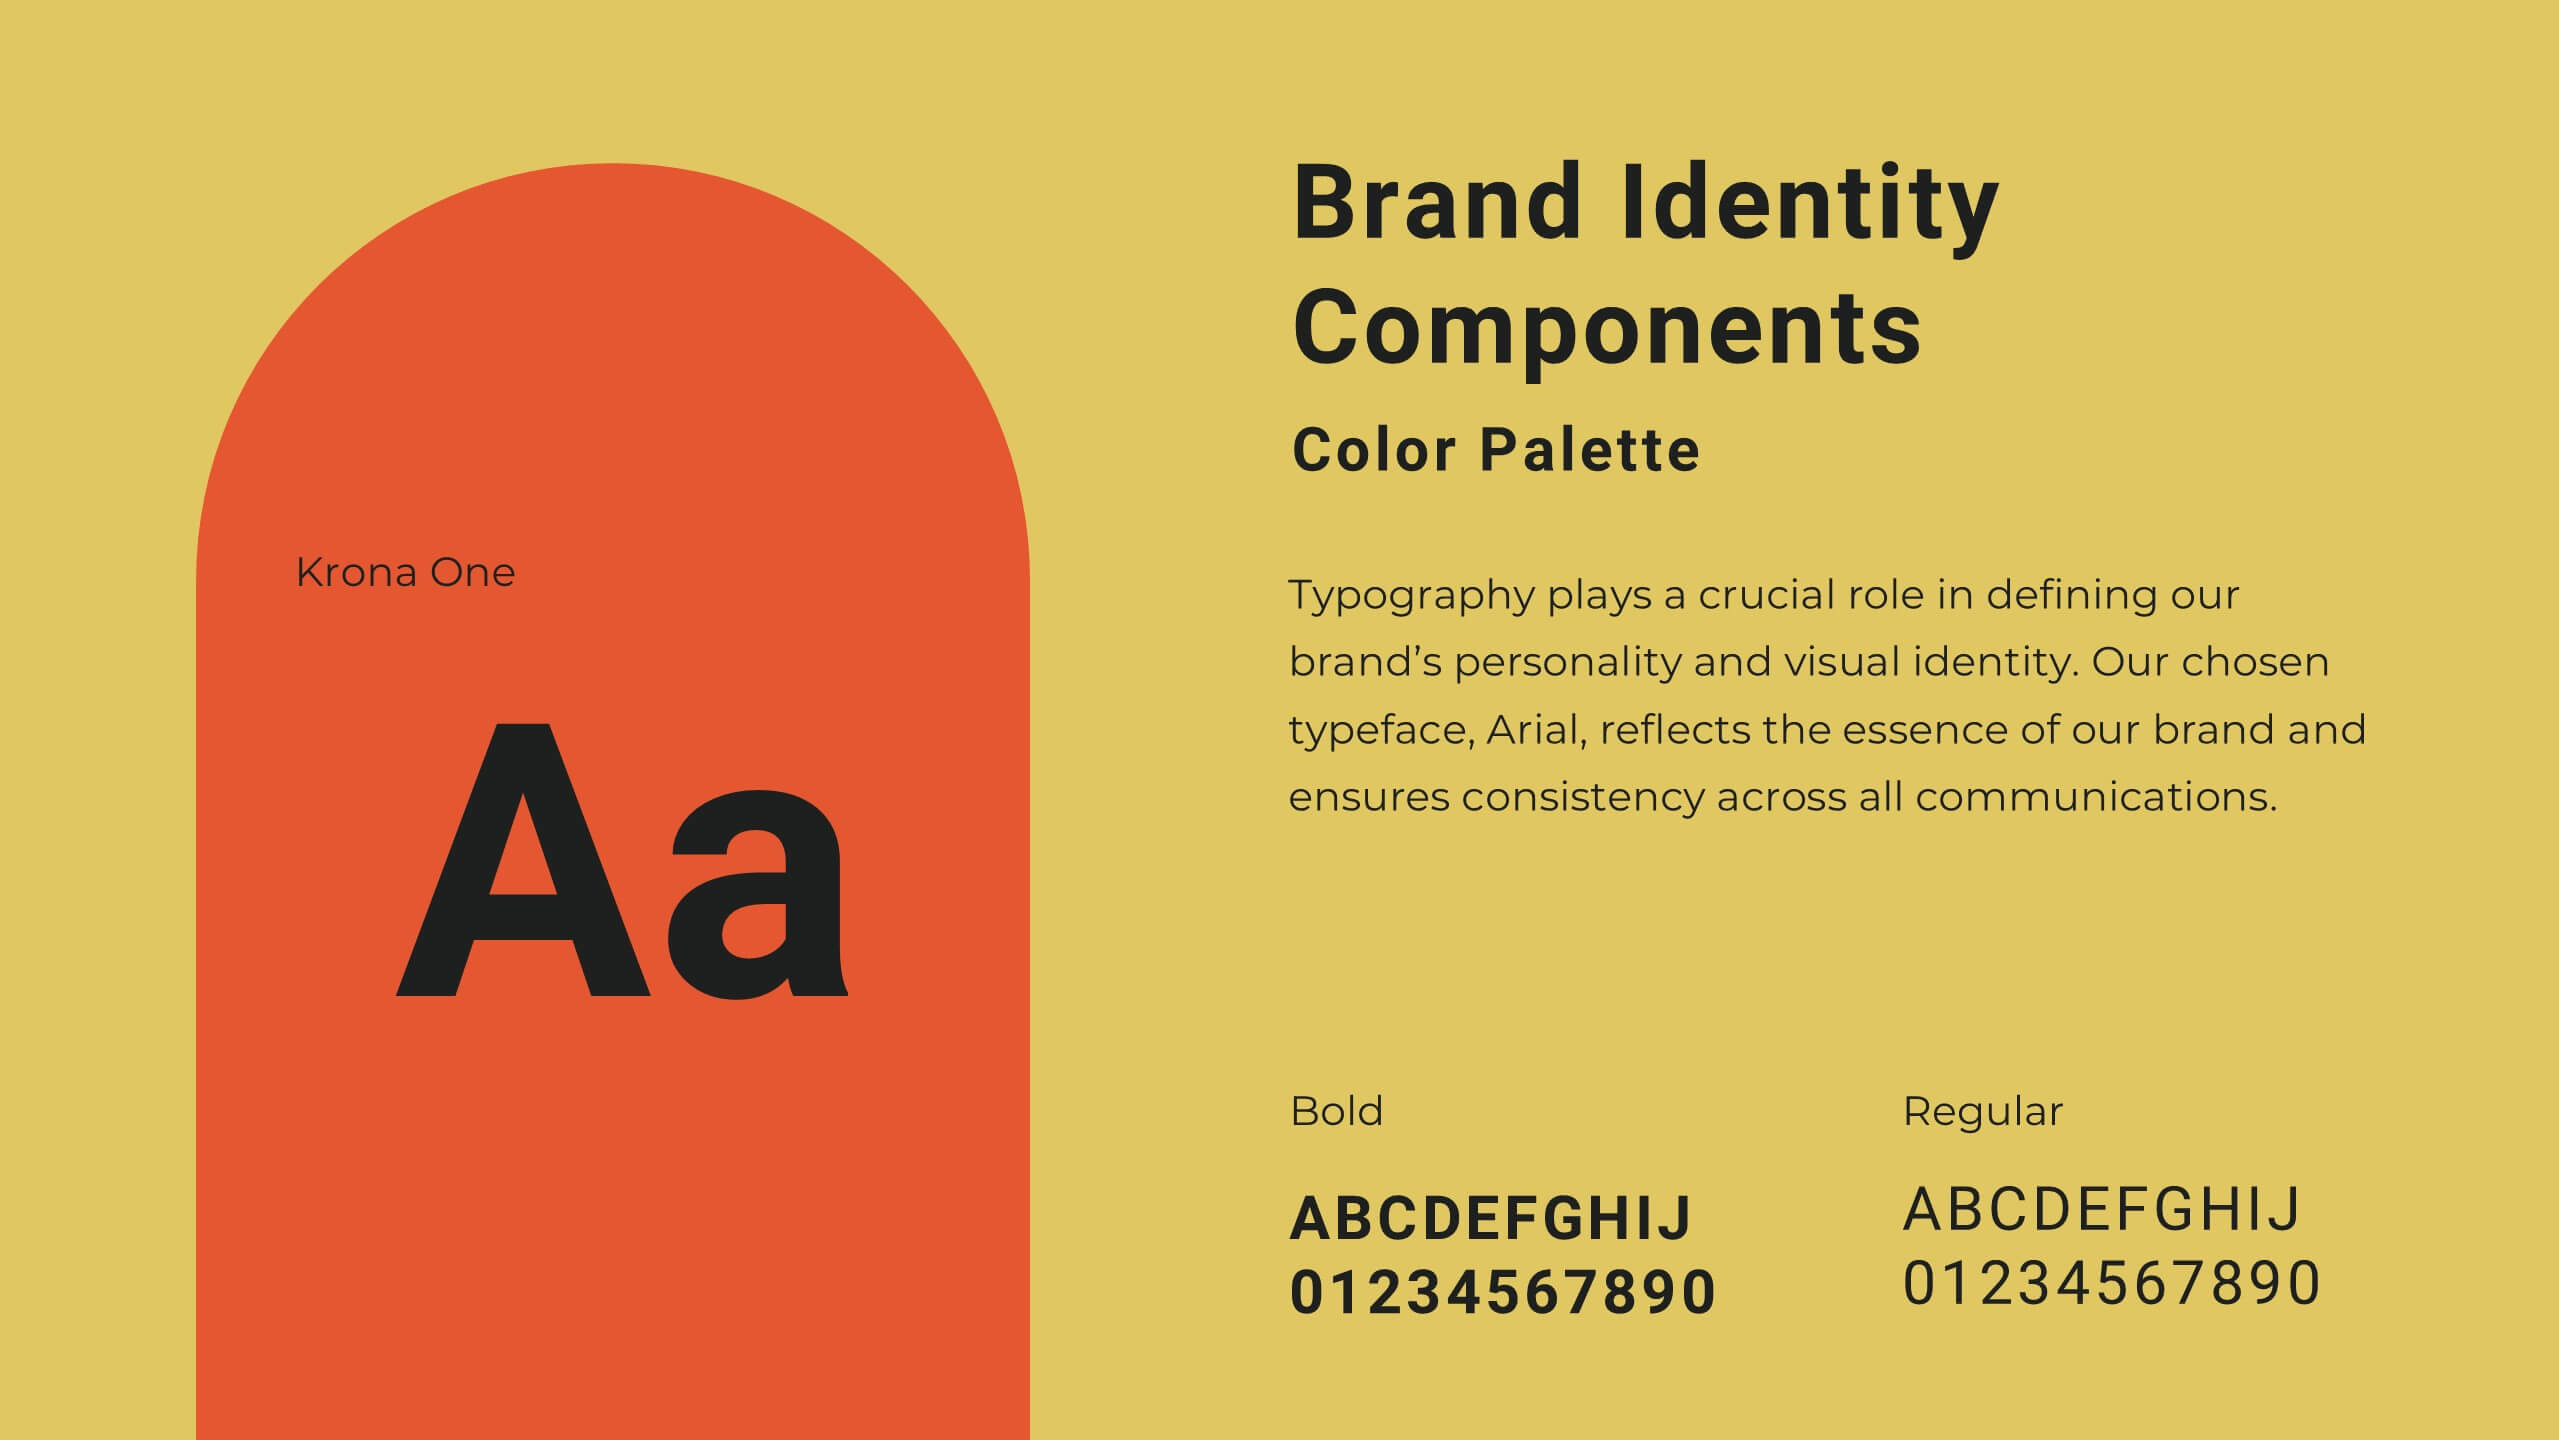
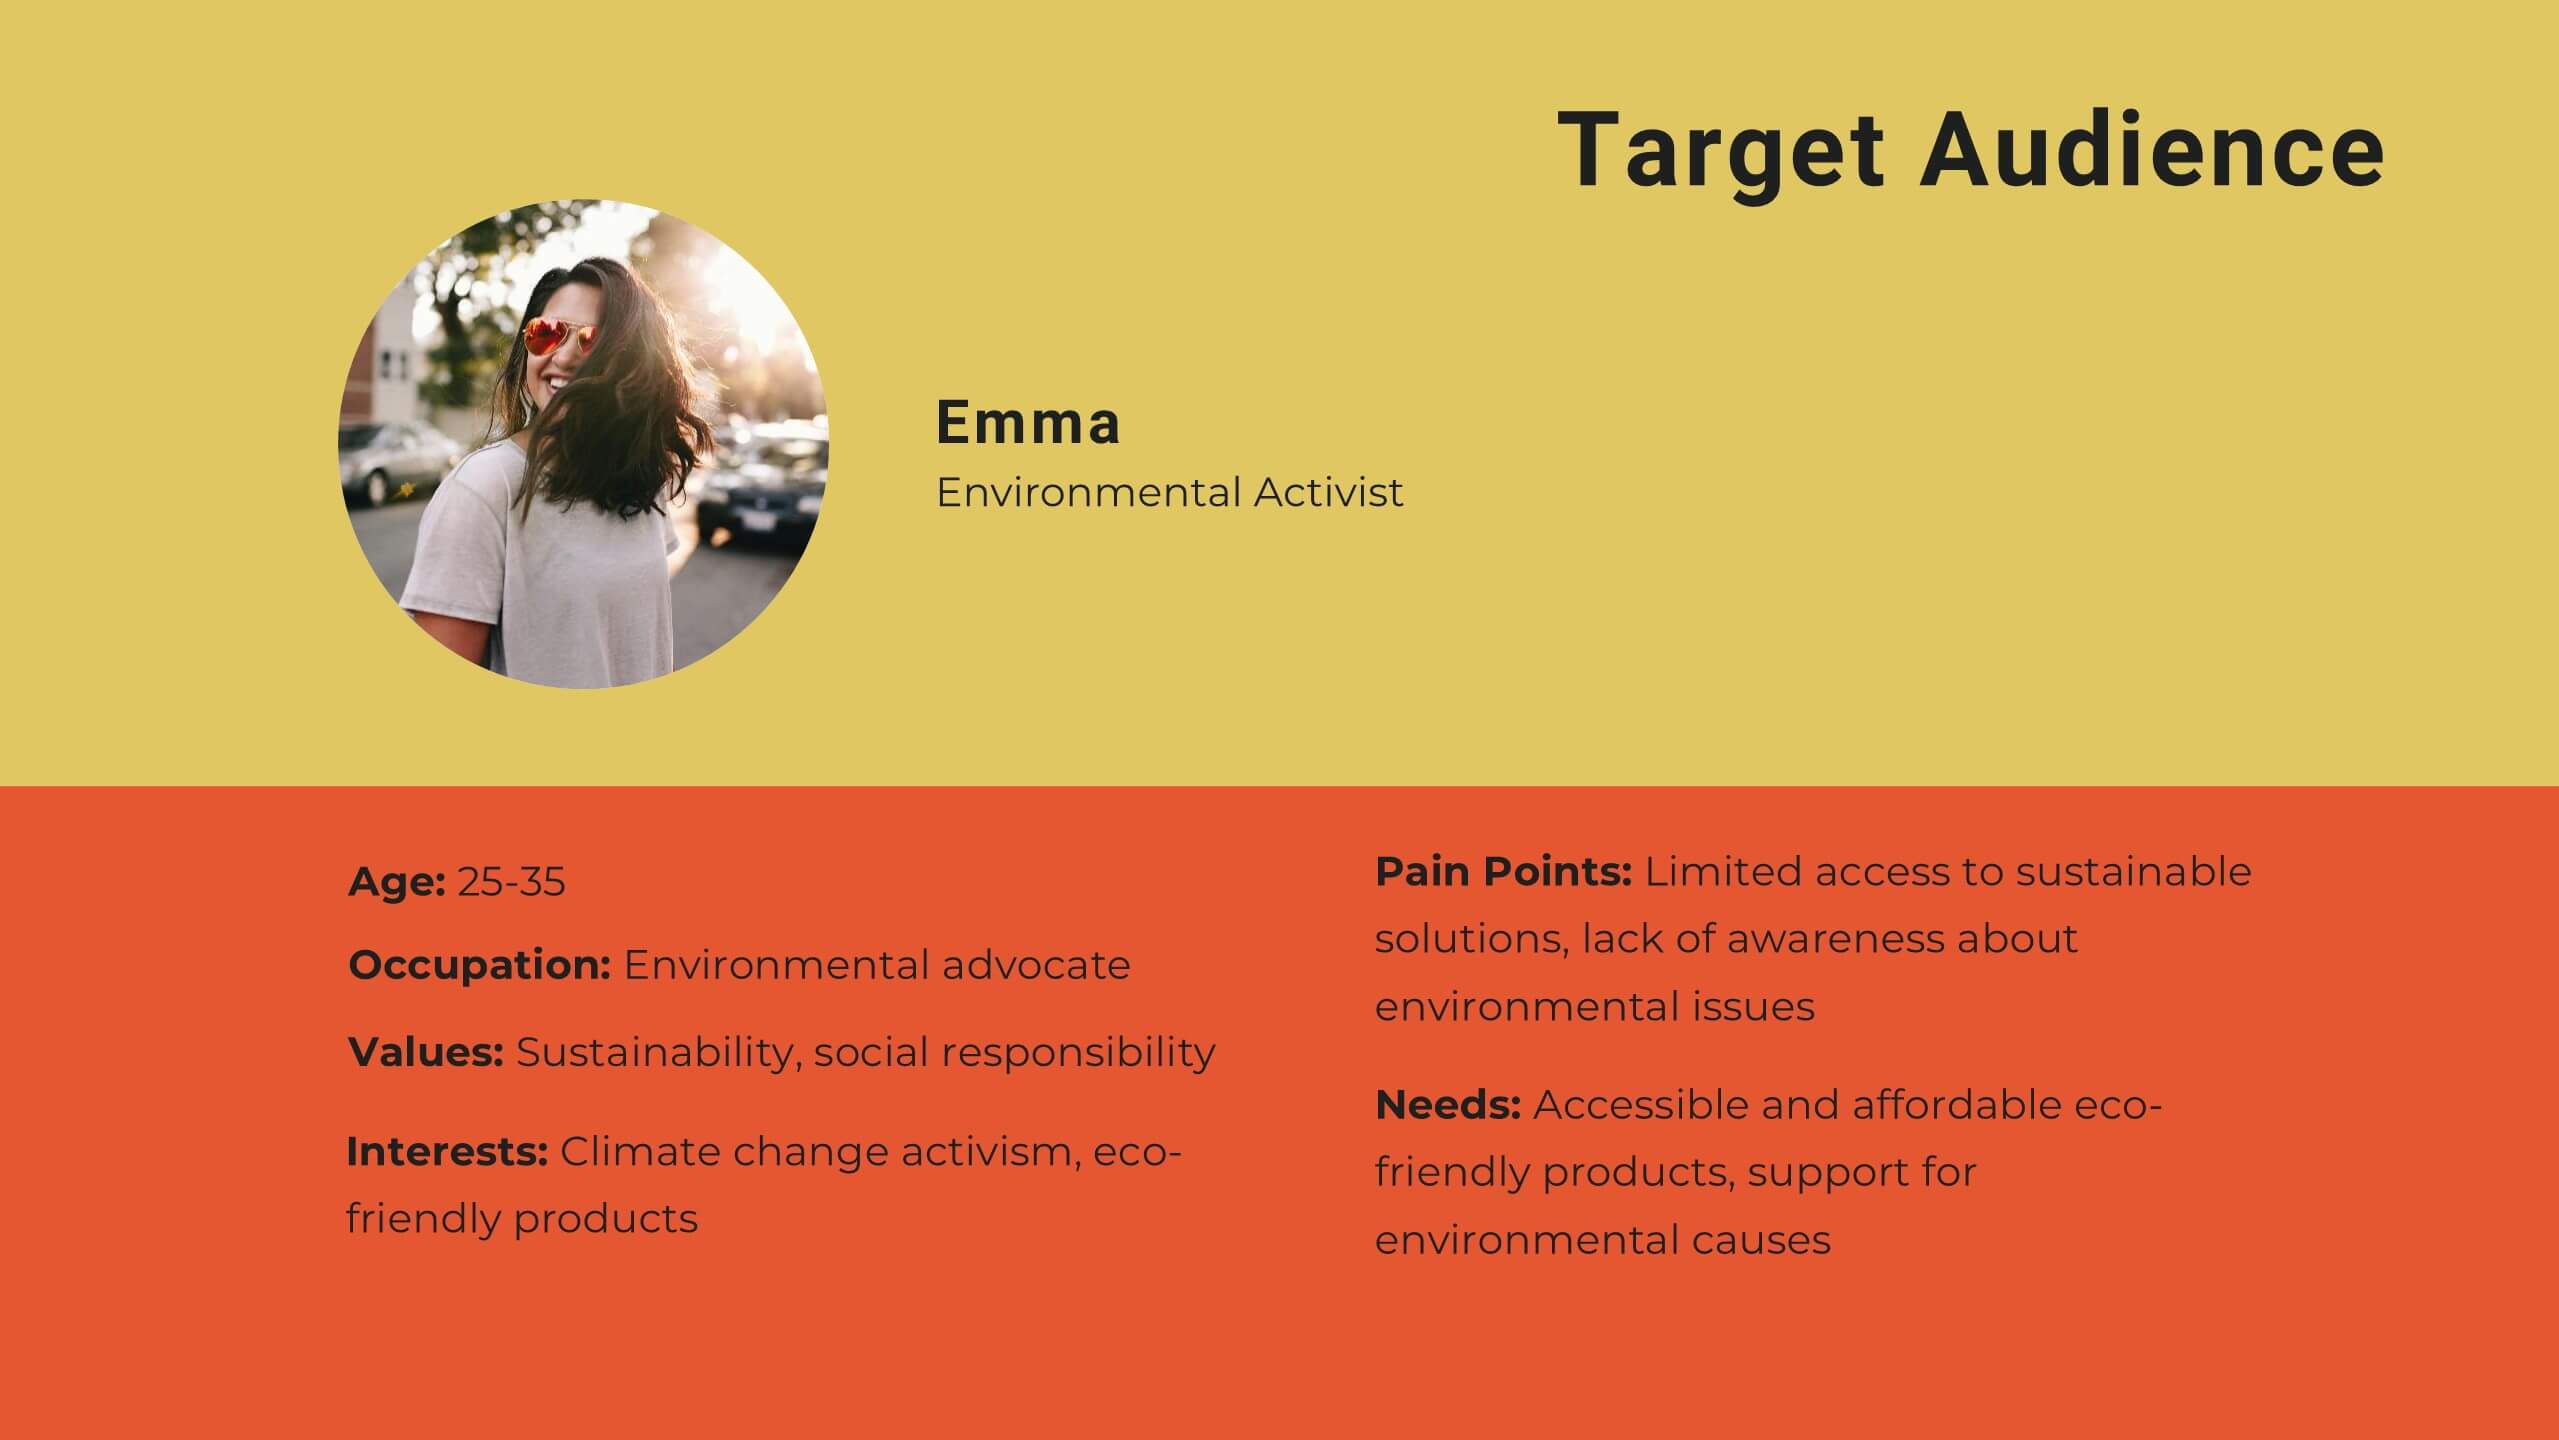
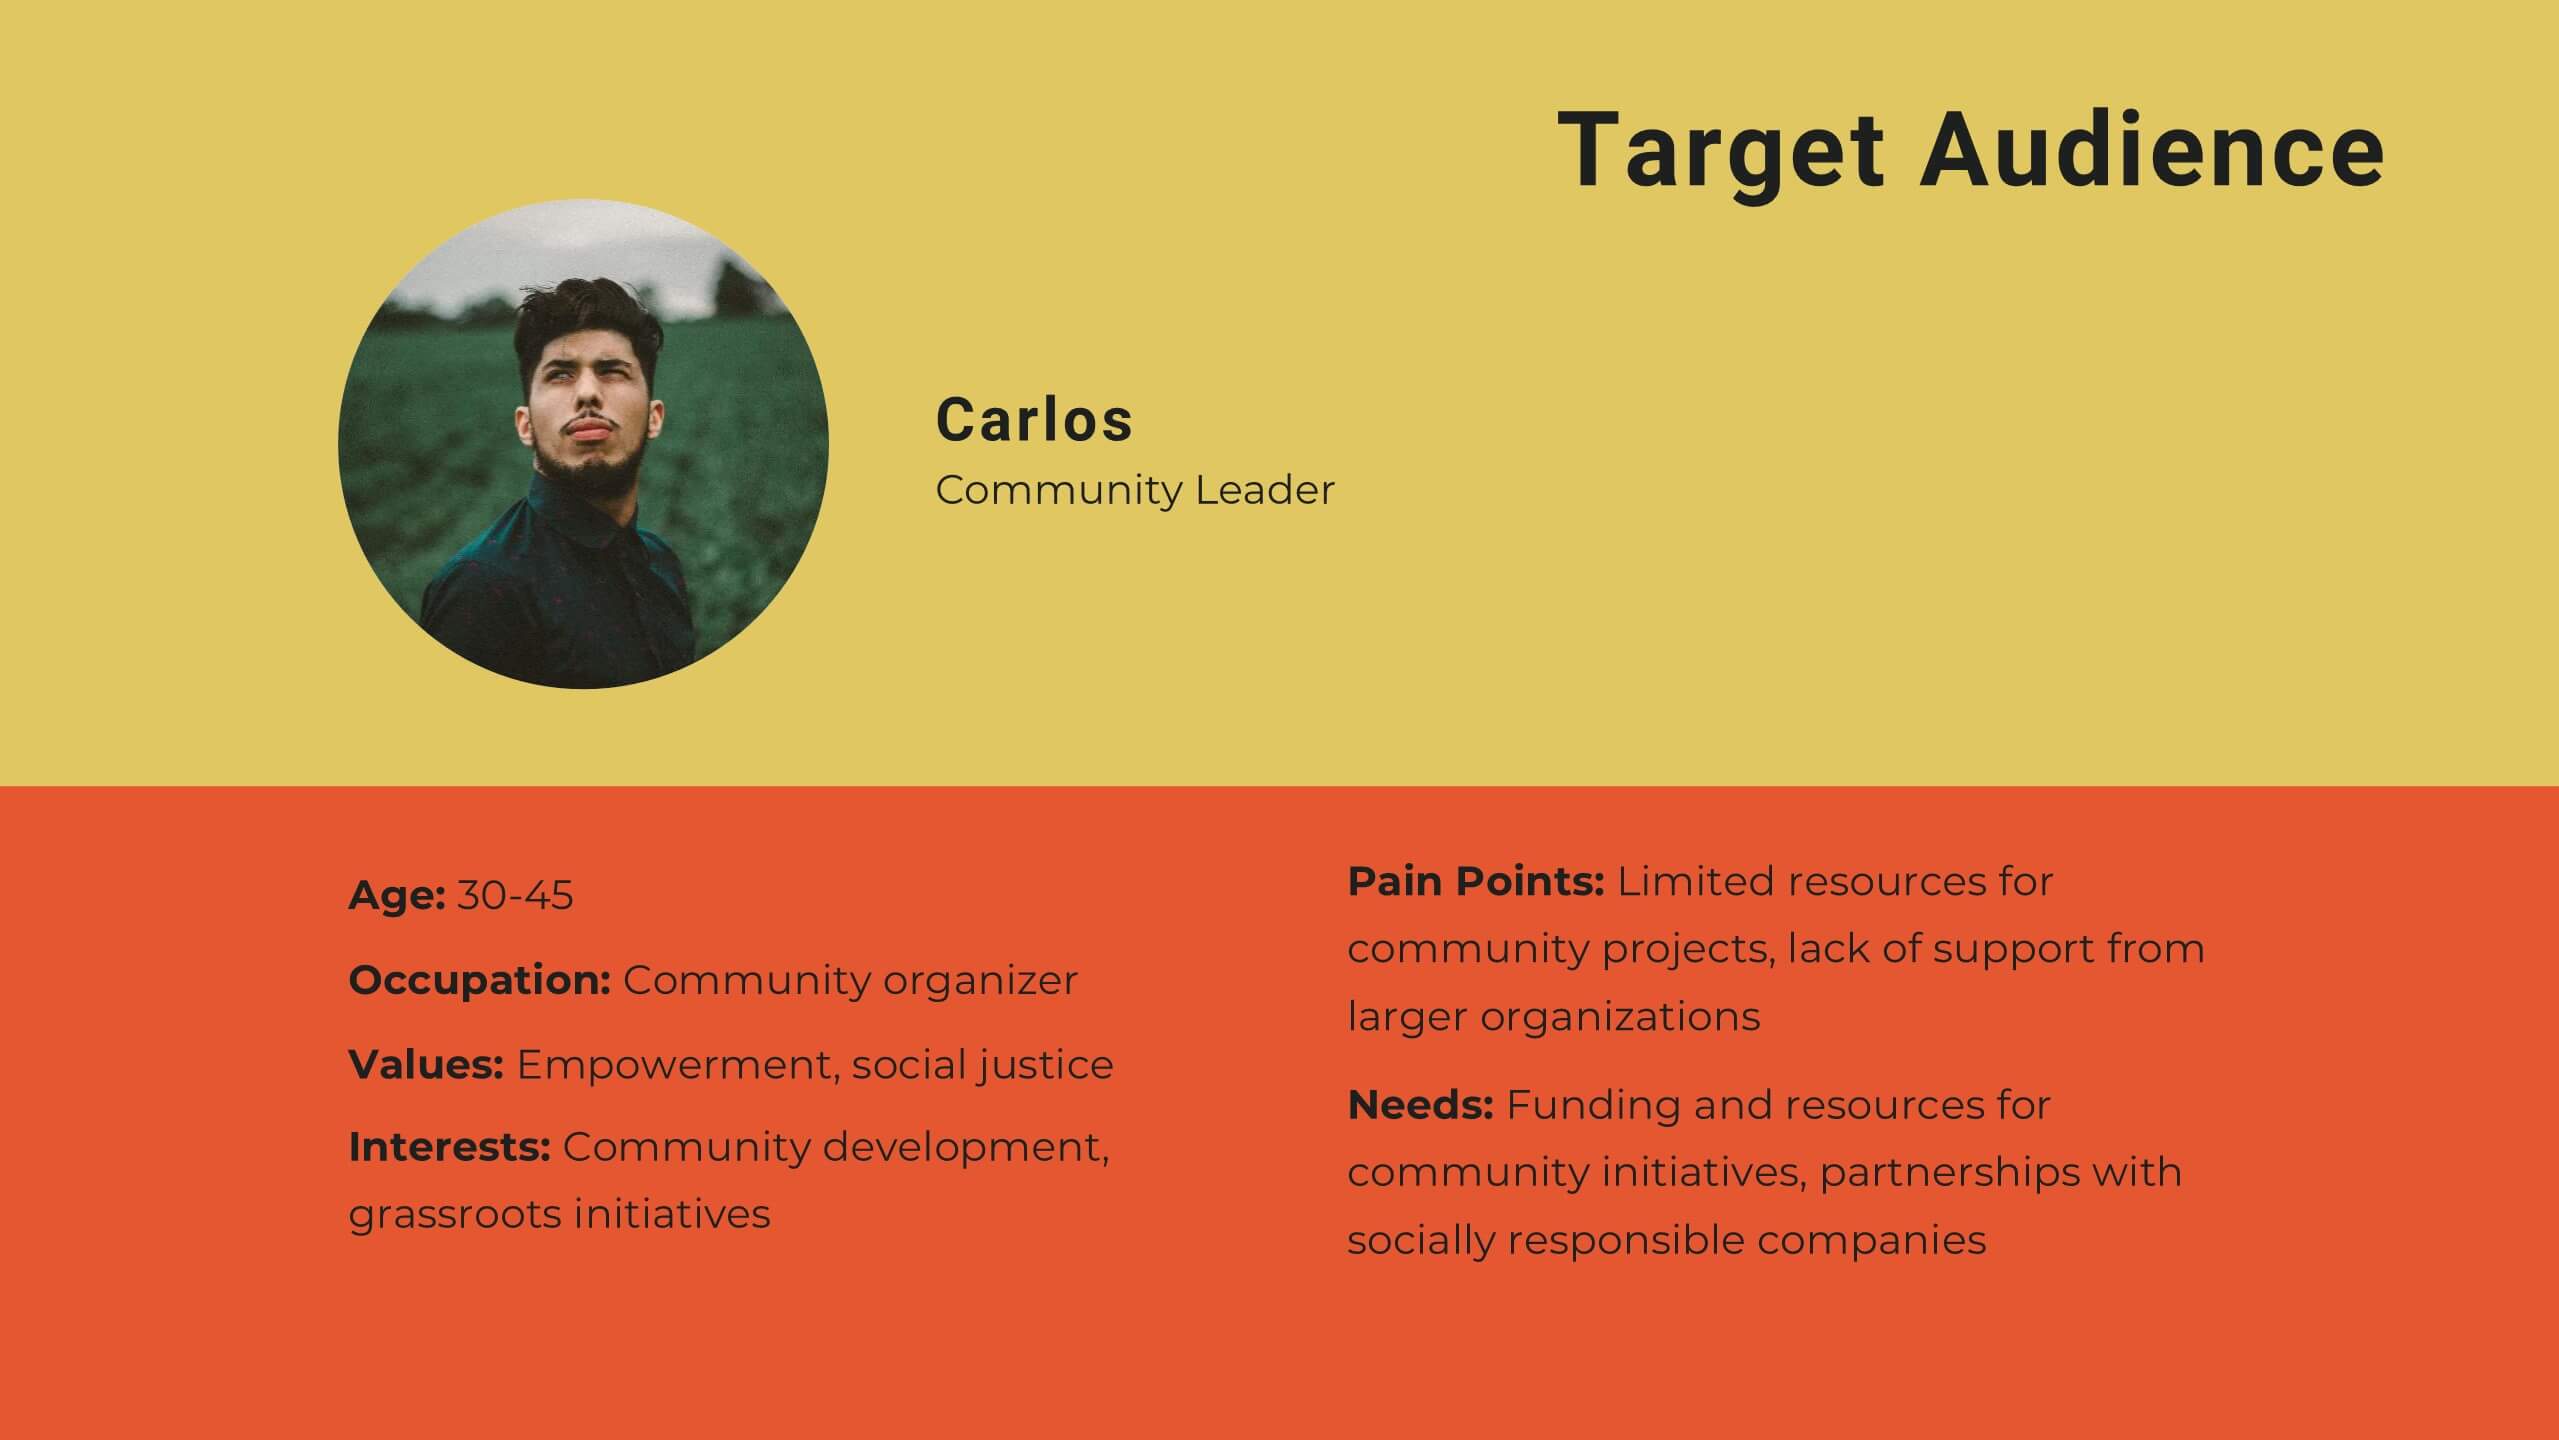
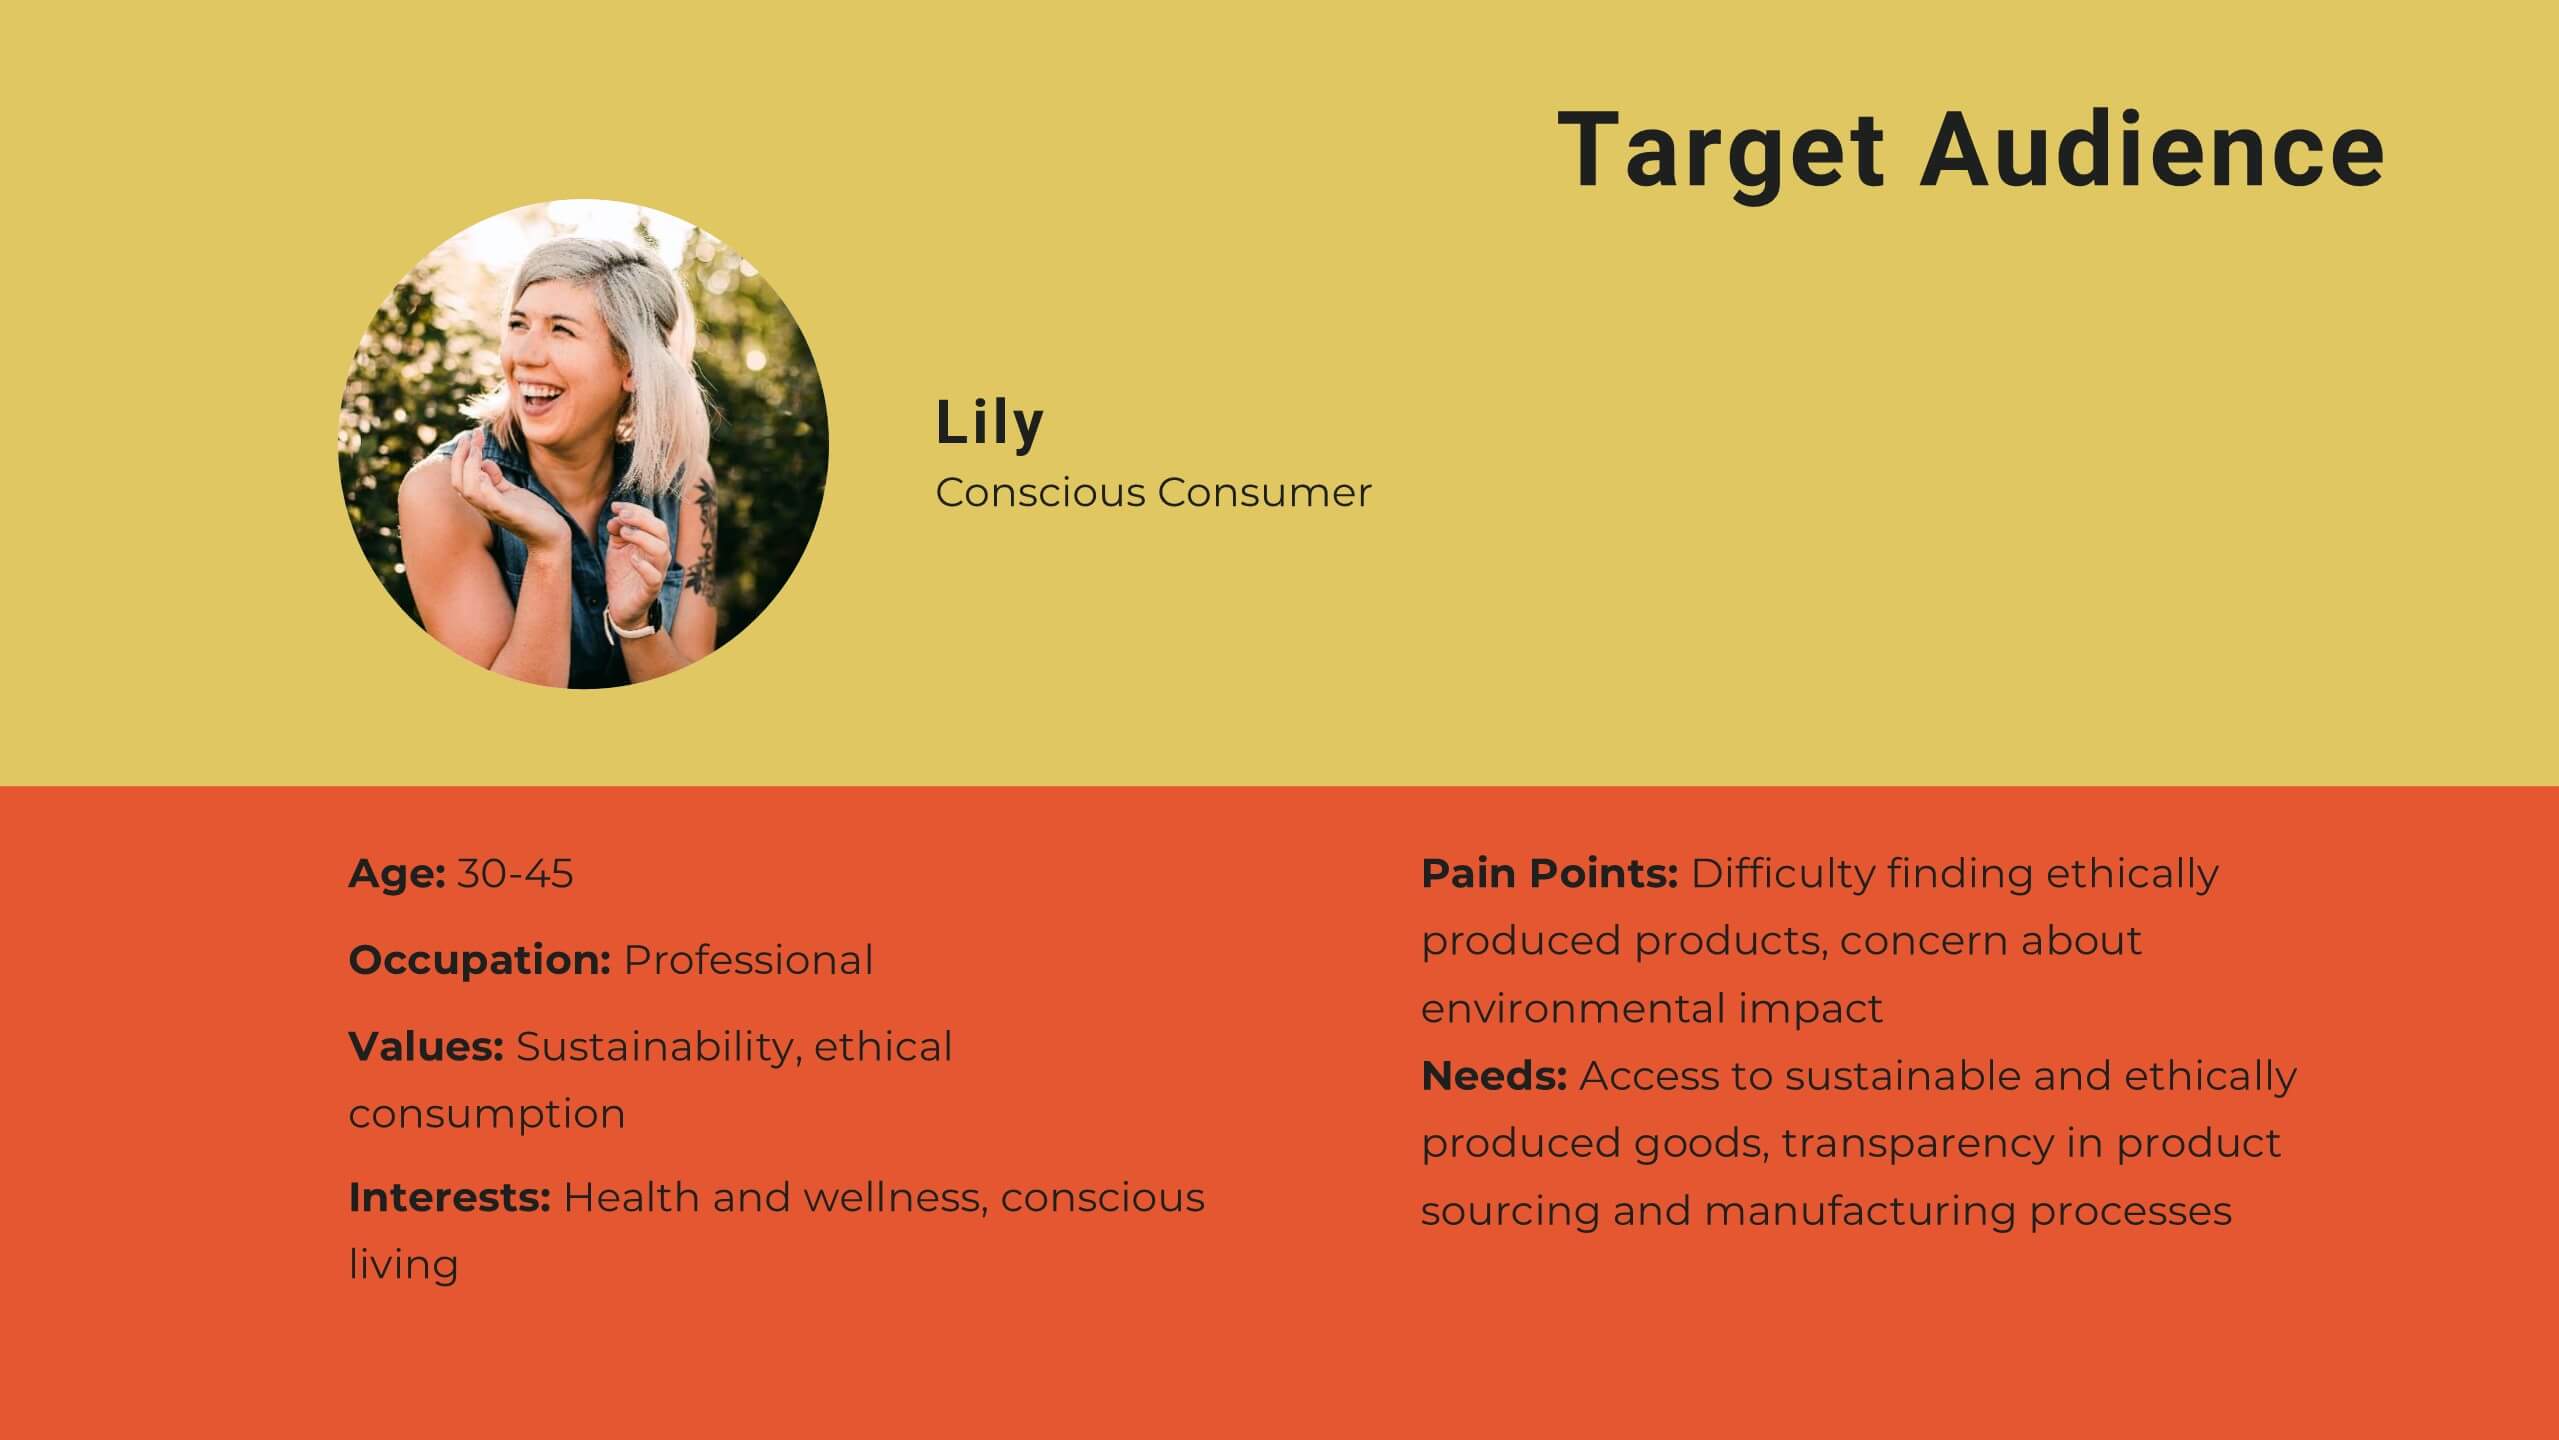
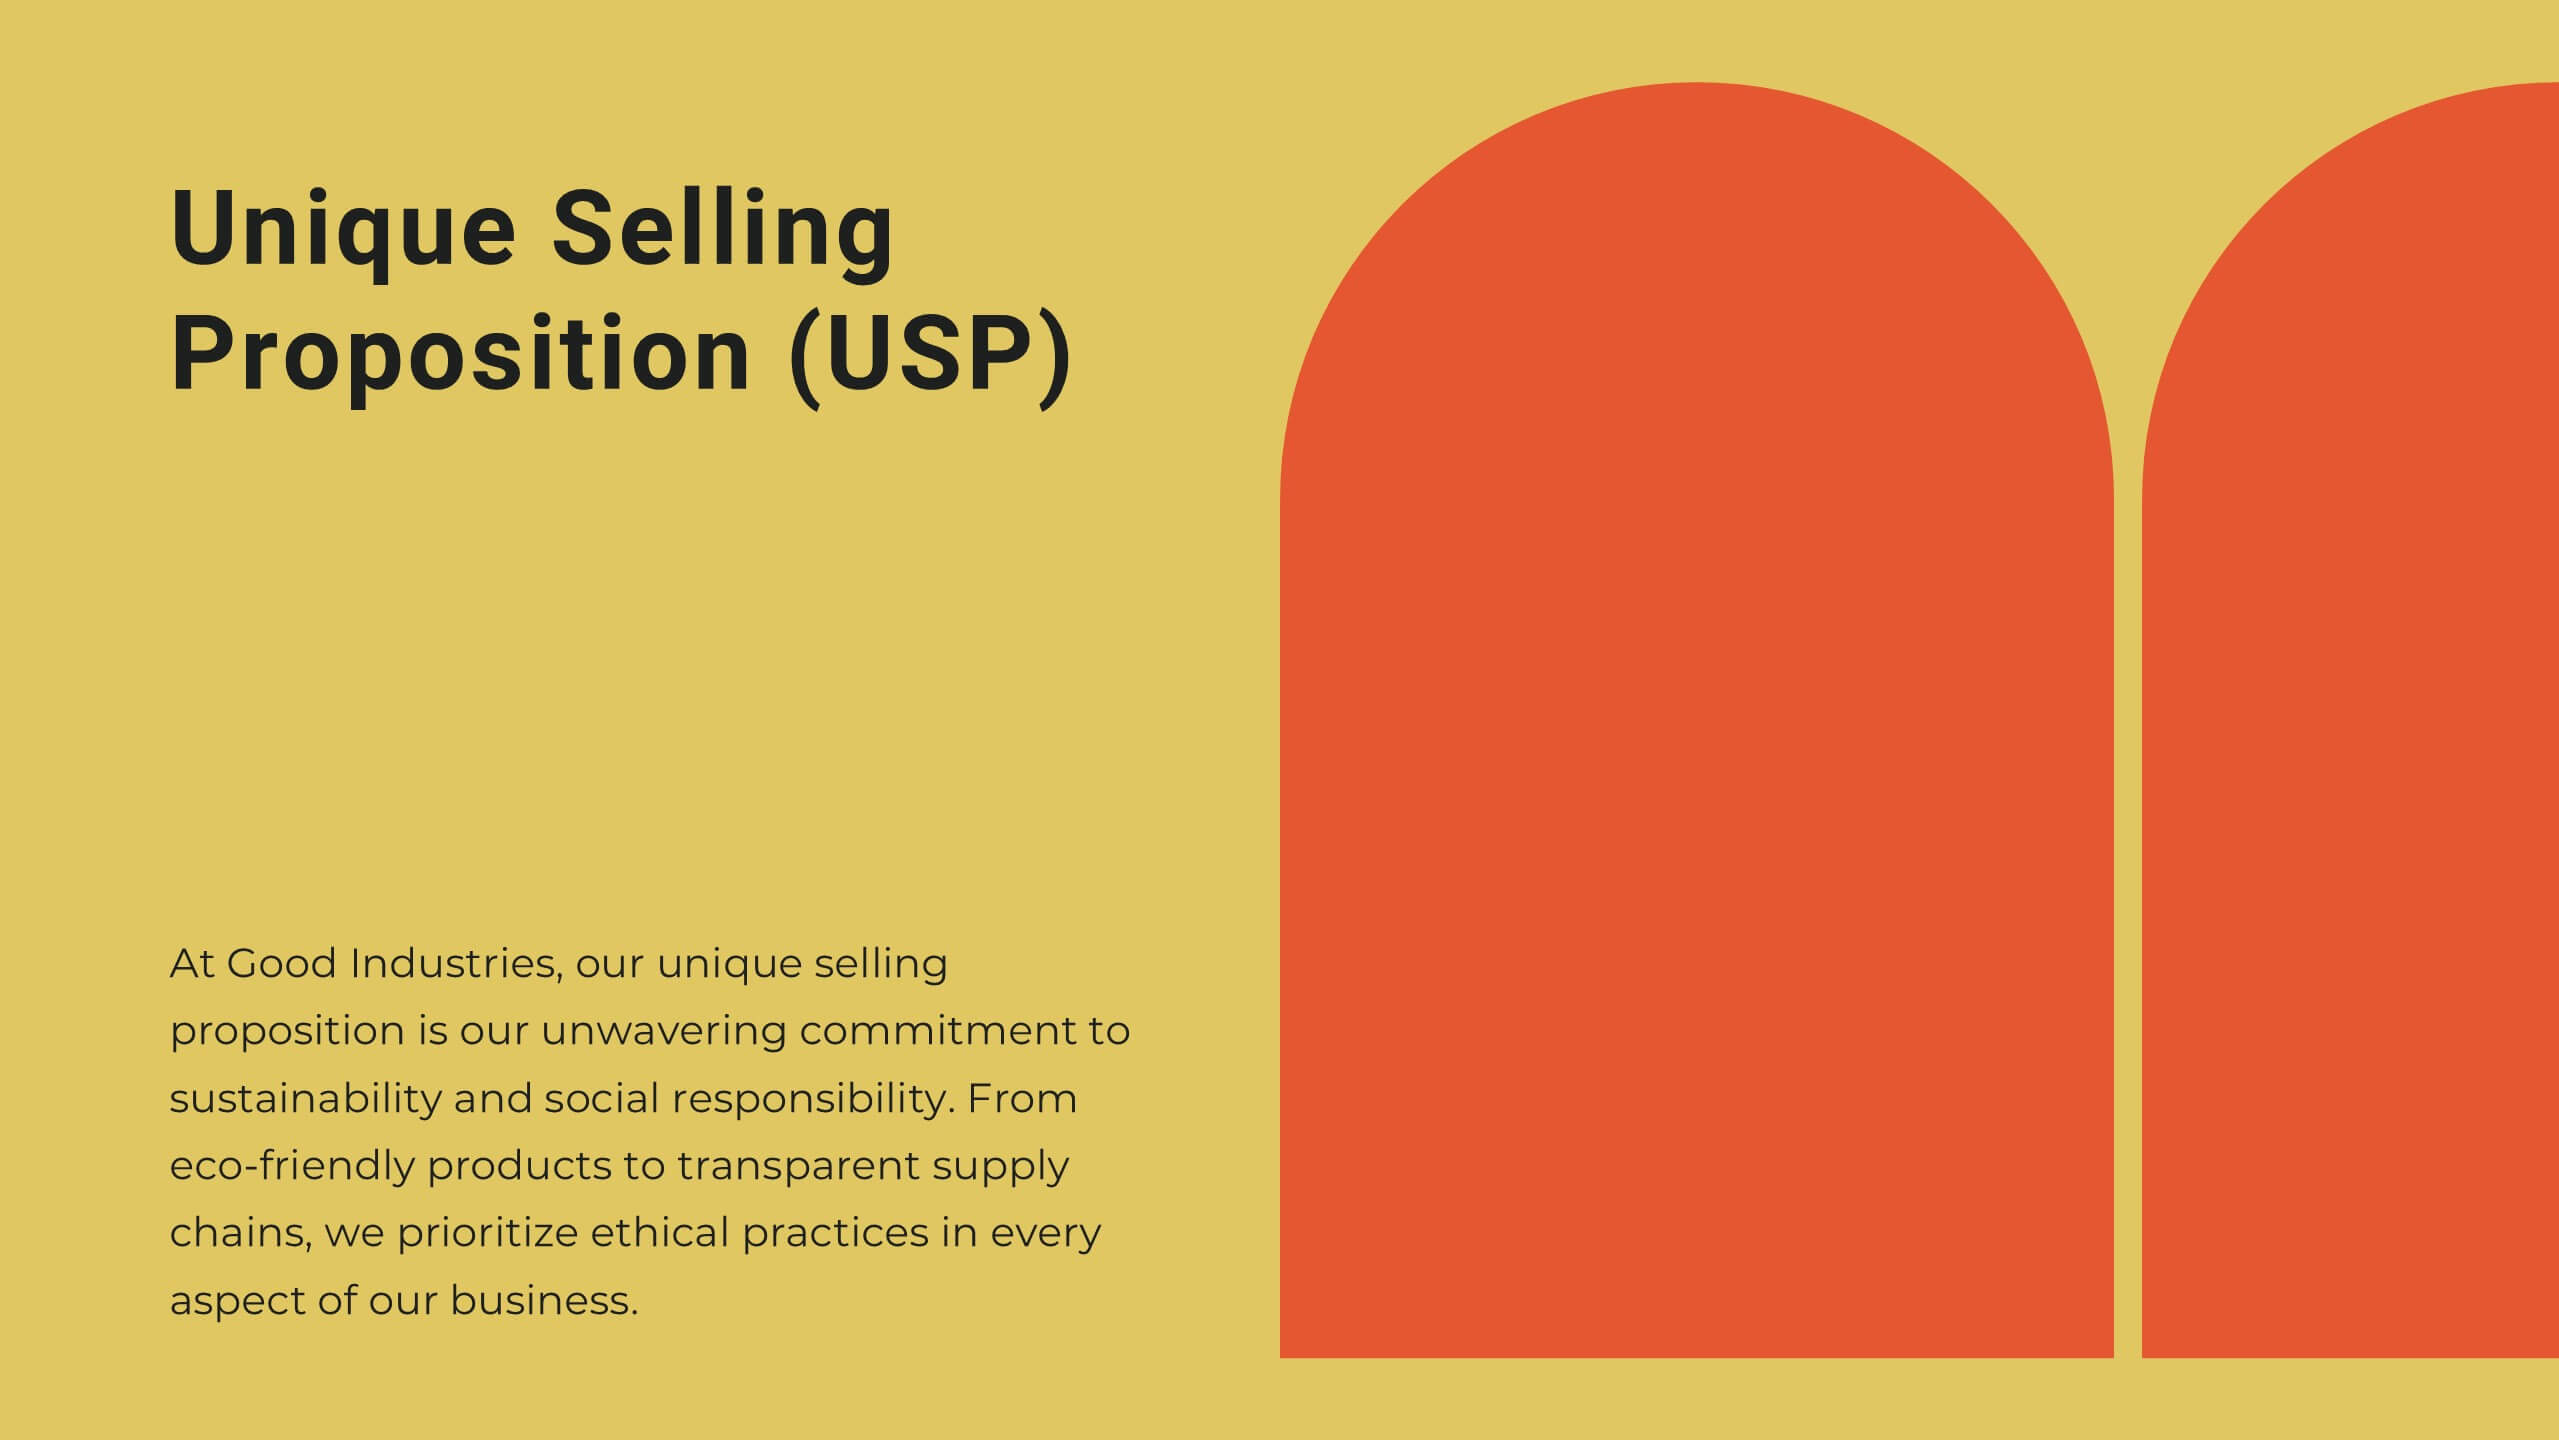
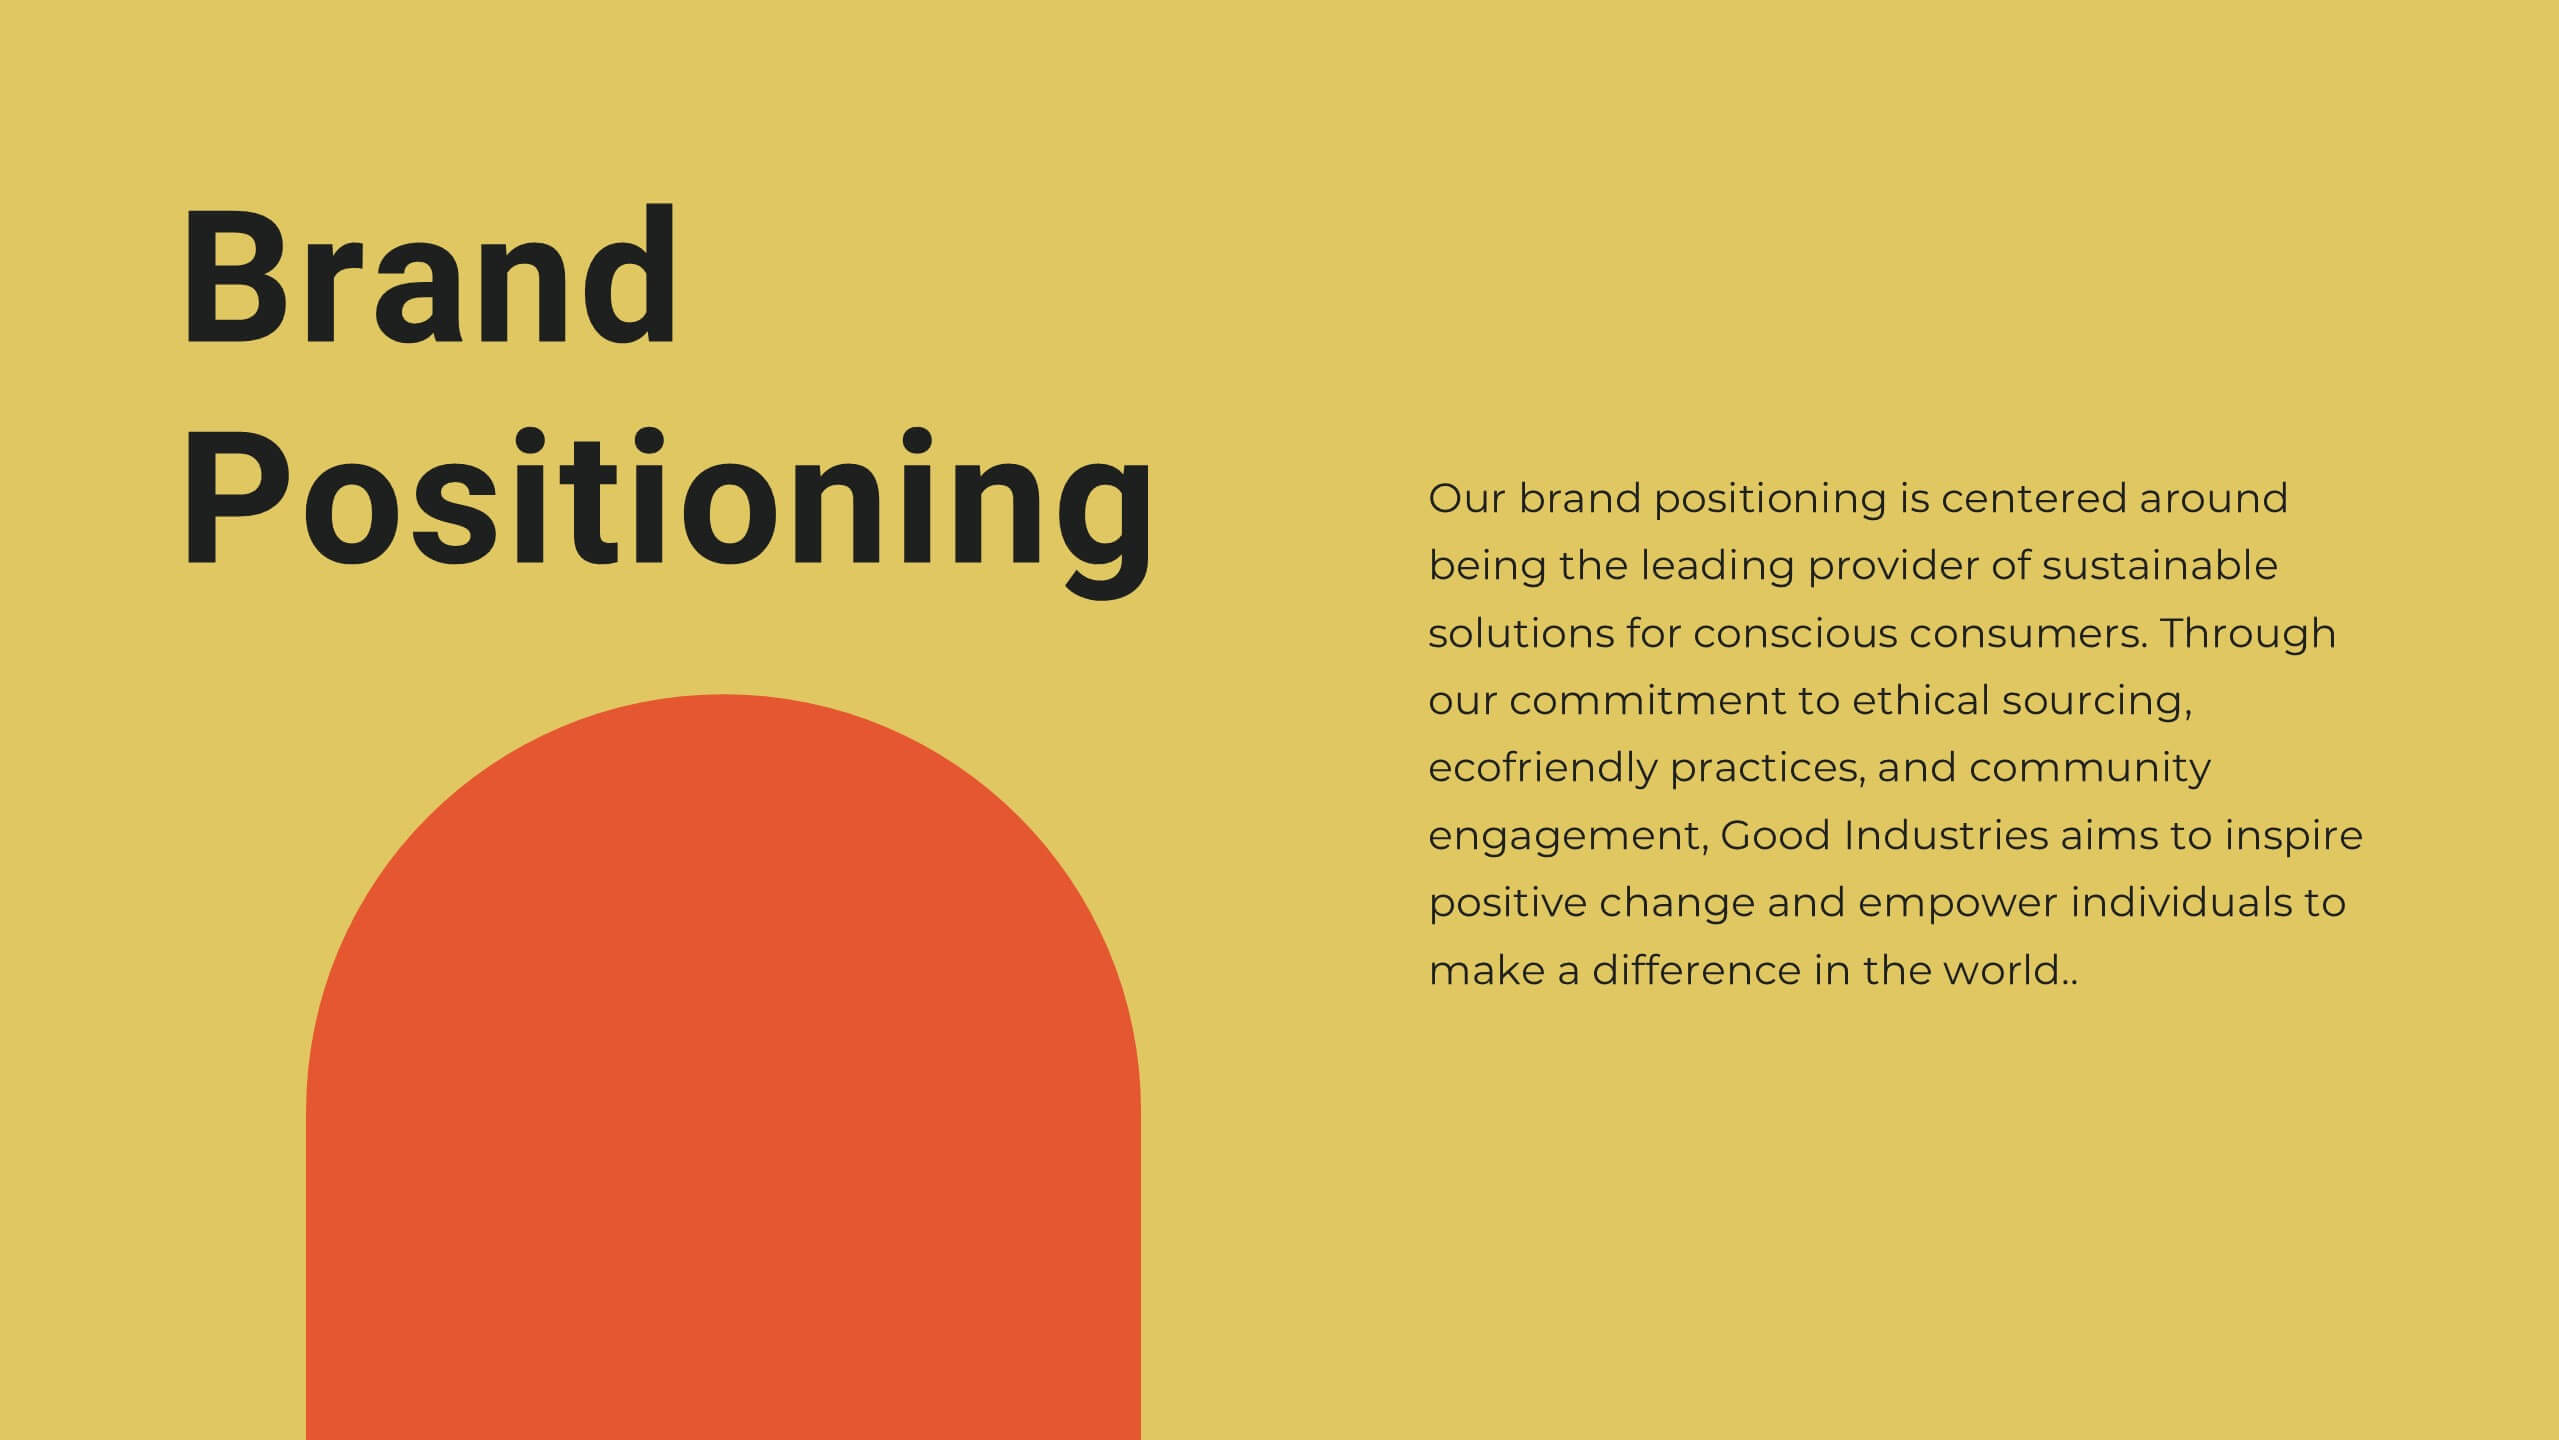
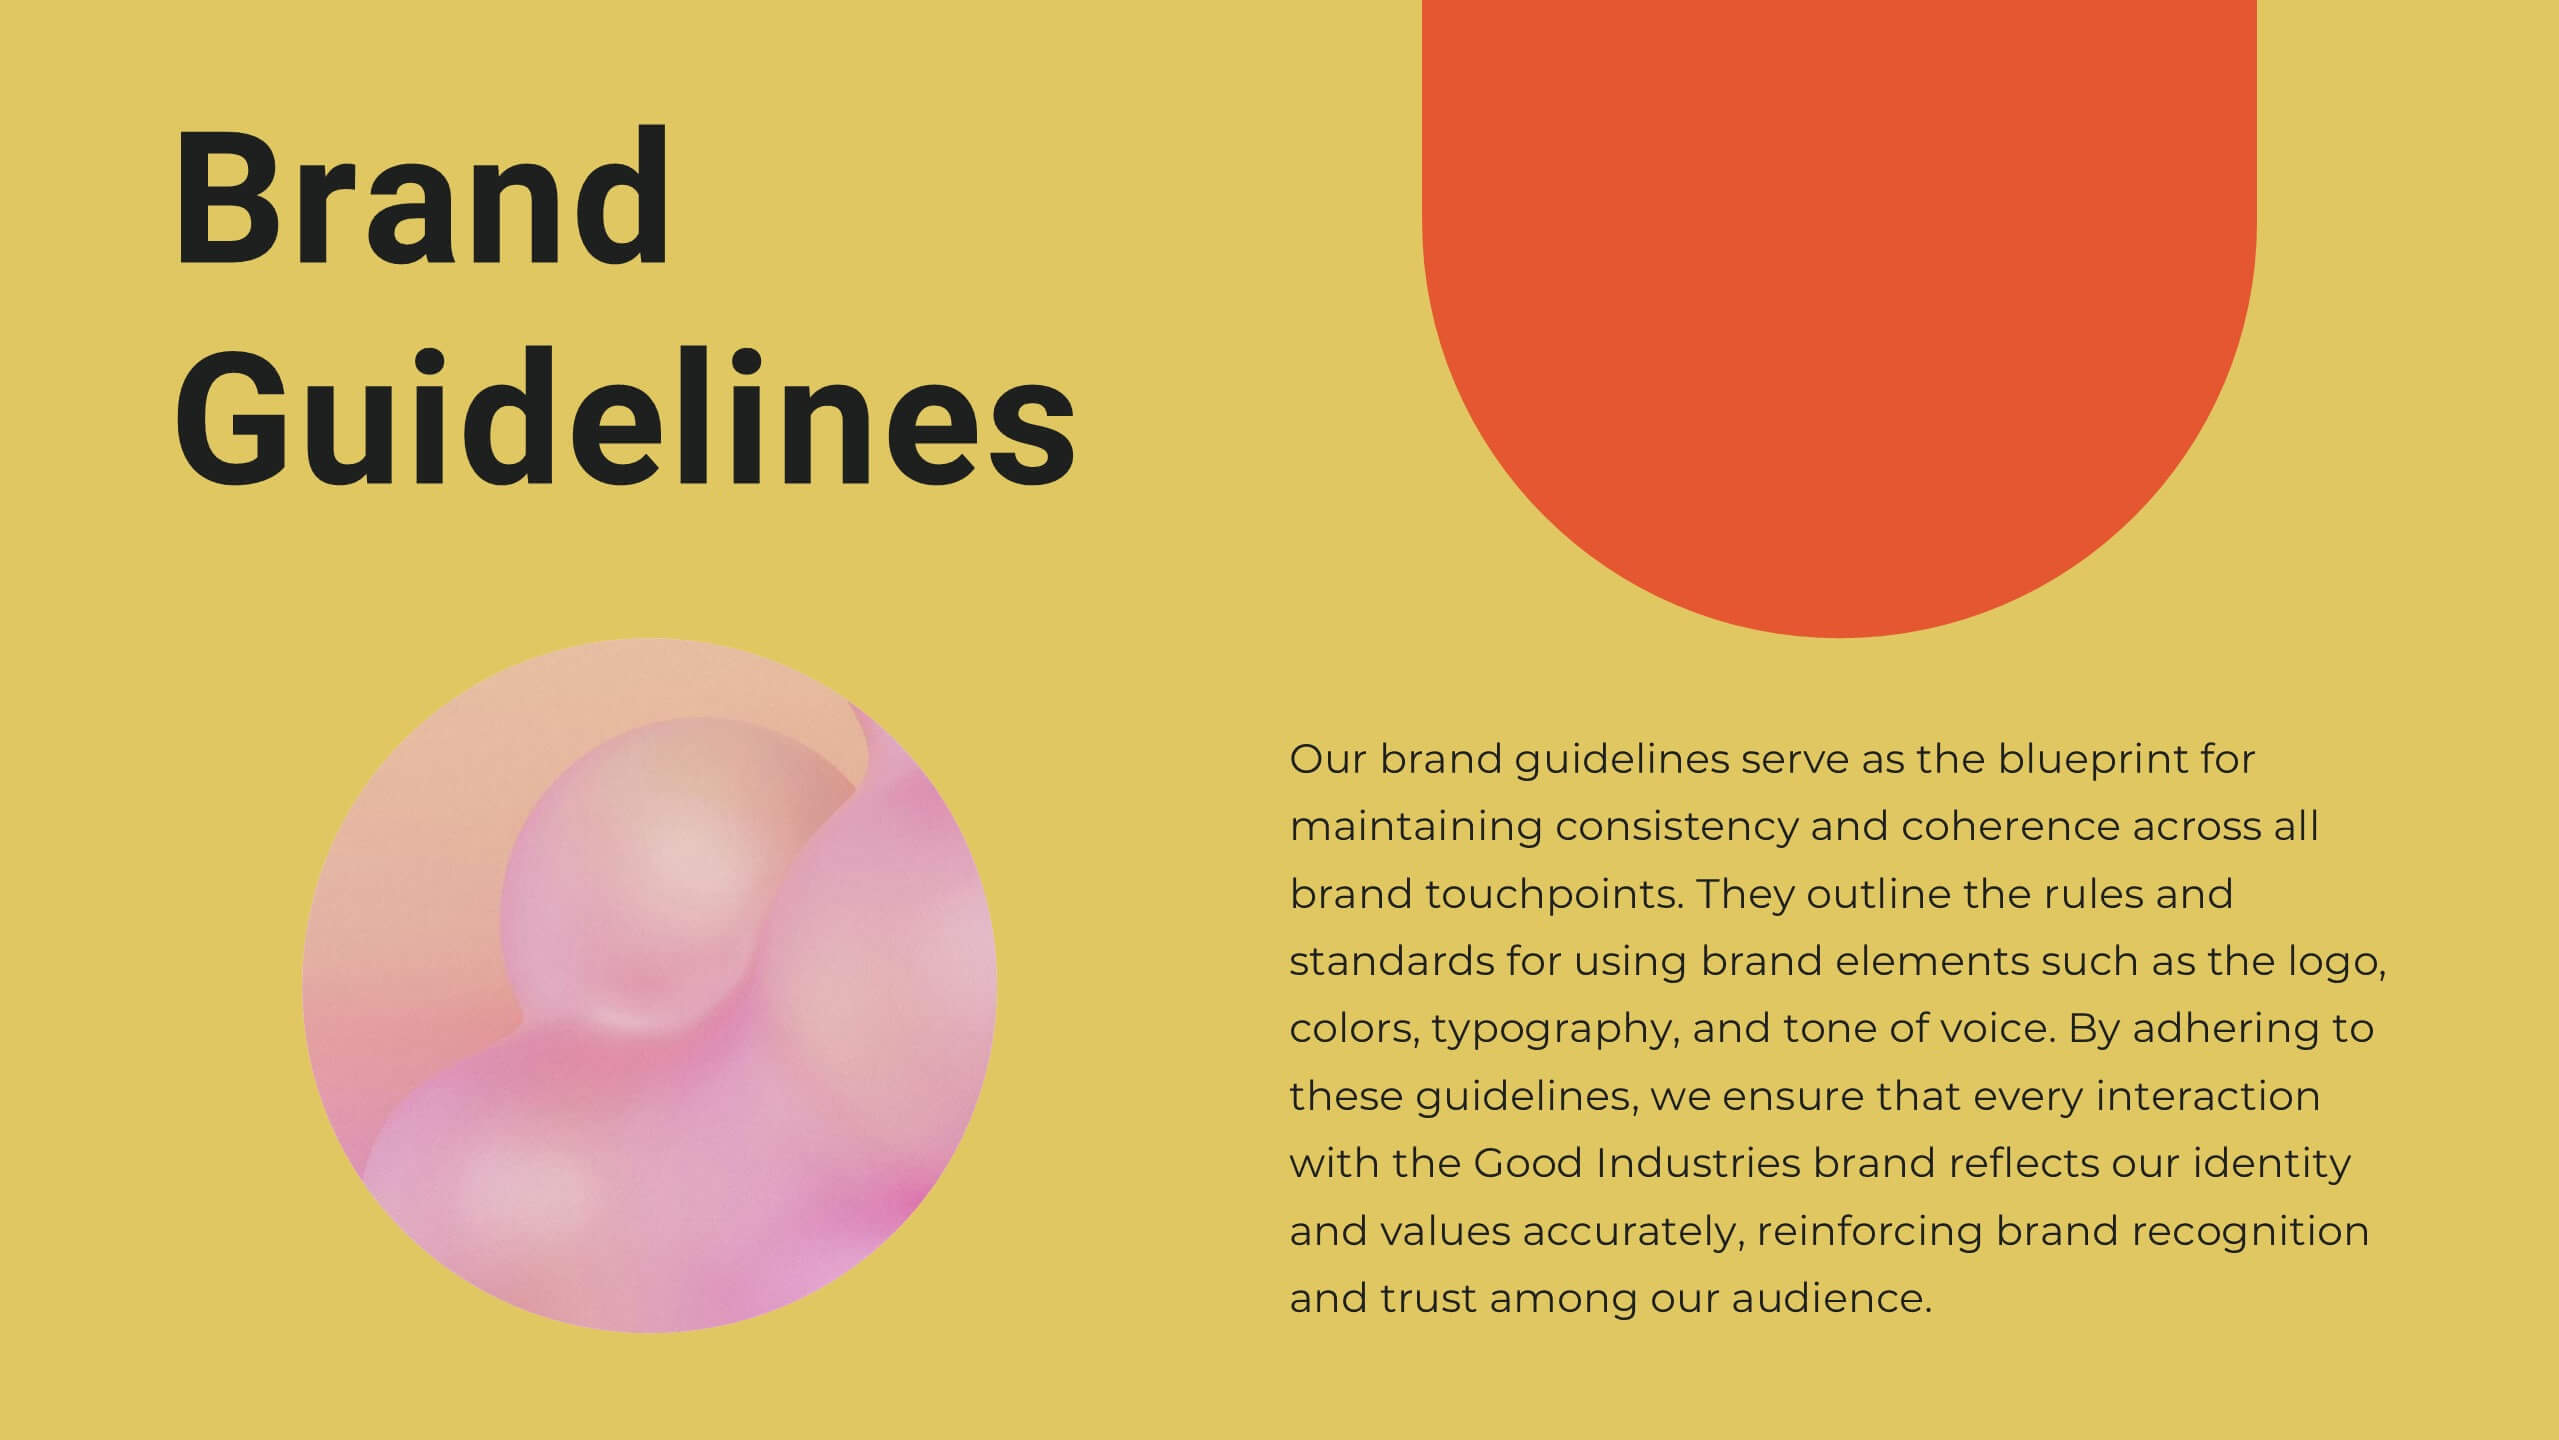
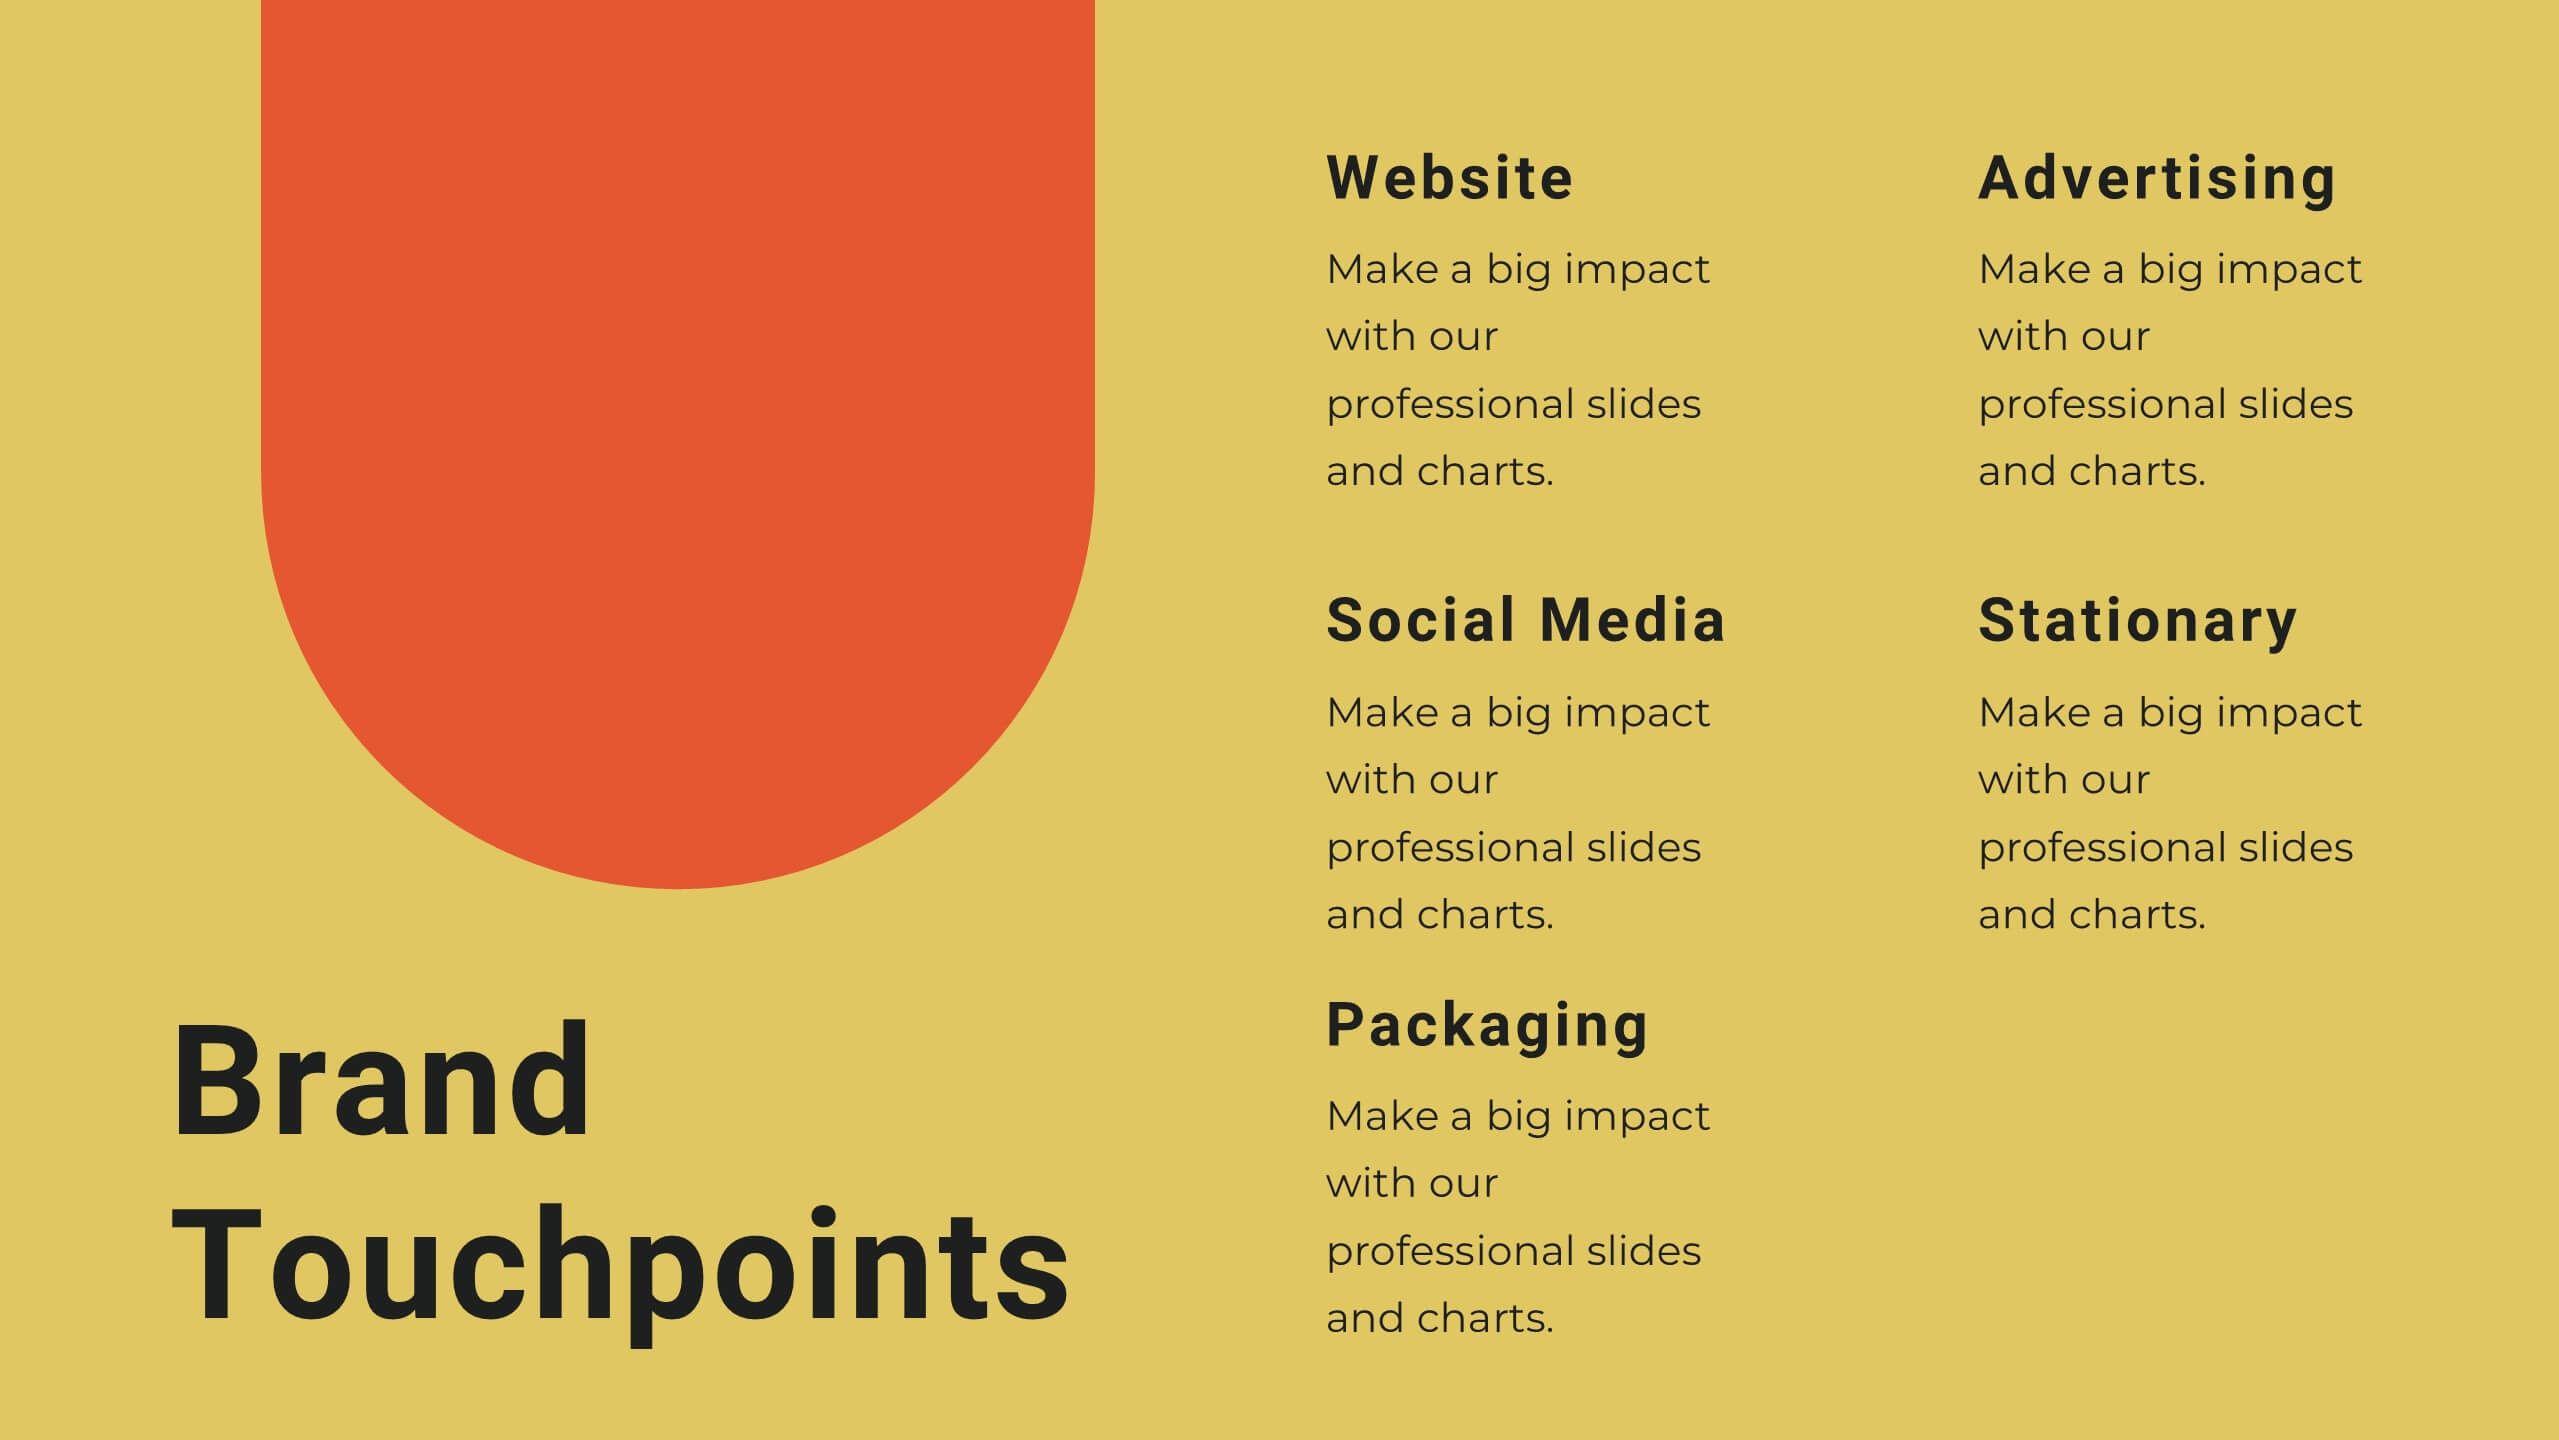
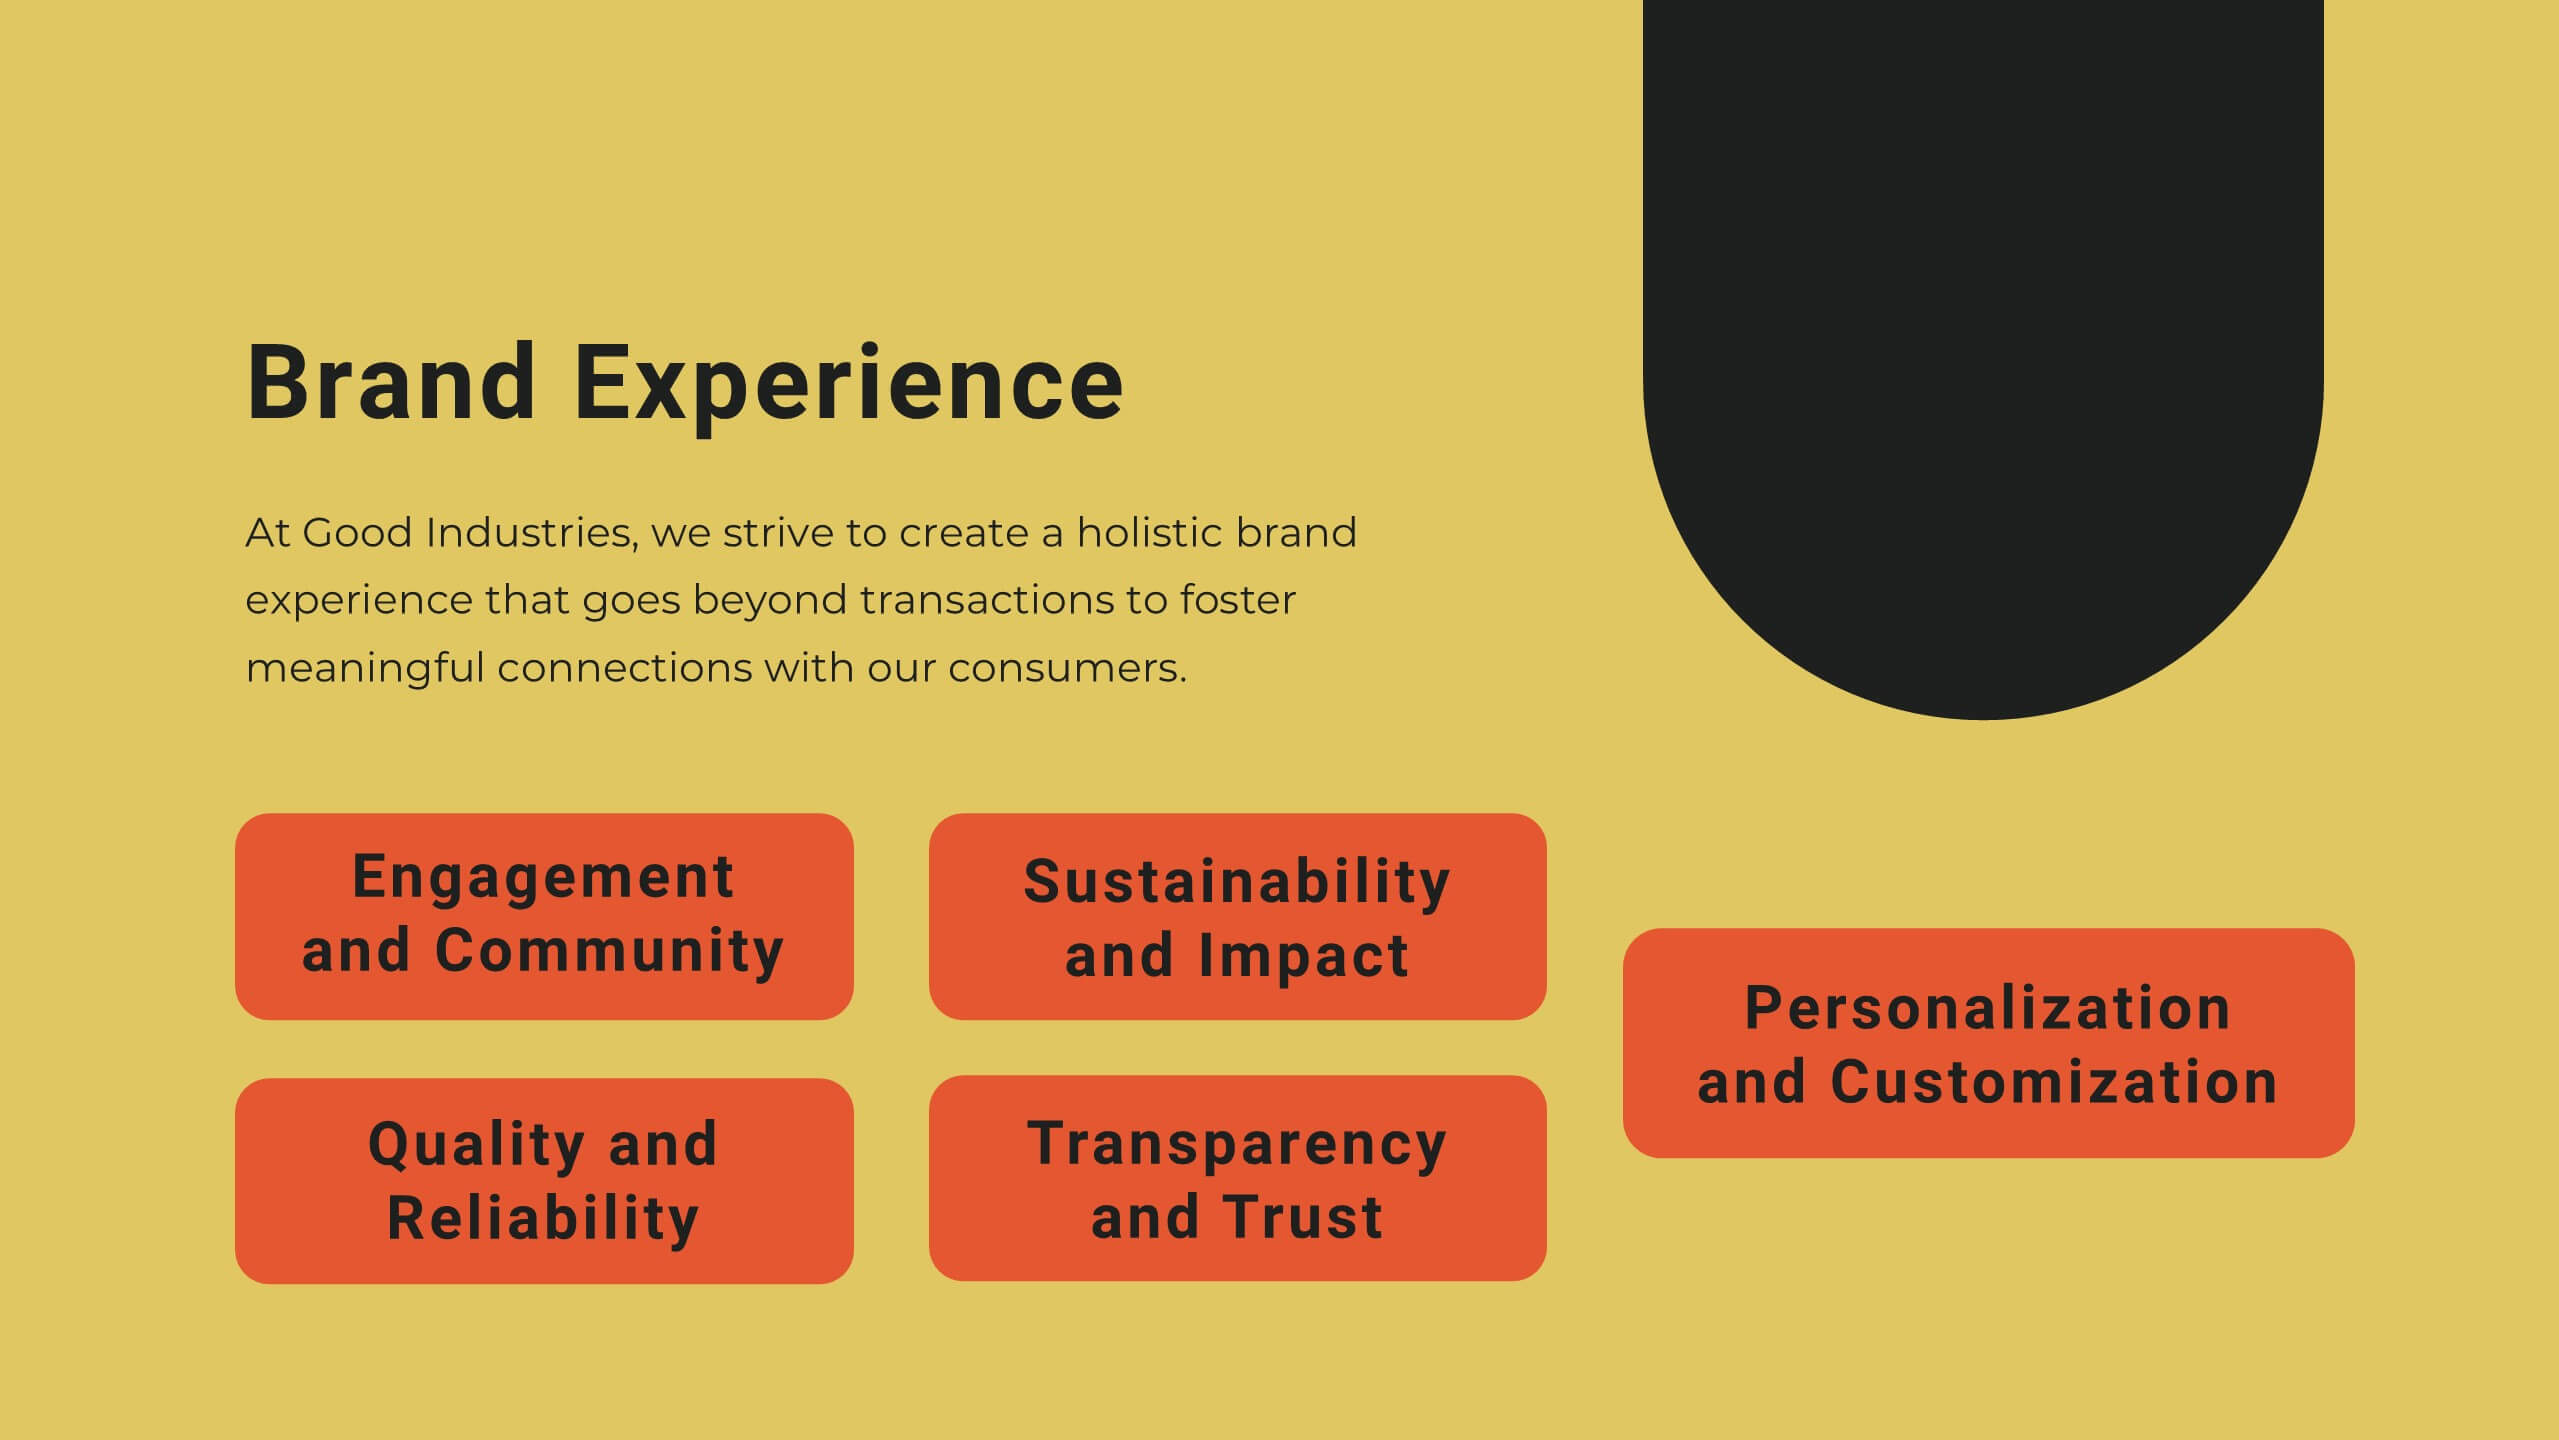
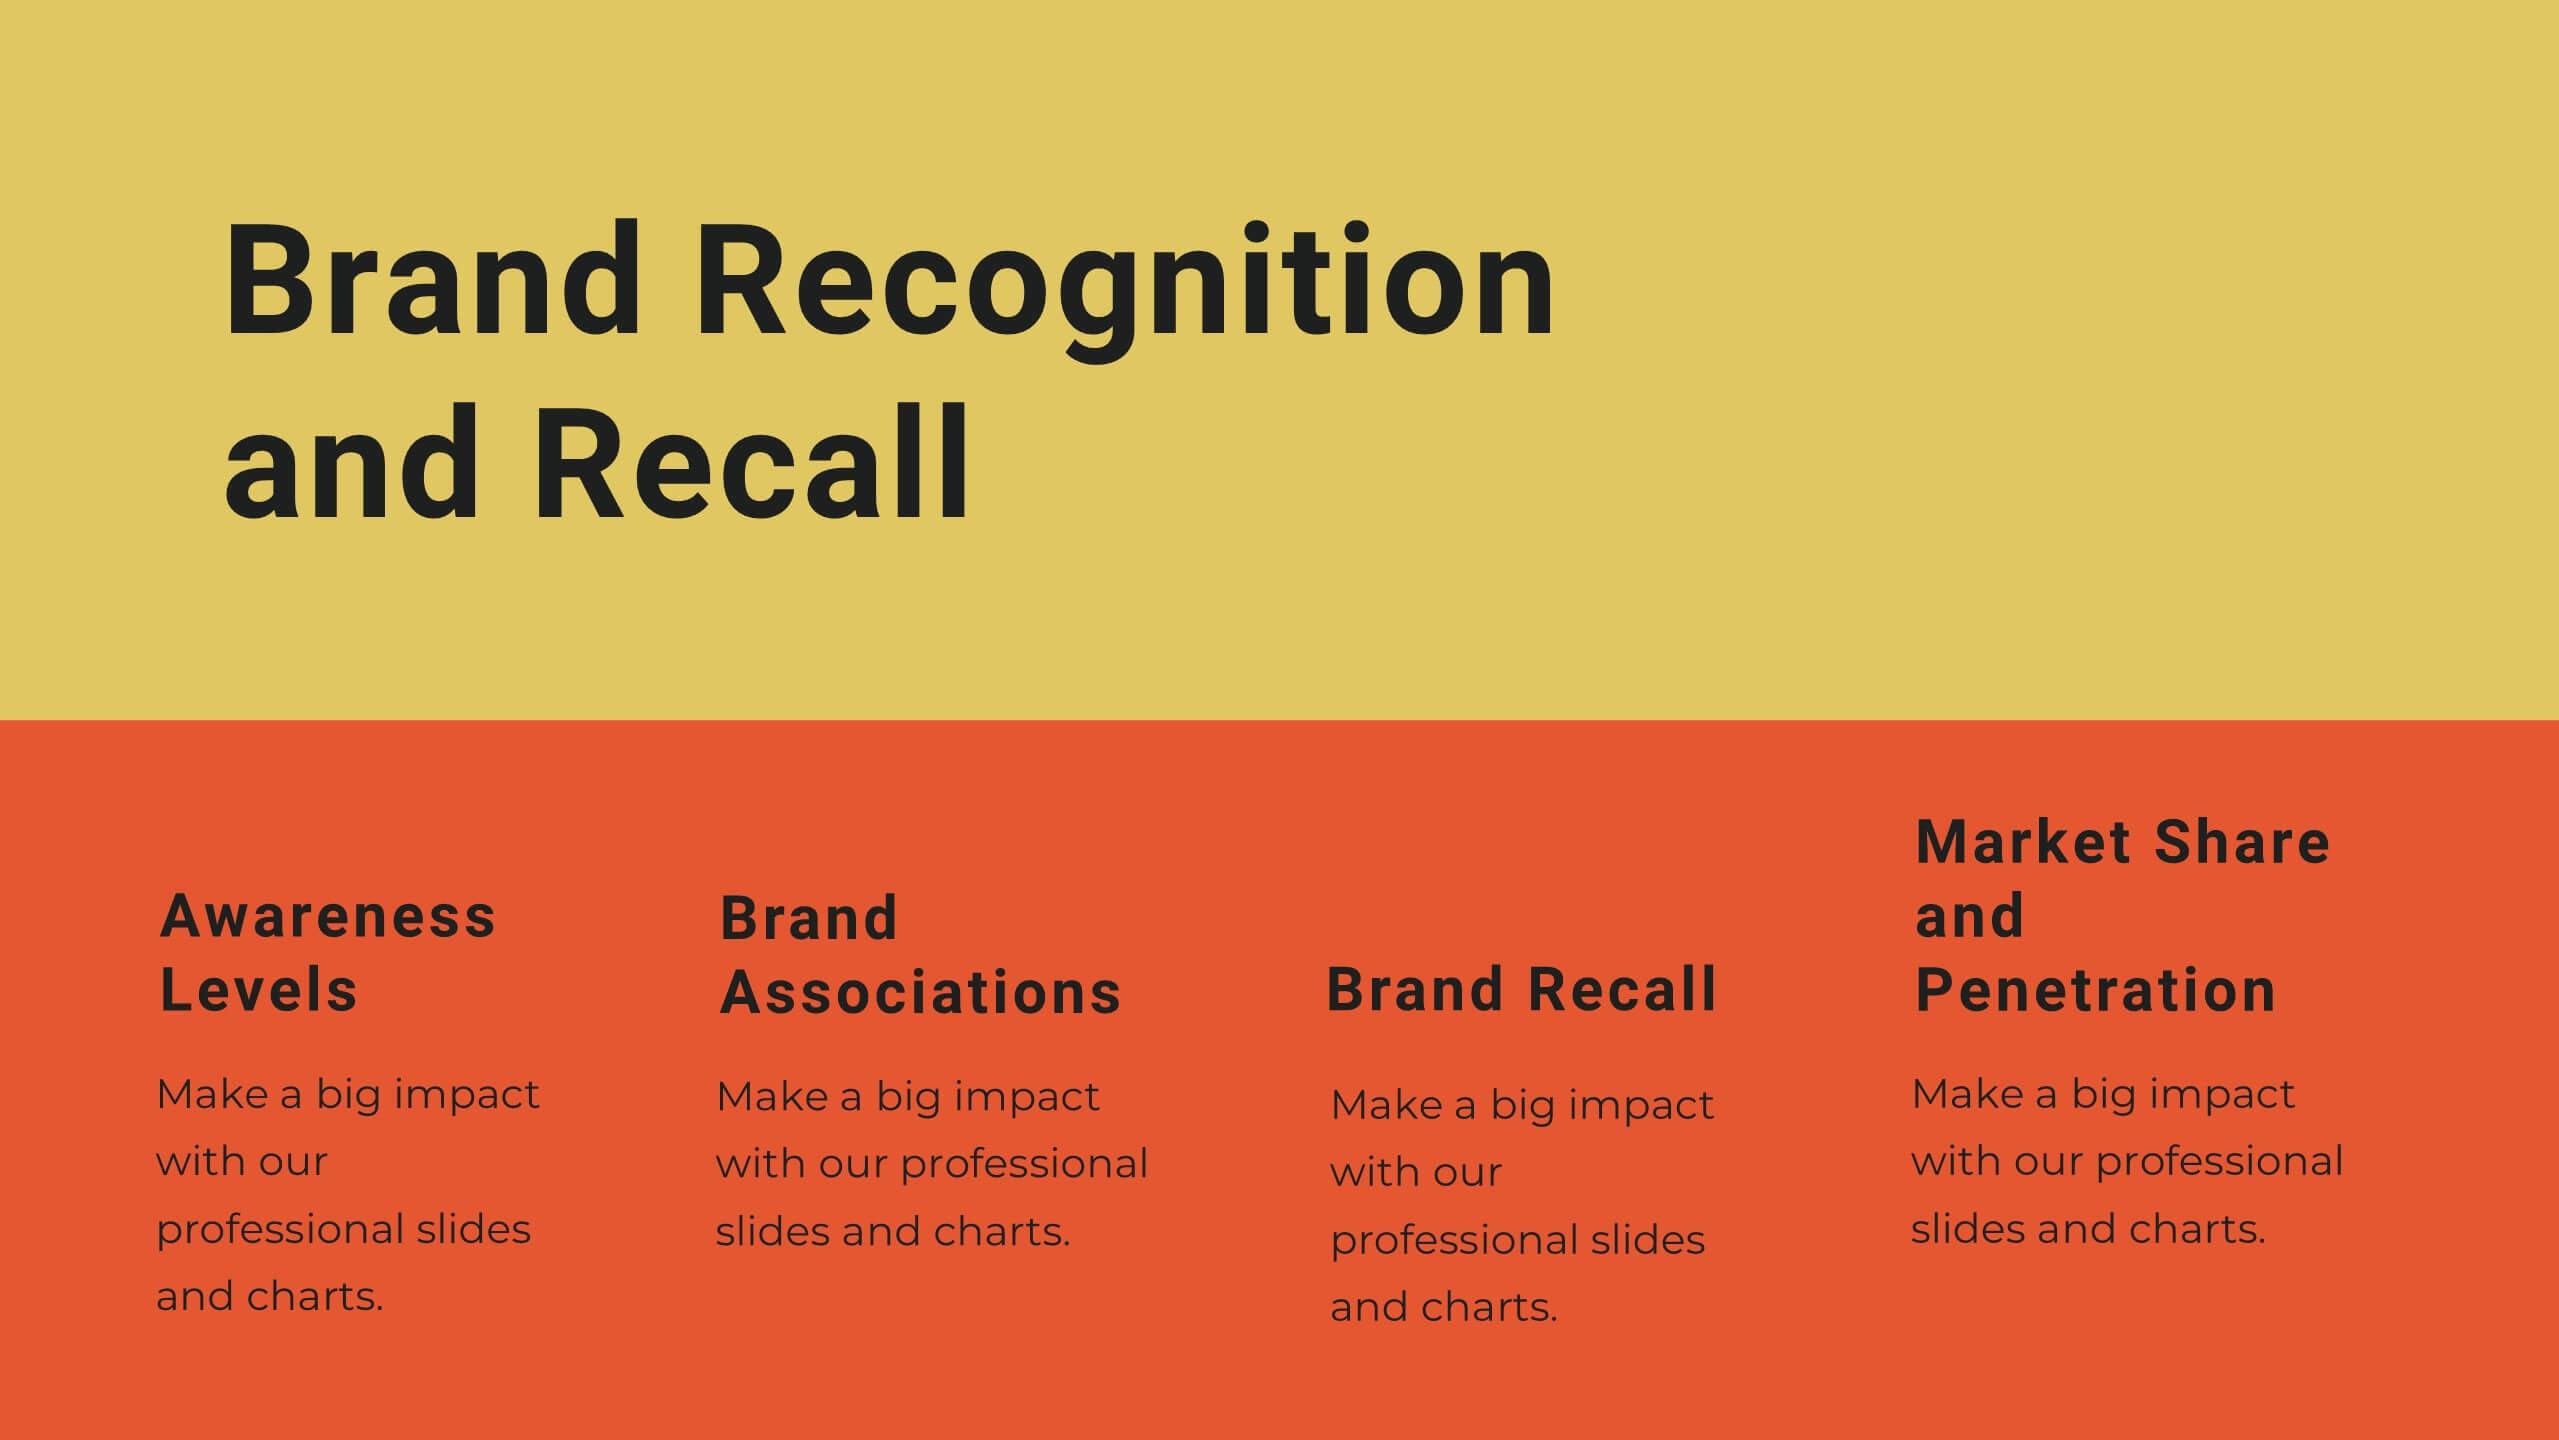
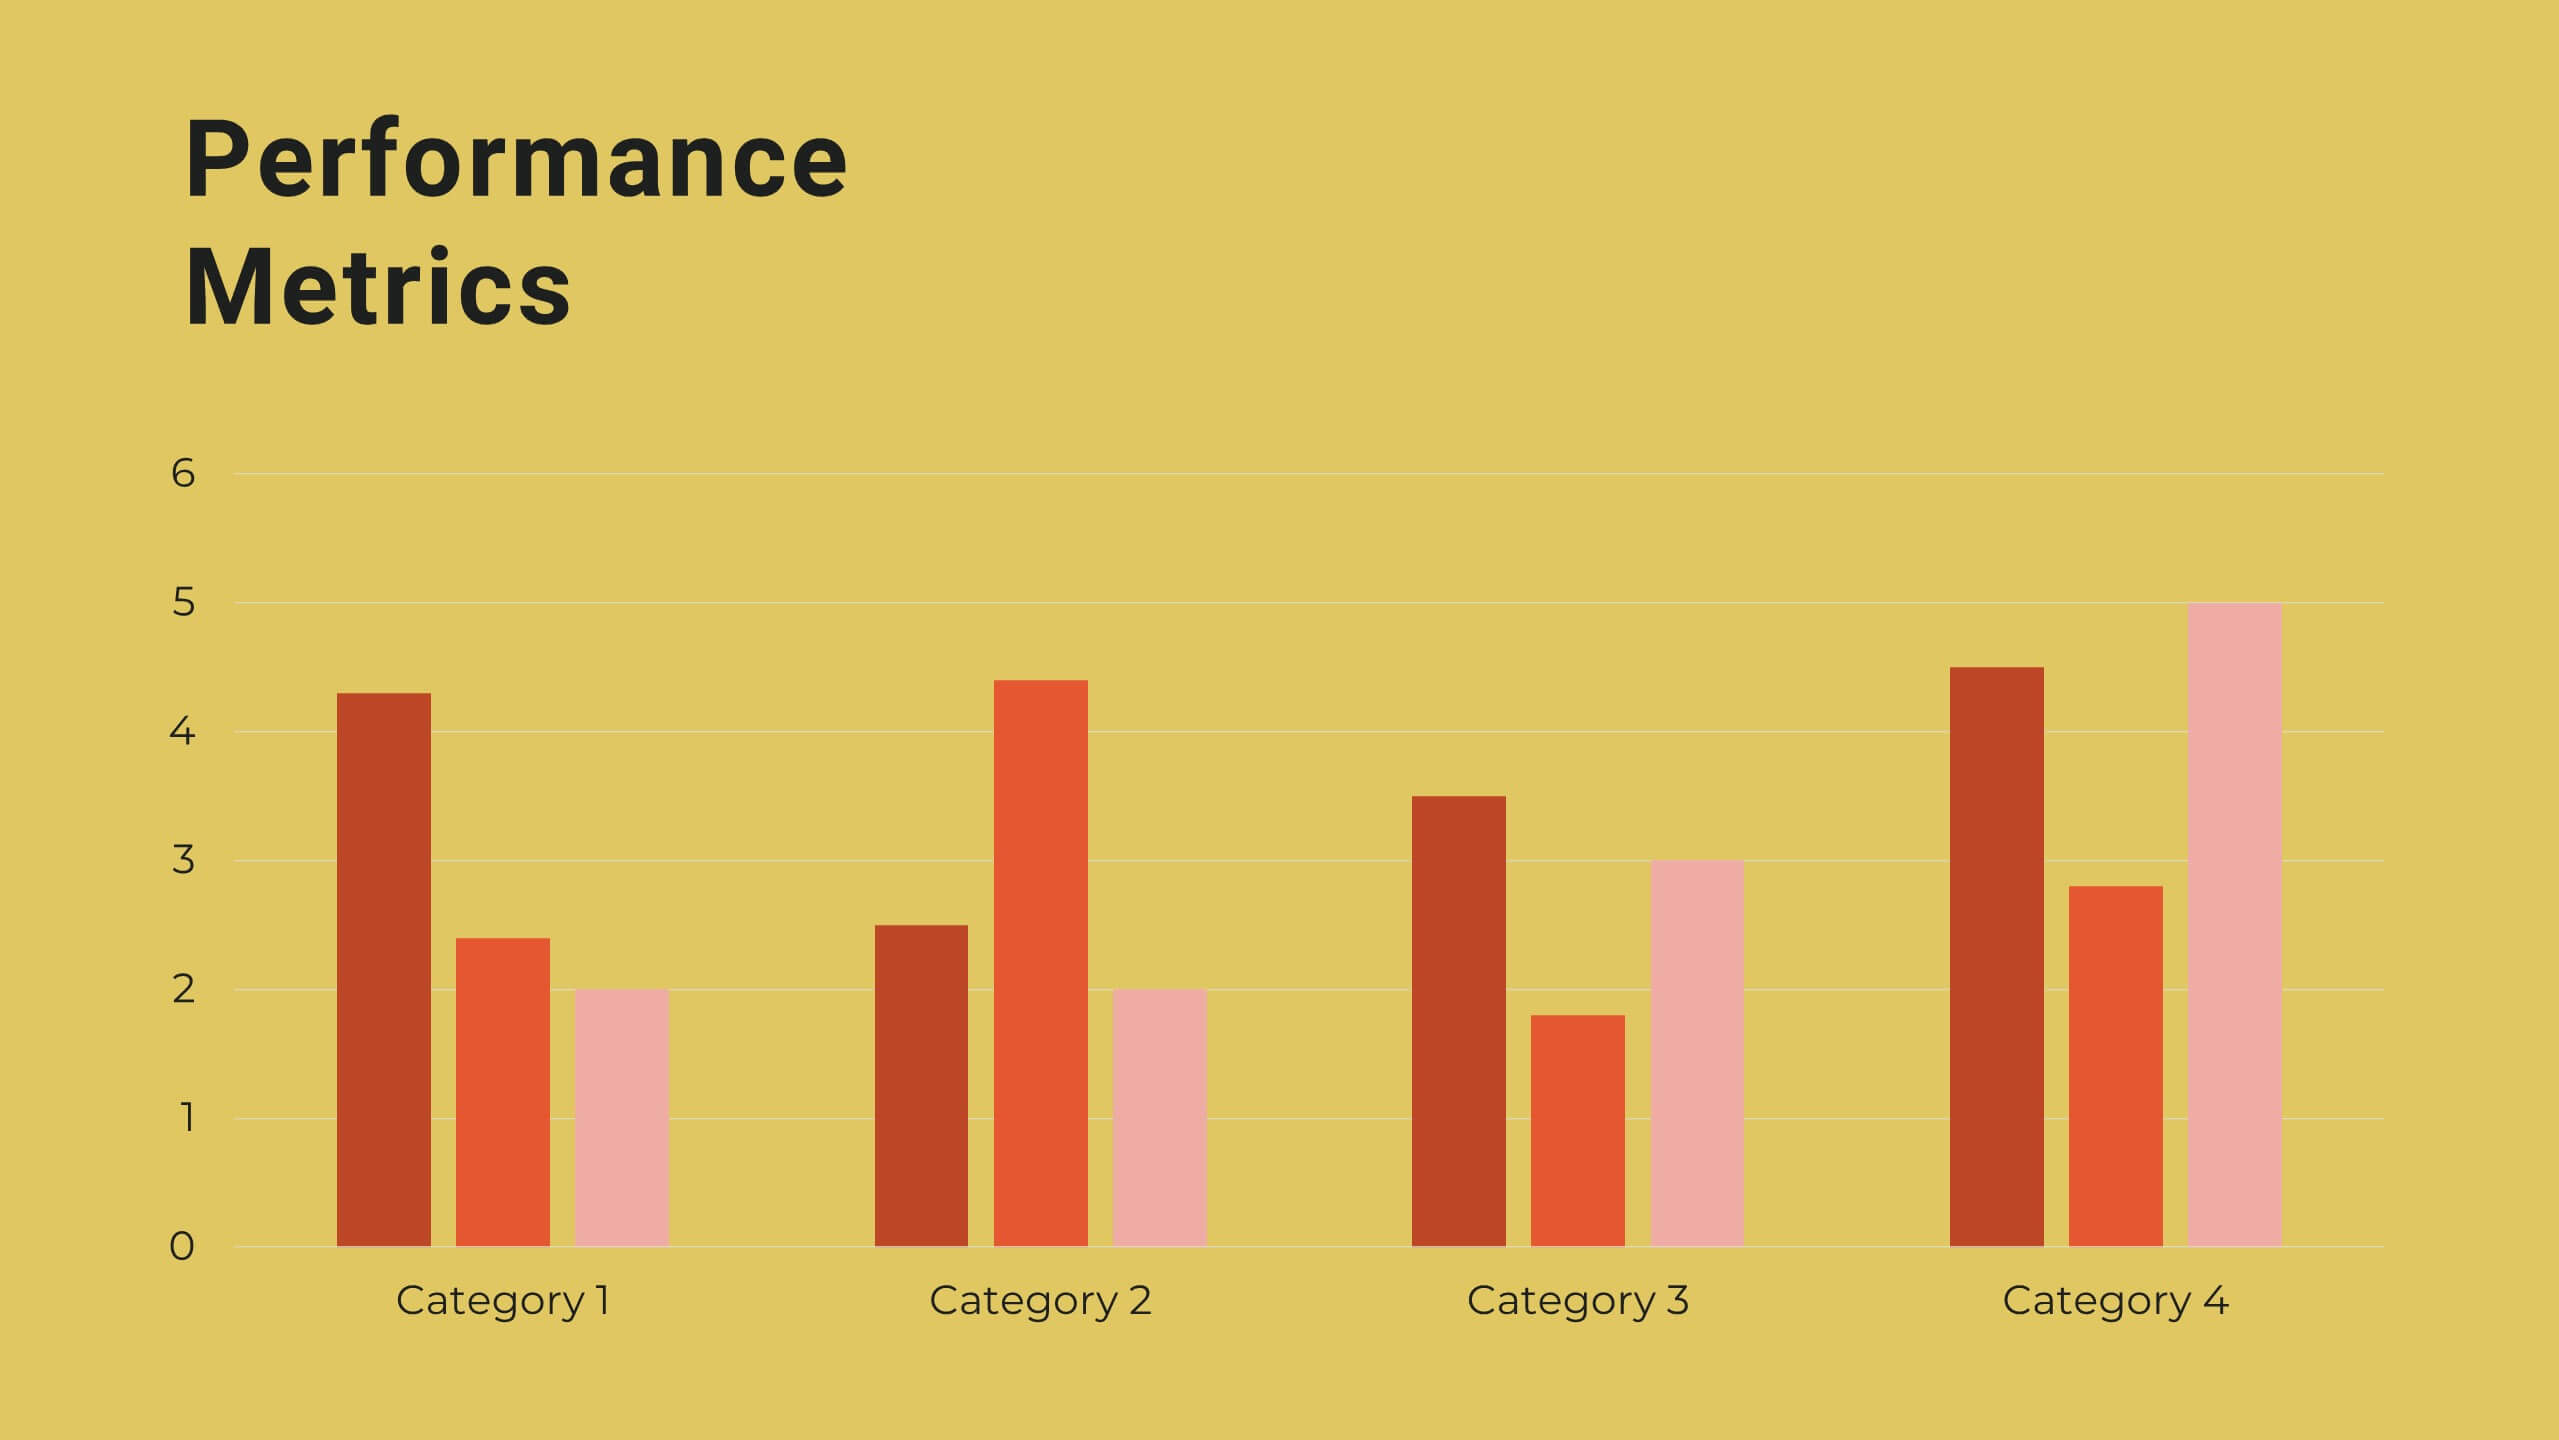
Yttrium Brand Strategy Report Presentation
Present your brand strategy with confidence using this vibrant, structured template! Covering brand identity, values, audience personas, and positioning, this template is perfect for crafting a compelling brand narrative. Fully customizable, it’s designed for seamless use in PowerPoint, Keynote, and Google Slides, making it an ideal tool for branding presentations.


10 slides
Adapting to Business Transformation Presentation
Guide your audience through change with this dynamic, step-by-step layout tailored for showcasing transformation journeys. The slide features a curved flow design with five customizable stages, perfect for visualizing digital shifts, organizational restructuring, or innovation roadmaps. Best for corporate strategists, consultants, and change managers. Fully editable in PowerPoint, Keynote, and Google Slides.


6 slides
Green Energy and Ecology Presentation
Ignite your audience’s curiosity with a clean, modern layout that brings eco-friendly ideas to life. This presentation helps you explain renewable energy concepts, sustainability benefits, and environmental impact in a clear, structured way that feels fresh and inspiring. Fully compatible with PowerPoint, Keynote, and Google Slides.


4 slides
Three-Part Triangle Model Presentation
Show the perfect balance between three core ideas with this dynamic triangular layout. Designed for clarity and structure, it’s ideal for visualizing strategies, models, or relationships in a professional way. Fully editable and compatible with PowerPoint, Keynote, and Google Slides for effortless customization and polished results.


6 slides
SEO Services Infographic
Search Engine Optimization services are specialized strategies and practices aimed at improving a website's visibility and ranking in search engine results pages. The goal of SEO is to increase organic traffic to a website by optimizing various elements, such as content, keywords, website structure, and more. This template is designed to provide an overview of the different aspects of SEO that the agency specializes in. This Infographic is a valuable tool for SEO agencies to showcase their expertise, services, and track record to potential clients. This template is compatible with Powerpoint, Keynote, and Google Slides.


6 slides
Product Development Cycle Presentation
Illustrate the full journey of bringing a product to market with this Product Development Cycle slide. The circular flow diagram outlines five key phases, making it perfect for showcasing stages like ideation, prototyping, testing, and launch. Each section includes editable icons and placeholder text to highlight insights or key actions. Fully compatible with PowerPoint, Keynote, and Google Slides for smooth customization.


4 slides
Cost Comparison Analysis Chart Presentation
Turn your price evaluations into something visually compelling with this sleek and modern layout. Perfect for showcasing product features, service packages, or market comparisons, it simplifies decision-making with a clear side-by-side design. Fully editable and compatible with PowerPoint, Keynote, and Google Slides for effortless customization.


4 slides
Startup Business Plan Executive Overview Presentation
Present your startup vision with this bold, rocket-themed executive overview template. Perfect for outlining growth strategies, milestones, and launch plans, it combines vibrant visuals with a clean layout. Fully editable in Canva, PowerPoint, and Google Slides, it’s ideal for inspiring investors and stakeholders with a clear, professional business roadmap.


7 slides
International Finance Infographic
International finance is a branch of economics and financial studies that deals with monetary interactions that occur between two or more countries. Dive into the intricate world of finance with our visually captivating international finance infographic. This template is your passport to understanding the complexities and opportunities in the global financial landscape. With this template you will be able to analyze the dynamics of exchange rates, foreign investment, and how these factors influence global economics. This infographic is crafted to provide a holistic view of the world of finance.


5 slides
Population Segmentation by Demographic Factors Presentation
Break down audience demographics with this segmented infographic slide. Featuring a vertical figure illustration divided into color-coded percentage bars, it’s ideal for showcasing traits like age, gender, or location. This layout offers a clear visual summary, making it perfect for reports, marketing briefs, or investor presentations. Fully editable in Canva.


5 slides
How to Prevent Cyberbullying Infographics
Cyberbullying is a serious issue that can have detrimental effects on individuals' mental and emotional well-being. These vertical infographics provide essential information and tips for preventing cyberbullying. These are designed to raise awareness about the issue and educate individuals on how to effectively address and prevent cyberbullying incidents. The infographics feature a visually appealing design with attention-grabbing colors, icons, and illustrations. The engaging visuals are intended to capture the attention of the audience and convey the seriousness of the topic. The infographics offer practical tips and strategies for preventing cyberbullying.


7 slides
Table Infographic Presentation Template
A Table Infographic is a table format used to organize and present data or information in a structured way. It is often used to present numerical data or statistics in an easy-to-understand format, and can be used in a variety of settings, such as in business, finance, or healthcare. This template is designed to help in organizing your information and make it more understandable. This is compatible with Powerpoint, Keynote, and Google Slides, so you can use it on any device. Use this table infographic to present numerical data or statistics in an easy to understand manner for your audience.


6 slides
Europe Region Overview Presentation
Bring your regional insights to life with a modern, minimal map layout that highlights key countries and data across Europe. Ideal for showcasing economic trends, business performance, or demographic overviews, this clean design ensures clarity and engagement. Fully compatible with PowerPoint, Keynote, and Google Slides for seamless editing.


5 slides
Yearly Employee Performance Review Presentation
Celebrate your team’s progress with a modern, data-rich design that’s clear, visual, and professional. This template makes it easy to present yearly performance metrics, individual achievements, and growth comparisons through engaging charts and infographics. Perfect for annual reports and reviews. Compatible with PowerPoint, Keynote, and Google Slides for effortless editing.


4 slides
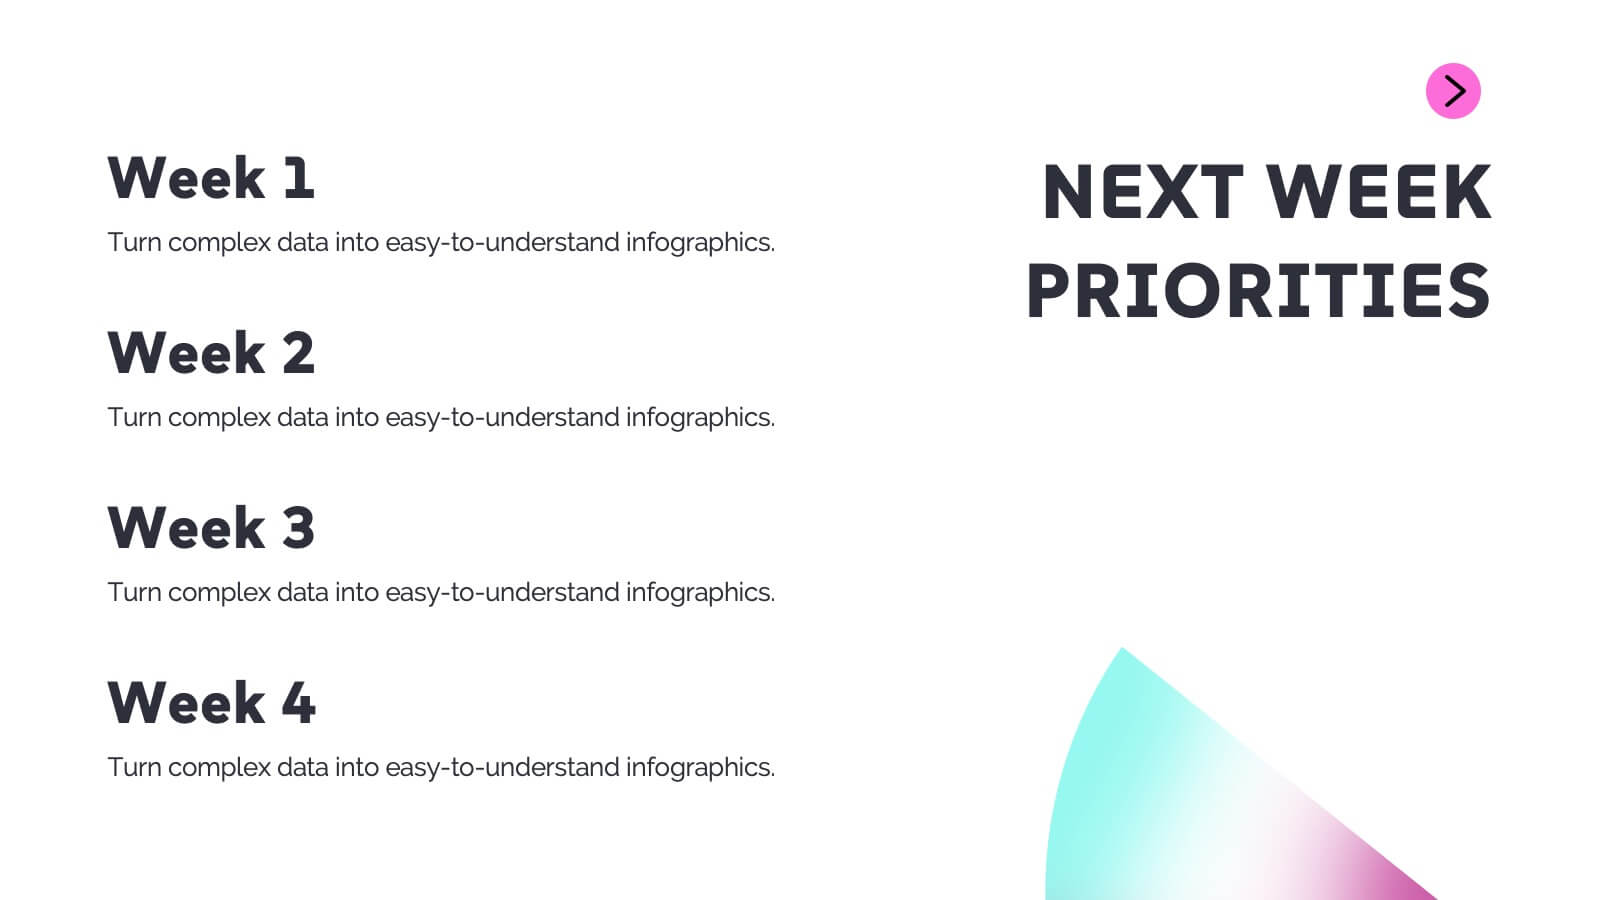
90-Day Success Plan for New Hires Presentation
Set your team up for success with this 90-Day Success Plan for New Hires Presentation. This template is perfect for onboarding workflows, outlining key milestones at 30, 60, and 90 days. Help managers and HR professionals communicate expectations clearly and track new employee progress. Fully editable in PowerPoint, Keynote, and Google Slides.


6 slides
Growth Through Lifelong Learning Presentation
Visualize personal or organizational development with this creative lifelong learning slide. Featuring a human head silhouette and puzzle piece graphics, it's perfect for illustrating stages of learning, training programs, or growth mindset principles. Fully editable in PowerPoint, Keynote, and Google Slides—ideal for educators, coaches, or corporate development professionals.